


Features
- 10 Unique Slides
- Fully editable and easy to edit in Microsoft Powerpoint, Keynote and Google Slides
- 16:9 widescreen layout
- Clean and professional designs
- Export to JPG, PDF or send by email


Do you have any questions?
Recommend


10 slides
Social Media Marketing Growth Presentation
Boost your social media strategy with this dynamic infographic template! Perfect for illustrating marketing growth, engagement tactics, and content performance, it features an intuitive flow that simplifies complex data. Ideal for presentations to teams and clients, it’s fully customizable and works seamlessly with PowerPoint, Keynote, and Google Slides.


7 slides
Strategic Solution Framework
Present your business strategies clearly with this strategic solution framework slide. Designed with a semi-circular puzzle diagram, it’s perfect for showcasing interconnected solutions, phased plans, or collaborative initiatives. Ideal for business meetings, consulting proposals, and corporate strategy sessions. Fully editable and compatible with PowerPoint, Keynote, and Google Slides.


7 slides
Mockup Infographic
Elevate your presentation game with this versatile collection of mockup templates, designed to showcase your digital projects in a sleek, professional manner. Each template features a clean and modern design, highlighting your work on various digital devices including smartphones, tablets, and computer screens. With a focus on simplicity and visual appeal, these mockups provide the perfect canvas for demonstrating websites, apps, and other digital products. The well-organized layouts allow for easy customization, letting you quickly insert your own images and text to match your project’s needs. Ideal for professionals in web development, app design, or digital marketing, this collection helps convey the functionality and aesthetics of your digital creations effectively. Utilize these mockups in client presentations, marketing materials, or portfolio showcases to give your audience a realistic preview of your digital solutions.


5 slides
RACI Responsibility Assignment Matrix Presentation
Streamline project management with our RACI Responsibility Assignment Matrix presentation template. This tool is designed to clarify team roles and responsibilities, ensuring everyone knows their tasks and duties. The template uses a color-coded system for quick reference, perfect for project managers and team leads. It's compatible with PowerPoint, Keynote, and Google Slides, making it a versatile choice for any professional setting.


6 slides
Construction Project Infographic
Get ready to elevate your presentations with dynamic visuals and clear data! This Construction Project Infographic template is designed to transform complex construction data into engaging, easy-to-understand graphics. Whether you're presenting project timelines, resource allocations, or safety statistics, this template has you covered. It includes a variety of charts, icons, and illustrations that make your data pop. Each slide is crafted to ensure your message is conveyed effectively, keeping your audience engaged from start to finish. Perfect for construction managers, architects, and project planners, this template is compatible with PowerPoint, Keynote, and Google Slides, offering flexibility and ease of use. Don't miss out on impressing your stakeholders with visually stunning and informative presentations. Boost your project's visibility and communication efficiency with this versatile template today!


6 slides
Business Risk Mitigation Framework Presentation
Visualize and communicate your risk management strategies with this two-part puzzle-style framework. Ideal for showcasing problems and solutions, action plans, or risk-response workflows. Clean and modern layout enhances clarity. Fully editable in PowerPoint, Keynote, and Google Slides—perfect for business continuity planning, operational strategy, and stakeholder presentations.


3 slides
Financial Cost Management Strategies
Break down your financial action plan with the Financial Cost Management Strategies Presentation. Featuring a dynamic 3-step arc design, this template is ideal for illustrating cost-saving initiatives, expense control methods, or phased budget implementation strategies. Each curved step includes space for icons, step numbers, titles, and concise descriptions, making it easy to communicate each stage clearly. Fully editable in PowerPoint, Keynote, and Google Slides, it’s perfect for finance teams, consultants, or operations leaders.


4 slides
Infrastructure and Construction Industry Presentation
Showcase key developments in the Infrastructure and Construction Industry with this visually structured template. Ideal for project managers, urban planners, and engineers, it highlights construction phases, investment data, and industry insights. Fully customizable and compatible with PowerPoint, Keynote, and Google Slides for seamless integration into your professional presentations.


5 slides
Architecture and Construction Strategy Presentation
Lay the foundation for success with this clean, construction-inspired presentation design. Ideal for showcasing project strategies, development phases, or architectural plans, it helps you communicate structure and vision with clarity. Fully customizable and compatible with PowerPoint, Keynote, and Google Slides for effortless editing and professional results.


12 slides
Effective Decision-Making with RAPID Presentation
Unlock streamlined decision-making with the Effective Decision-Making with RAPID template, a comprehensive guide designed to help organizations enhance and clarify their decision-making processes. Covering the key phases: Recommend, Agree, Perform, Input, and Decide, this template is essential for teams looking to optimize operational efficiency. Ideal for a variety of business environments, it is compatible with PowerPoint, Keynote, and Google Slides, offering versatility and ease of use for professionals.


7 slides
Business Model Canvas Value Infographic
The business model canvas is a strategic management tool that provides a visual framework for developing, describing, and analyzing a business model. Prepare for a dynamic voyage through business success with our business model canvas value infographic. This is not just a blueprint; it's a vivid map to unlock the value potential in your business model. Navigate through the core elements, envision your venture, and redefine success. Compatible with Powerpoint, Keynote, and Google Slides. Showcase how a strong customer relationships is key. With this infographic illustrate the strategies to keep your audience coming back for more!


7 slides
Step Numbers Infographic
A numbers infographic is a visual representation of data, statistics, or numerical information presented in a clear, concise, and visually appealing manner. This infographic template aims to communicate complex numerical data or figures in a way that is easy to understand and interpret. Compatible with Powerpoint, Keynote, and Google Slides. Utilizes the charts, graphs, icons, and other graphical elements to represent numerical data. These infographic visuals make it easier for viewers to grasp the meaning behind the numbers. This template will allow you to focus on presenting key numerical insights.


23 slides
Cycladic UX Design Presentation
The Cycladic UX Design Presentation Template is a bold and vibrant choice for showcasing your UX/UI design projects. With its striking pink and black color scheme, this template is designed to grab attention and keep your audience engaged. It covers all essential aspects of UX design, from project overviews and user research to wireframes, prototyping, and UI design principles. Each slide is thoughtfully designed to present your content clearly and effectively, making it ideal for designers who want to highlight their process, showcase their work, and communicate their design thinking.


6 slides
Social Science Infographics
The "Social Science" infographic template is an intellectually stimulating and visually engaging tool, thoughtfully designed for PowerPoint, Keynote, and Google Slides. This template is a brilliant resource for educators, researchers, and students who seek to present the multifaceted aspects of social sciences in a clear and compelling manner. This template skillfully encompasses various disciplines within social science, such as anthropology, sociology, psychology, and political science. It presents key theories, methodologies, and findings in an organized and digestible format. This makes it an invaluable aid for academic presentations, research proposals, or educational discussions, facilitating a deeper understanding of human society and social relationships. The design is as thought-provoking as the subject it represents, with a color scheme that stimulates intellectual curiosity while maintaining clarity and focus. This not only enhances the visual appeal of the presentation but also complements the analytical and reflective nature of social science. Whether used in a lecture hall, a conference, or a study group, this template ensures that the complex world of "Social Science" is presented in an engaging, informative, and visually captivating manner.


7 slides
Union Venn Diagram Infographic
Venn Diagrams are a great way to display your data in an organized, aesthetically pleasing way. This infographic template is perfect for any presentation that requires a Venn Diagram. This template is designed to visually demonstrate the impact of your company's efforts. Use this to show how different teams work to achieve goals, or how different departments work together to create something new. Compatible with Powerpoint, Keynote, and Google Slides. This infographic uses a cool, bold color scheme and fun imagery to show the relationship between two or more sets of data in a way that will help you easily explain it to your target audience.


4 slides
Modern 3D Business Diagram Presentation
Bring your metrics to life with this sleek 3D chart that adds instant dimension to any business presentation. Designed to visualize comparisons or progress across three data sets, this diagram helps you communicate clearly without overloading the slide. Fully compatible with PowerPoint, Keynote, and Google Slides for a seamless workflow.


22 slides
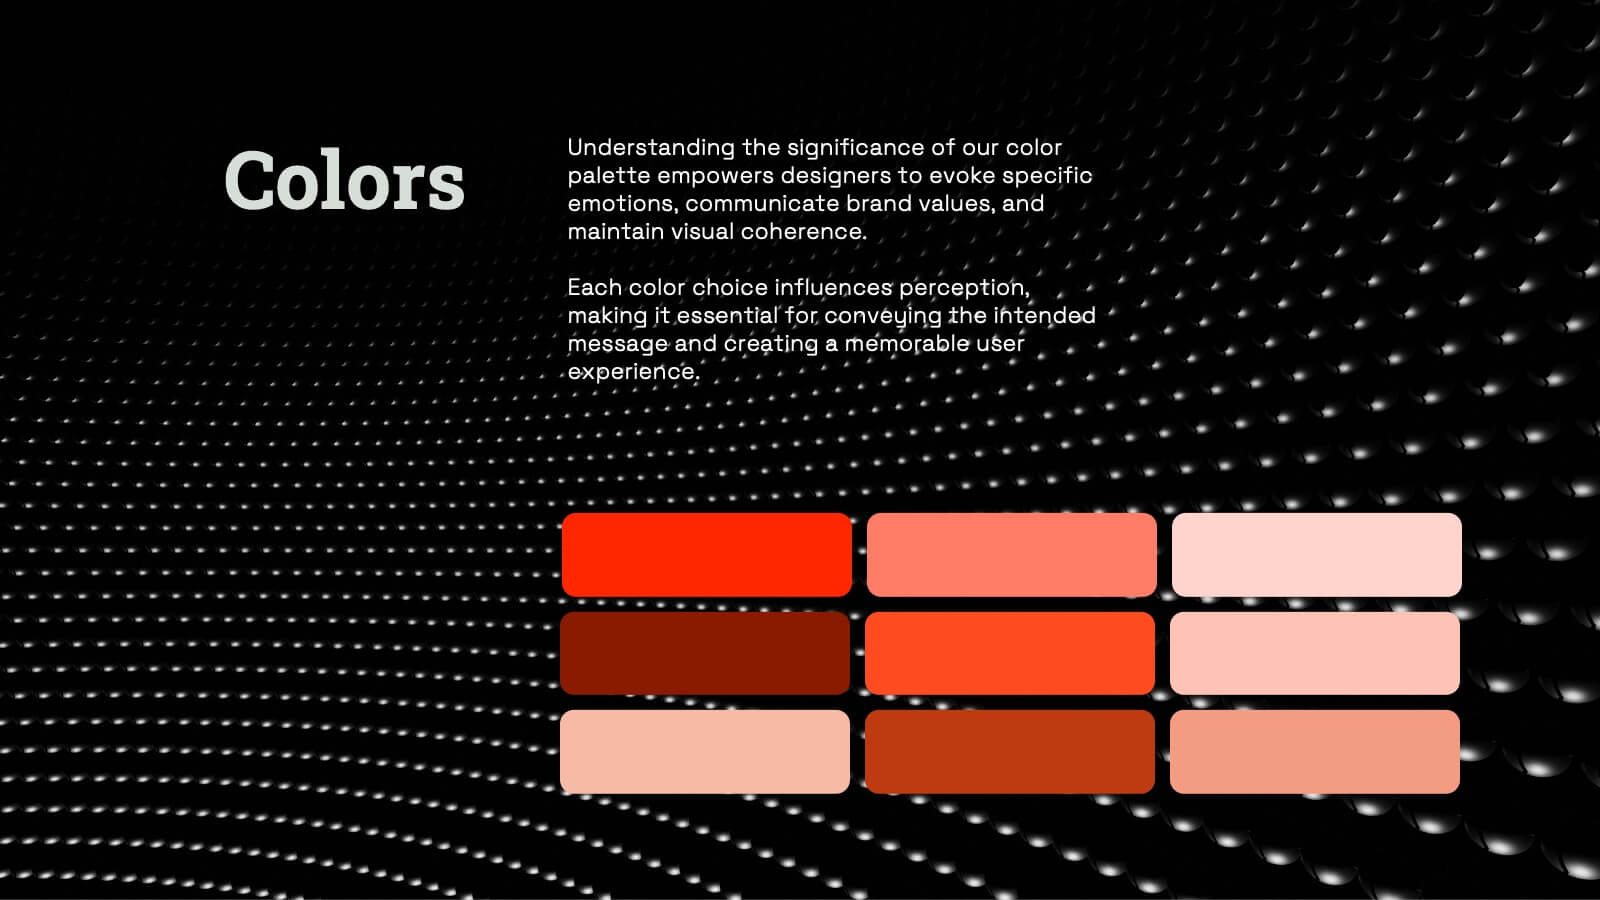
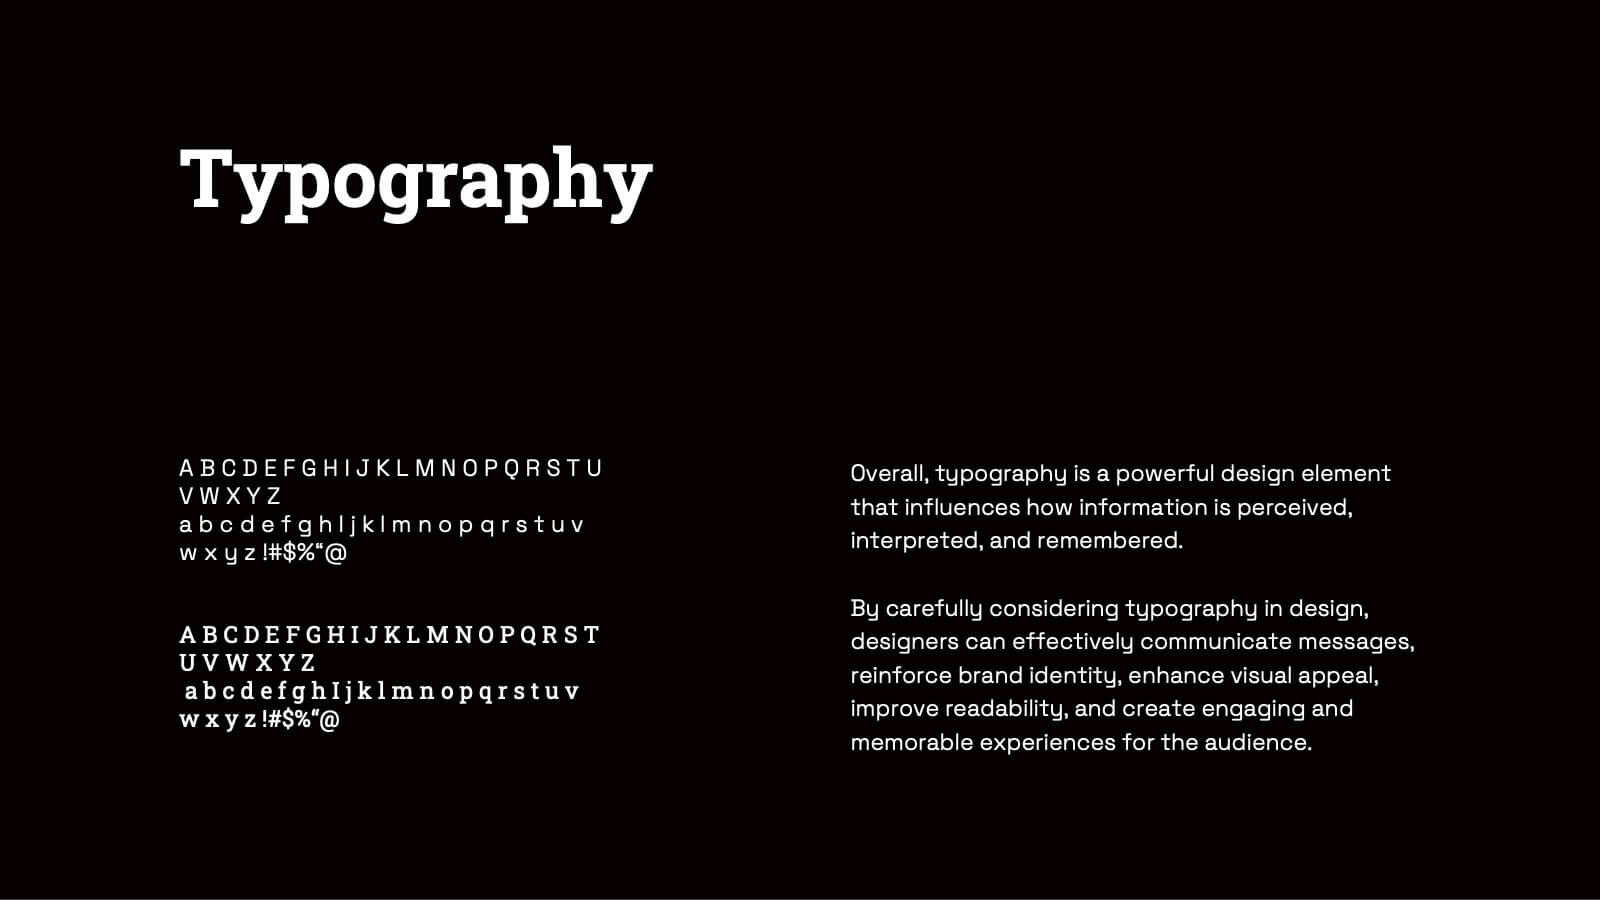
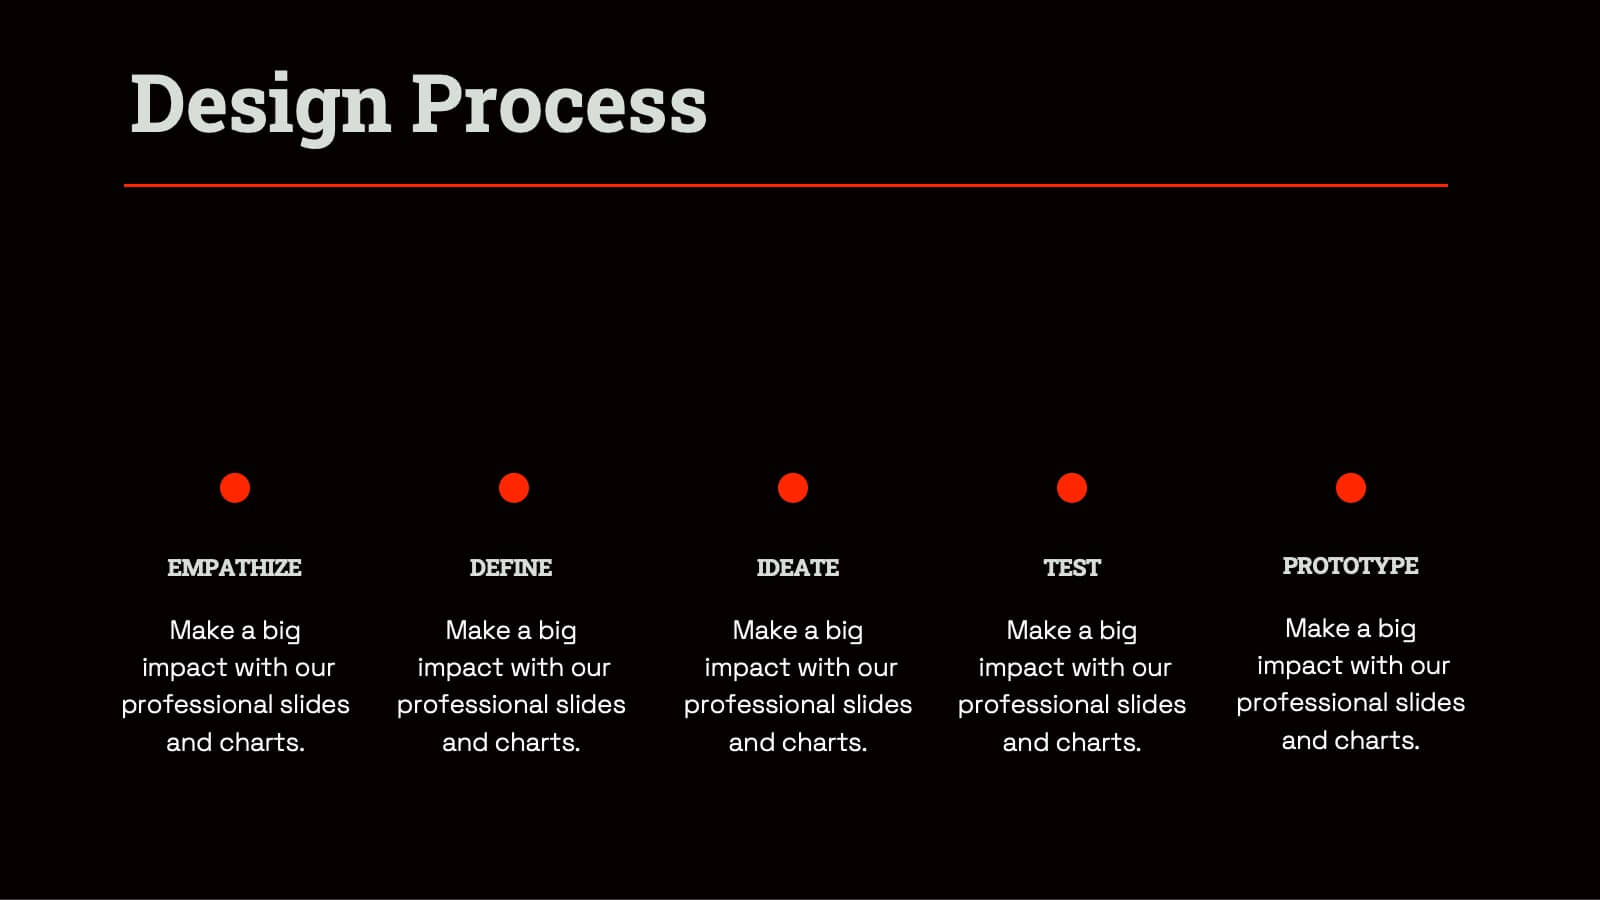
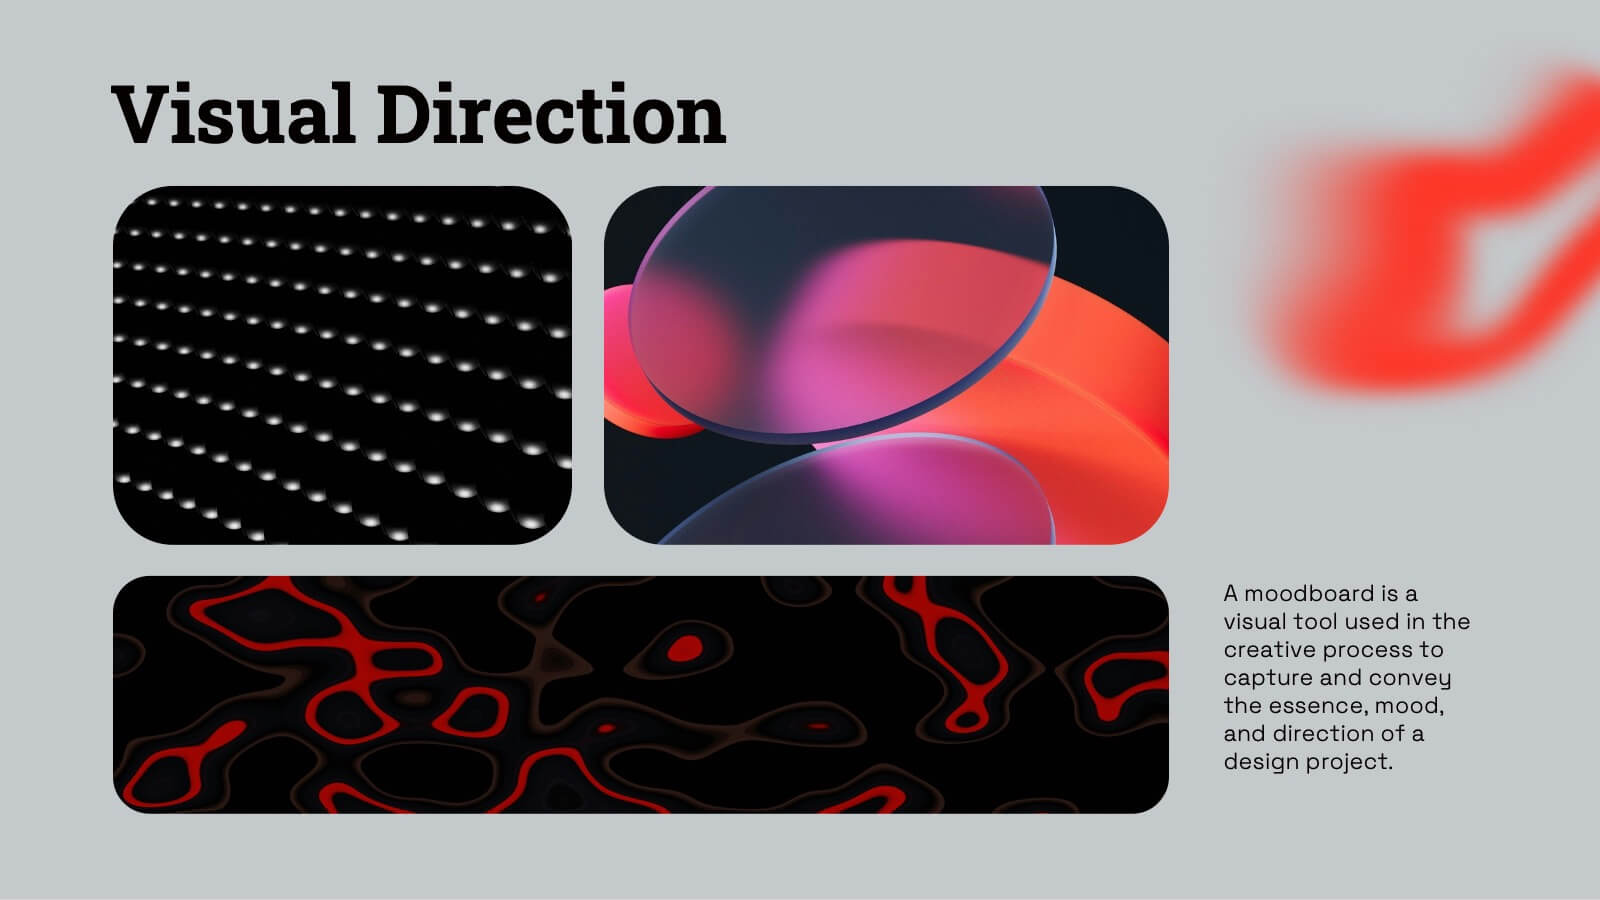
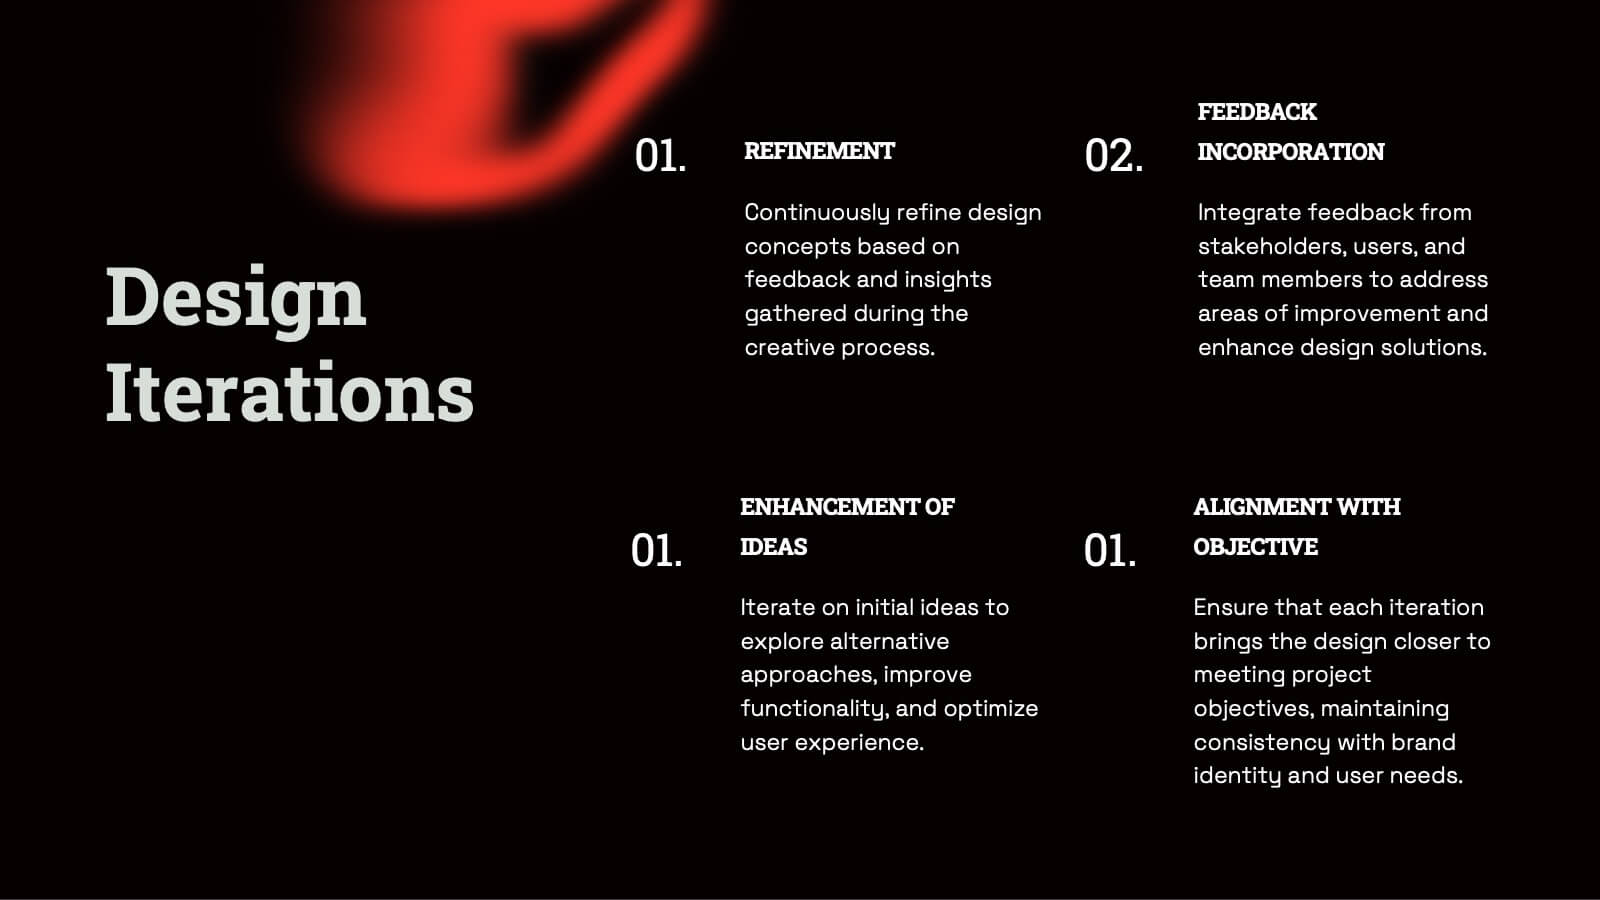
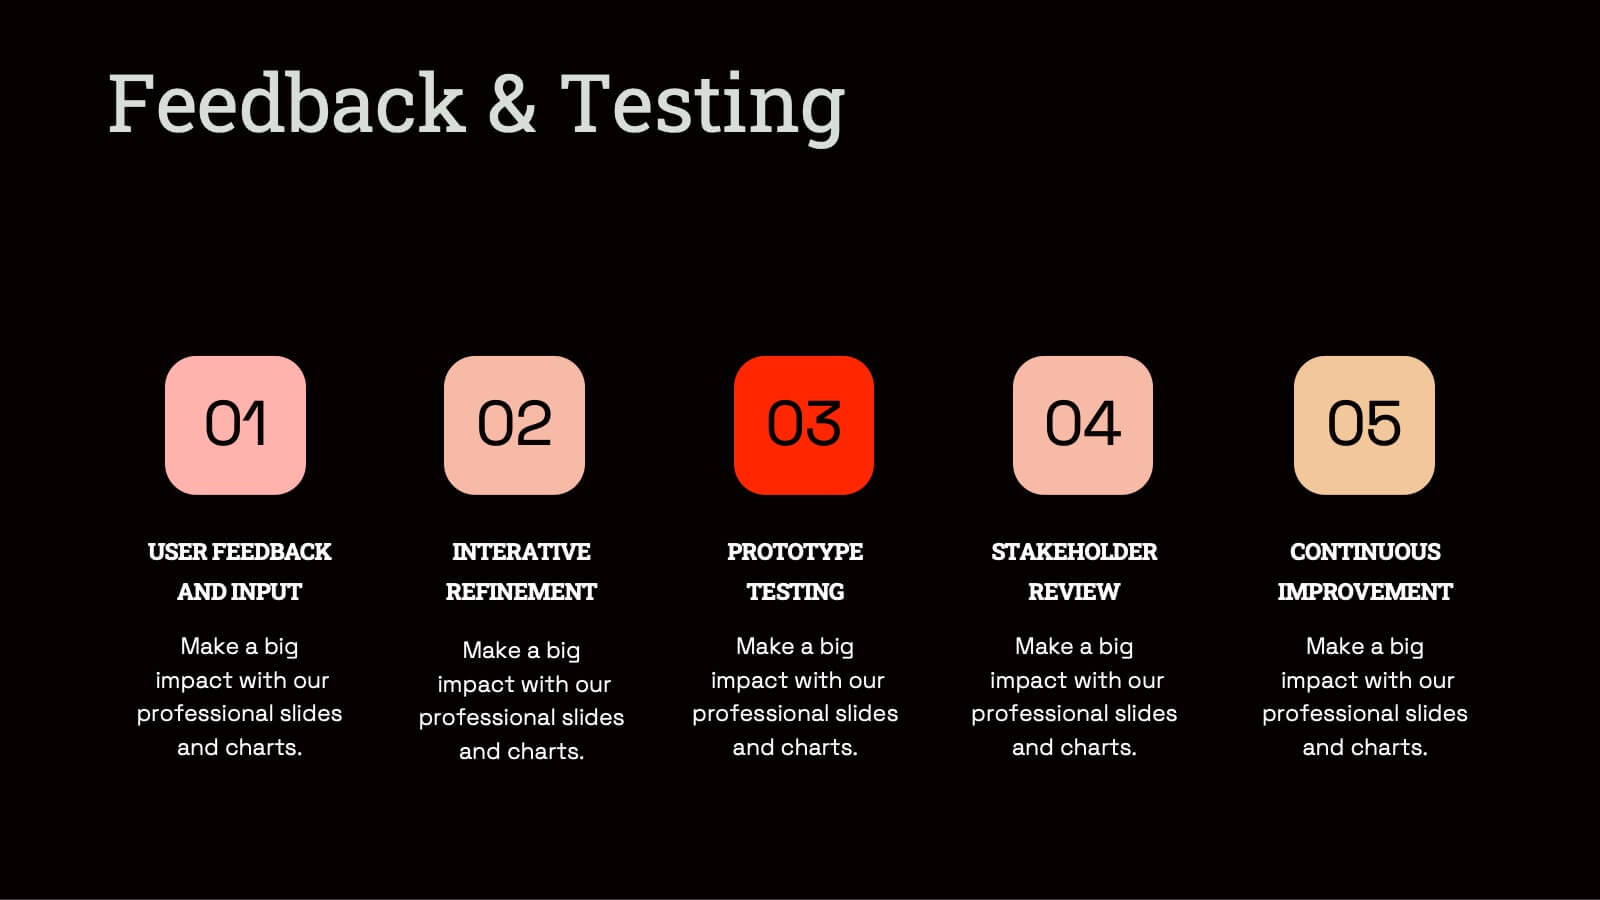
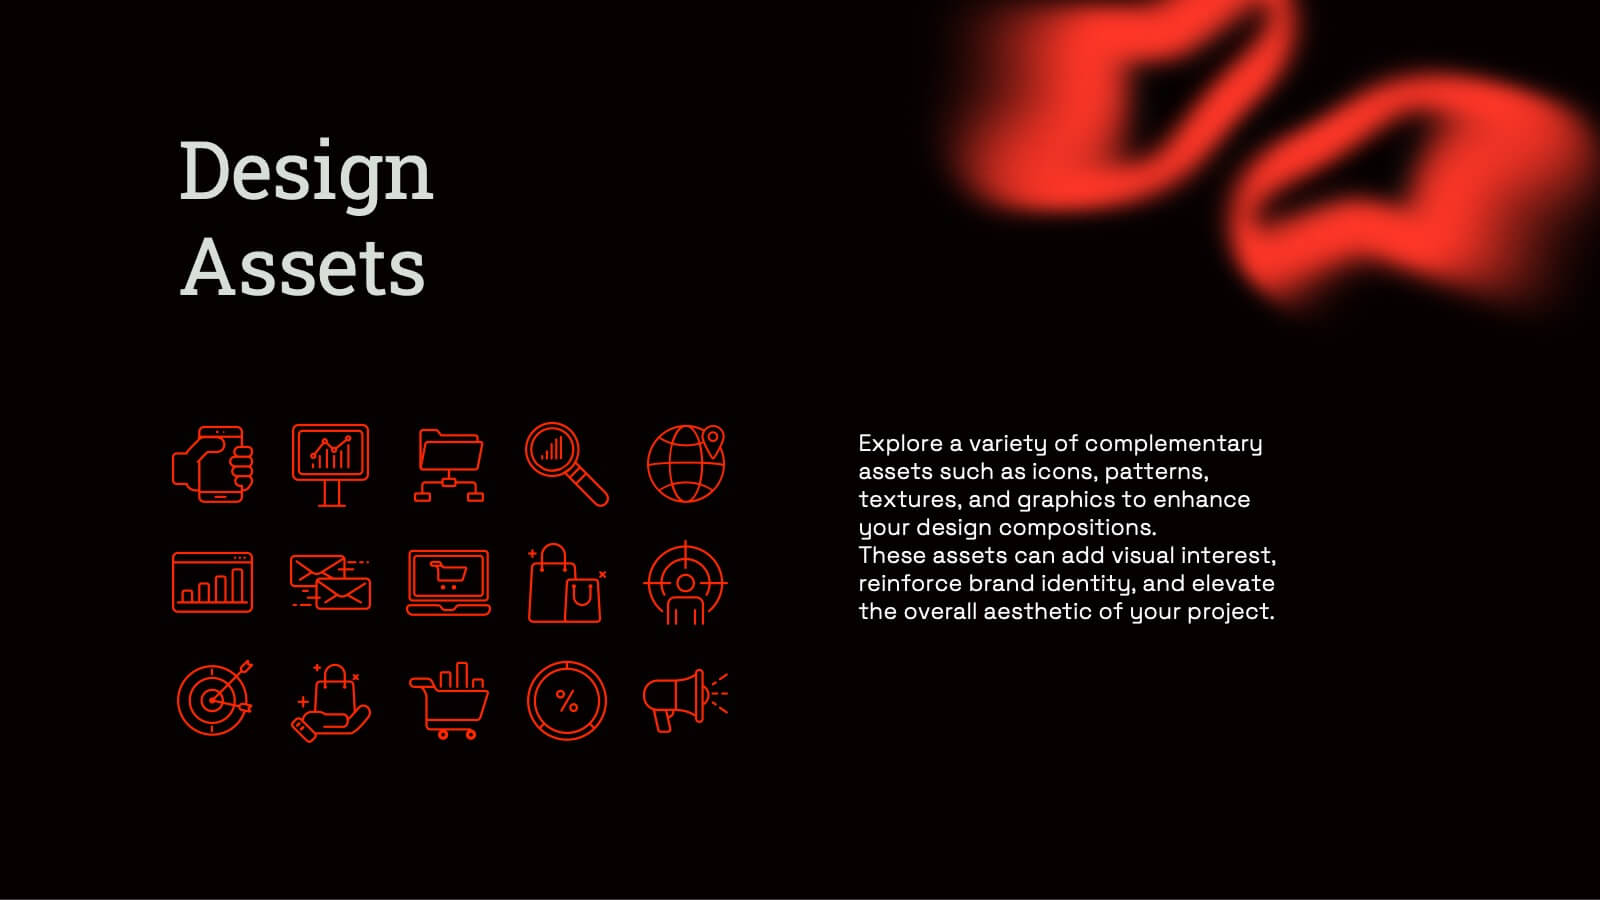
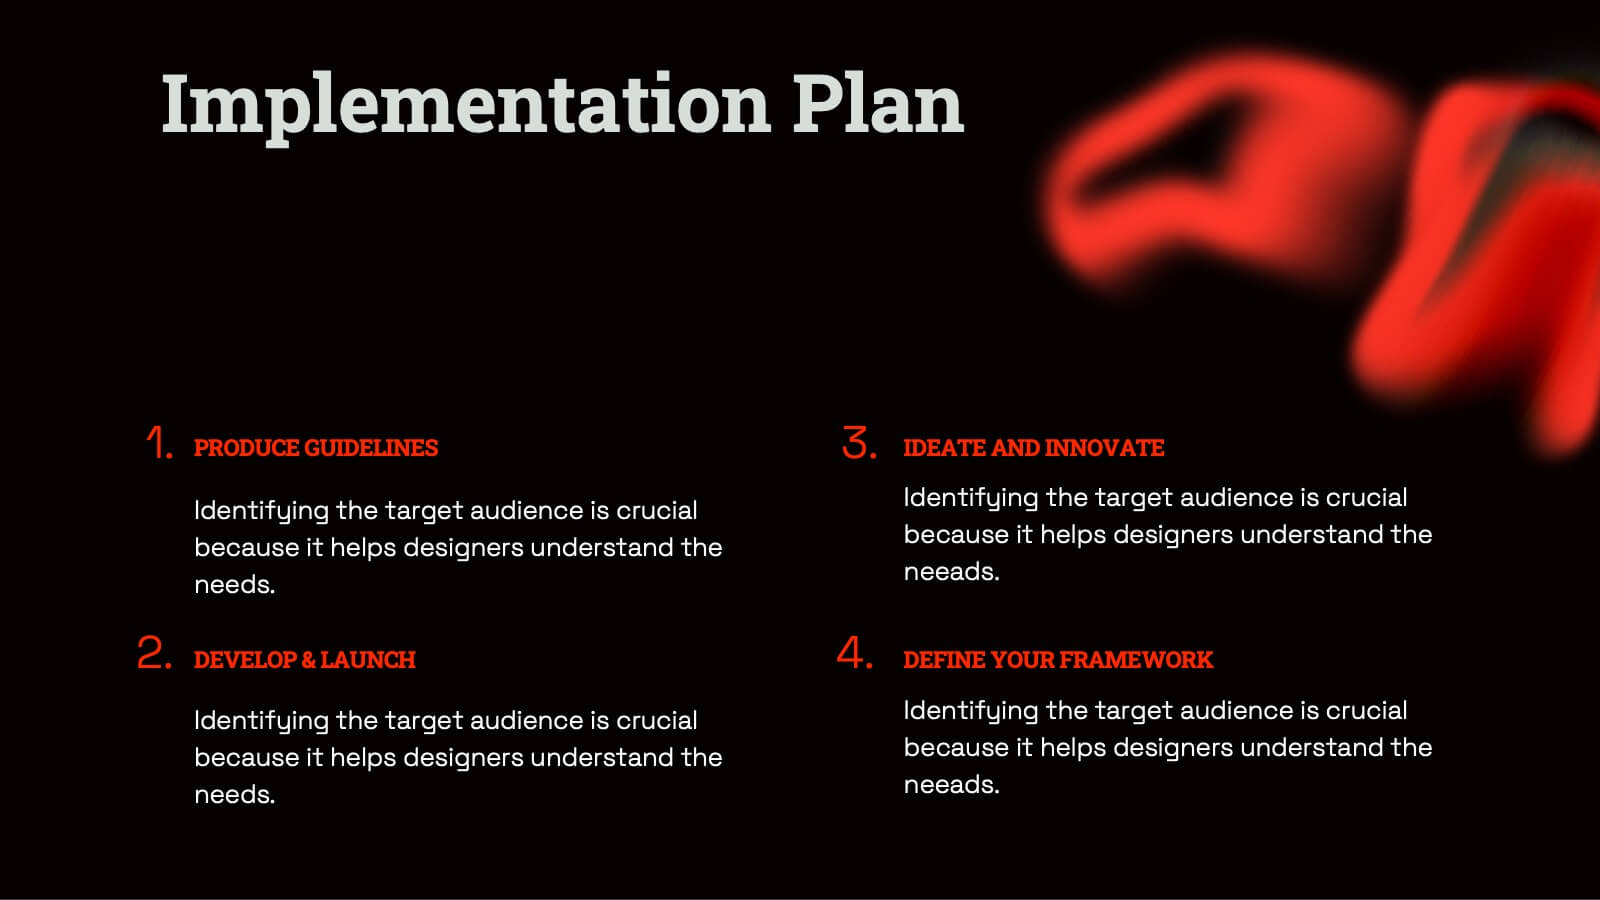
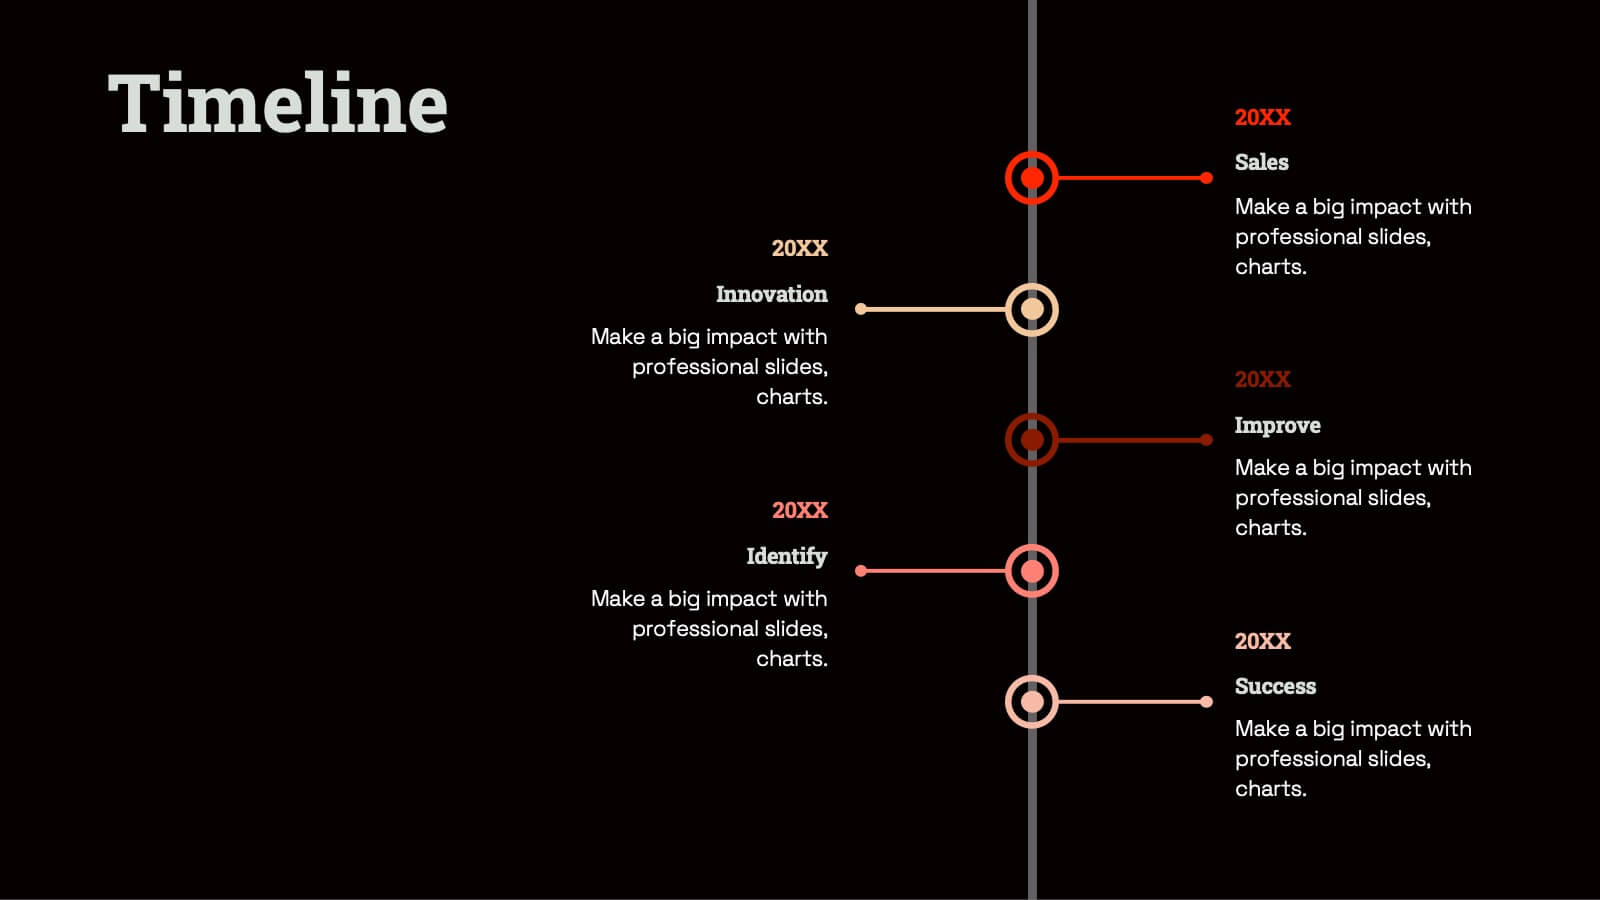
Radiant Graphic Design Project Plan Presentation
Unleash your creativity with this bold and dynamic graphic design project plan template! Perfect for showcasing design elements, textures, and typography, this template guides you through every phase, from concept development and prototyping to feedback and final presentations. Ideal for visual direction and design asset management, it’s fully compatible with PowerPoint, Keynote, and Google Slides for seamless use.