Blue Ocean Strategy Business Model

PowerPoint Template and Google Slides Theme

Capture new market spaces with this innovative Blue Ocean Strategy slide. Designed with a dynamic hourglass visual, it helps you showcase differentiation and low-cost strategies clearly. Perfect for business strategy sessions, growth planning, and innovation discussions. Fully editable in PowerPoint, Keynote, and Google Slides.
Features
  • 6 Unique slides
  • Fully editable and easy to edit in Microsoft Powerpoint, Keynote and Google Slides
  • 16:9 widescreen layout
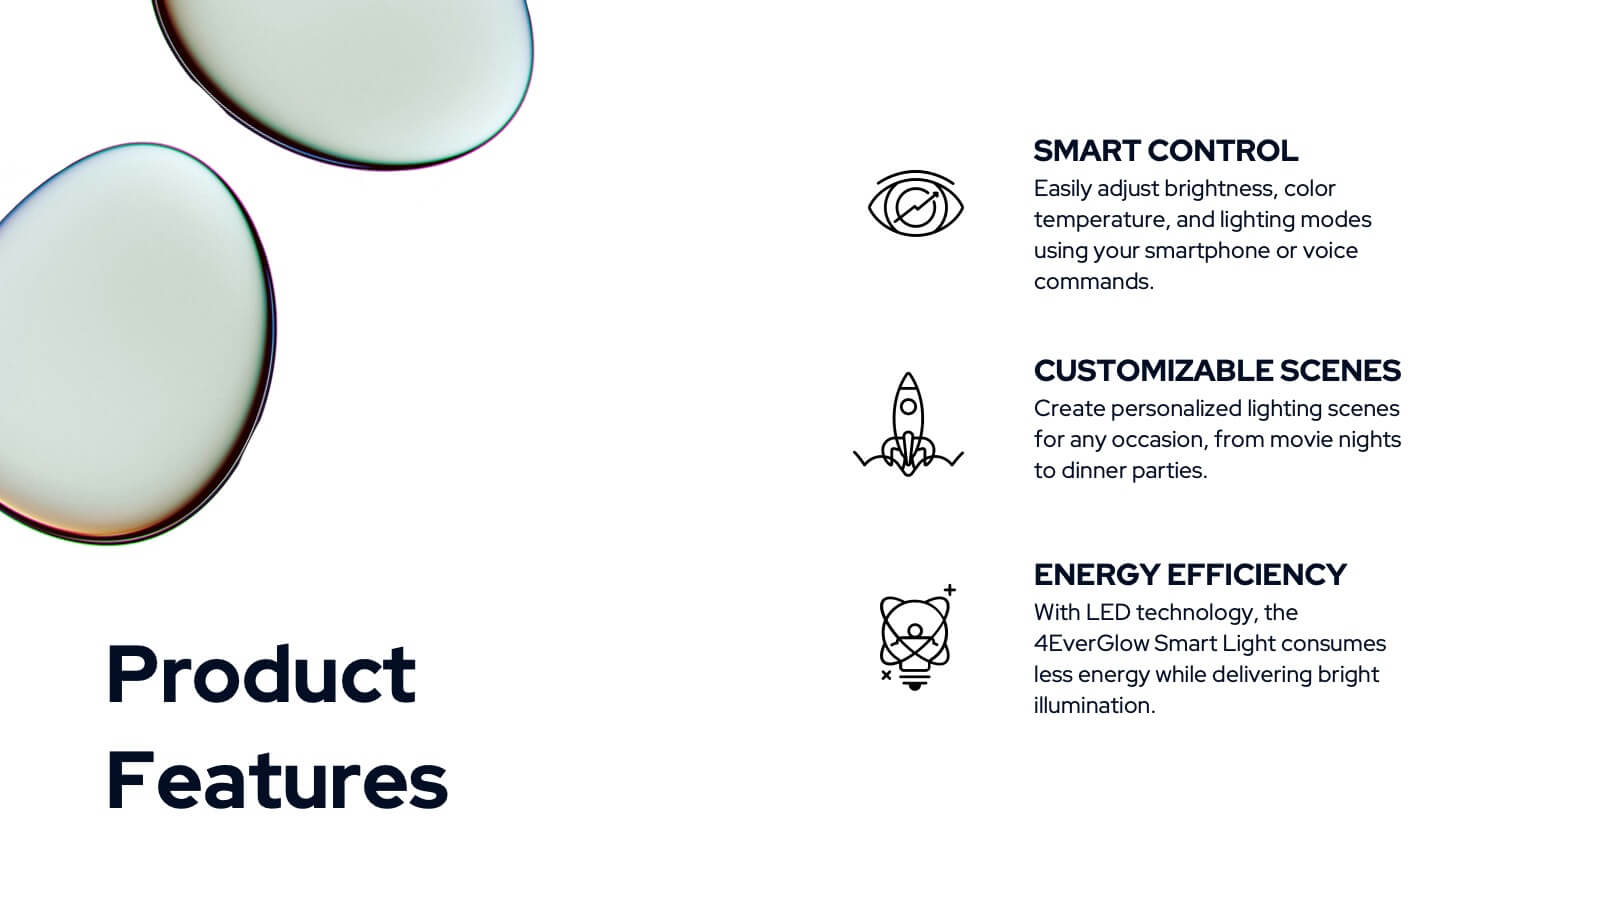
  • Clean and professional designs
  • Export to JPG, PDF or send by email
decor

Do you have any questions?

Recommend

Sales Infographic Presentation TemplateSales Infographic Presentation TemplateSales Infographic Presentation TemplateSales Infographic Presentation TemplateSales Infographic Presentation TemplateSales Infographic Presentation TemplateSales Infographic Presentation Template

7 slides

Sales Infographic Presentation Template

A Sales Infographic is a visual representation of data or information related to sales. They can include charts, graphs, and diagrams that show how much money a company has made, how many products they have sold, and what their best-selling products are. This template is perfect for anyone who wants to show off their sale numbers in a fun and easy-to-understand way. This template has colorful pictures and charts that make it easy to see how much you've sold and how well your sales are doing. This template is a perfect way to help a company make decisions and track progress.

Chimera Marketing Campaign PresentationChimera Marketing Campaign PresentationChimera Marketing Campaign PresentationChimera Marketing Campaign PresentationChimera Marketing Campaign PresentationChimera Marketing Campaign PresentationChimera Marketing Campaign PresentationChimera Marketing Campaign PresentationChimera Marketing Campaign PresentationChimera Marketing Campaign PresentationChimera Marketing Campaign PresentationChimera Marketing Campaign PresentationChimera Marketing Campaign PresentationChimera Marketing Campaign PresentationChimera Marketing Campaign PresentationChimera Marketing Campaign PresentationChimera Marketing Campaign PresentationChimera Marketing Campaign PresentationChimera Marketing Campaign PresentationChimera Marketing Campaign PresentationChimera Marketing Campaign Presentation

21 slides

Chimera Marketing Campaign Presentation

Create a visually engaging digital marketing presentation with this modern template! Covering essential topics like company history, market presence, target audience, and competitive landscape, this template helps you showcase your marketing strategies effectively. Fully customizable, it works seamlessly with PowerPoint, Keynote, and Google Slides for professional presentations every time.

Steps Process Infographic Presentation TemplateSteps Process Infographic Presentation TemplateSteps Process Infographic Presentation TemplateSteps Process Infographic Presentation TemplateSteps Process Infographic Presentation TemplateSteps Process Infographic Presentation TemplateSteps Process Infographic Presentation Template

7 slides

Steps Process Infographic Presentation Template

A steps process is a way of breaking down a task or project into a series of smaller, manageable steps. This template is perfect for showing steps processes in a fun and easy-to-understand way. It's compatible with Powerpoint, Keynote, and Google Slides, so you can use it on any device. This template has attention-grabbing colors to make your presentation stand out. It is also customizable with step charts, so you can make your presentation look just the way you want. With this template, you can make learning fun and easy for your students, or make your business presentations look professional.

Value Chain Analysis InfographicValue Chain Analysis InfographicValue Chain Analysis InfographicValue Chain Analysis InfographicValue Chain Analysis InfographicValue Chain Analysis InfographicValue Chain Analysis Infographic

7 slides

Value Chain Analysis Infographic

Streamline your business processes with our Value Chain Analysis Infographic, an essential tool for business analysts, management consultants, and strategic planners. This infographic provides a visual breakdown of the primary and supporting activities that create value for your customers. Our Value Chain Analysis Infographic illustrates how each segment of your business contributes to the overall product or service delivery. It's designed to help you identify opportunities for improvement, cost savings, and competitive advantage. The infographic is customizable, allowing you to detail activities such as inbound logistics, operations, outbound logistics, marketing, sales, and service. This SEO-optimized tool ensures that your strategic analysis is accessible for professionals seeking to enhance operational efficiency and value creation. Employ this infographic to dissect and understand your business operations, fostering informed decision-making and optimizing the value delivered to your customers.

Tidal Research Findings Report PresentationTidal Research Findings Report PresentationTidal Research Findings Report PresentationTidal Research Findings Report PresentationTidal Research Findings Report PresentationTidal Research Findings Report PresentationTidal Research Findings Report PresentationTidal Research Findings Report PresentationTidal Research Findings Report PresentationTidal Research Findings Report PresentationTidal Research Findings Report PresentationTidal Research Findings Report PresentationTidal Research Findings Report PresentationTidal Research Findings Report PresentationTidal Research Findings Report PresentationTidal Research Findings Report PresentationTidal Research Findings Report PresentationTidal Research Findings Report PresentationTidal Research Findings Report PresentationTidal Research Findings Report PresentationTidal Research Findings Report PresentationTidal Research Findings Report Presentation

22 slides

Tidal Research Findings Report Presentation

Deliver your research findings with impact using this sleek and modern report template! It covers key highlights, performance metrics, project progress, and competitor insights, making it ideal for clear, professional presentations. Perfect for summarizing challenges, solutions, and strategic initiatives. Compatible with PowerPoint, Keynote, and Google Slides for seamless reporting.

USA Demographic Map PresentationUSA Demographic Map PresentationUSA Demographic Map PresentationUSA Demographic Map PresentationUSA Demographic Map Presentation

5 slides

USA Demographic Map Presentation

Visualize regional insights effortlessly with this USA Demographic Map Presentation. Featuring editable color-coded state maps and matching infographic sections, this template is ideal for presenting population data, customer distribution, or market segmentation. Fully compatible with PowerPoint, Keynote, and Google Slides.

Title InfographicTitle InfographicTitle InfographicTitle InfographicTitle InfographicTitle InfographicTitle Infographic

7 slides

Title Infographic

These presentation slides showcase a variety of title designs, each uniquely styled to suit different thematic contexts, using vibrant colors and dynamic typography to captivate and engage audiences. The designs are exceptionally versatile, making them suitable for a wide range of professional settings, including marketing, design, business strategy, and corporate overviews. Each slide is thoughtfully crafted to introduce sections, highlight key concepts, or set the stage for in-depth discussions, ensuring that every part of the presentation connects with the audience effectively. The strategic use of elements such as color blocks, minimalist layouts, and bold text helps in emphasizing the core message, making these slides an ideal choice for presenters looking to make an impactful introduction or to clearly delineate sections within their presentations.

Iceberg Model InfographicsIceberg Model InfographicsIceberg Model InfographicsIceberg Model InfographicsIceberg Model Infographics

5 slides

Iceberg Model Infographics

Introducing our Iceberg Model Infographic, this is a visual representation of the Iceberg Model which is a metaphor for understanding a problem or issue. It is based on the idea that just like an iceberg, only a small portion of the problem or issue is visible on the surface, while the majority of it lies beneath. In this vertical infographic use the top visible part of the iceberg to represent the things that are easily observed, and the larger hidden part of the iceberg can be the underlying causes or factors that are not easily visible. This is designed to help people understand the complexity of a problem and encourage them to look beyond the surface level.

Business Dashboard InfographicsBusiness Dashboard InfographicsBusiness Dashboard InfographicsBusiness Dashboard InfographicsBusiness Dashboard InfographicsBusiness Dashboard InfographicsBusiness Dashboard InfographicsBusiness Dashboard InfographicsBusiness Dashboard Infographics

9 slides

Business Dashboard Infographics

A business dashboard, often referred to as a business intelligence dashboard, is a visual representation of an organization's key performance indicators and critical business metrics. Empower your business analysis and strategy with our Infographic. This dynamic template enables you to present key business metrics, performance indicators, and trends in a clear and impactful manner. Compatible with Powerpoint, Keynote, and Google Slides. This template is a powerful tool to visualize your business progress, identify opportunities, and communicate your success story to viewers, clients, or team members.

Break Even Point Infographic PresentationBreak Even Point Infographic PresentationBreak Even Point Infographic PresentationBreak Even Point Infographic PresentationBreak Even Point Infographic PresentationBreak Even Point Infographic PresentationBreak Even Point Infographic Presentation

7 slides

Break Even Point Infographic Presentation

A Break Even Analysis Infographic is a visual tool that helps businesses and organizations understand the point at which they will begin to make a profit. This template uses a graph to show the relationship between fixed costs, revenue, and profits at different levels of production or sales. This Infographic also includes a graph with two lines: one representing fixed costs and the other representing total revenue. The point at which these lines intersect represents the break-even point, which is the level of sales or production at which the business will neither make a profit nor incur a loss.

Concentric Circles Business Model PresentationConcentric Circles Business Model PresentationConcentric Circles Business Model PresentationConcentric Circles Business Model PresentationConcentric Circles Business Model PresentationConcentric Circles Business Model PresentationConcentric Circles Business Model PresentationConcentric Circles Business Model PresentationConcentric Circles Business Model PresentationConcentric Circles Business Model Presentation

10 slides

Concentric Circles Business Model Presentation

Visualize Your Business Strategy with Clarity using this Concentric Circles Business Model Presentation template. This design helps you illustrate core business concepts, hierarchical structures, and strategic layers in a simple yet engaging format. Ideal for business planning, process optimization, and strategic growth presentations, this template makes complex relationships clear and easy to understand. Fully editable and available for PowerPoint, Keynote, and Google Slides.

3D Infographic Design Presentation3D Infographic Design Presentation3D Infographic Design Presentation3D Infographic Design Presentation3D Infographic Design Presentation3D Infographic Design Presentation3D Infographic Design Presentation3D Infographic Design Presentation

8 slides

3D Infographic Design Presentation

Make your data pop—literally—with a stacked design that brings depth and clarity to your message. This 3D infographic template helps break down layered concepts, step-by-step processes, or hierarchical data in a visually striking way. It’s fully customizable and compatible with PowerPoint, Keynote, and Google Slides for easy presentation building.

Performance-Based Goal Achievement PresentationPerformance-Based Goal Achievement PresentationPerformance-Based Goal Achievement PresentationPerformance-Based Goal Achievement PresentationPerformance-Based Goal Achievement PresentationPerformance-Based Goal Achievement PresentationPerformance-Based Goal Achievement PresentationPerformance-Based Goal Achievement PresentationPerformance-Based Goal Achievement PresentationPerformance-Based Goal Achievement Presentation

10 slides

Performance-Based Goal Achievement Presentation

Showcase milestones and celebrate wins with the Performance-Based Goal Achievement slide. This visual roadmap uses a trophy icon and progress ribbon banners to represent four sequential accomplishments or KPIs. Each step is fully editable—perfect for tracking sales targets, employee achievements, or strategic benchmarks. Clean design, color-coded sections, and dark or light mode options make it ideal for presentations in PowerPoint, Keynote, and Google Slides.

Professional PresentationProfessional PresentationProfessional PresentationProfessional PresentationProfessional PresentationProfessional PresentationProfessional PresentationProfessional PresentationProfessional PresentationProfessional PresentationProfessional PresentationProfessional PresentationProfessional PresentationProfessional PresentationProfessional PresentationProfessional Presentation

16 slides

Professional Presentation

Streamline your project presentations with our Professional Template, meticulously designed to bring your content to life. This template is ideal for professionals looking to present a structured and detailed overview of their projects. Starting with a compelling cover slide, it guides you through defining your problem statement, setting clear objectives, and laying out comprehensive strategies and recommendations. The slides are curated to facilitate a logical flow from an introduction of your project to a detailed implementation plan, visual graphics, and outcome analysis. The key objectives slide is engineered to present your goals with impact, while the strategies and implementation plan slides help articulate the steps towards achieving success. The template concludes with a neat summary slide, a cordial 'Thank You' slide with contact information, and a credits section for source attribution. Fully compatible with PowerPoint, Keynote, and Google Slides, this template is a reliable choice for professionals seeking to convey their message with clarity and confidence.

Step-by-Step Process Guide PresentationStep-by-Step Process Guide PresentationStep-by-Step Process Guide PresentationStep-by-Step Process Guide PresentationStep-by-Step Process Guide PresentationStep-by-Step Process Guide Presentation

6 slides

Step-by-Step Process Guide Presentation

Clearly outline your workflow with this step-by-step process guide template, featuring six bold arrow graphics for sequential planning. Perfect for illustrating procedures, timelines, or strategies, this modern design ensures clarity and flow. Fully editable in Canva, PowerPoint, or Google Slides, making it ideal for business, project management, or training presentations.

Product Innovation InfographicProduct Innovation InfographicProduct Innovation InfographicProduct Innovation InfographicProduct Innovation InfographicProduct Innovation InfographicProduct Innovation Infographic

7 slides

Product Innovation Infographic

Illuminate the path to creativity with our Product Innovation infographic, specifically designed for Powerpoint, Keynote, and Google Slides. This engaging infographic is an excellent resource for professionals seeking to present the innovation process in an accessible format. The eye-catching design breaks down complex ideas into digestible segments, perfect for sparking discussions on product development and creative brainstorming sessions. Our Product Innovation infographic is a versatile tool, offering a visual representation of the stages of innovation. It's ideal for educators, business leaders, and entrepreneurs who aim to inspire and educate their audience on the intricacies of innovative thinking. Each element of the infographic is crafted to encourage audience engagement, making it easier to convey the nuances of product innovation strategies. Compatibility with major presentation platforms ensures that this infographic can be seamlessly integrated into your slide deck. Use it to enhance your message and captivate your audience with a clear visual journey through the innovation process. Add this infographic to your presentation toolkit to bring your vision of innovation to life.

Emerging Tech Innovations Deck PresentationEmerging Tech Innovations Deck PresentationEmerging Tech Innovations Deck Presentation

3 slides

Emerging Tech Innovations Deck Presentation

Present futuristic ideas with this Emerging Tech Innovations Deck. Perfect for tech leaders, startups, and educators, this slide set features modern visuals with robot illustrations and sleek layouts. Easily editable in PowerPoint, Keynote, or Google Slides. Ideal for showcasing cloud computing, automation, or AI-driven strategies in a compelling format.