


Features
- 23 Unique Slides
- Fully editable and easy to edit in Microsoft Powerpoint, Keynote and Google Slides
- 16:9 widescreen layout
- Clean and professional designs
- Export to JPG, PDF or send by email


Do you have any questions?
Recommend


8 slides
Organizational Maturity and Scaling Model Presentation
Visualize growth with the Organizational Maturity and Scaling Model Presentation. This slide design illustrates progress across four strategic phases using vertical bars and icons—ideal for showcasing business development, capability building, or team evolution. Clean, professional, and fully editable in PowerPoint, Keynote, Google Slides, and Canva.


5 slides
Educational Planning & Class Activities Presentation
Organize your lessons with this creative education-themed layout. Featuring a playful stack of books and apple illustration, this slide is ideal for outlining academic plans, class objectives, or weekly activities. Fully editable in PowerPoint, Keynote, and Google Slides—perfect for teachers, homeschoolers, and education professionals seeking clarity and visual appeal.


5 slides
Economic Analysis of Europe Map Presentation
Visualize key economic indicators across European regions with this impactful map-based presentation. Use shaded country highlights and accompanying bar charts to present comparative data, performance trends, and regional growth. Ideal for economic reports, investor updates, or strategic planning. Fully editable and works seamlessly with PowerPoint, Keynote, and Google Slides.


4 slides
Project Brainstorming Mind Map Layout Presentation
Spark creativity with this Project Brainstorming Mind Map Layout presentation. Featuring a bold lightbulb centerpiece, this layout visually organizes four idea clusters around key project themes. Ideal for creative teams, planning sessions, or innovation workshops. Fully editable in Canva, PowerPoint, and Google Slides for easy personalization and professional impact.

20 slides
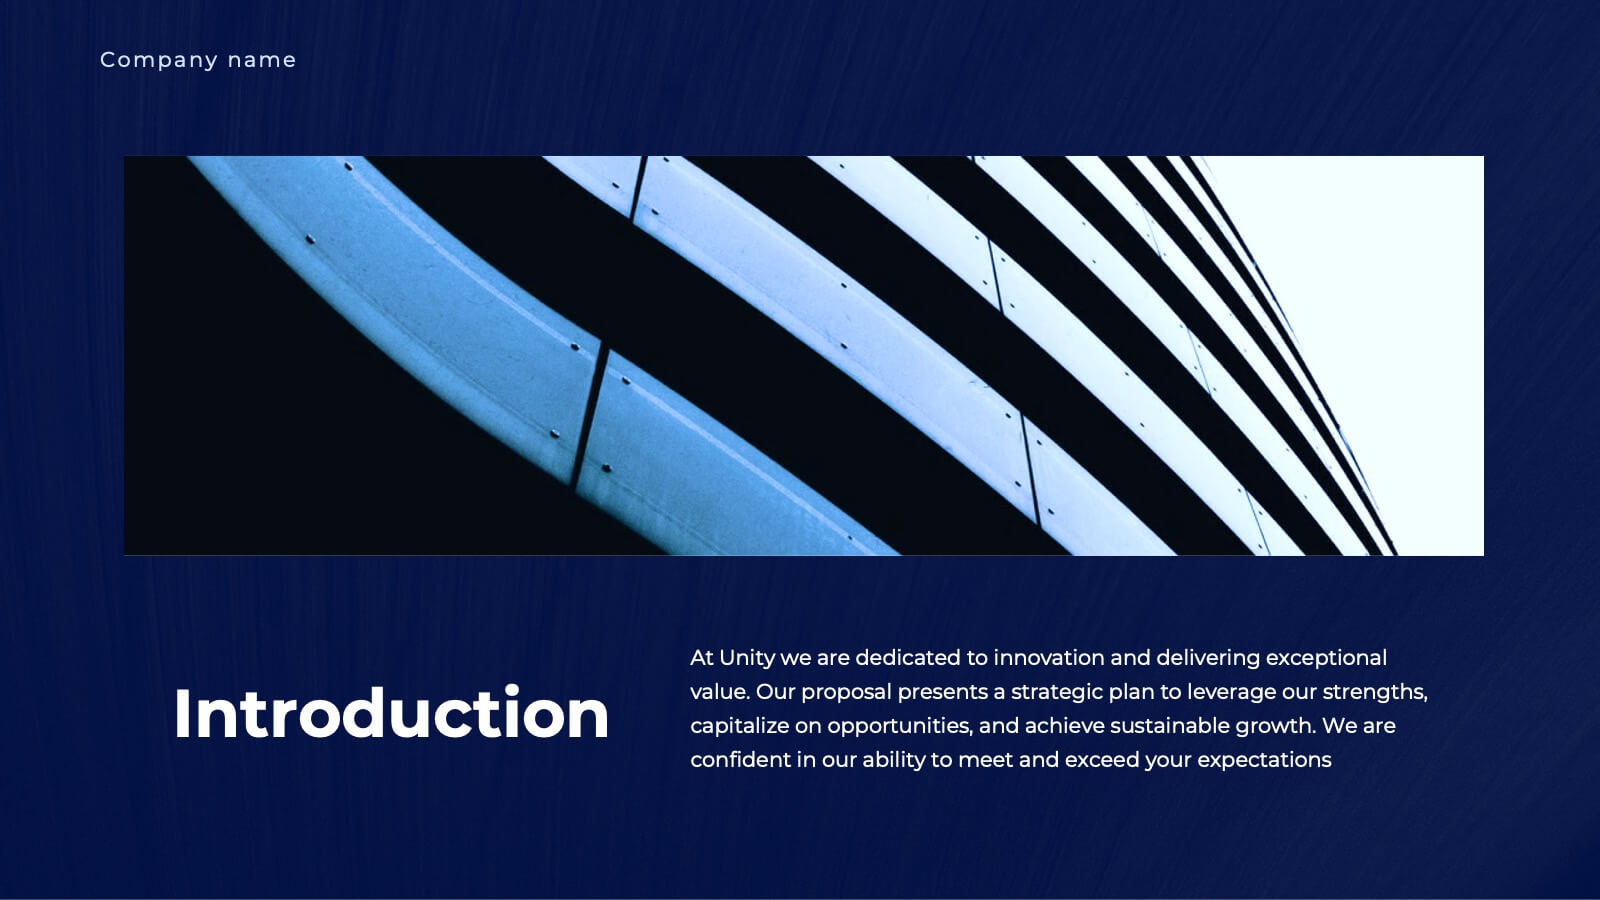
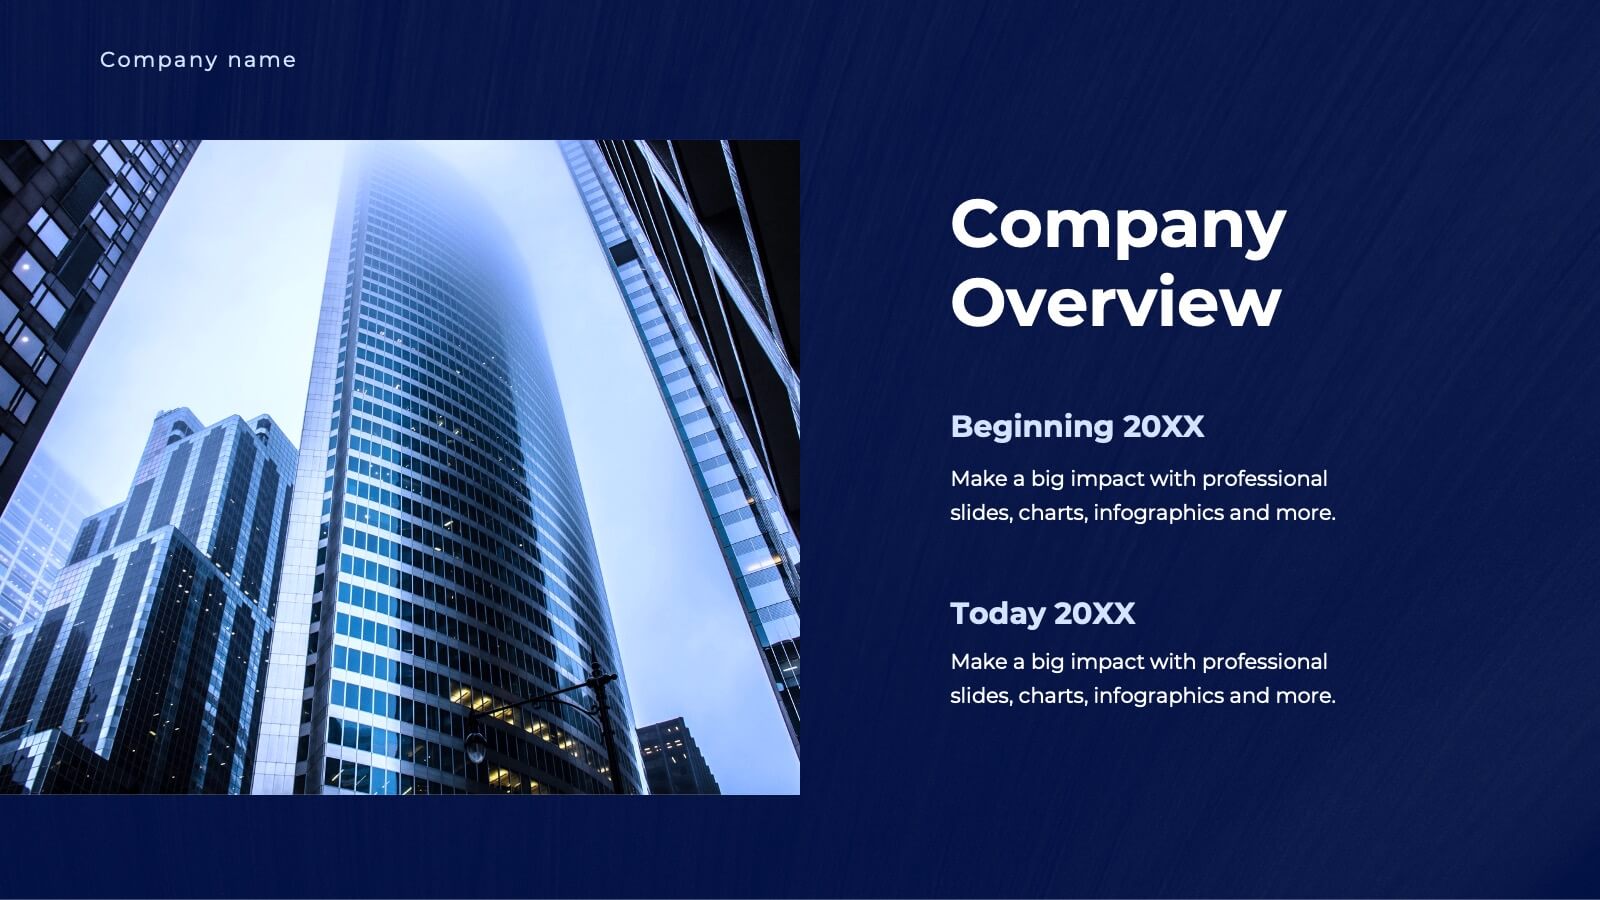
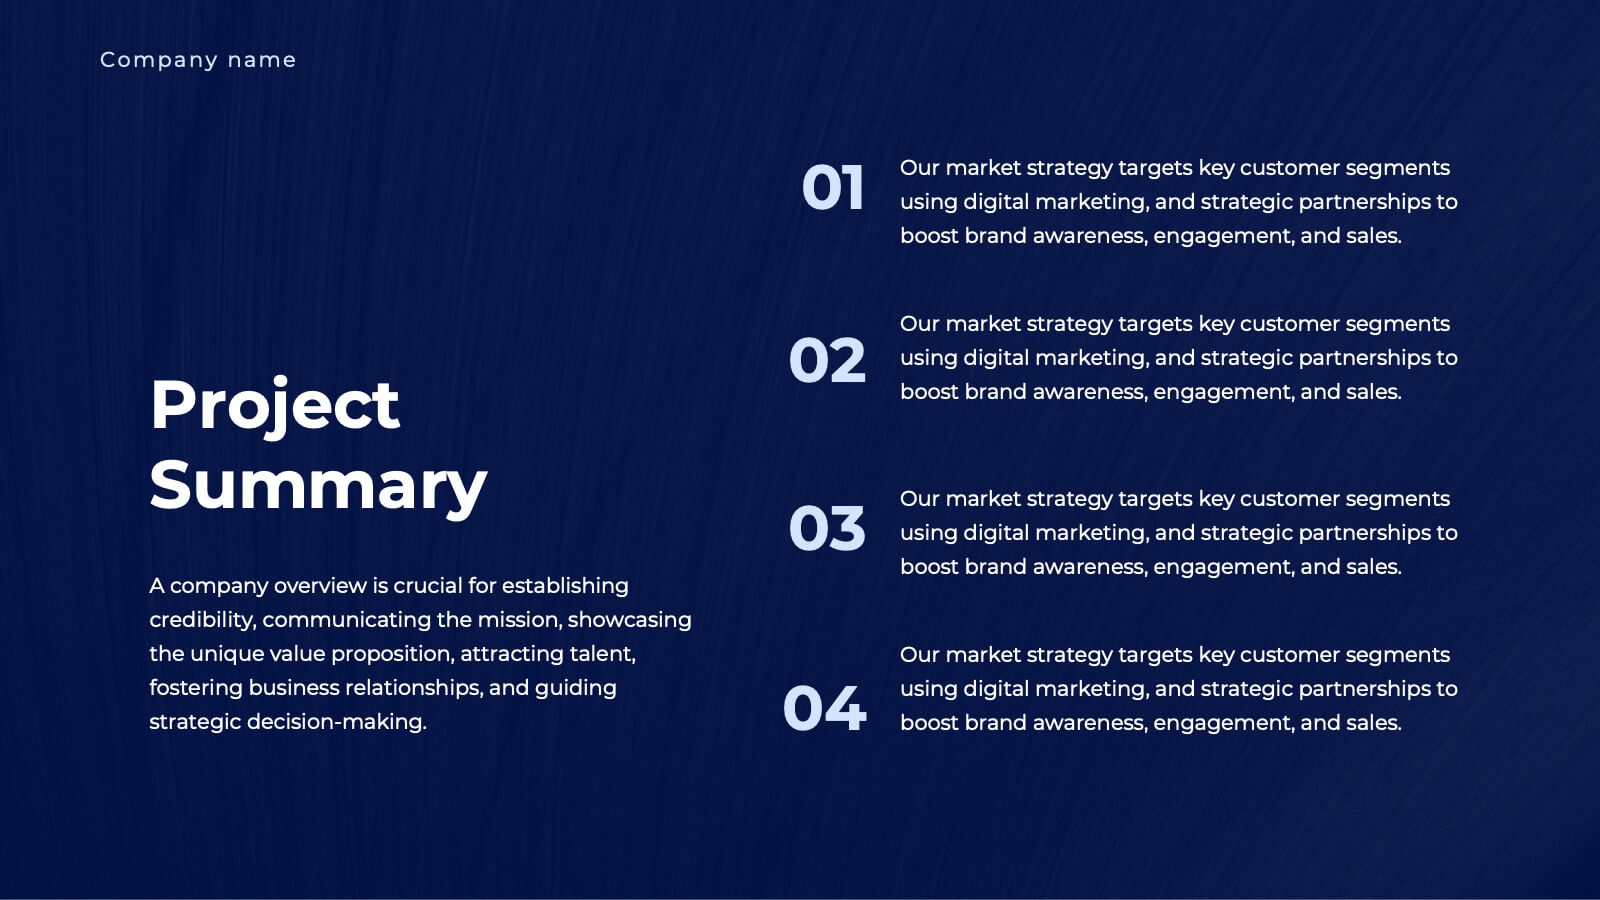
Unity Business Proposal Presentation
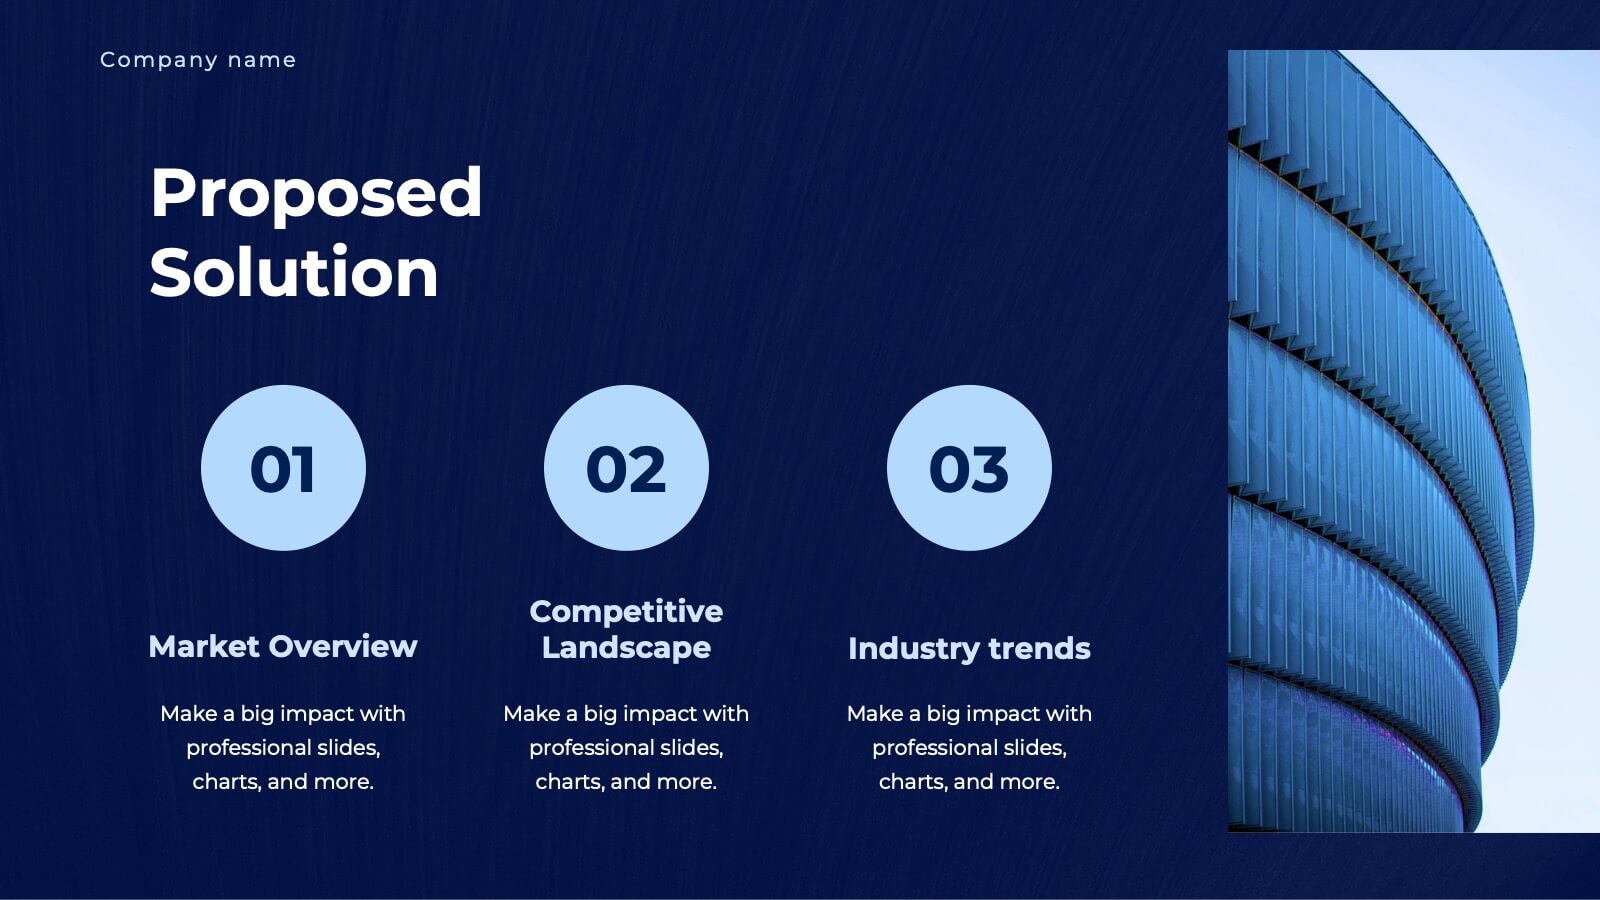
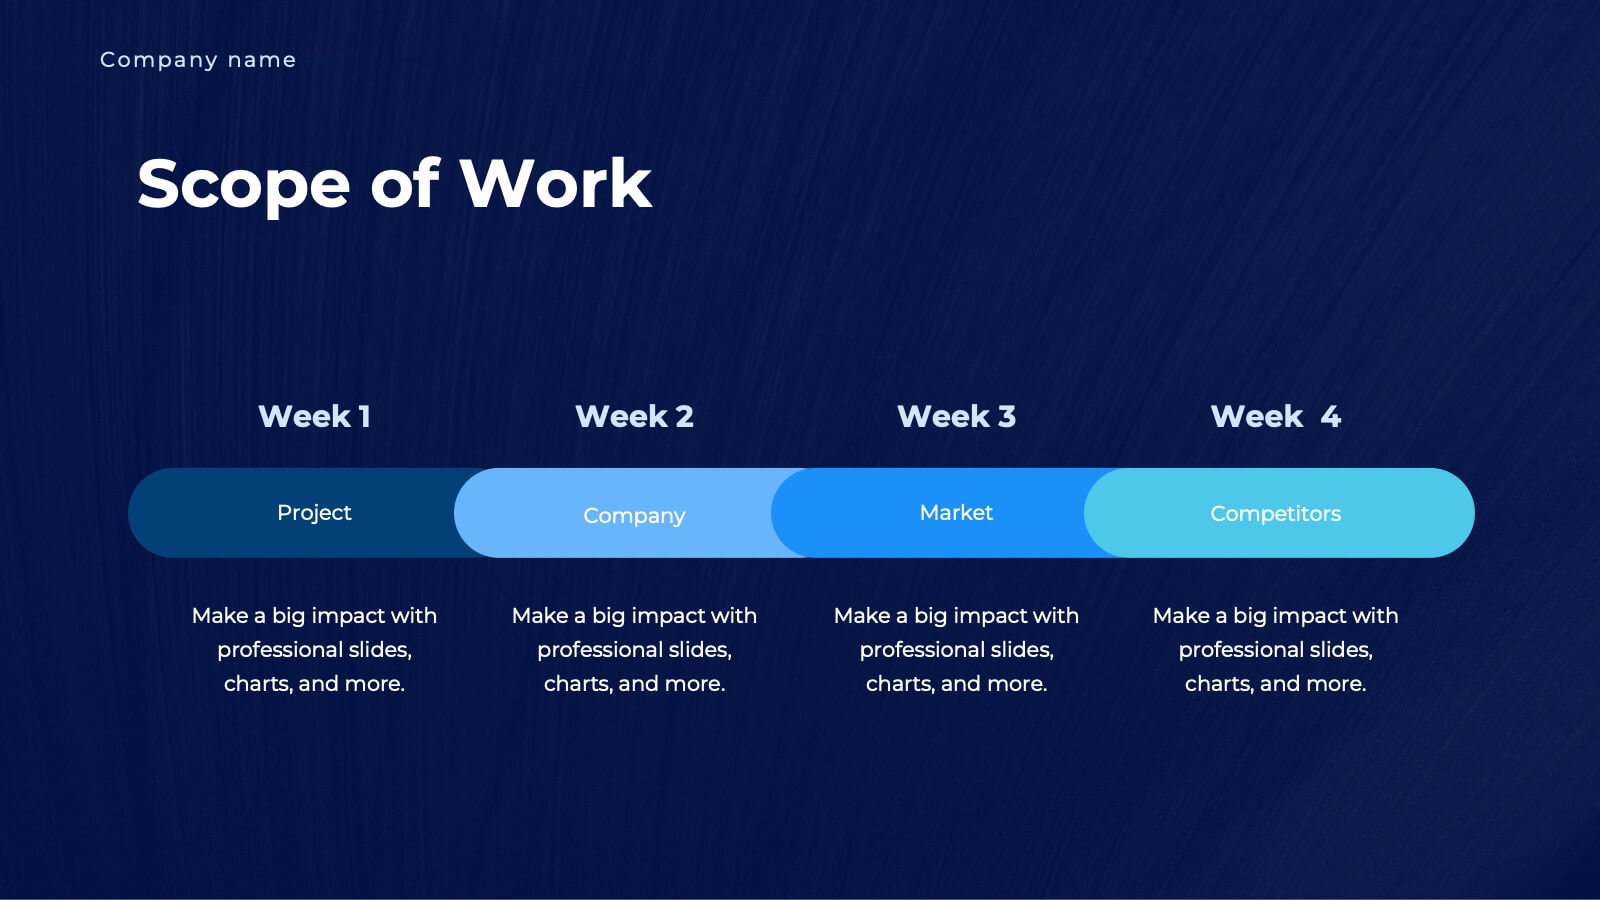
Take your business proposals to the next level with this elegant and comprehensive template! Perfect for presenting company overviews, project summaries, and detailed solutions. Ideal for business professionals looking to impress clients and stakeholders. Compatible with PowerPoint, Keynote, and Google Slides, this template ensures your proposals are impactful and professional.


26 slides
Kimbr Presentation Template
Kimbr is a modern and simple Powerpoint template that uses bold text in order to immediately catch your audience’s attention and let them focus on your innovative ideas. Combined with the modern and minimalistic style of Kimbr, this presentation packs a punch in the minimalism department: It comes with unique and modern slides perfect for Spa businesses or anyone looking for a clean minimal presentation. In addition, it has Charts, timelines and image placeholders, you'll be sure to find a space for all your information. Don't wait any longer and get started presenting your ideas today.


6 slides
Product Pricing Table Comparison
Make your pricing pitch clear and compelling with this vibrant comparison table template designed for easy decision-making. Whether you're showcasing subscription plans, service tiers, or product bundles, this slide helps highlight key features and value differences at a glance. Fully editable in PowerPoint, Keynote, and Google Slides.


6 slides
PESTEL Framework Breakdown Presentation
Kickstart your strategic thinking with a bold, colorful layout that makes external business factors easy to understand at a glance. This presentation breaks complex influences into clear, structured sections, helping teams analyze trends and plan with confidence. Fully editable and compatible with PowerPoint, Keynote, and Google Slides.


4 slides
Fleet and Delivery Operations Overview Presentation
Kick your logistics story into motion with a clean, easy-to-follow layout designed to showcase routes, deliveries, and operational steps with clarity. This slide helps teams communicate fleet performance, delivery processes, and workflow improvements in a simple, visual way. Fully compatible with PowerPoint, Keynote, and Google Slides.


6 slides
Design Thinking 5-Stage Model Presentation
Turn creativity into structured innovation with a clean, circular layout that guides your audience through each phase of problem-solving and ideation. Ideal for workshops, strategy sessions, or innovation pitches, this presentation makes complex processes easy to follow. Fully compatible with PowerPoint, Keynote, and Google Slides for seamless editing.

22 slides
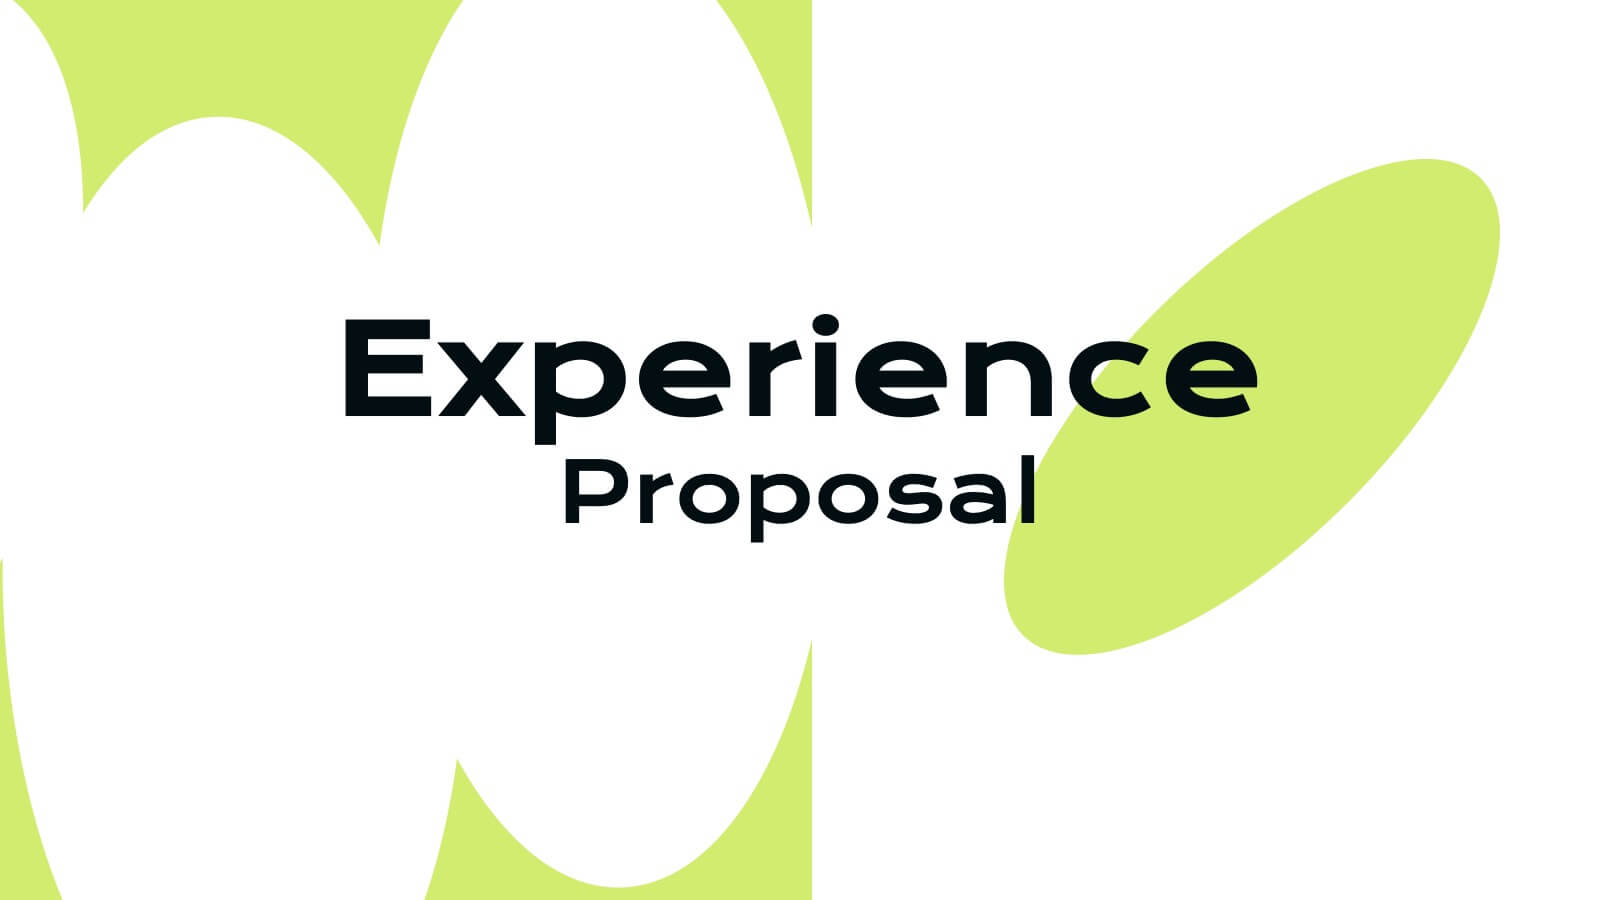
Ifrit User Experience Proposal Presentation
Unleash the power of great design with this fiery Ifrit-inspired presentation, perfect for delivering your user experience proposal! This template lets you showcase your UX strategies, research, and design process in a visually striking and well-organized format. Impress stakeholders with every slide. Compatible with PowerPoint, Keynote, and Google Slides.


5 slides
Performance Metrics Dashboard Presentation
Turn complex data into clear, engaging visuals with a clean, modern dashboard layout that highlights performance results at a glance. Perfect for tracking KPIs, progress, and team outcomes, this template brings structure and clarity to reports. Easily editable in PowerPoint, Keynote, and Google Slides for professional presentations.


4 slides
Defining Company Purpose Presentation
This template provides a visually engaging platform to articulate your organization's core values and mission. It features vibrant, clear sections for detailed insights, helping to communicate the foundational elements that drive business decisions and culture. Each slide is designed to support a cohesive narrative about your company's objectives and strategic direction, ensuring a professional presentation of your corporate ethos. This template is perfect for workshops, stakeholder meetings, or internal team alignments and is fully compatible with PowerPoint, Keynote, and Google Slides.


4 slides
Welcome and About Us Introduction Presentation
Start strong with the Welcome and About Us Introduction Presentation, designed to deliver a polished, professional first impression. This clean layout features bold typography and geometric side visuals, perfect for introducing your company, brand values, or strategic vision. Easily customize the content to suit corporate profiles, startup decks, or team intros. Compatible with Canva, PowerPoint, Google Slides, and Keynote.


5 slides
Innovation Framework Presentation
Turn bold ideas into structured success with this engaging presentation design. Perfect for mapping creative processes, innovation systems, and project development stages, it helps present ideas clearly and visually. Fully editable and easy to customize, this presentation is compatible with PowerPoint, Keynote, and Google Slides for effortless use.


6 slides
Workload Distribution and Calendar Plan Presentation
Stay on top of weekly responsibilities with the Workload Distribution and Calendar Plan Presentation. This visual planning template helps teams clearly assign tasks across days of the week, making it easy to organize schedules and boost productivity. Fully editable in PowerPoint, Keynote, and Google Slides.


6 slides
Professional Business Plan Presentation
Make every idea count with a clean, professional presentation that helps you communicate your business strategy clearly and confidently. Ideal for showcasing goals, market insights, and performance plans, it delivers structure with style. Fully compatible with PowerPoint, Keynote, and Google Slides for easy customization and seamless presentation design.