


Features
- 7 Unique slides
- Fully editable and easy to edit in Microsoft Powerpoint, Keynote and Google Slides
- 16:9 widescreen layout
- Clean and professional designs
- Export to JPG, PDF or send by email


Do you have any questions?
Recommend


4 slides
Visual Decision-Making with Harvey Balls
Make smart decisions faster with this clean and strategic Harvey Balls layout. Ideal for comparing key business factors or project options, this slide helps illustrate progress and priorities through four percentage-based visuals. Fully customizable in PowerPoint, Keynote, and Google Slides.


6 slides
Supply Chain Management Strategy
Navigate your next big idea with a flow that’s clear, visual, and sharp. This presentation template breaks down key business logistics and process steps into a bold, easy-to-follow infographic layout. Ideal for showcasing strategic planning and operational structure, it's fully compatible with PowerPoint, Keynote, and Google Slides for effortless use.


7 slides
RACI Matrix Project Infographic
A RACI Matrix, sometimes referred to as a Responsibility Assignment Matrix, is a project management tool used to clarify and communicate the roles and responsibilities of team members in completing tasks and activities within a project. This is a visually captivating and informative template designed to demystify the complexities of project accountability. Navigate through the world of roles and responsibilities in a project setting with this dynamic and easily digestible visual aid. With this infographic your audience will journey toward effective project management and accountability with the RACI Matrix.


4 slides
Artificial Intelligence Use Cases Overview Presentation
Navigate a maze of insights with this creative template designed to showcase real-world tech applications in a visually engaging way. Whether you're covering machine learning in healthcare or automation in customer service, this AI use case infographic keeps your points clear and organized. Works seamlessly in PowerPoint, Keynote, and Google Slides.


4 slides
Europe Market Expansion Visualization Presentation
Showcase your European growth strategy with the Europe Market Expansion Visualization Presentation. This map-based slide design allows you to clearly highlight regional opportunities, new market entries, and key expansion zones using icons and color-coded country markers. Ideal for strategic planning, investor updates, and sales overviews. Fully editable in PowerPoint, Keynote, Google Slides, and Canva.
23 slides
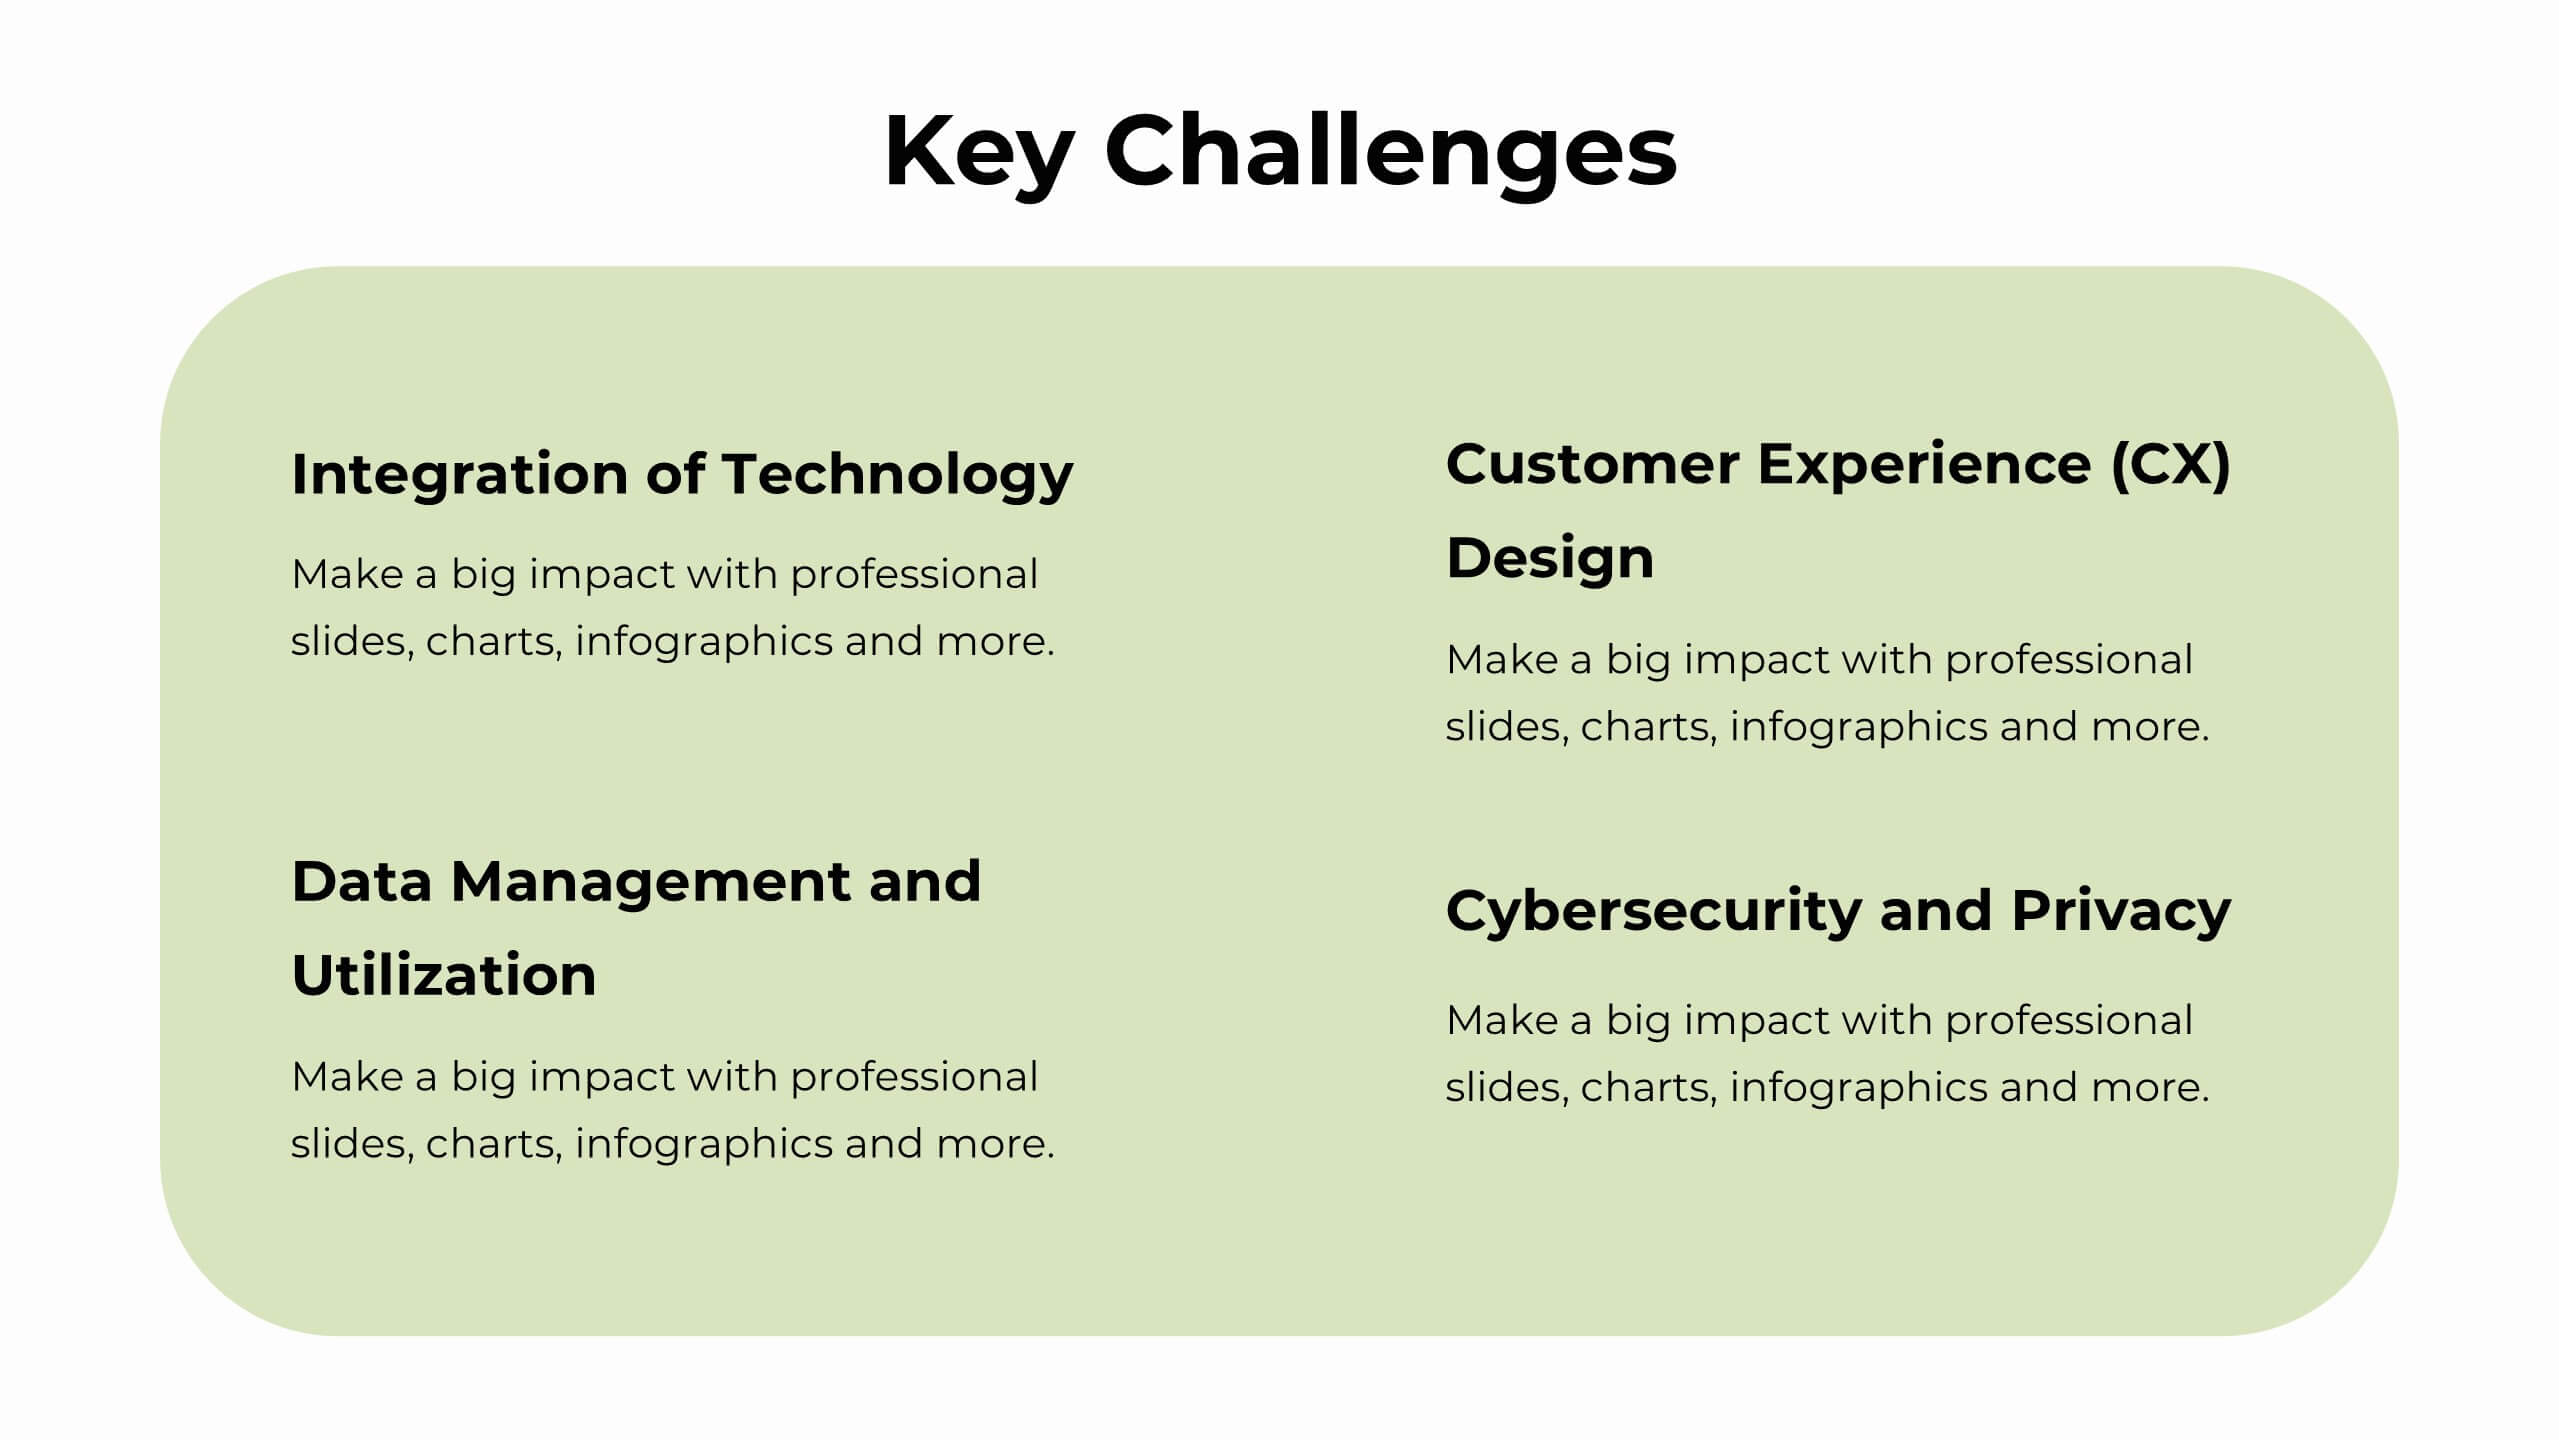
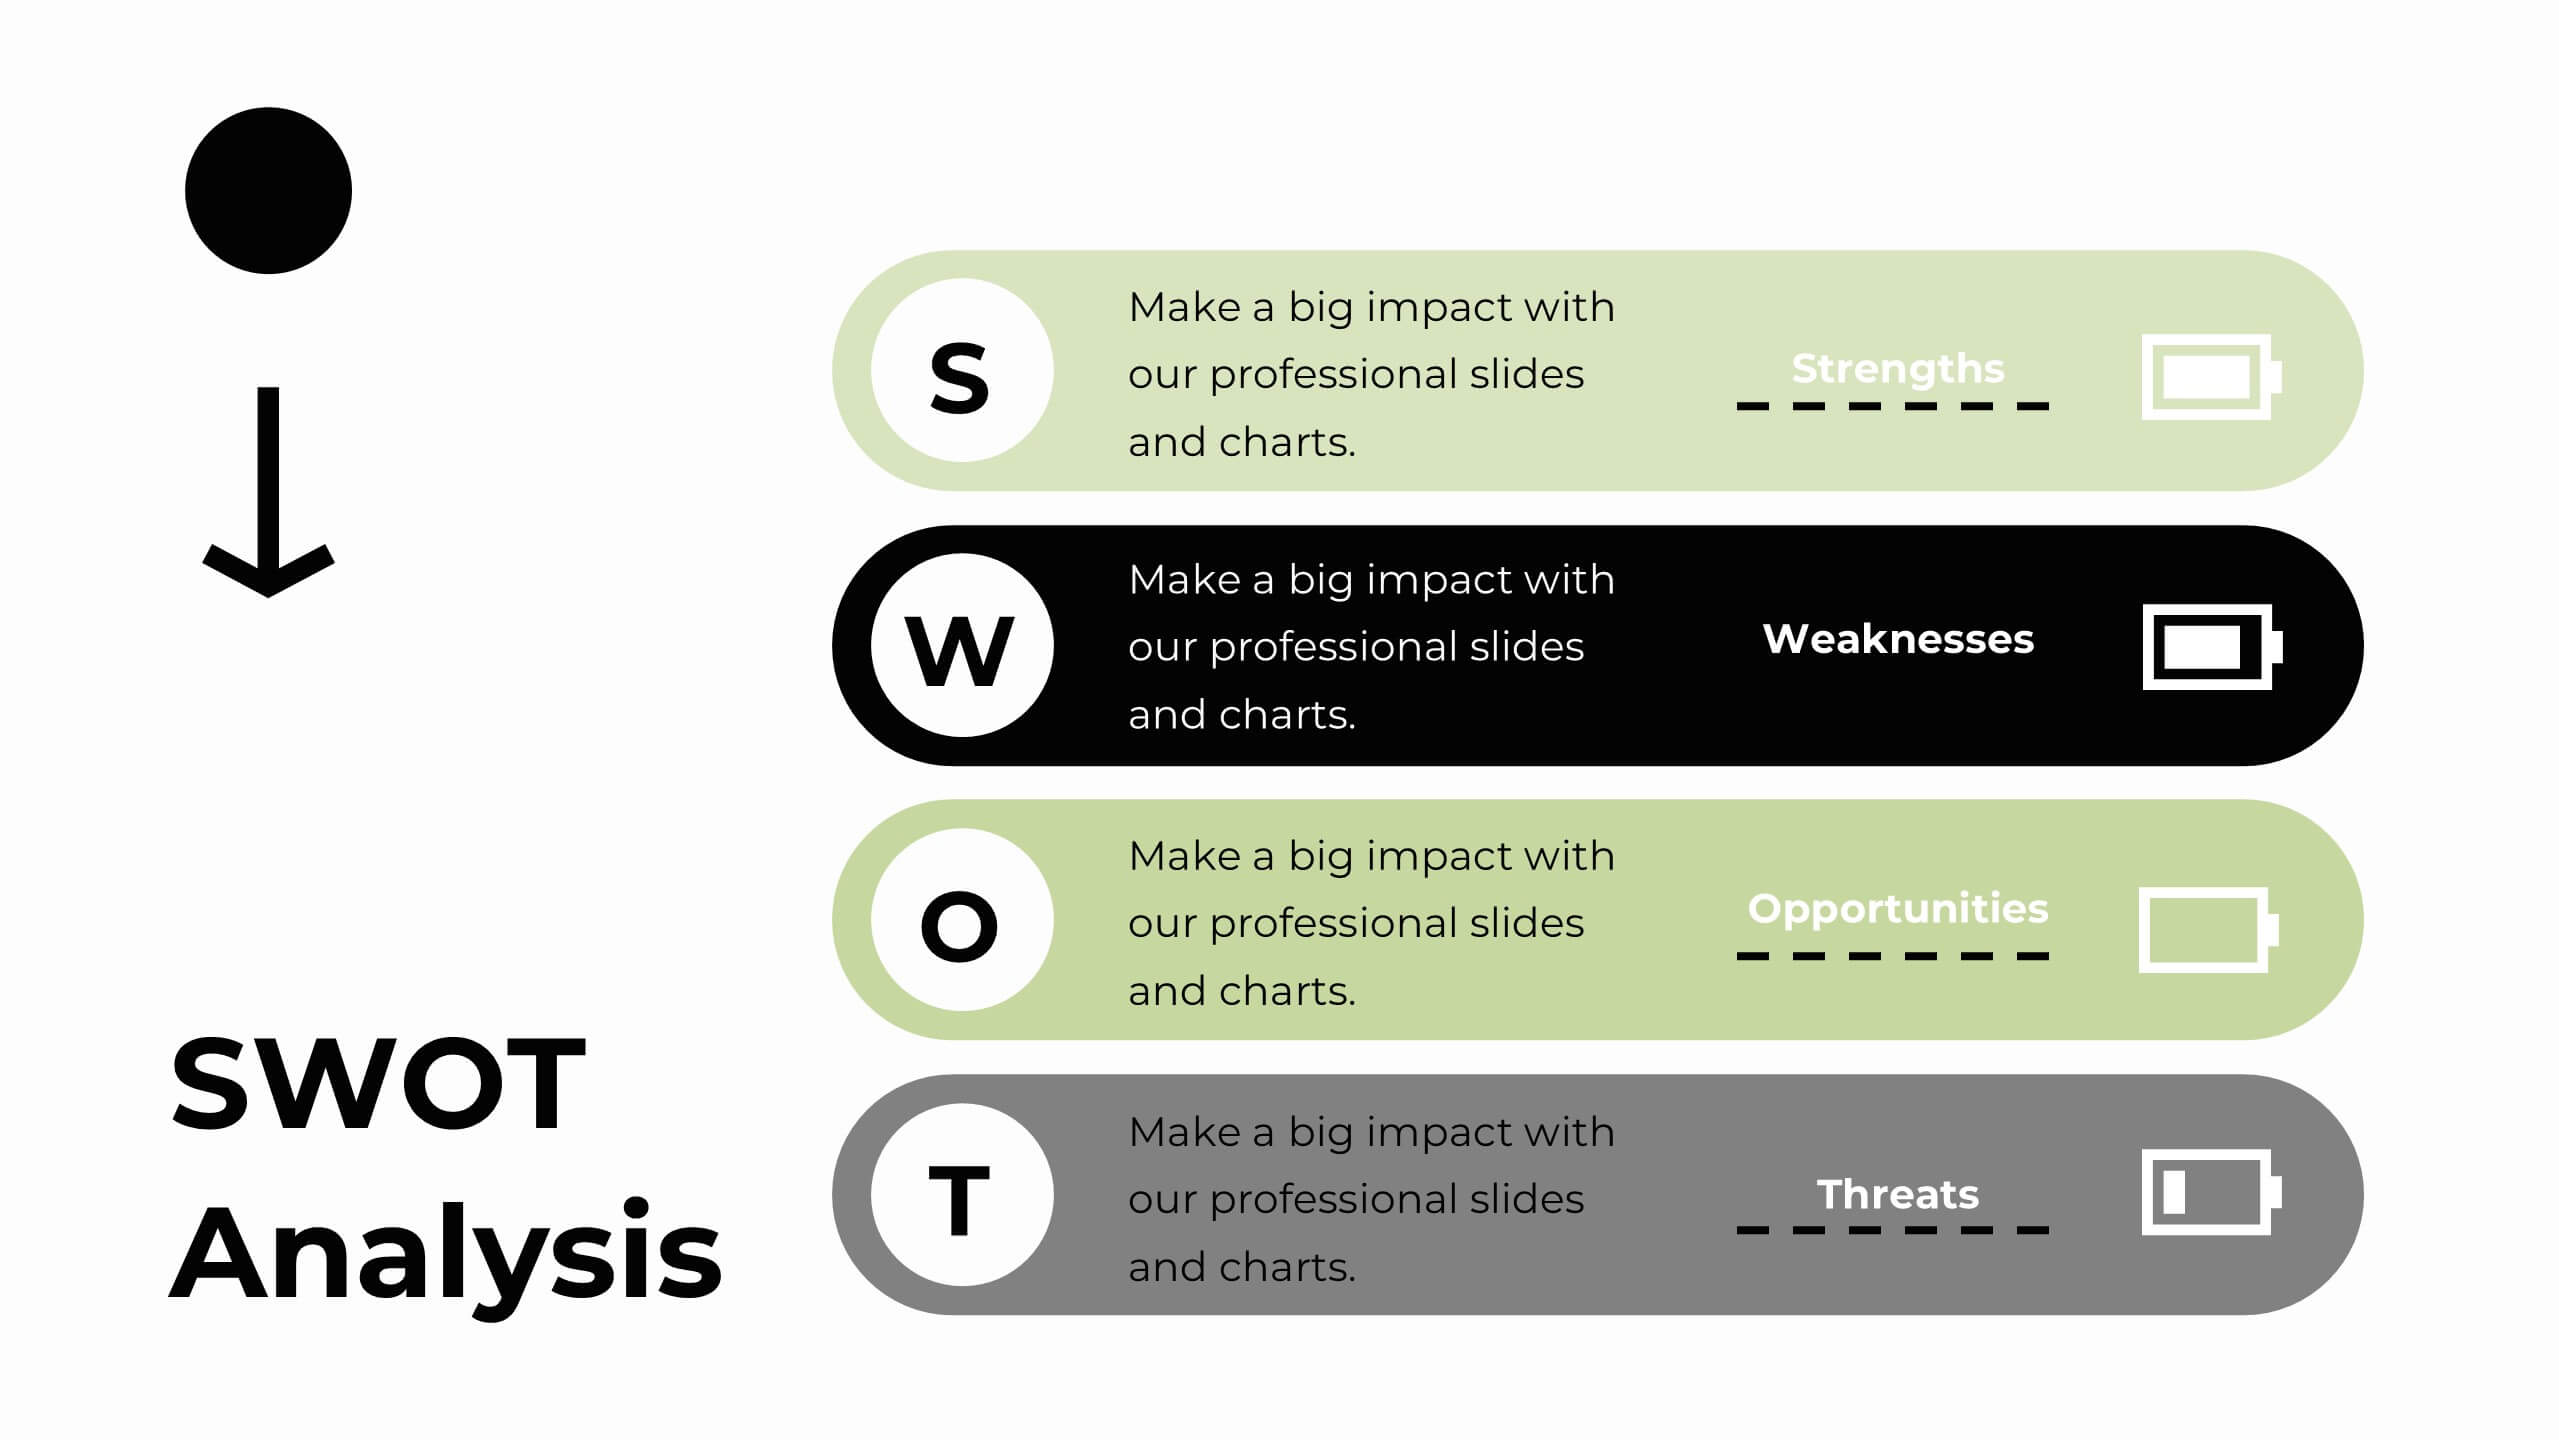
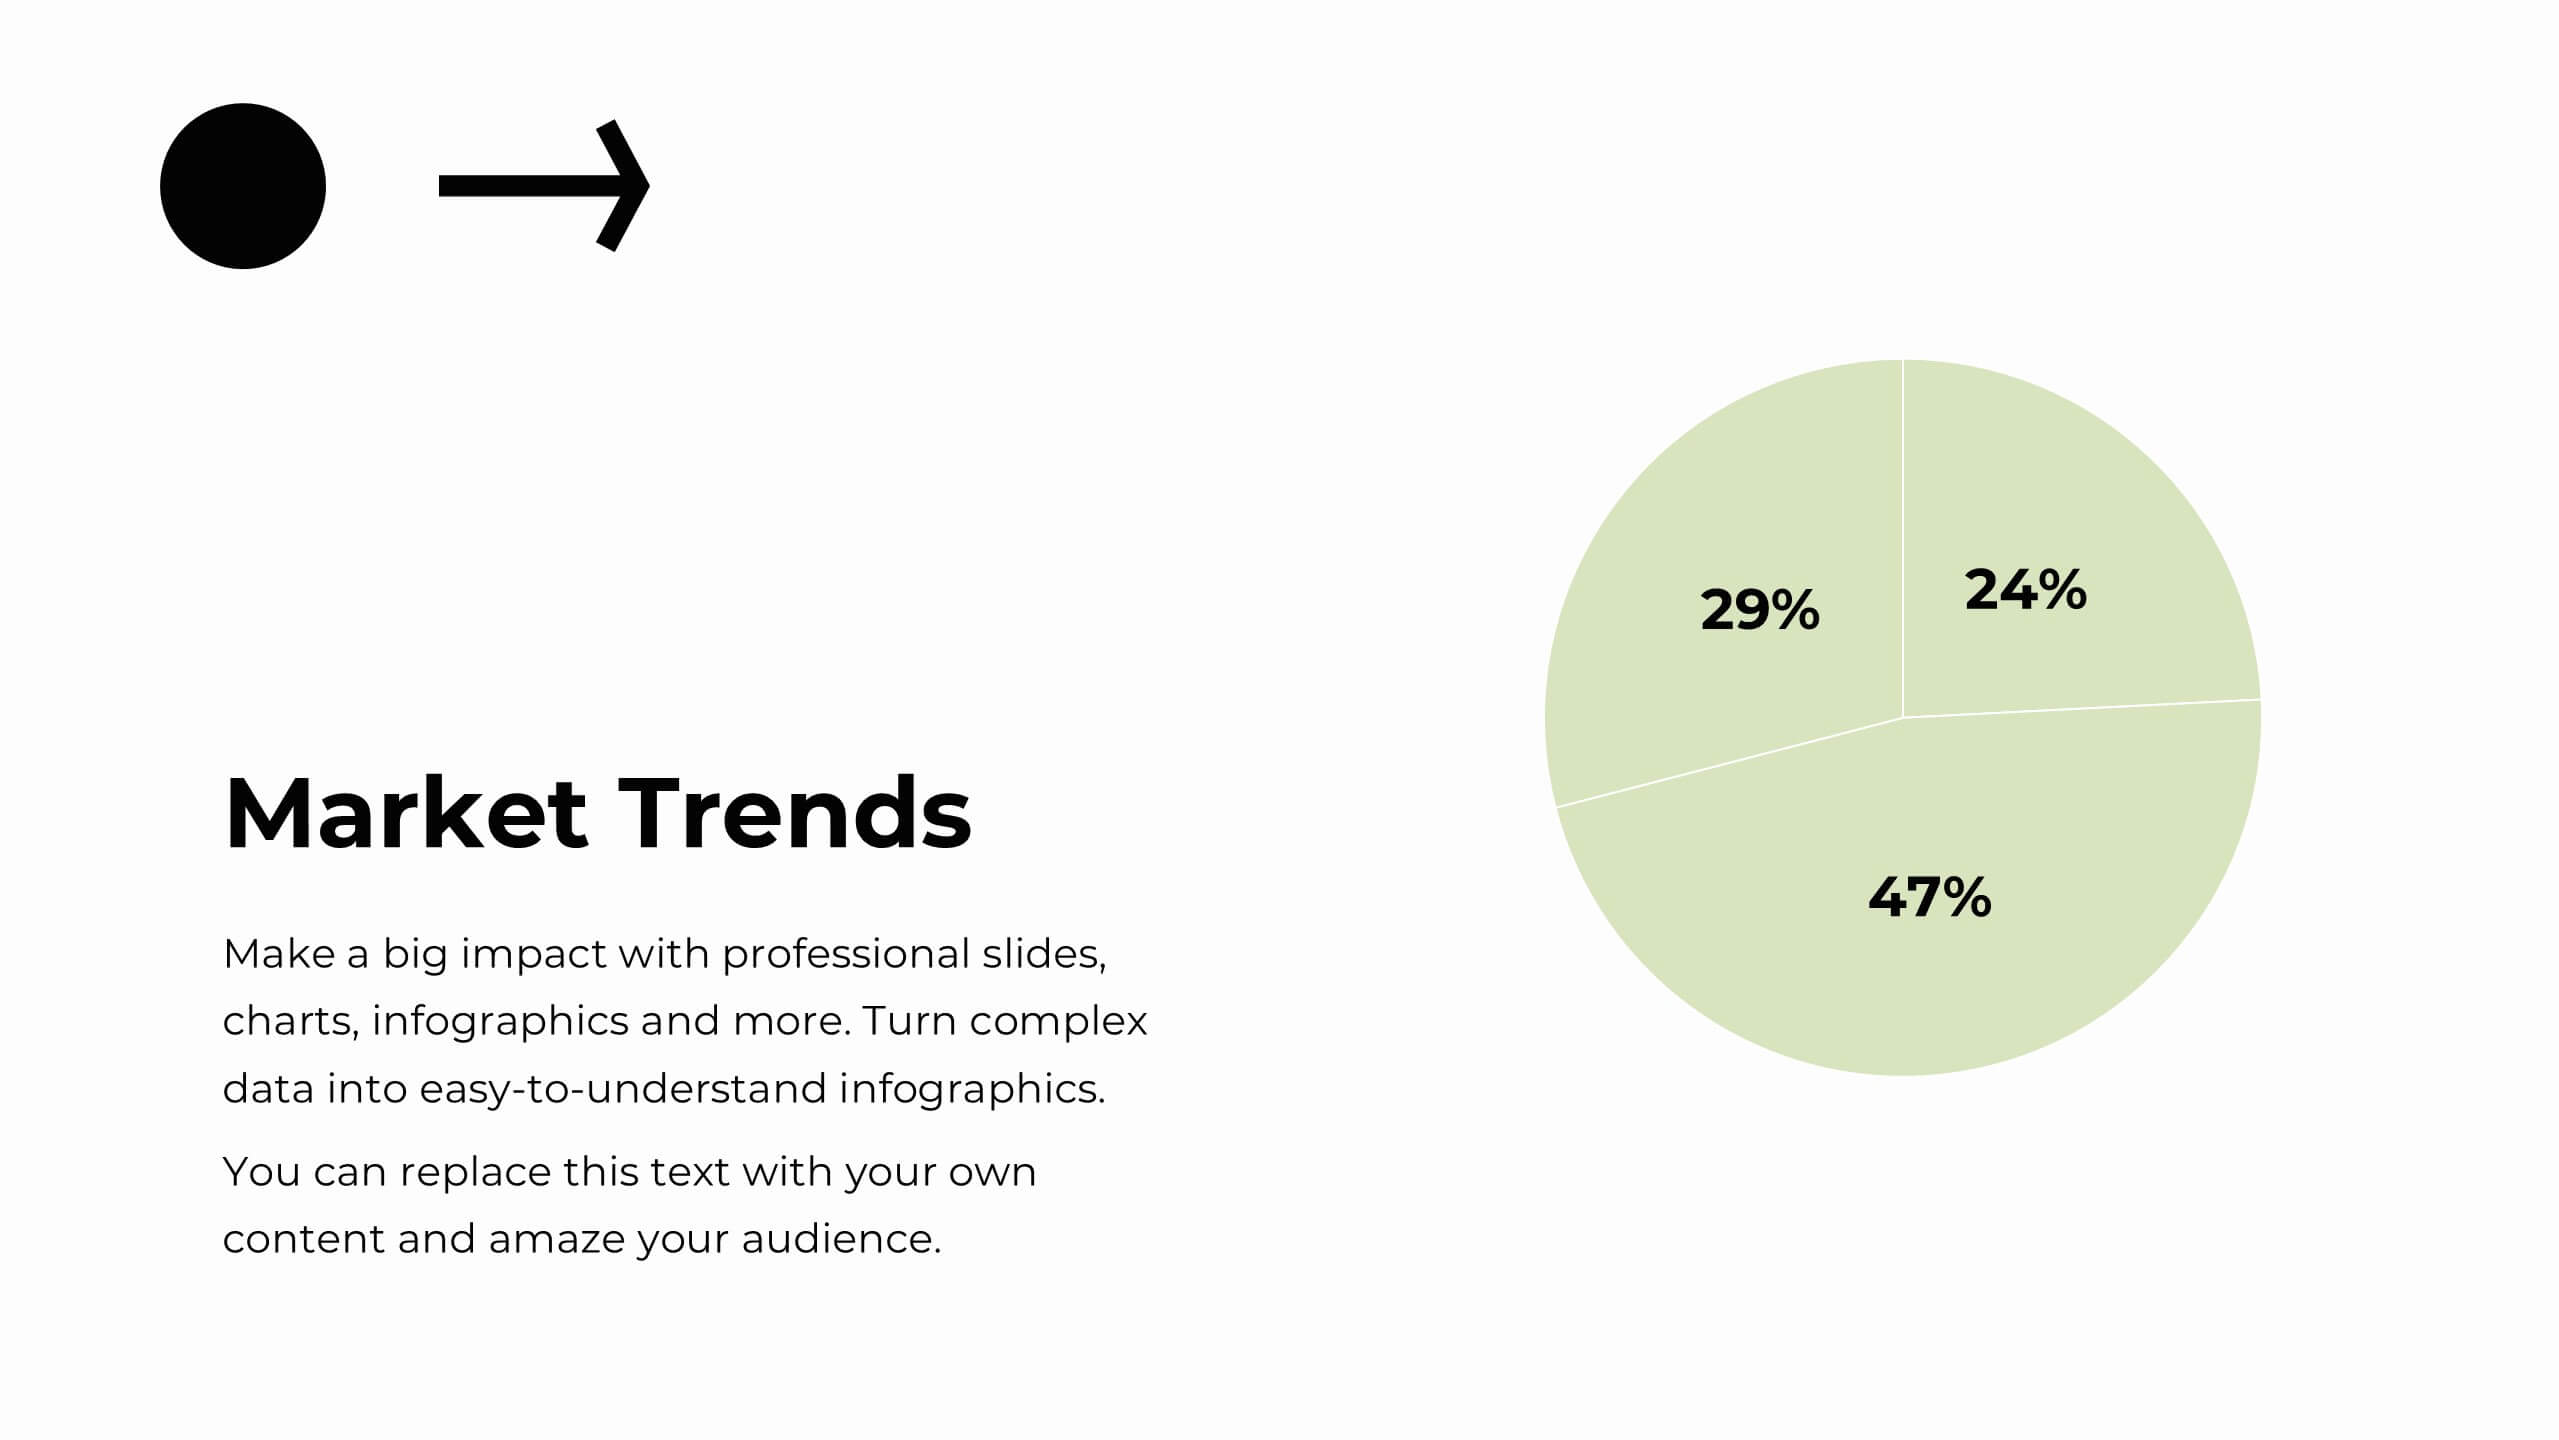
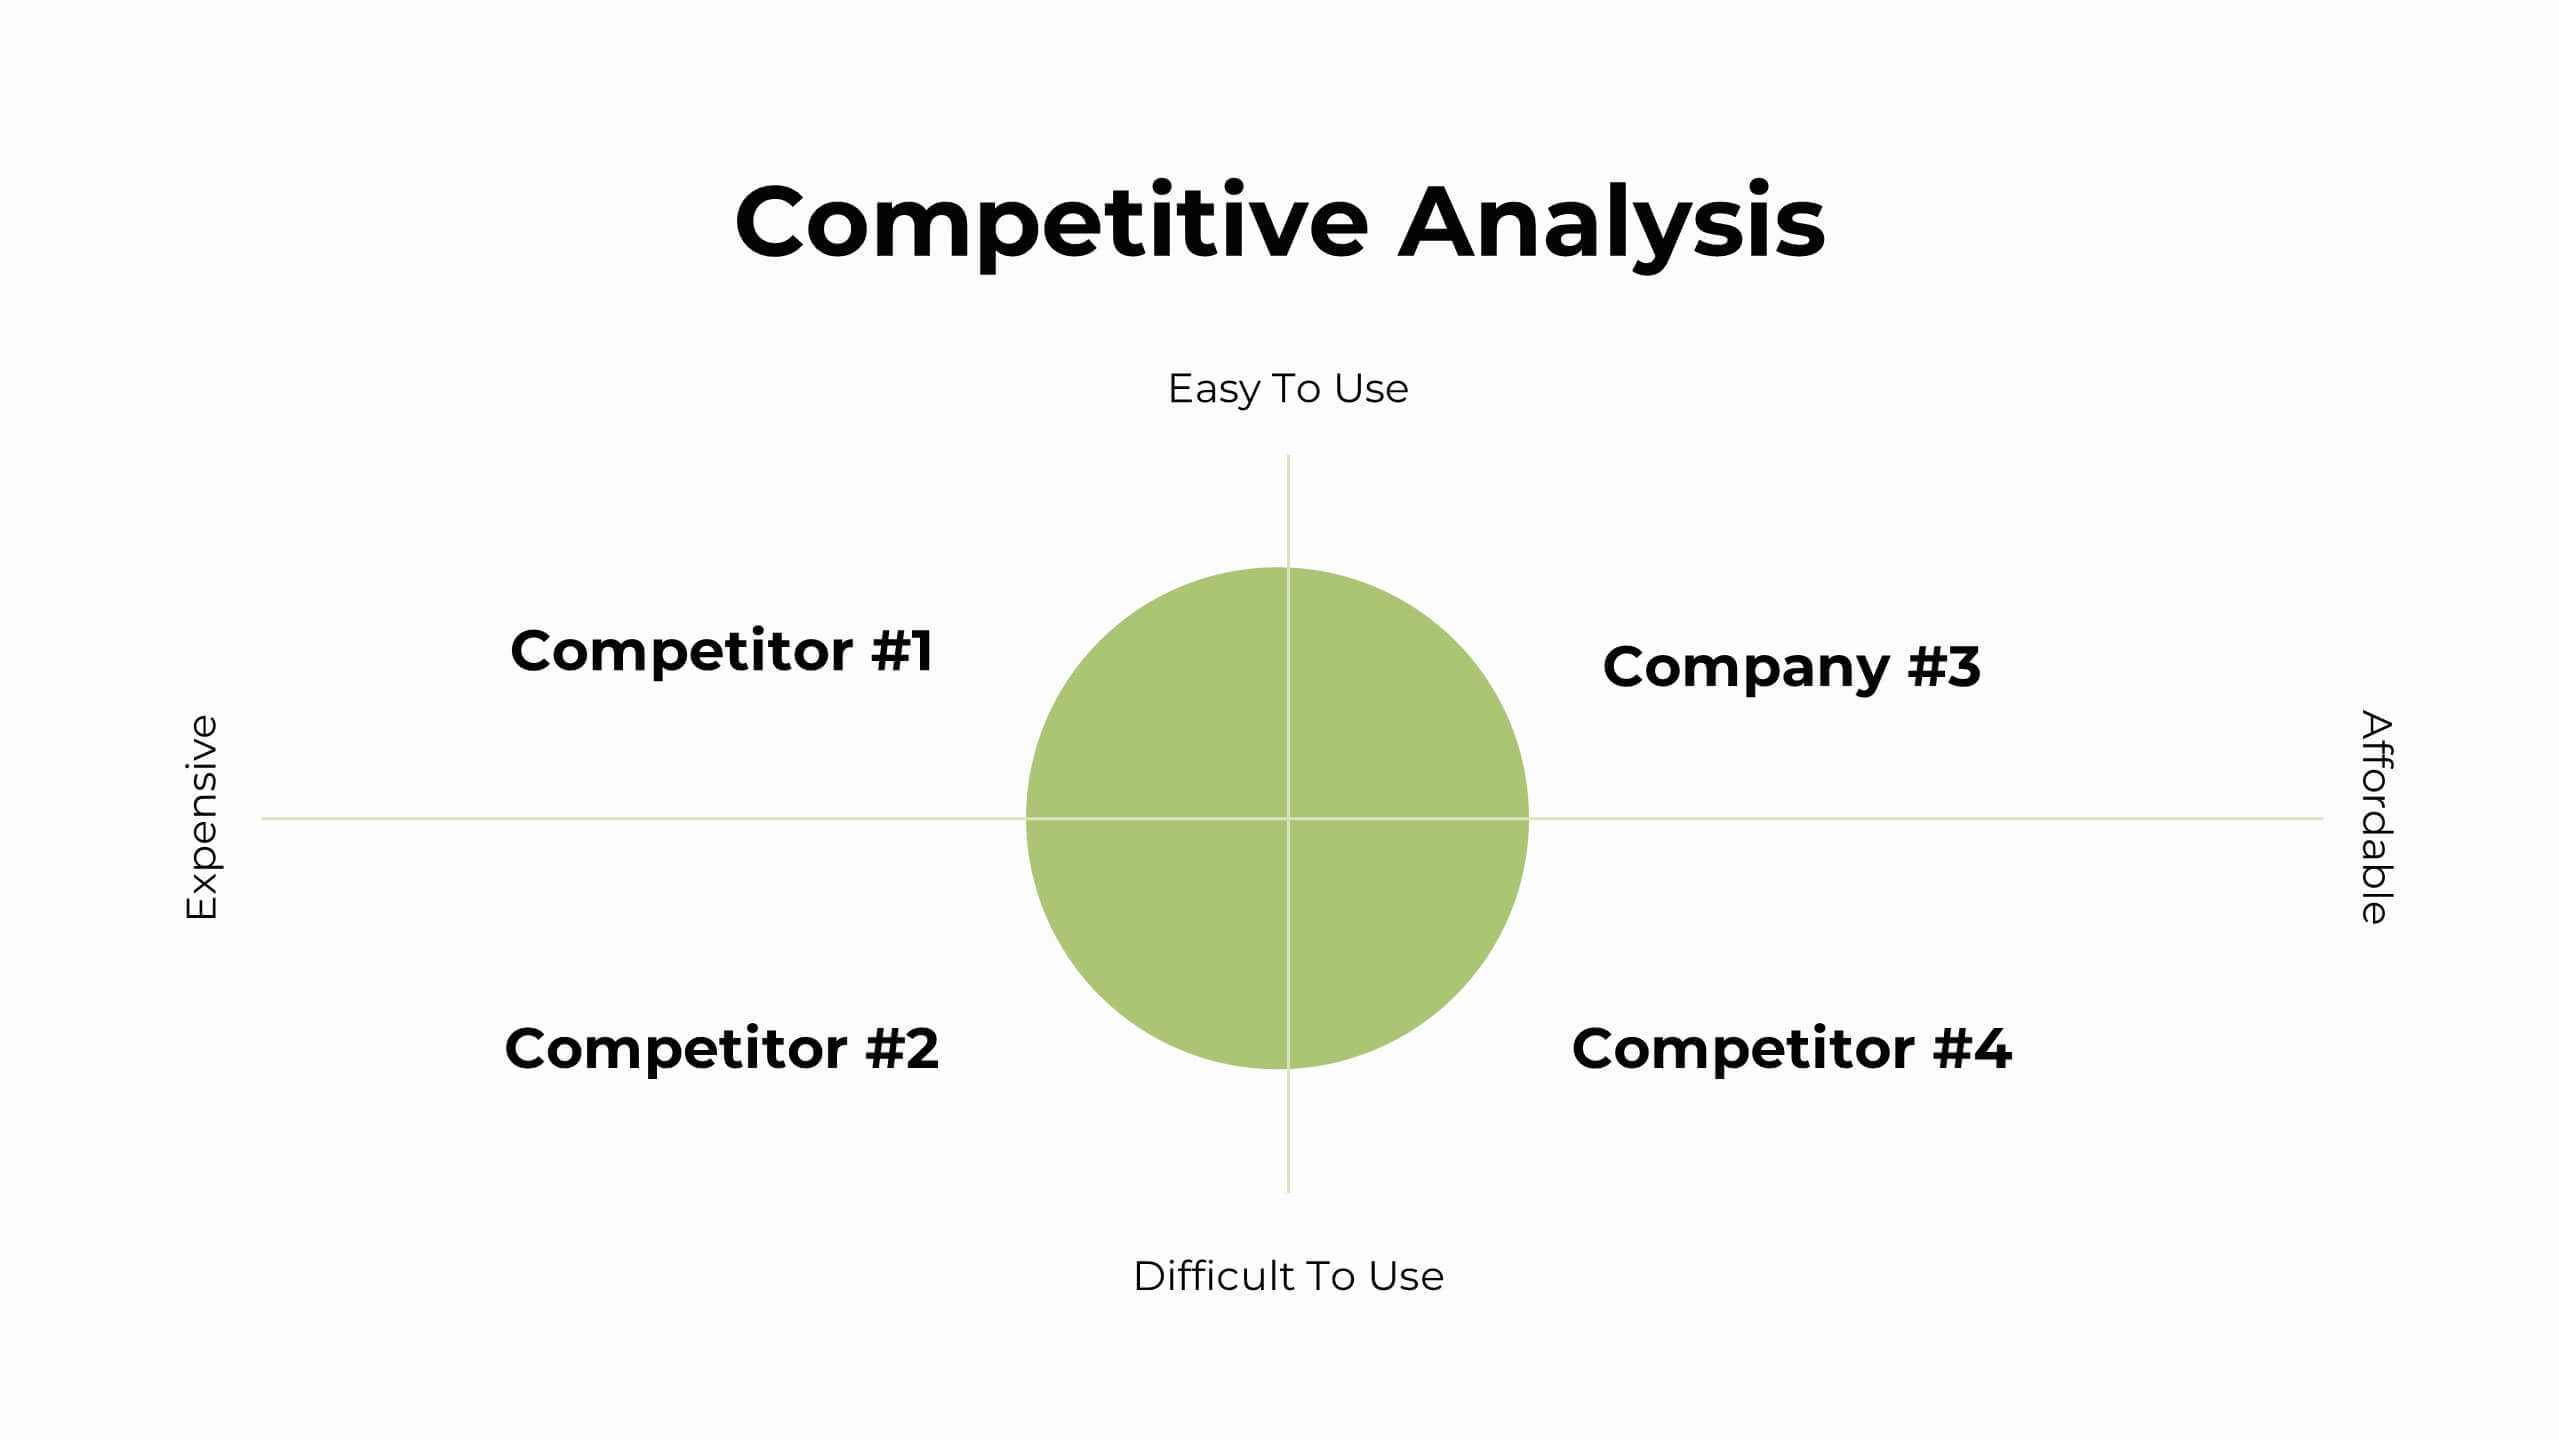
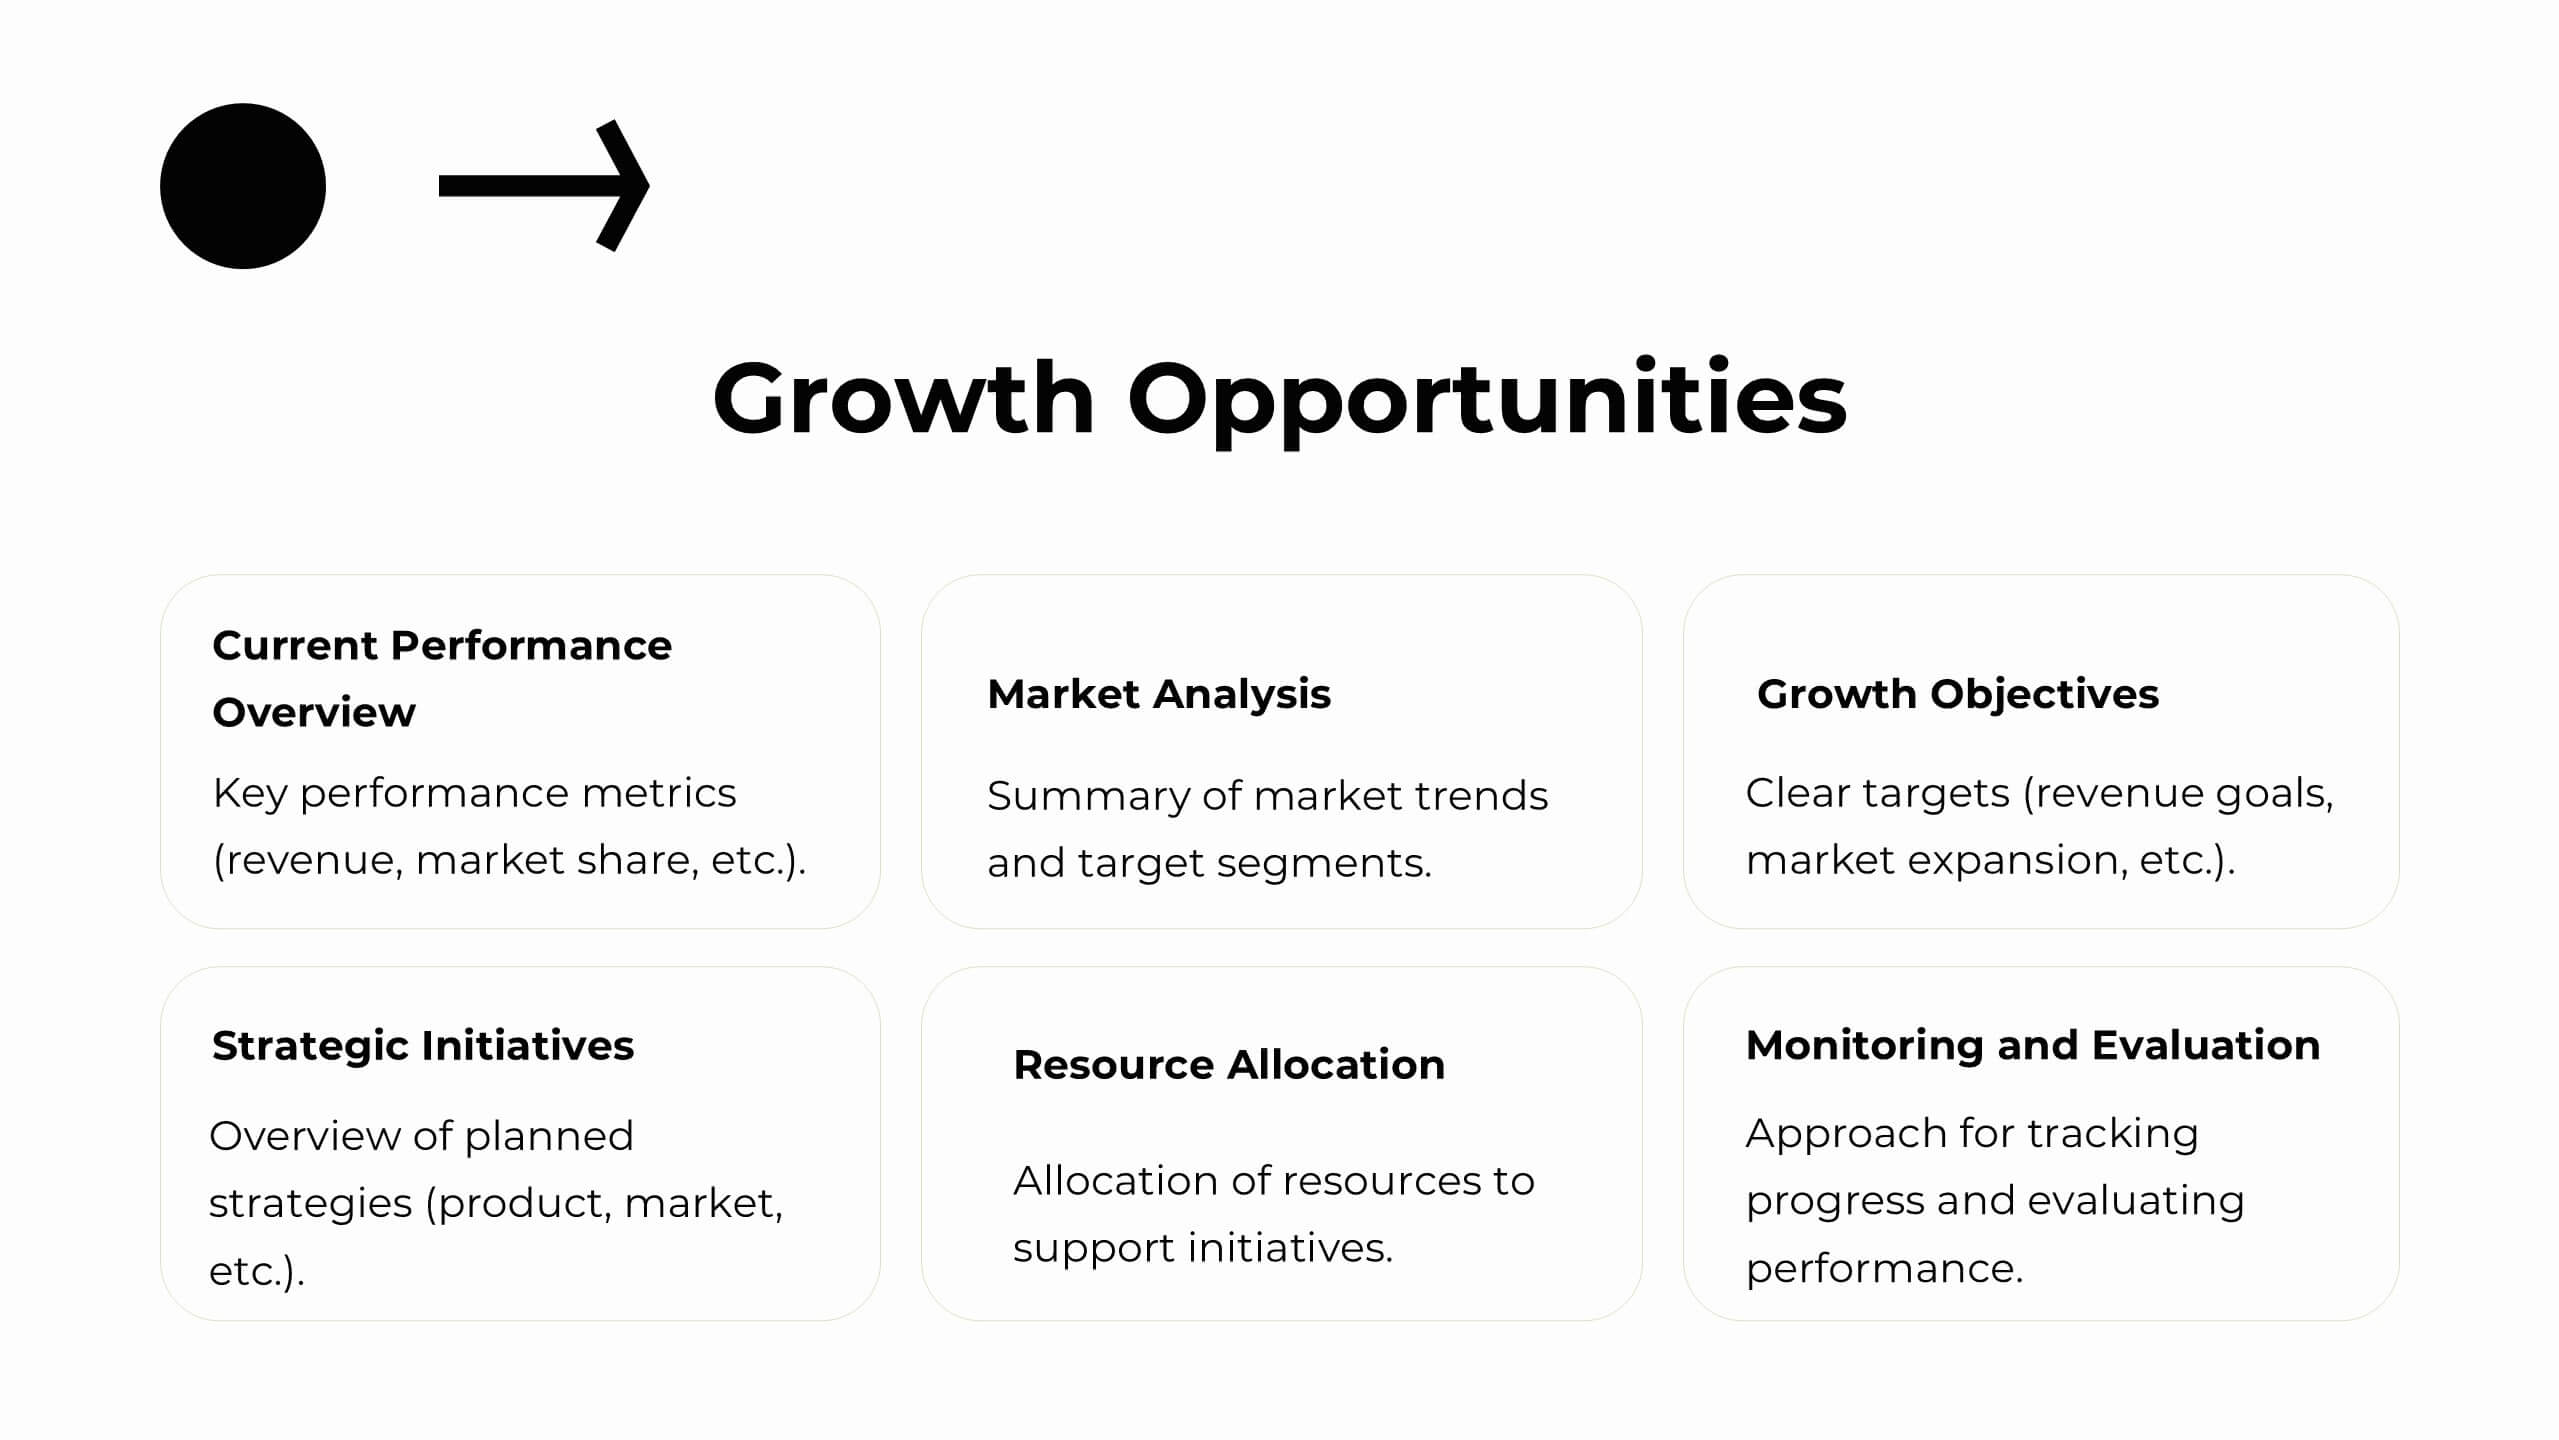
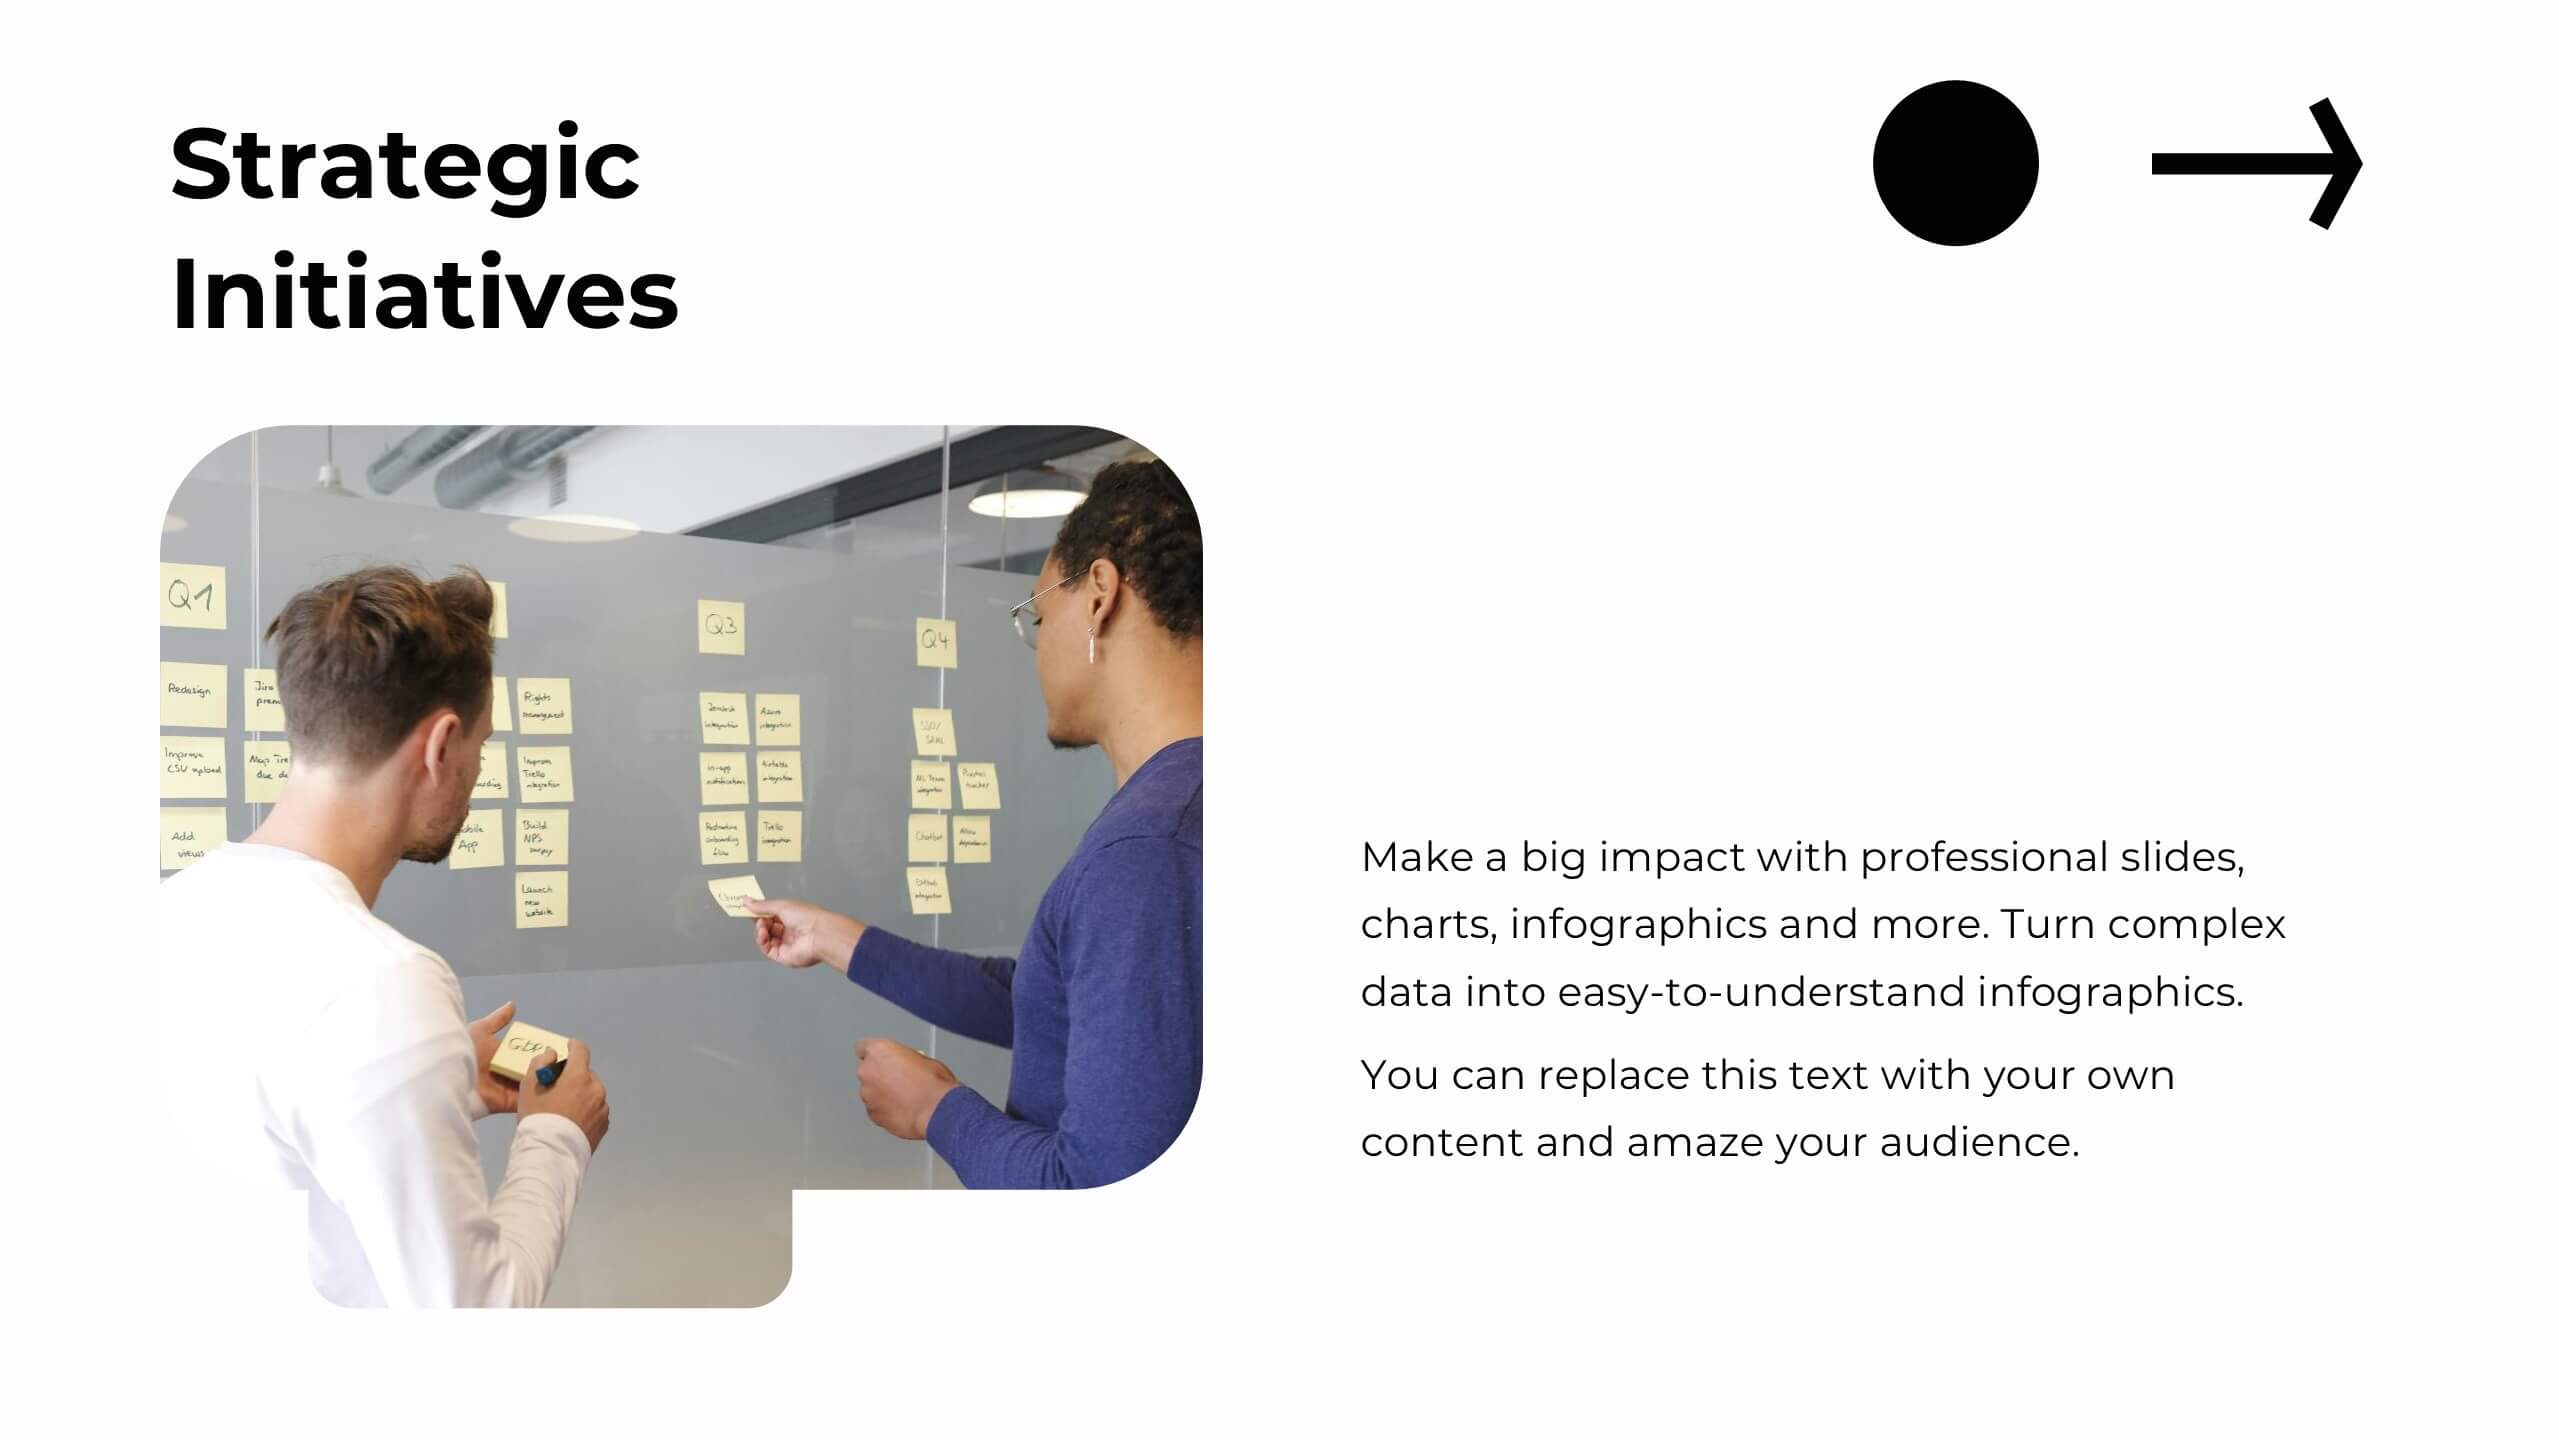
Zirconium Strategic Planning Report Presentation
Plan and present your strategies with precision using this comprehensive strategic planning report template! Designed for clear communication of goals, market trends, SWOT analysis, and growth opportunities, it’s perfect for aligning team objectives and driving success. Fully customizable and compatible with PowerPoint, Keynote, and Google Slides, this template is ideal for strategic initiatives and performance reviews.


21 slides
Luster Product Roadmap Presentation
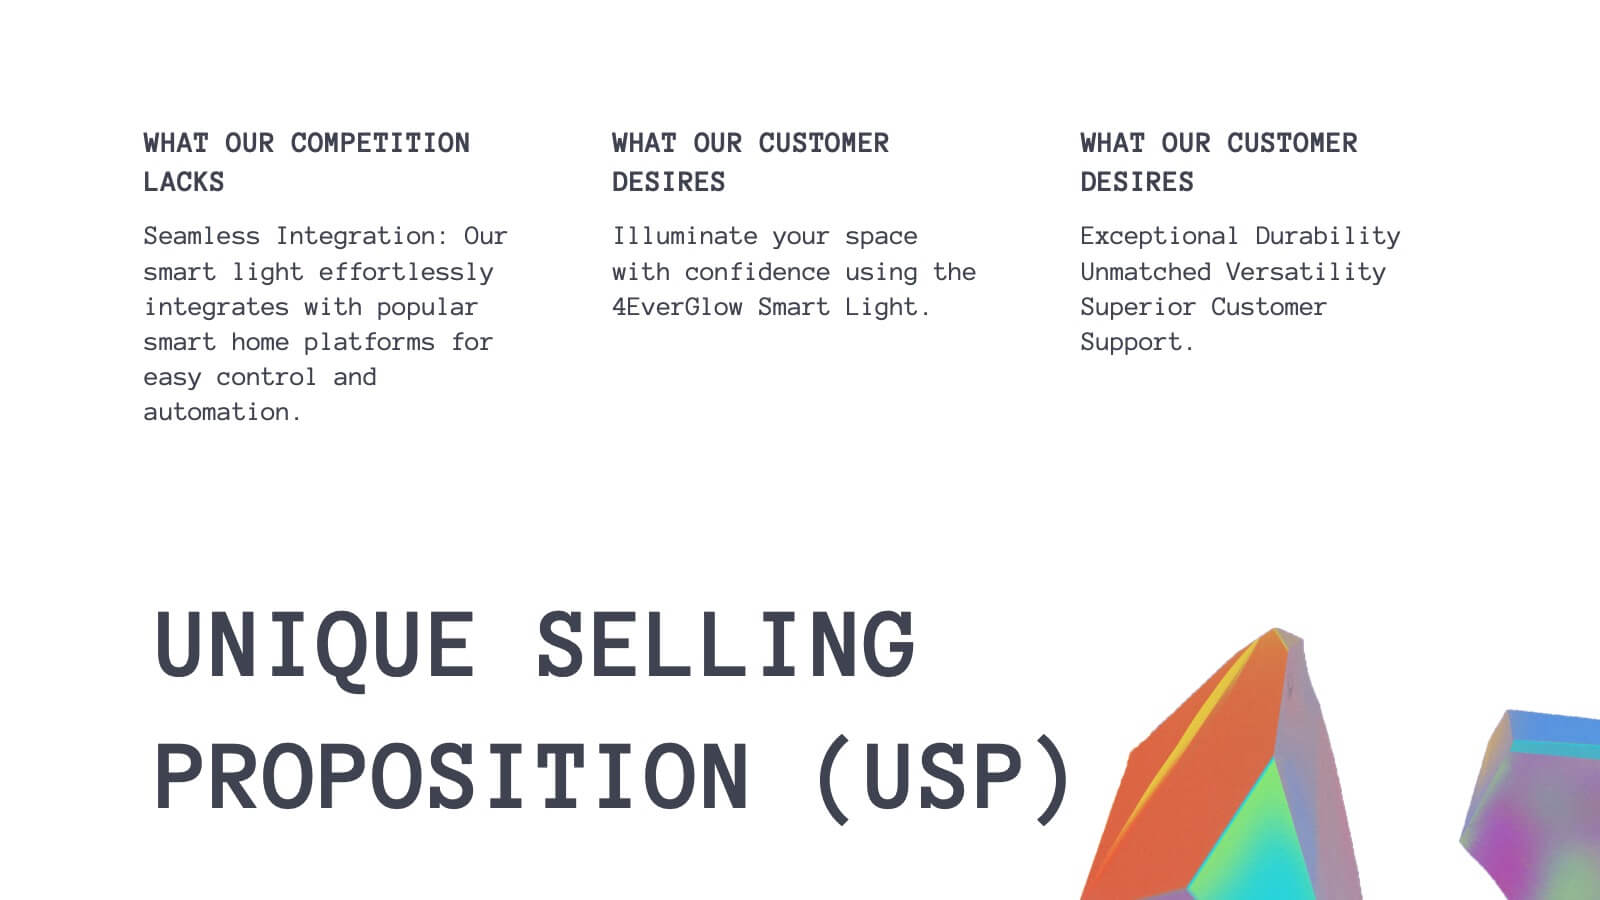
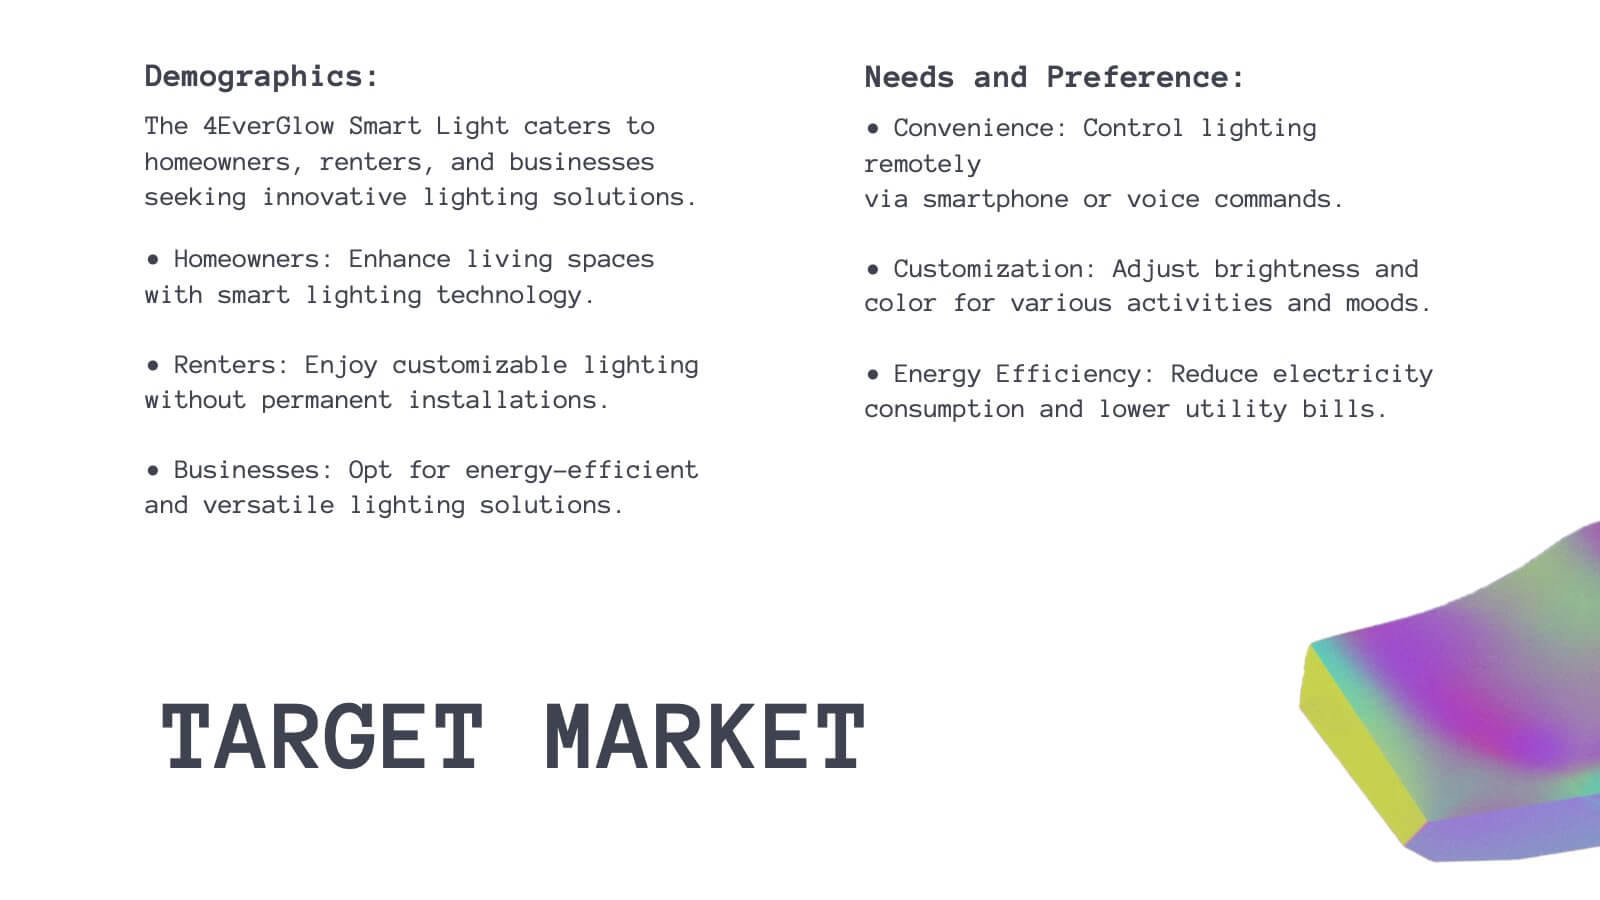
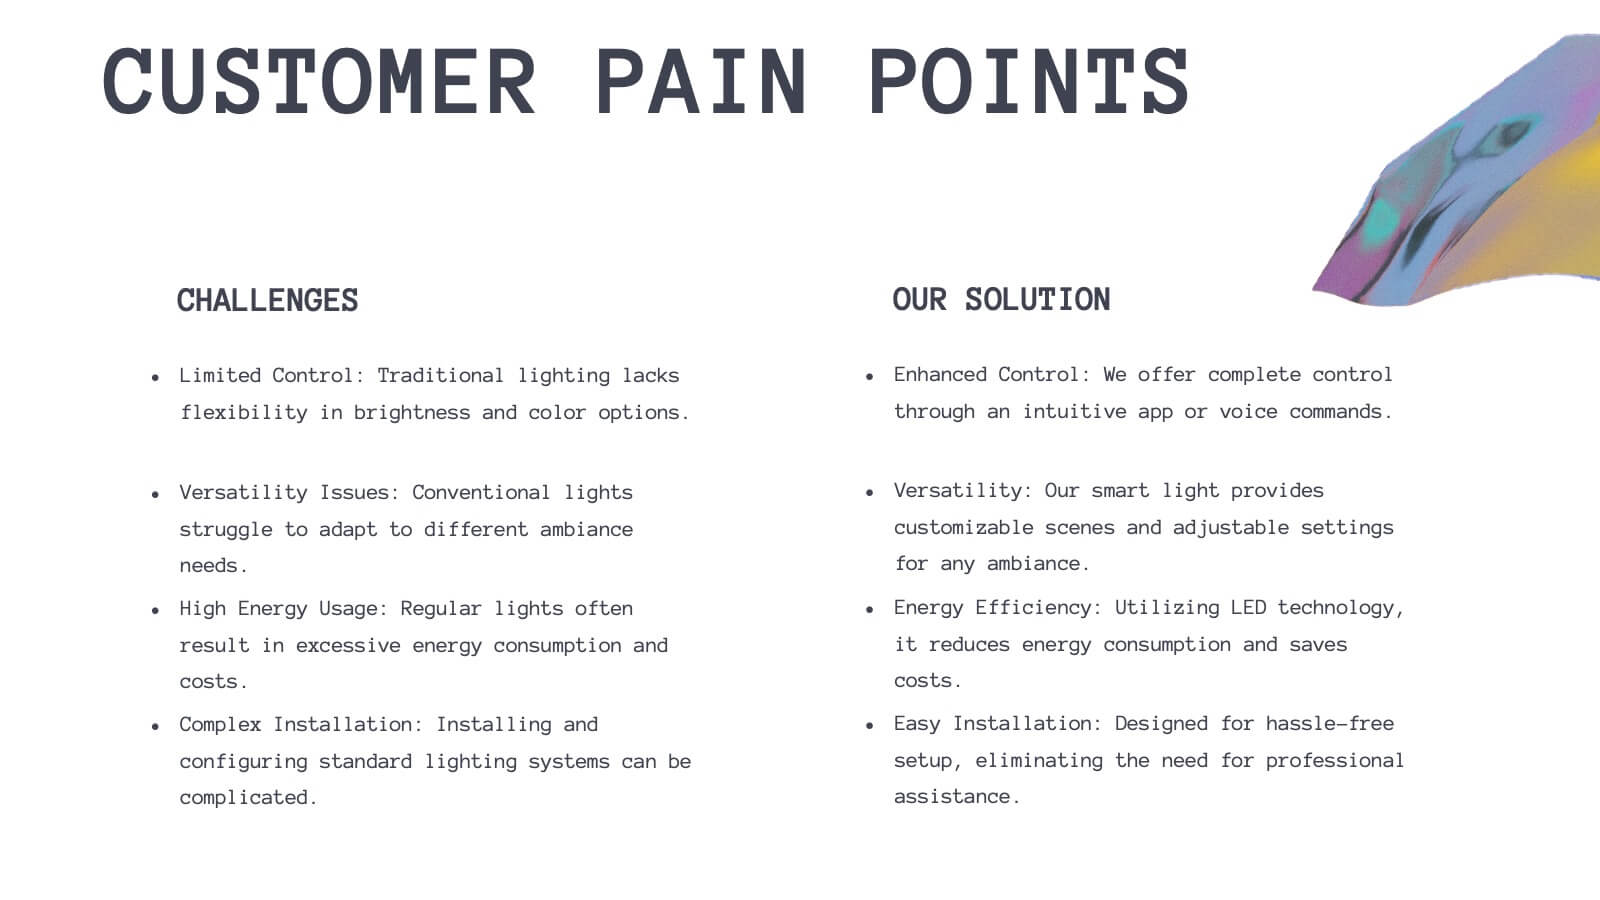
Bring your product journey to life with this vibrant, modern presentation template! Perfect for guiding your audience through product features, customer pain points, and competitive analysis, it’s designed for maximum clarity and engagement. Whether you’re showcasing technical specs or marketing strategies, this template fits all your needs. Compatible with PowerPoint, Keynote, and Google Slides.


6 slides
Real Estate and Building Development
Visualize the complete property development process with this modern, keyhole-inspired presentation design. Ideal for real estate developers, architects, and construction planners, this slide clearly outlines six project stages—from concept to completion—using bold icons and a radial layout. Editable in PowerPoint, Keynote, and Google Slides.


5 slides
IT Infrastructure and Architecture
Visualize your tech ecosystem with this layered pyramid infographic designed for showcasing IT infrastructure components. Ideal for CIOs, network architects, or IT consultants, this slide highlights five essential levels—from hardware to services. Fully editable in PowerPoint, Keynote, and Google Slides.


20 slides
Crescendo Creative Design Report Presentation
Transform your creative design report into a captivating presentation with a dynamic and professional template. This versatile format is tailored for designers, agencies, and creatives who want to showcase their design process, strategic approach, and project outcomes effectively. From design briefs and target audience insights to mood boards and prototypes, every slide is crafted to enhance clarity and visual appeal. Highlight unique elements, design systems, and implementation strategies with organized layouts that leave a lasting impression. Use the project timeline and feedback sections to narrate your journey and collaboration efforts seamlessly. Compatible with PowerPoint, Google Slides, and Keynote, this fully editable template adapts to your brand's needs. Engage stakeholders and clients with a polished, modern design that reflects your creative excellence.


10 slides
Social Media Marketing Growth Presentation
Boost your social media strategy with this dynamic infographic template! Perfect for illustrating marketing growth, engagement tactics, and content performance, it features an intuitive flow that simplifies complex data. Ideal for presentations to teams and clients, it’s fully customizable and works seamlessly with PowerPoint, Keynote, and Google Slides.


6 slides
McKinsey 7S Advantage Infographic
The McKinsey 7S model is a strategic management framework developed by consulting firm McKinsey & Company in the 1980s. This infographic template helps explain and understand the McKinsey 7S framework, a widely used management model for organizational effectiveness. This template provides an informative overview of the seven key elements of the framework, their interrelationships, and their impact on organizational performance. This template is designed for professionals, consultants, or anyone interested in understanding and applying the McKinsey 7S framework. Fully customizable and compatible with Powerpoint, Keynote, and Google Slides.


6 slides
Time Management Benefits Infographics
Unlock the benefits of effective time management with our Time Management Benefits infographic template. This template is fully compatible with popular presentation software like PowerPoint, Keynote, and Google Slides, allowing you to easily customize it to illustrate and communicate the advantages of mastering your time. The Time Management Benefits infographic template offers a visually engaging platform to highlight the positive outcomes of efficient time management, including increased productivity, reduced stress, improved work-life balance, and more. Whether you're a professional, student, or anyone looking to make the most of their time, this template provides a user-friendly canvas to create informative presentations and educational materials. Optimize your time management skills with this SEO-optimized Time Management Benefits infographic template, thoughtfully designed for clarity and ease of use. Customize it to showcase specific benefits, time-saving techniques, tools, and strategies for effective time management, ensuring that your audience understands the value of this essential skill. Start crafting your personalized infographic today to reap the rewards of improved time management.


8 slides
Effective Leadership Strategy
Visualize leadership pillars with this bold hexagonal layout designed to showcase four key components of effective leadership. Each colored segment allows you to present core strategies like vision, communication, decision-making, and team empowerment. Perfect for business training, organizational development, or executive briefings. Fully customizable in PowerPoint, Keynote, and Google Slides.


23 slides
Pyroverse Photography Portfolio Presentation
Showcase your creative work effortlessly with this meticulously designed photography portfolio template. Tailored for photographers, this presentation highlights your style, achievements, and projects in a visually compelling format that speaks to your audience. This portfolio template includes dedicated slides for introducing your philosophy, showcasing your creative process, and presenting your best projects with high-impact layouts. Highlight client testimonials, collaborations, and awards to establish credibility and attract new clients. Additional slides for services, contact information, and social media links make it easier to connect with your audience. Compatible with PowerPoint, Google Slides, and Keynote, this template is fully customizable, allowing you to tailor it to your branding needs. Perfect for professional photographers, freelancers, and studios, this template ensures your portfolio stands out in a competitive market. Present your work with confidence and make a lasting impression with this professional design.


6 slides
Cash Management Strategy Presentation
Break down your financial priorities with a bold, visual approach. This cash management slide uses a segmented dollar symbol to represent key areas like budgeting, reserves, expenses, and more—making it easy to track strategy points at a glance. Ideal for finance teams, planning sessions, or investor decks. Compatible with PowerPoint, Keynote, and Google Slides.


4 slides
Sustainability in Water Conservation Presentation
Highlight your eco-initiatives with this visually engaging Sustainability in Water Conservation presentation. Featuring a puzzle-style water drop diagram, this slide helps communicate four core strategies or ideas clearly and effectively. The clean layout and modern icons ensure your message is both professional and impactful, making it ideal for presentations on sustainability goals, environmental education, or water-saving initiatives. Fully editable and compatible with PowerPoint, Keynote, and Google Slides.