


Features
- 7 Unique Slides
- Fully editable and easy to edit in Microsoft Powerpoint, Keynote and Google Slides
- 16:9 widescreen layout
- Clean and professional designs
- Export to JPG, PDF or send by email


Do you have any questions?
Recommend


7 slides
Social Media Marketing Infographic
Social Media Marketing refers to the use of social media platforms and networks to promote a product, service, or brand. This fully editable, infographic template looks great on all devices and contains all complete set of slides shown above. You can use this colorful infographic to features tips on how to use social media posts, videos, chats and websites along with a brief explanation of each. Add your logo, banner images and call to action. The template is compatible with Powerpoint, Keynote and Google Slides, so you can easily add in your custom data for a professional finish.


5 slides
Strategic Planning with Concentric Circles
Draw your audience in with a visual that’s as focused as your message! This strategic concentric circles template helps you map out layered priorities, interconnected goals, or phased strategies in a clean, compelling way. Fully customizable and compatible with PowerPoint, Keynote, and Google Slides for seamless presentation design.


10 slides
Effective Team Communication Presentation
Streamline your Effective Team Communication with this modern infographic template. Designed to enhance collaboration and workflow clarity, this slide helps visualize key communication strategies for better team efficiency. Fully customizable in PowerPoint, Keynote, and Google Slides, making it perfect for corporate training, leadership meetings, and project planning.


5 slides
Types of Coffee Infographics
There are many different types of coffee, with varying tastes and brewing methods. This template features unique vertical Infographics as visual representation of different types of coffee that are popular in various parts of the world. These are designed to provide information on the different types of coffee, their origins, brewing methods, and taste profiles. You can also provide information on the ingredients used to make the coffee, such as the milk, cream, and sugars. These infographics are very visually pleasing, the icons, images, and color schemes are associated with coffee. Include your statistics on the popularity of different types of coffee and how they are consumed!


4 slides
Lean Agile Implementation Roadmap Presentation
Present your Lean Agile journey with this upward roadmap diagram. Designed for project managers and Agile teams, this layout visualizes four progressive stages using icons and curved arrows. Ideal for showcasing phased adoption, sprint milestones, or transformation goals. Fully customizable in PowerPoint, Keynote, and Google Slides for easy adaptation.


5 slides
Residential Market Trends Overview Presentation
Track market insights with clarity using the Residential Market Trends Overview Presentation. Featuring a clean, linear layout with four content points and a central house icon, this slide is ideal for showcasing housing data, price trends, investment insights, or neighborhood developments. Fully editable in Canva, PowerPoint, Keynote, and Google Slides—perfect for real estate pros, analysts, or urban planners.


2 slides
Mission Statement Slide Layout Presentation
Spark inspiration from the very first slide with a clean, modern layout that brings your core purpose to life. This presentation helps you communicate vision, values, and organizational direction in a clear, engaging format that resonates with any audience. Fully compatible with PowerPoint, Keynote, and Google Slides.


5 slides
Business Vision Statement Presentation
Focus on the future with our "Business Vision Statement" presentation template, ideal for outlining your company's aspirations. This visually engaging template helps you present your business's core values and long-term goals, ensuring alignment across the organization. Perfect for strategic meetings and stakeholder presentations, it is compatible with PowerPoint, Keynote, and Google Slides. This template is a crucial tool for leaders looking to inspire and direct their teams towards common objectives.


5 slides
Construction Processes Infographics
Dive into the construction industry with this detailed infographic template that provides a comprehensive overview of construction processes, careers, and competitive strategies. Ideal for professionals, educators, and students involved in construction, this resource offers a clear and structured presentation of various aspects of the field. The infographic is divided into sections detailing key areas such as industry sectors, job roles, and strategic approaches for sustainable competitiveness. It highlights important segments like planning, finance, legal aspects, and on-site construction activities, all designed to give a well-rounded view of the construction process. Additionally, it includes data on job growth, employment statistics, and future projections, which are crucial for understanding labor market trends within the construction sector. Vibrant colors and easy-to-understand layouts make this template not only informative but also visually appealing. Whether used in training sessions, academic courses, or professional presentations, this infographic is a valuable tool for conveying the dynamic and multifaceted nature of the construction industry.


20 slides
Cometis Small Business Pitch Deck Presentation
Introduce your business effectively with this pitch deck template, crafted for small businesses seeking impactful presentations. From company overview to objectives and strategies, this design is tailored to highlight your key messages. Dive into sections such as business highlights, team introductions, and future goals while maintaining a professional flow. This template includes callout slides, break announcements, and customizable placeholders for your brand visuals and content. Ideal for pitching ideas to stakeholders or presenting at workshops, it ensures clarity and engagement. Compatible with PowerPoint, Google Slides, and Keynote, it offers flexibility across platforms.


8 slides
Africa Development & Market Potential Presentation
Showcase regional opportunities with the Africa Development & Market Potential Presentation. This professional slide highlights four key countries across the continent using vibrant map markers and icons, ideal for data comparison, investment potential, or development tracking. Cleanly structured and easy to edit in PowerPoint, Keynote, Google Slides, and Canva.


5 slides
Africa Country Borders Presentation
Bring geography to life with a clean, modern map design that highlights country boundaries and key regions across Africa. Perfect for showcasing regional data, market analysis, or project coverage, this layout ensures clarity and precision. Fully compatible with PowerPoint, Keynote, and Google Slides for easy customization and use.


21 slides
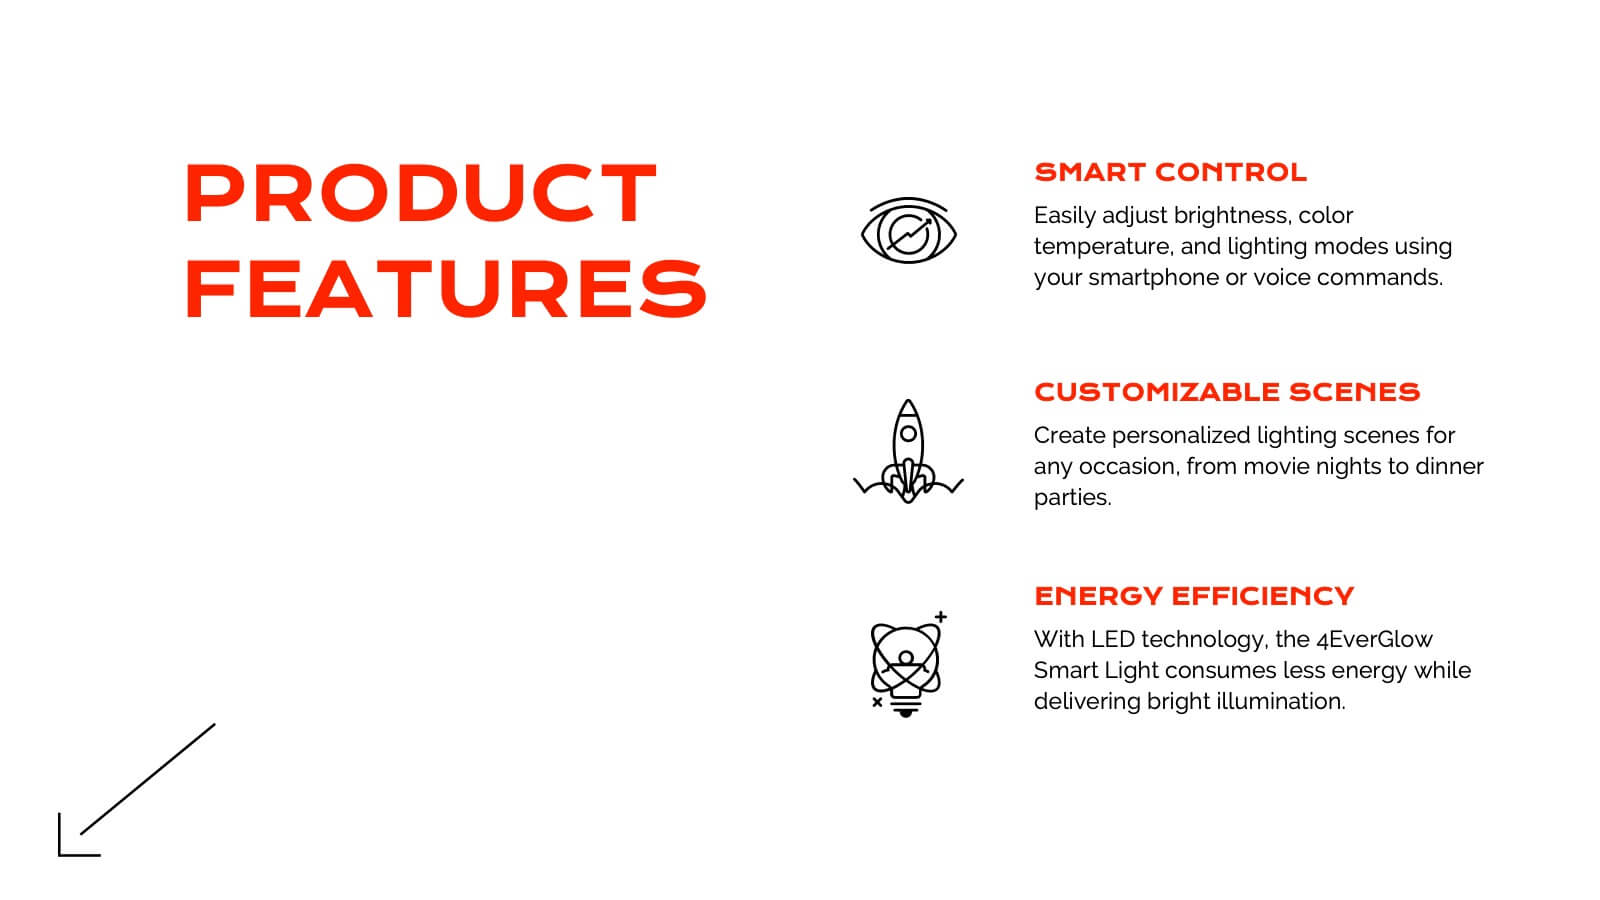
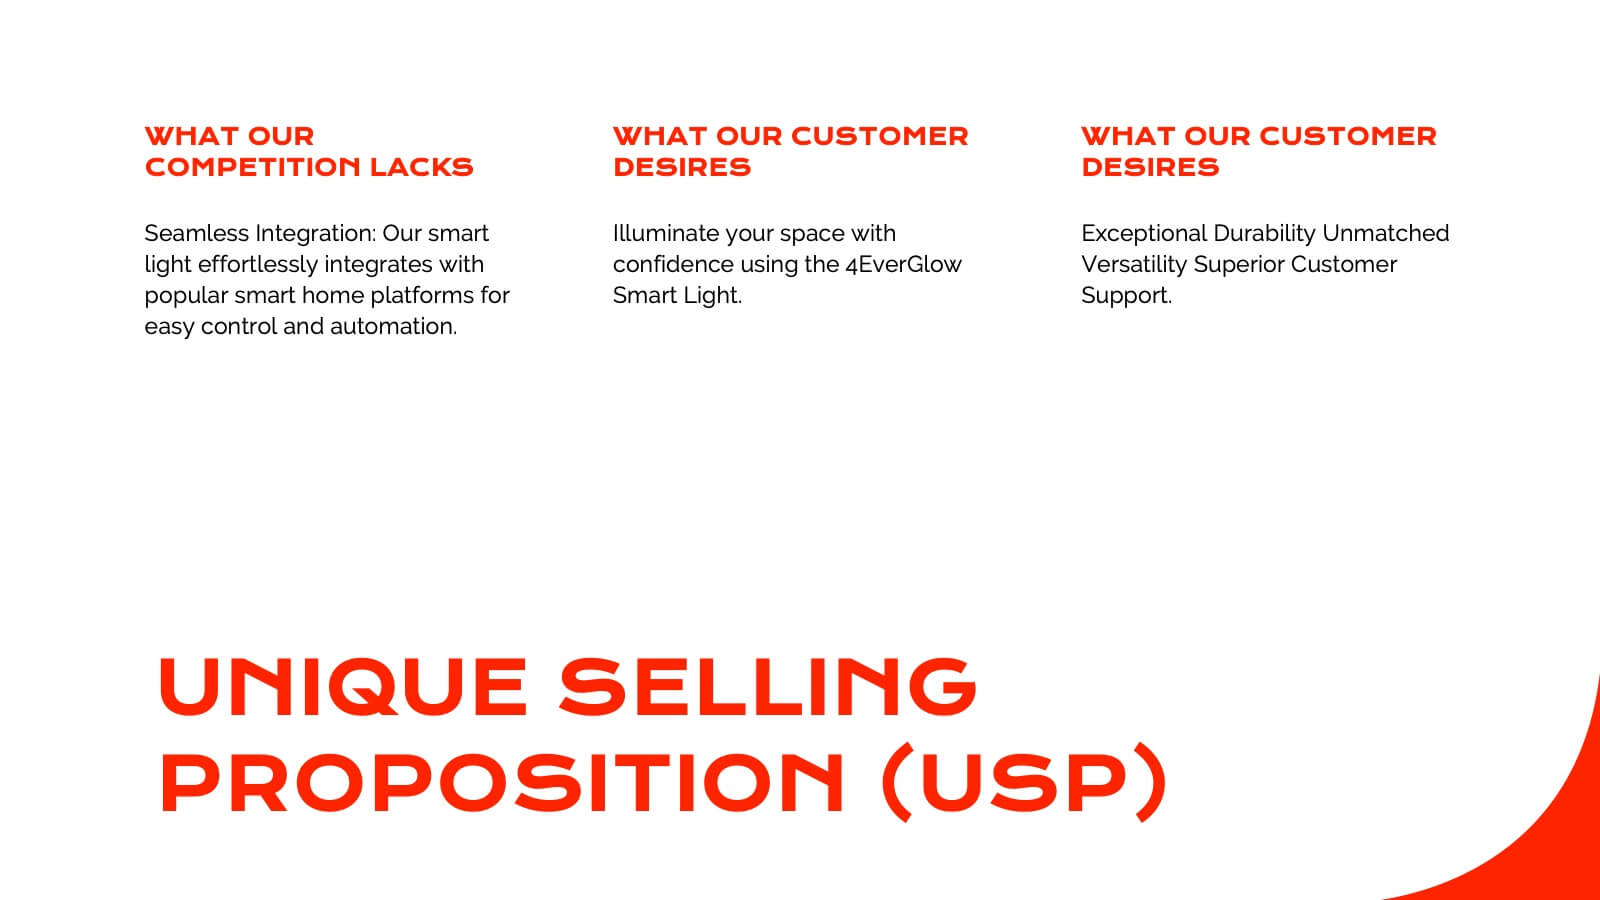
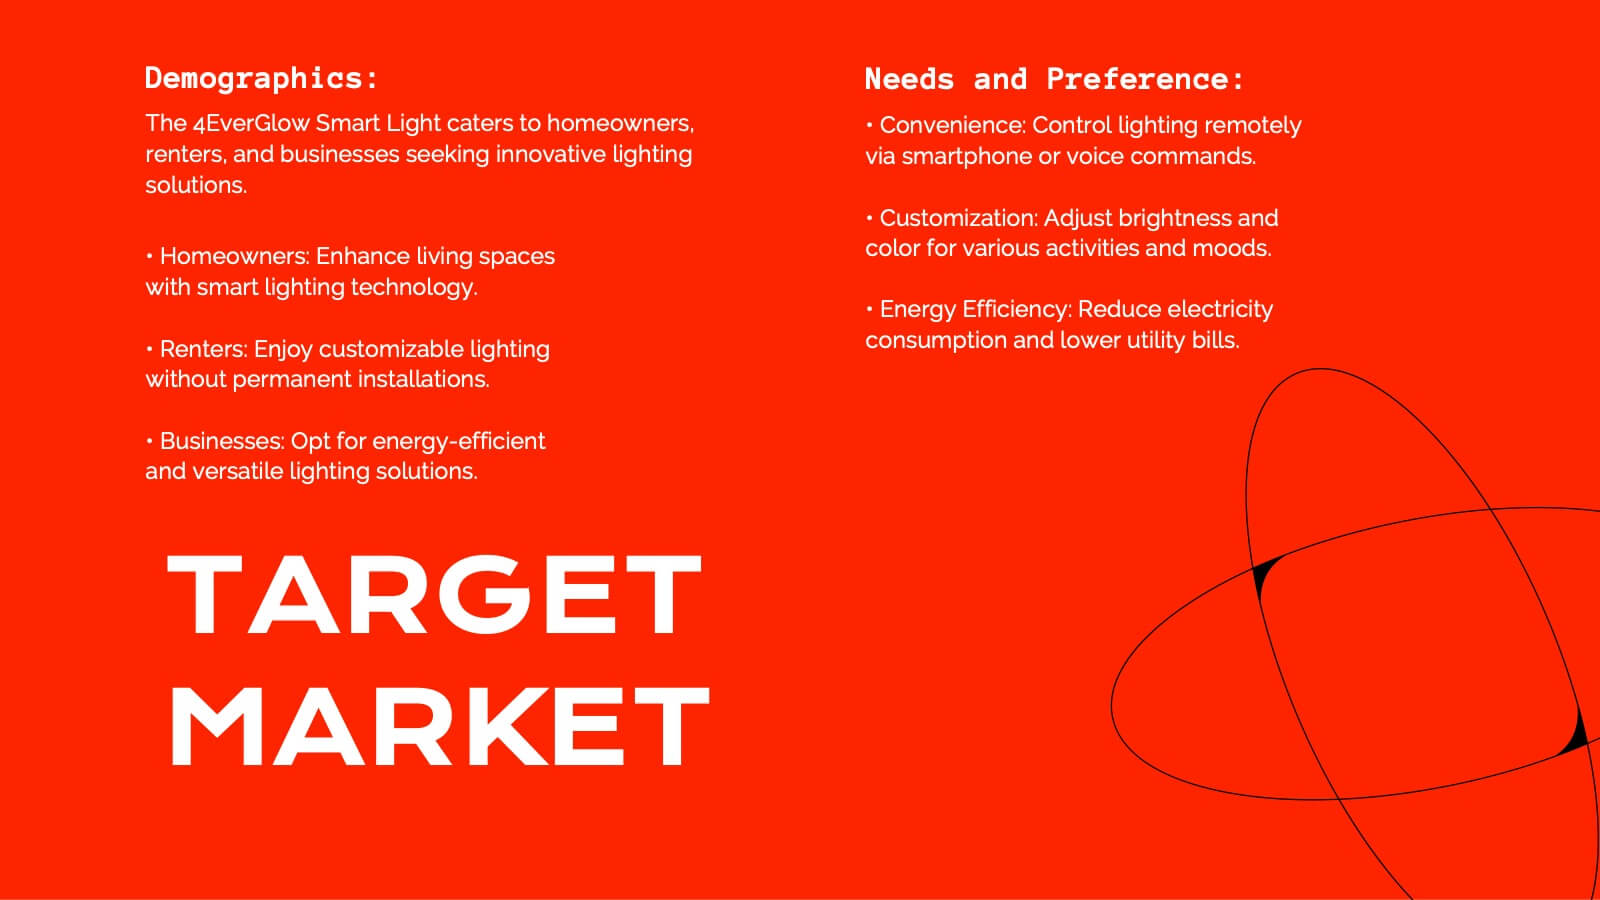
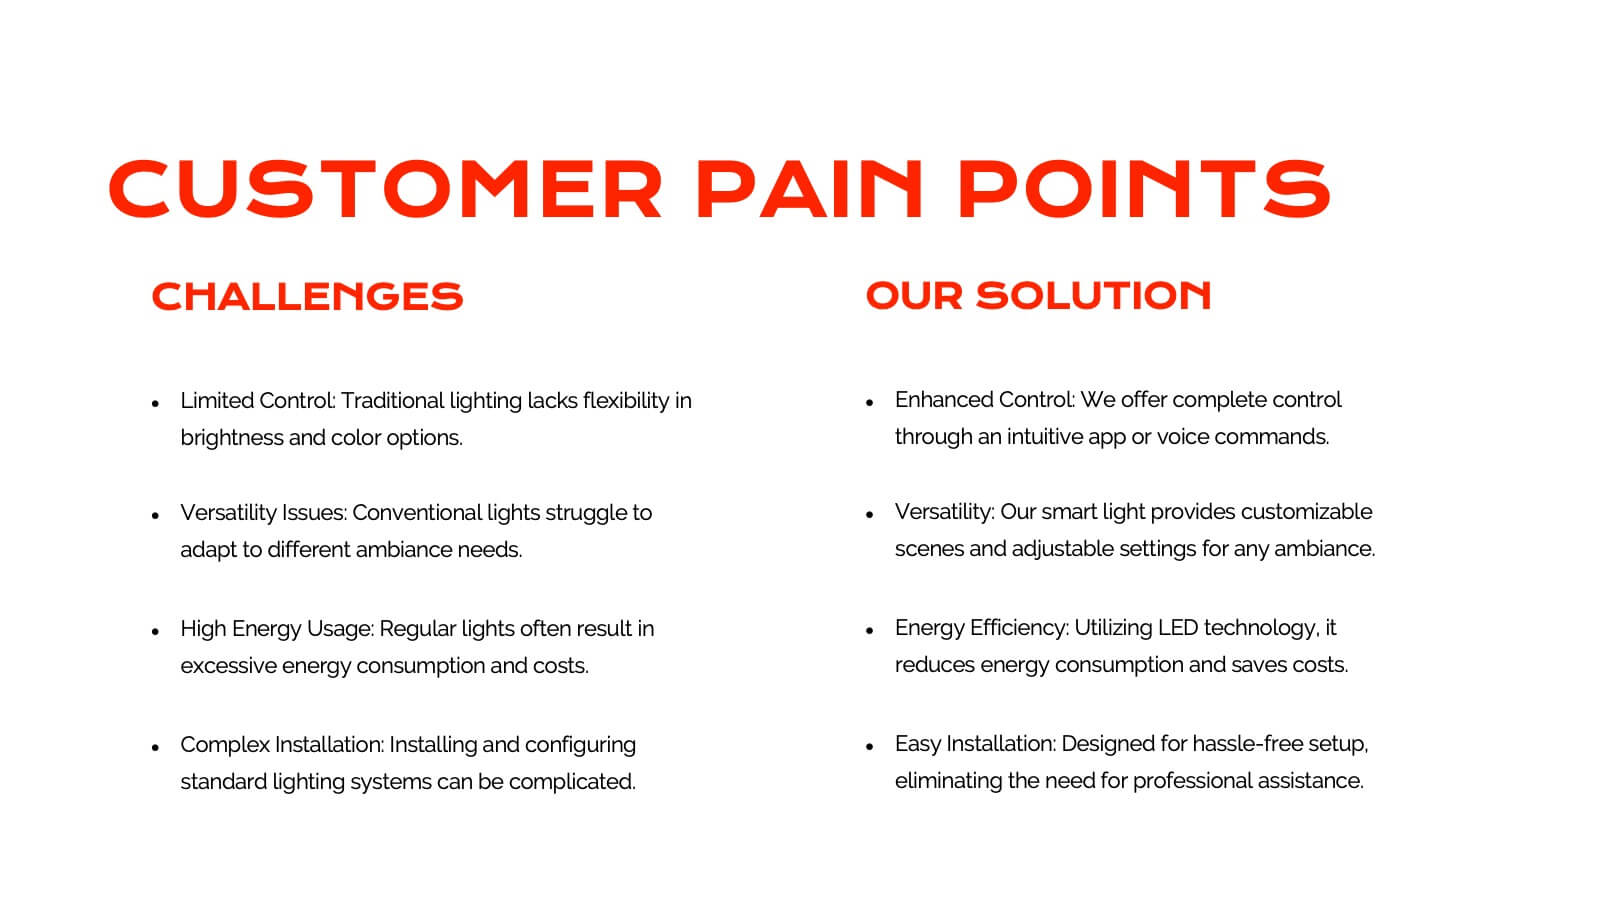
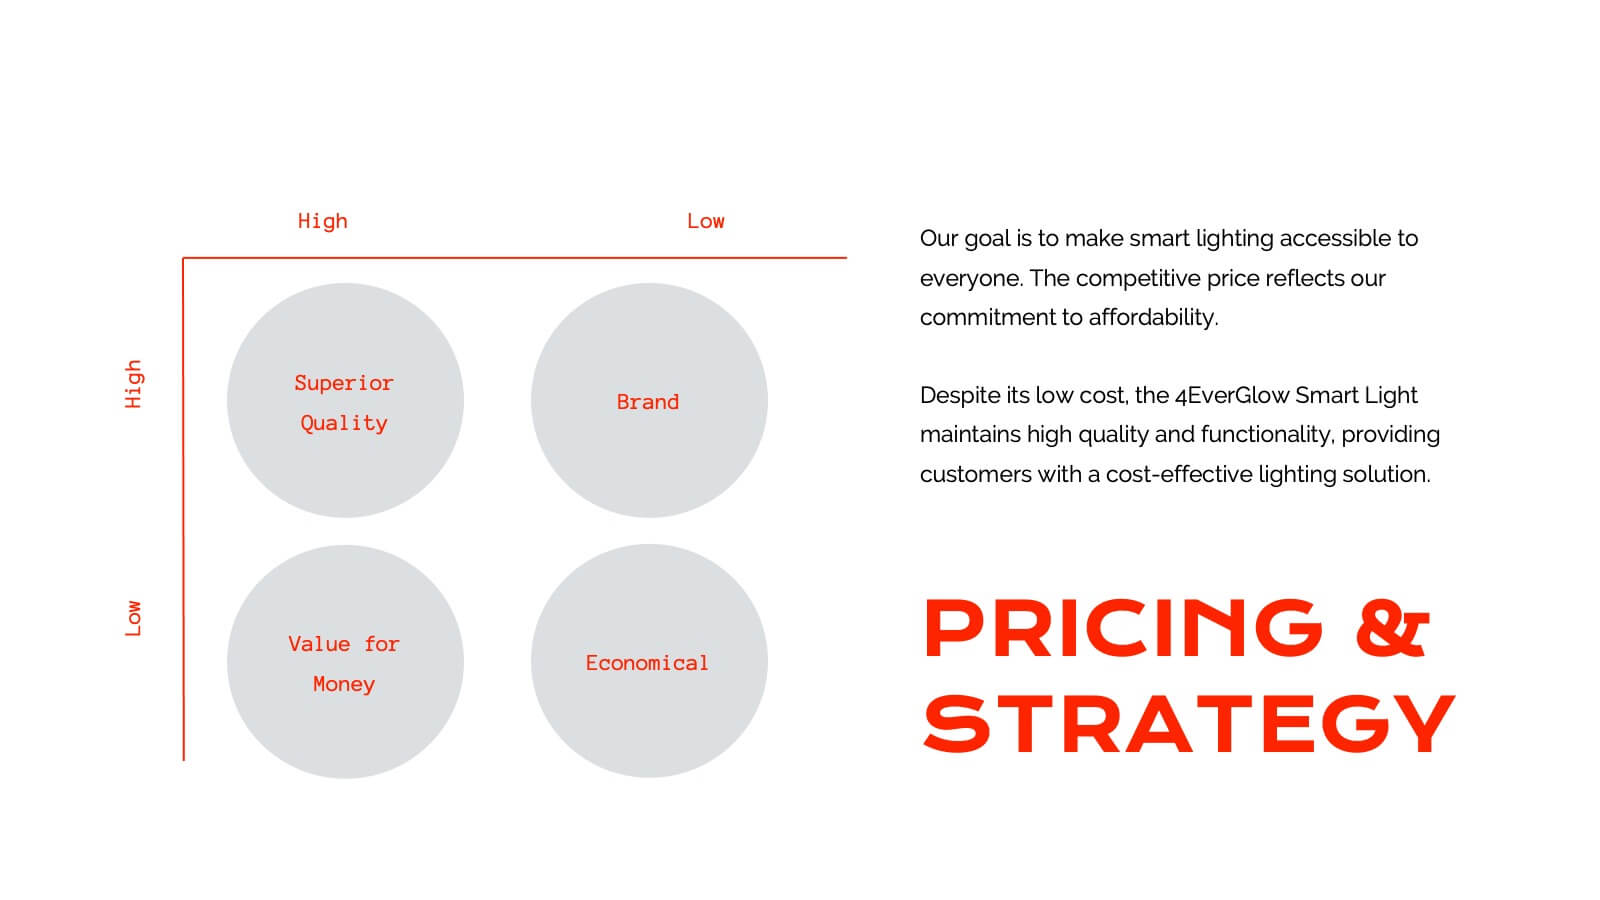
Juventas Product Roadmap Presentation
Get ready to dazzle your audience with a visually striking presentation that takes them through the entire product journey! This template covers essential areas such as product features, target market analysis, and competitive positioning. With its sleek, modern design, it's perfect for capturing attention and delivering clear information. Compatible with PowerPoint, Keynote, and Google Slides for effortless use across platforms.


7 slides
Law and Compliance Presentation
Bring order and precision to your reports with this modern, structured layout designed to simplify complex regulations and policies. Perfect for presenting legal processes, compliance updates, or governance strategies, it blends professionalism with clarity. Fully compatible with PowerPoint, Keynote, and Google Slides for seamless editing and presentation flexibility.


12 slides
Breast Cancer Awareness Day Presentation
The Breast Cancer Awareness Day presentation template is an essential tool for health awareness campaigns. With distinctive pink icons symbolizing support and education, this template is perfect for seminars and presentations. It's fully compatible with PowerPoint, Keynote, and Google Slides, enhancing accessibility and user experience.


6 slides
Aviation Classes Infographics
Discover the world of Aviation Classes with our customizable infographic template. This template is fully compatible with popular presentation software like PowerPoint, Keynote, and Google Slides, allowing you to easily customize it to illustrate and communicate various aspects of aviation education and training. The Aviation Classes infographic template offers a visually engaging platform to outline the types of aviation courses, training programs, career opportunities, and the importance of aviation education. Whether you're an aviation student, educator, aspiring pilot, or simply interested in aviation, this template provides a user-friendly canvas to create informative presentations and educational materials. Enhance your understanding of Aviation Classes with this SEO-optimized infographic template, thoughtfully designed for clarity and ease of use. Customize it to showcase different aviation disciplines, training institutions, certification requirements, and the role of education in the aviation industry. Ensure that your audience gains valuable insights into the world of aviation education. Start crafting your personalized infographic today to explore the realm of Aviation Classes.


4 slides
Business Strategy Puzzle Graphic Presentation
Bring your ideas together with a design that snaps every strategic point into place. This presentation turns complex planning into a clear, engaging visual puzzle that highlights key insights, goals, and outcomes. Ideal for business reviews, team alignment, and decision-making sessions. Fully compatible with PowerPoint, Keynote, and Google Slides.