


Features
- 22 Unique Slides
- Fully editable and easy to edit in Microsoft Powerpoint, Keynote and Google Slides
- 16:9 widescreen layout
- Clean and professional designs
- Export to JPG, PDF or send by email


Do you have any questions?
Recommend


5 slides
IT Support and Systems Presentation
Streamline your tech communication with a clean, structured layout that highlights your IT services, support processes, and system workflows. Perfect for teams presenting solutions, infrastructure overviews, or technical strategies, this presentation brings clarity to complex topics. Fully compatible with PowerPoint, Keynote, and Google Slides for effortless editing and delivery.


14 slides
Business Expense and Cost Control Presentation
Optimize your financial strategy with the Business Expense and Cost Control Presentation template. This slide helps visualize cost management, spending efficiency, and budgeting strategies with a clear, data-driven layout. Ideal for financial planners, business analysts, and executives aiming to streamline operational expenses. Fully customizable in PowerPoint, Keynote, and Google Slides.


4 slides
Performance Gap Analysis Diagram Presentation
Bridge the gap between current and desired performance with this strategic diagram. Featuring a split-path layout and central bridge graphic, this template helps visualize obstacles, goals, and solutions. Ideal for strategy teams, consultants, and analysts. Fully editable in PowerPoint, Keynote, and Google Slides—clear, impactful, and easy to customize.


20 slides
Emerald Sales Forecast Presentation
Shine bright with this emerald-inspired presentation, perfect for sharing your sales forecast! Designed to showcase revenue projections, market trends, and sales strategies, this template keeps your data organized and visually impactful. Its vibrant, clean design ensures your forecast captures attention. Compatible with PowerPoint, Keynote, and Google Slides.


6 slides
Value Delivery Framework Presentation
Turn your strategy into action with a clear, layered design that highlights how value flows through every stage of your process. Perfect for explaining organizational efficiency, performance models, or delivery systems. Fully editable and compatible with PowerPoint, Keynote, and Google Slides for easy, professional customization.


5 slides
Visible vs Hidden Factors Iceberg Chart Presentation
Bring your ideas to life with a visual that instantly reveals the difference between what’s seen and what’s truly shaping the outcome. This presentation helps you break down visible elements and deeper hidden factors using a modern iceberg graphic. Perfect for strategy, analysis, and insights. Compatible with PowerPoint, Keynote, and Google Slides.


20 slides
Astralisque Sales Proposal Presentation
This Sales Proposal Presentation is designed to help businesses outline their sales strategies with a bold and dynamic style. Covering key elements such as competitive analysis, objectives, pricing strategy, and sales performance metrics, it ensures a professional look. Fully customizable and compatible with PowerPoint, Keynote, and Google Slides.


5 slides
Real Estate Business Process Workflow Presentation
Streamline property operations with this real estate workflow template, designed to visualize each stage from acquisition to closing. Featuring a modern cityscape graphic and five-step layout, it’s perfect for showcasing processes, timelines, or strategies. Fully editable in Canva, PowerPoint, or Google Slides for professional, industry-specific presentations.


5 slides
Data Visualization Heat Map Presentation
Turn raw data into bold, visual stories with a colorful layout that highlights trends and performance at a glance. Perfect for illustrating analytics, performance metrics, or survey insights, this presentation makes complex data easy to read. Fully compatible with PowerPoint, Keynote, and Google Slides for smooth customization.


4 slides
Key Performance Indicators Presentation
Hit every target with a bold, visual layout that helps you present performance insights with clarity and impact. This presentation makes it easy to highlight goals, measure progress, and showcase meaningful data in a clean, modern design. Fully editable and compatible with PowerPoint, Keynote, and Google Slides.


6 slides
Detailed Case Analysis Report Presentation
Turn complex findings into a clear and engaging story with this modern, data-focused layout. Ideal for professionals presenting research, performance reviews, or audit results, it helps you organize insights with precision and clarity. Fully editable and compatible with PowerPoint, Keynote, and Google Slides for effortless customization and presentation delivery.


21 slides
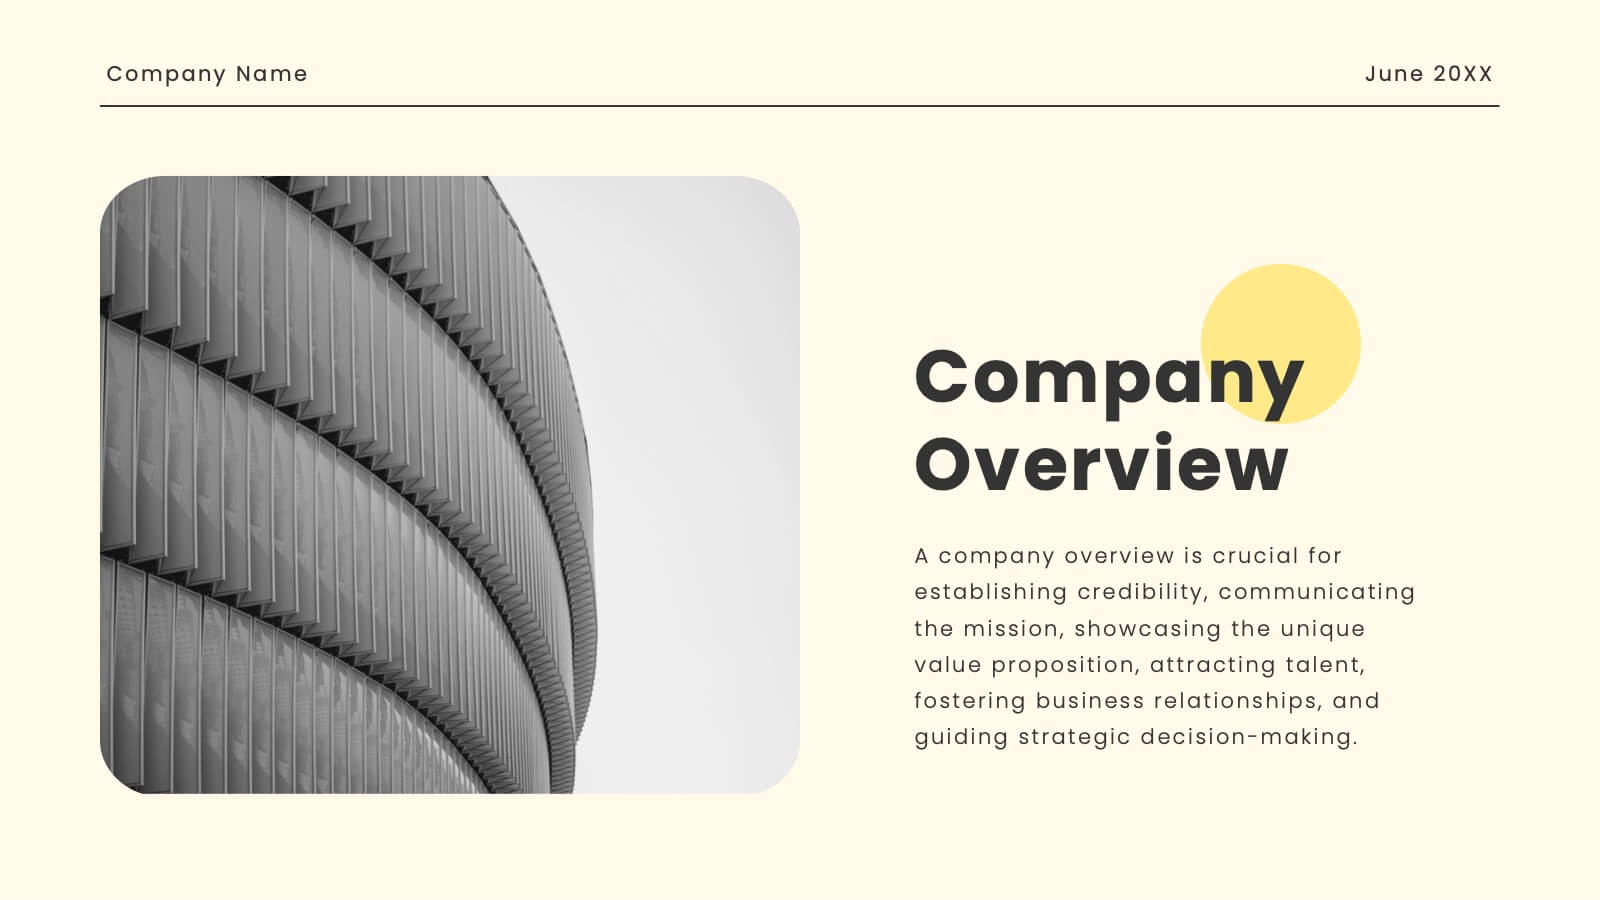
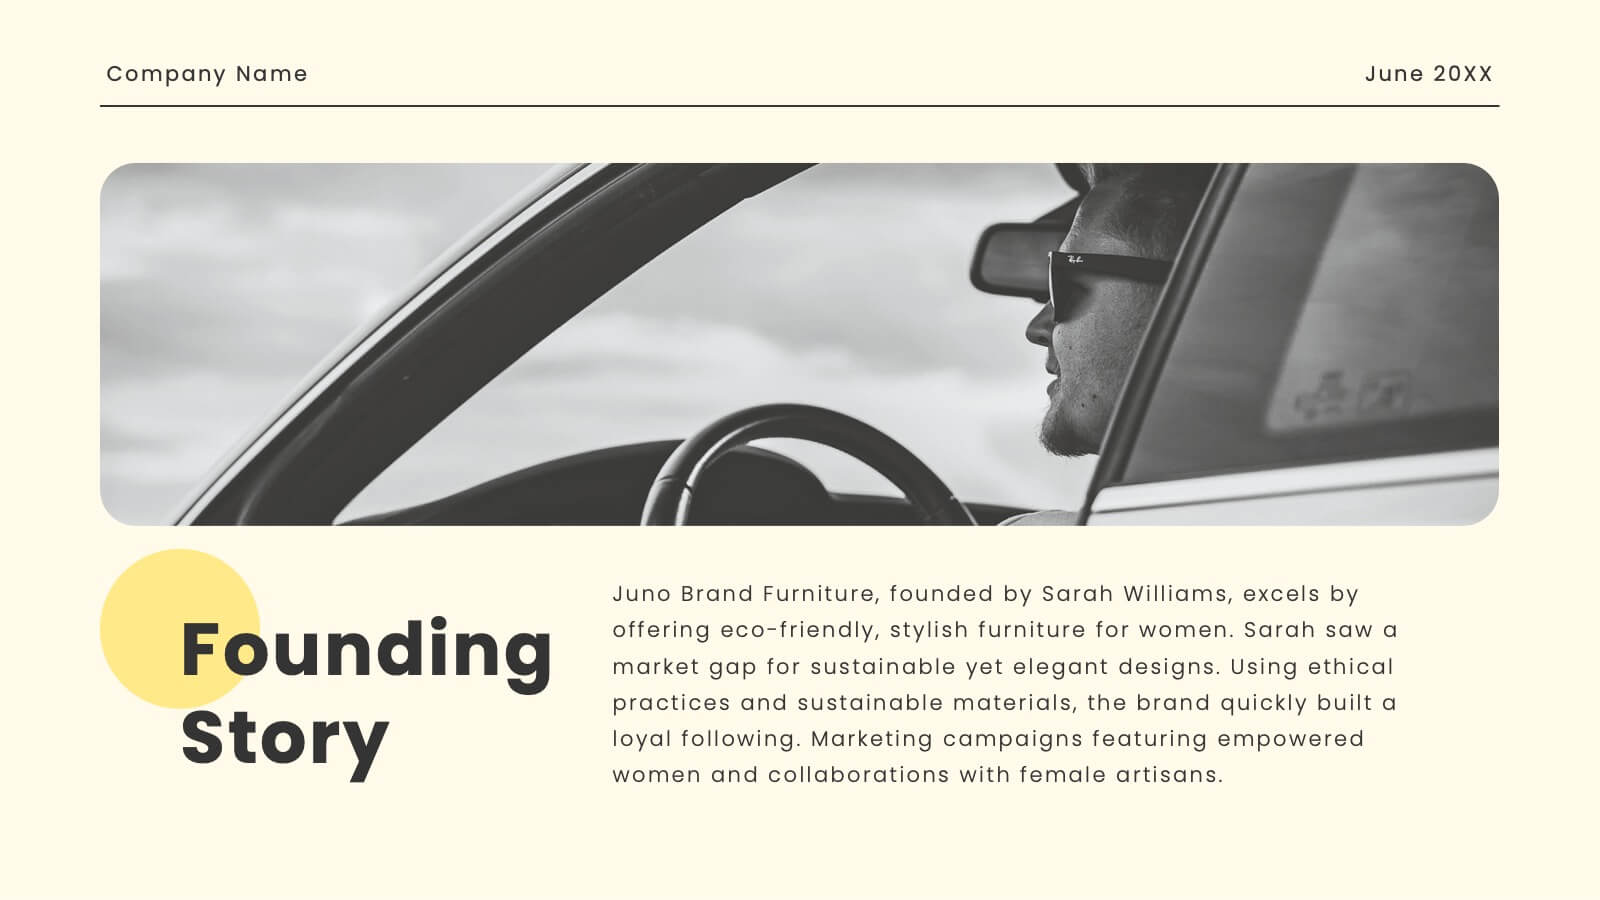
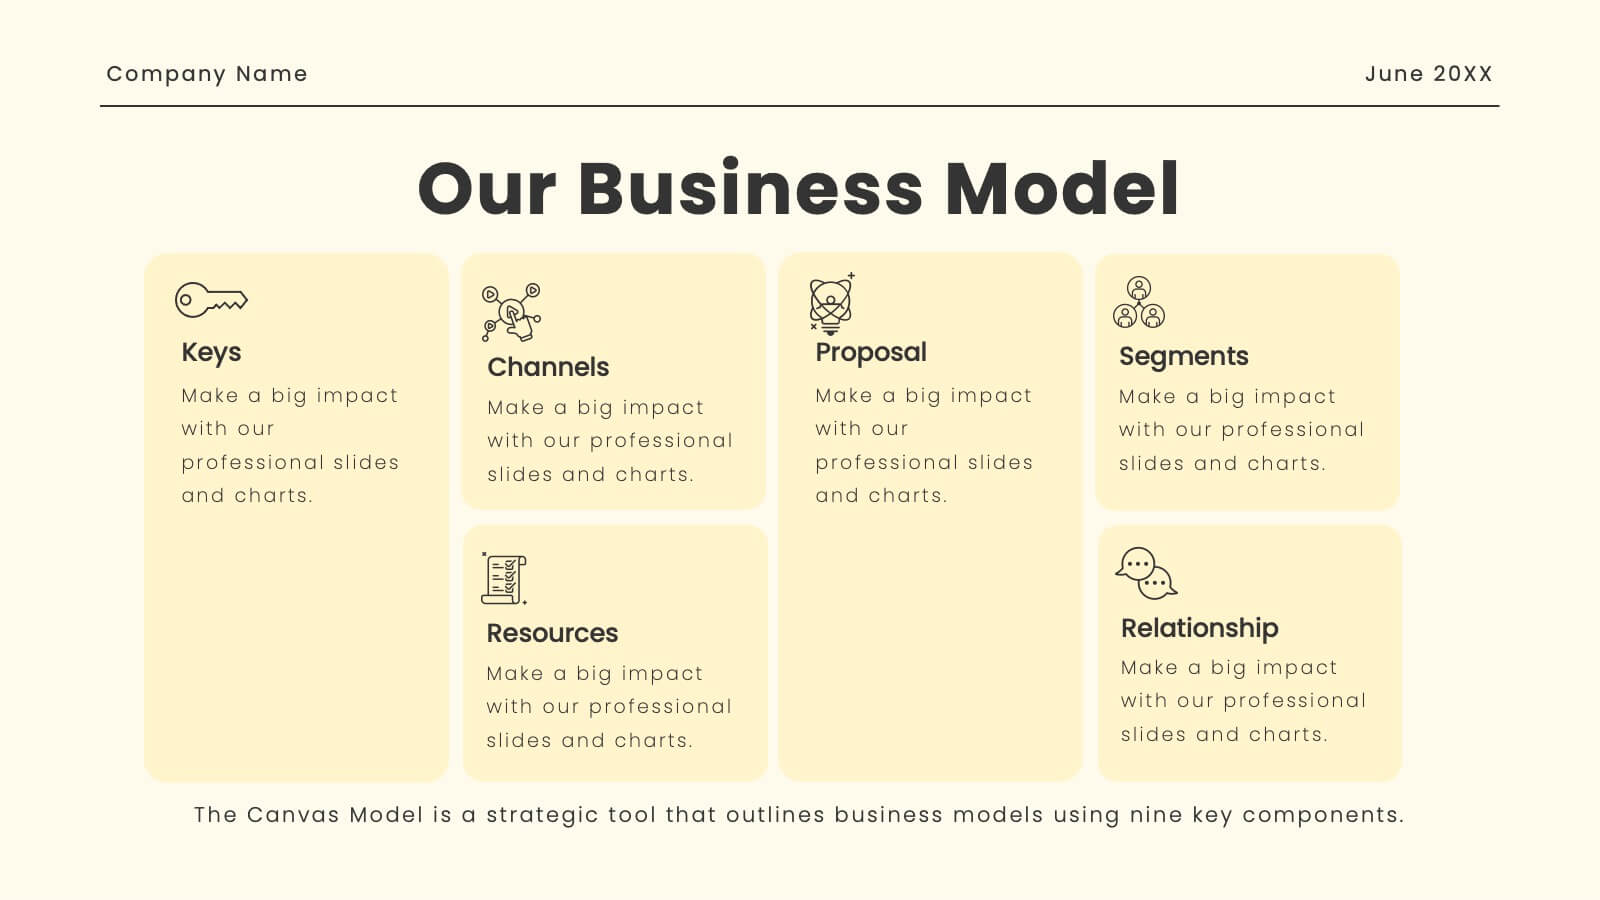
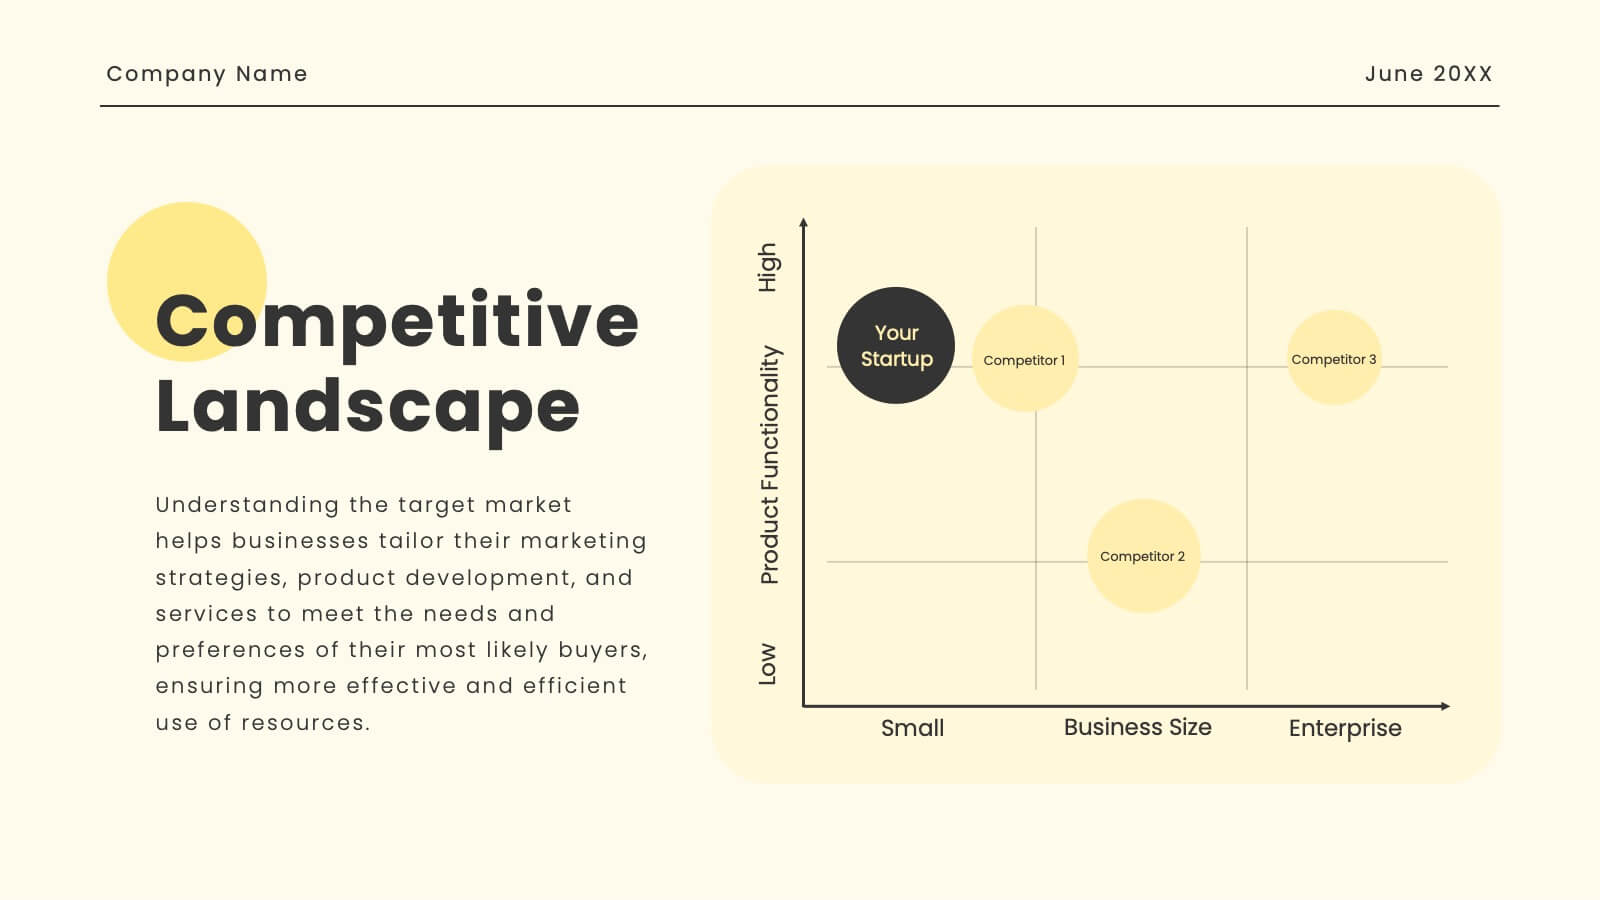
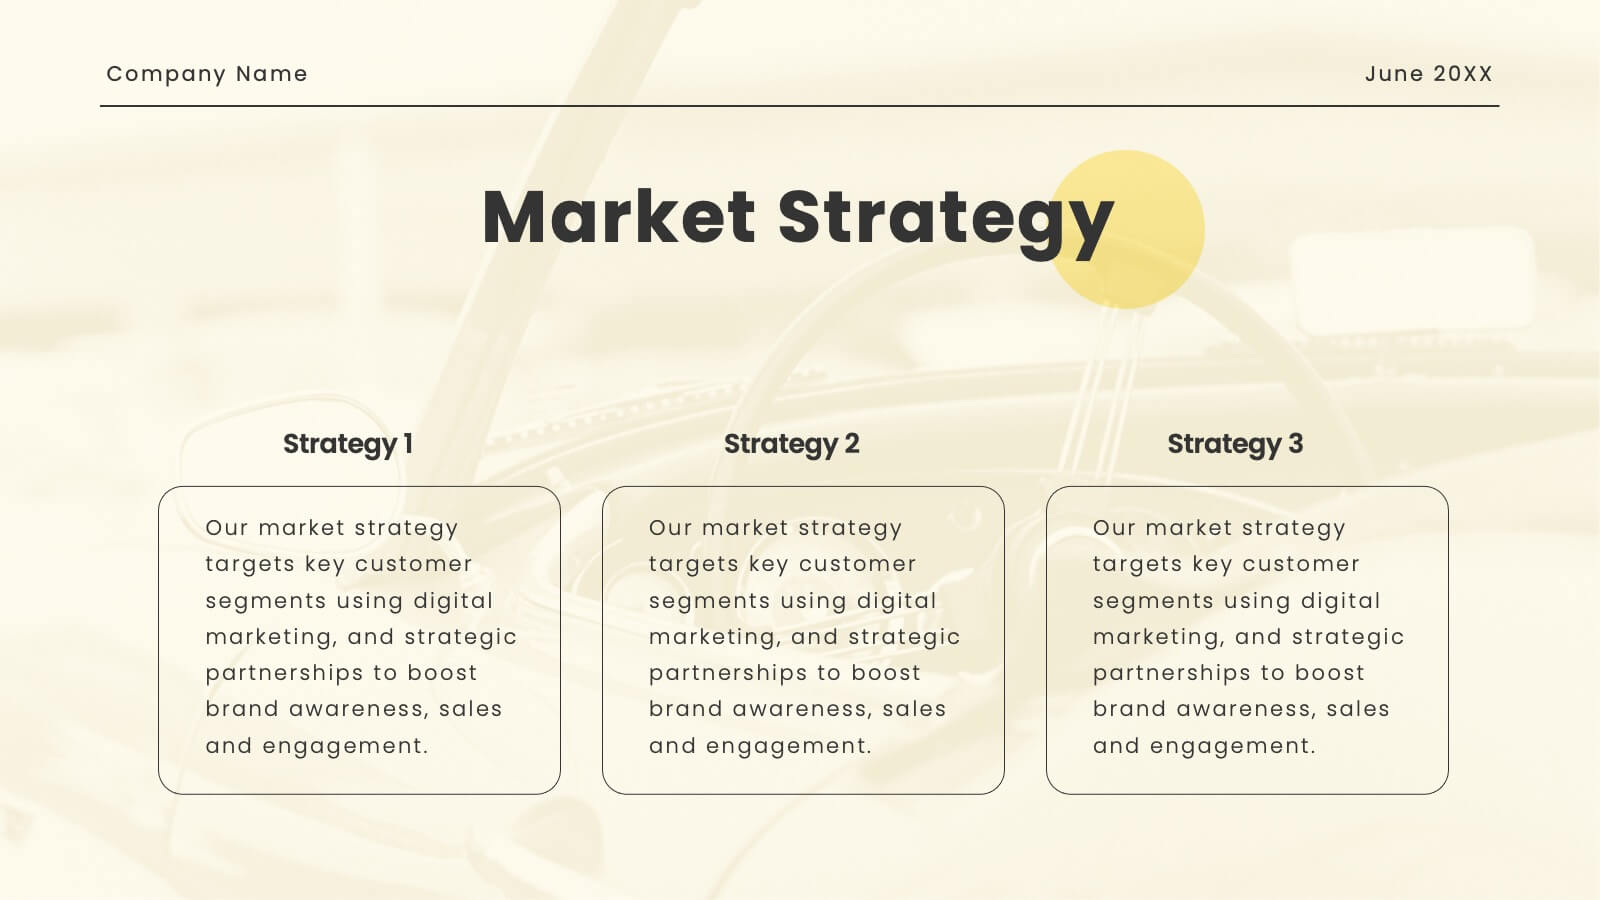
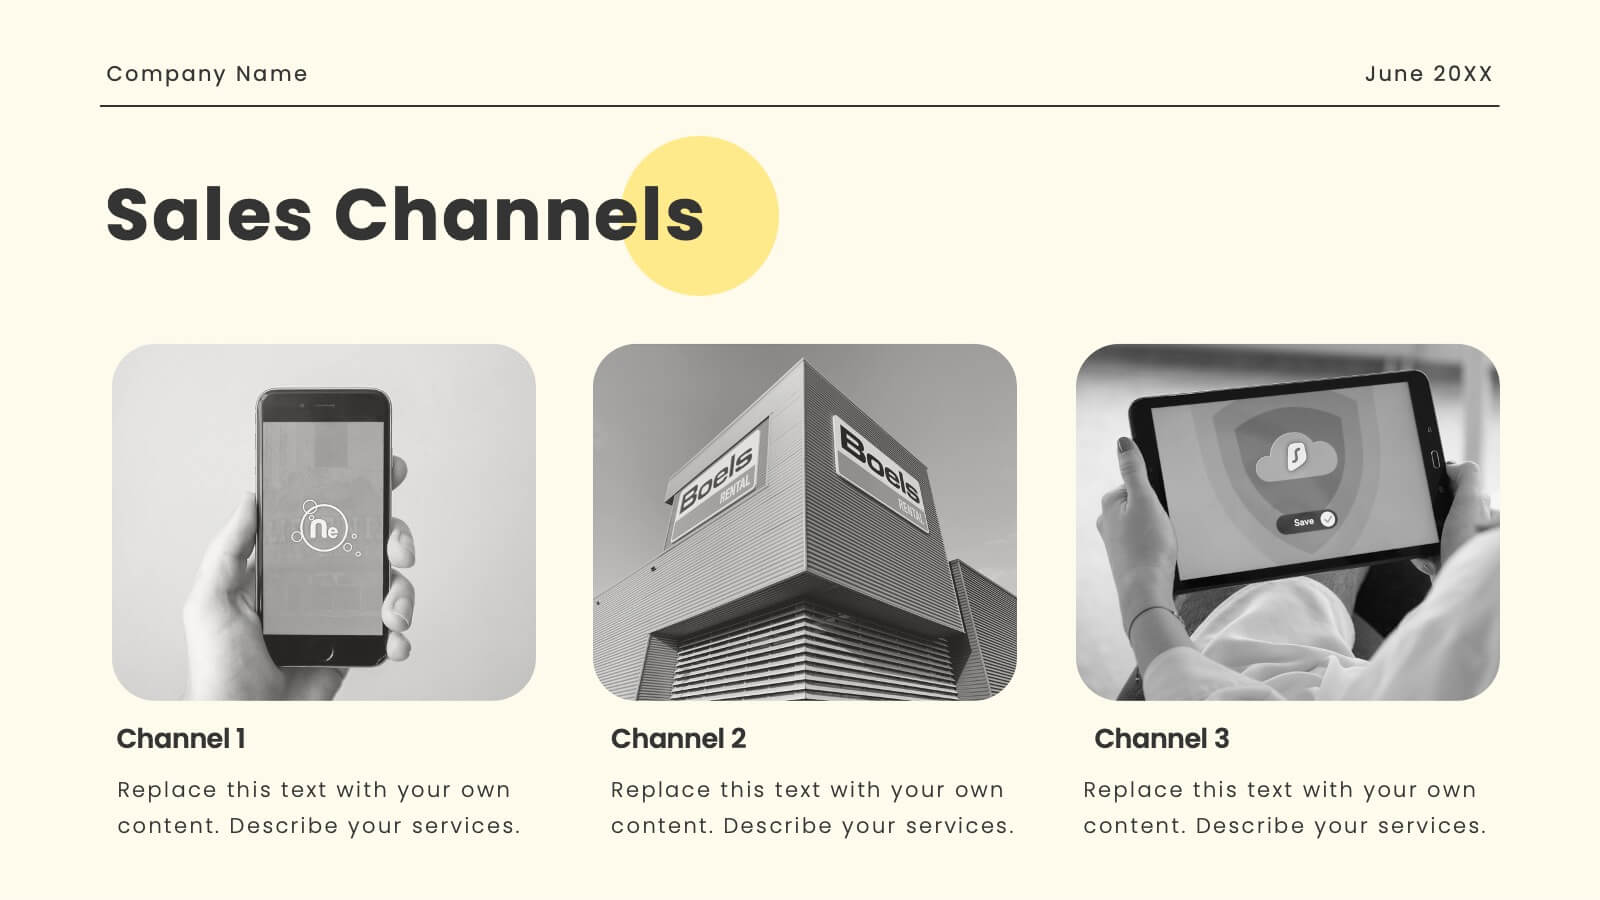
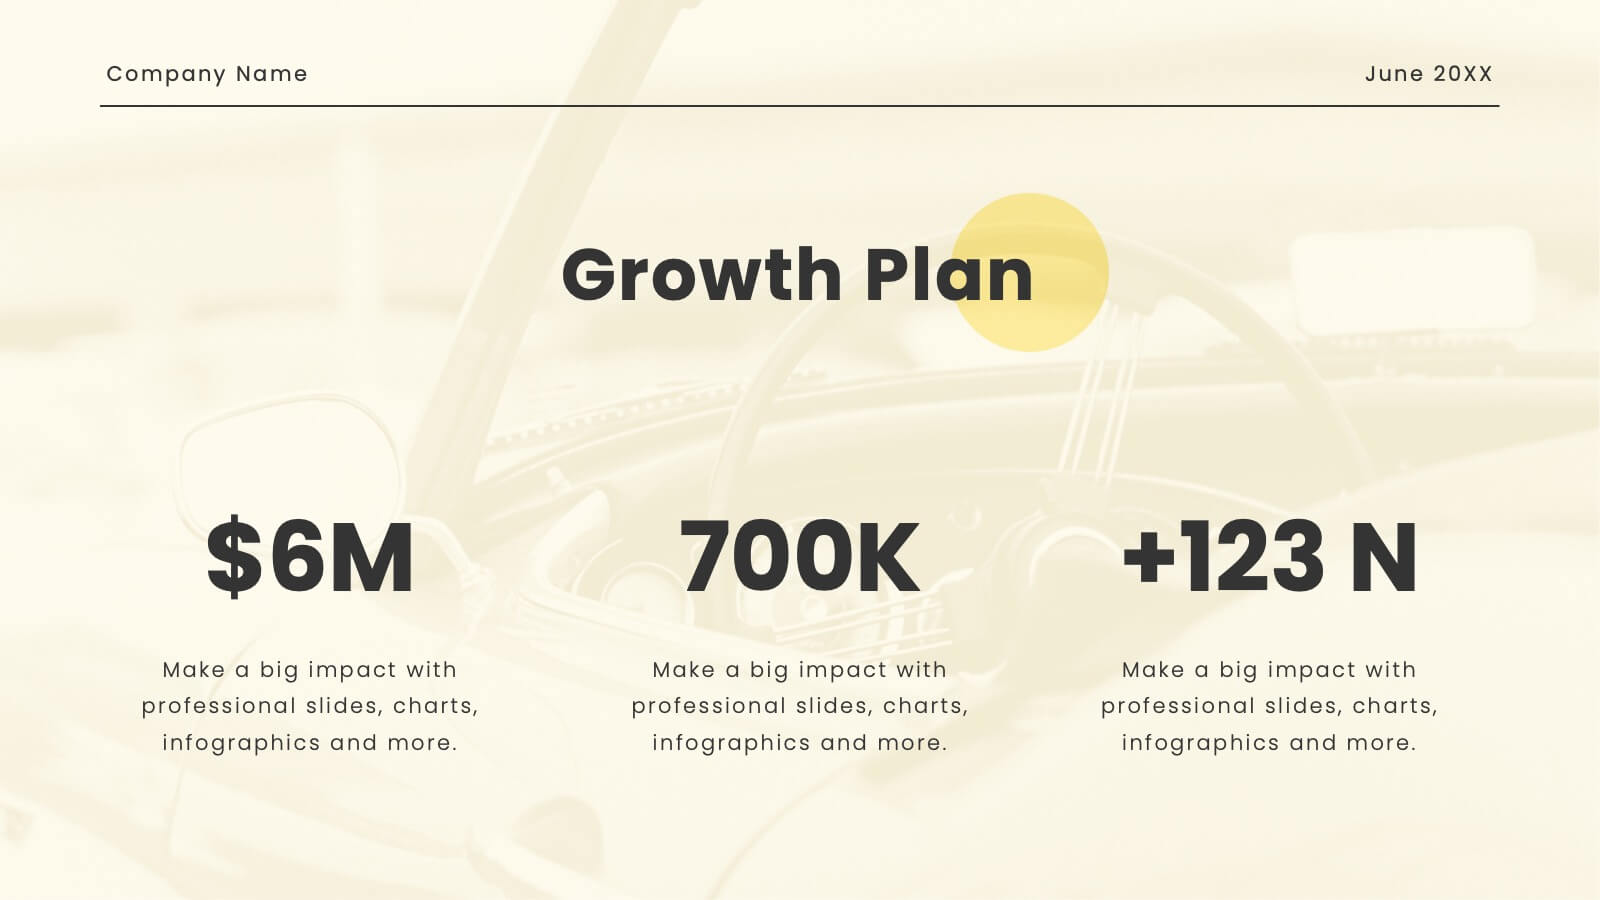
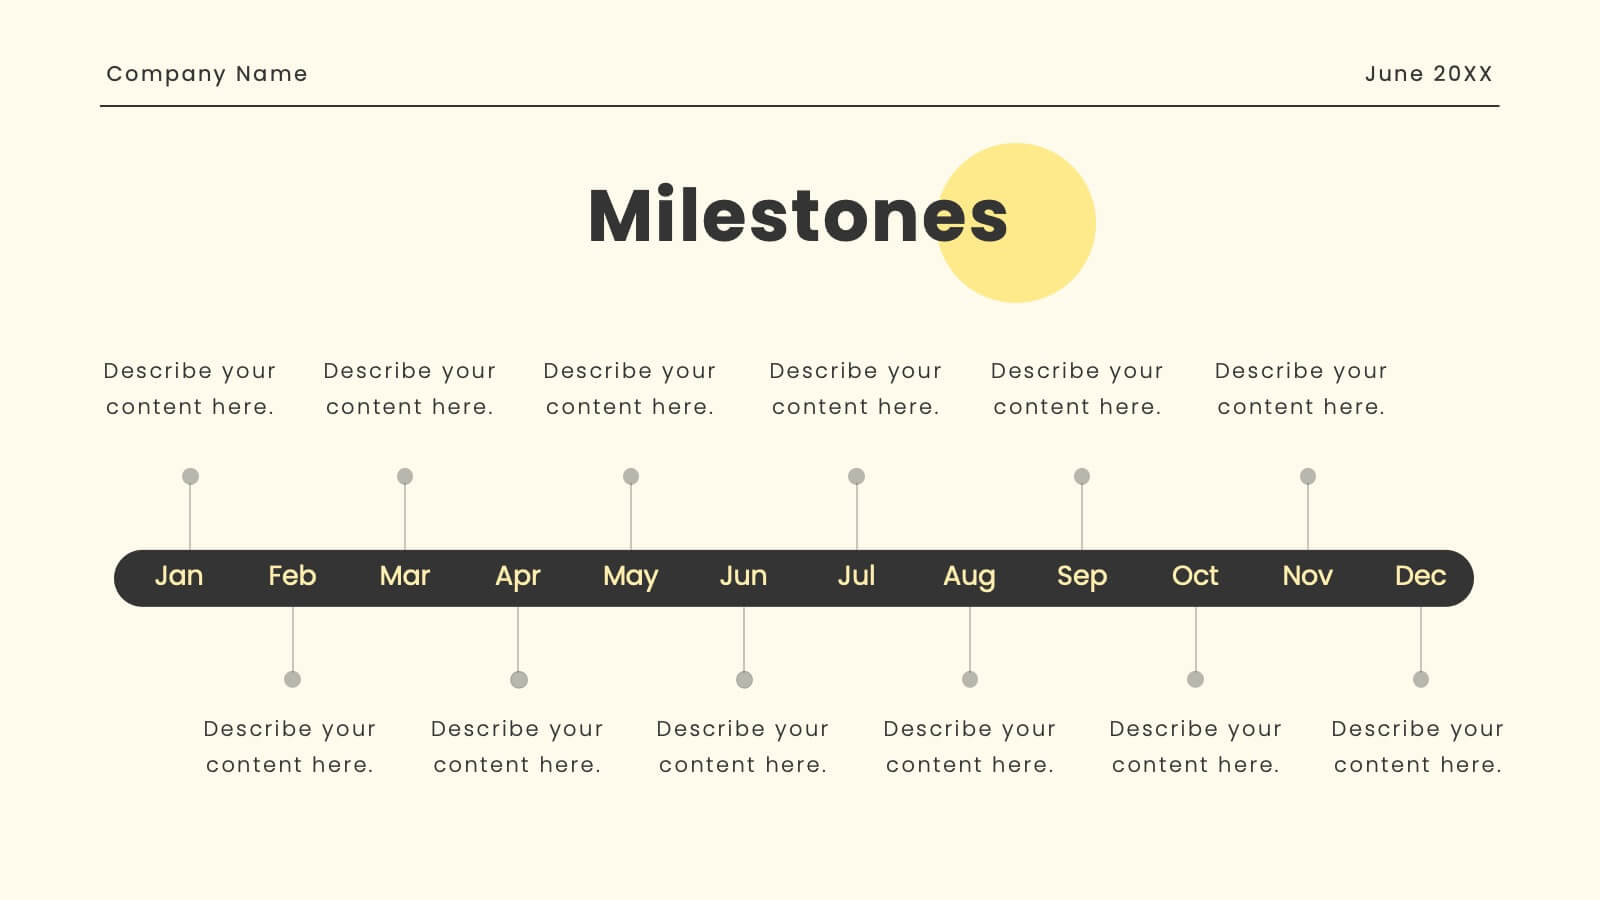
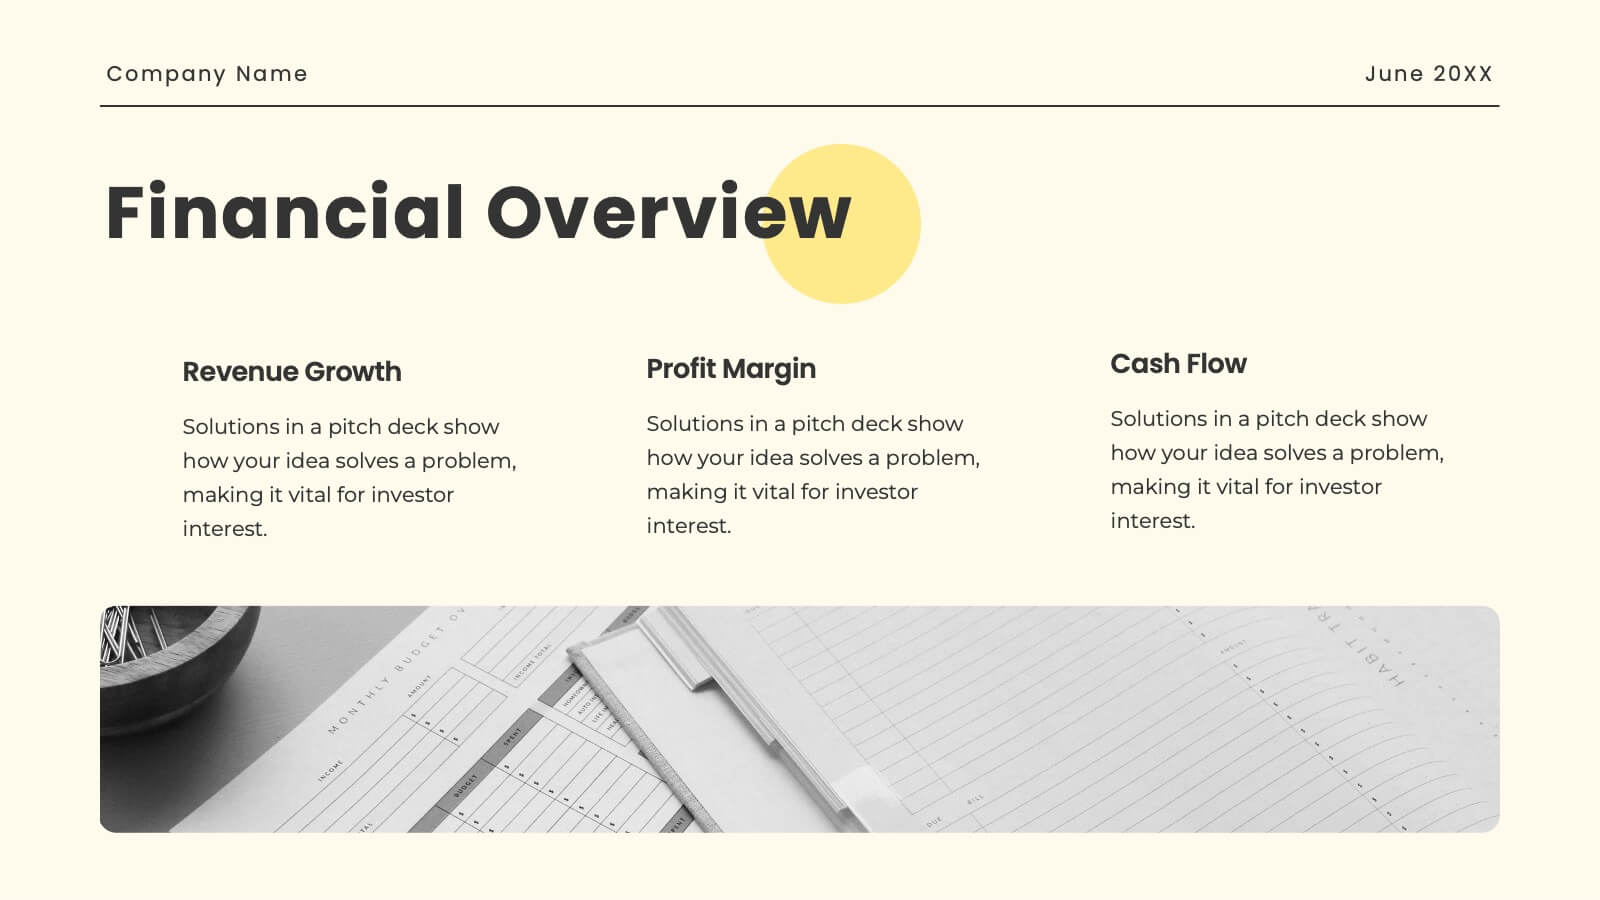
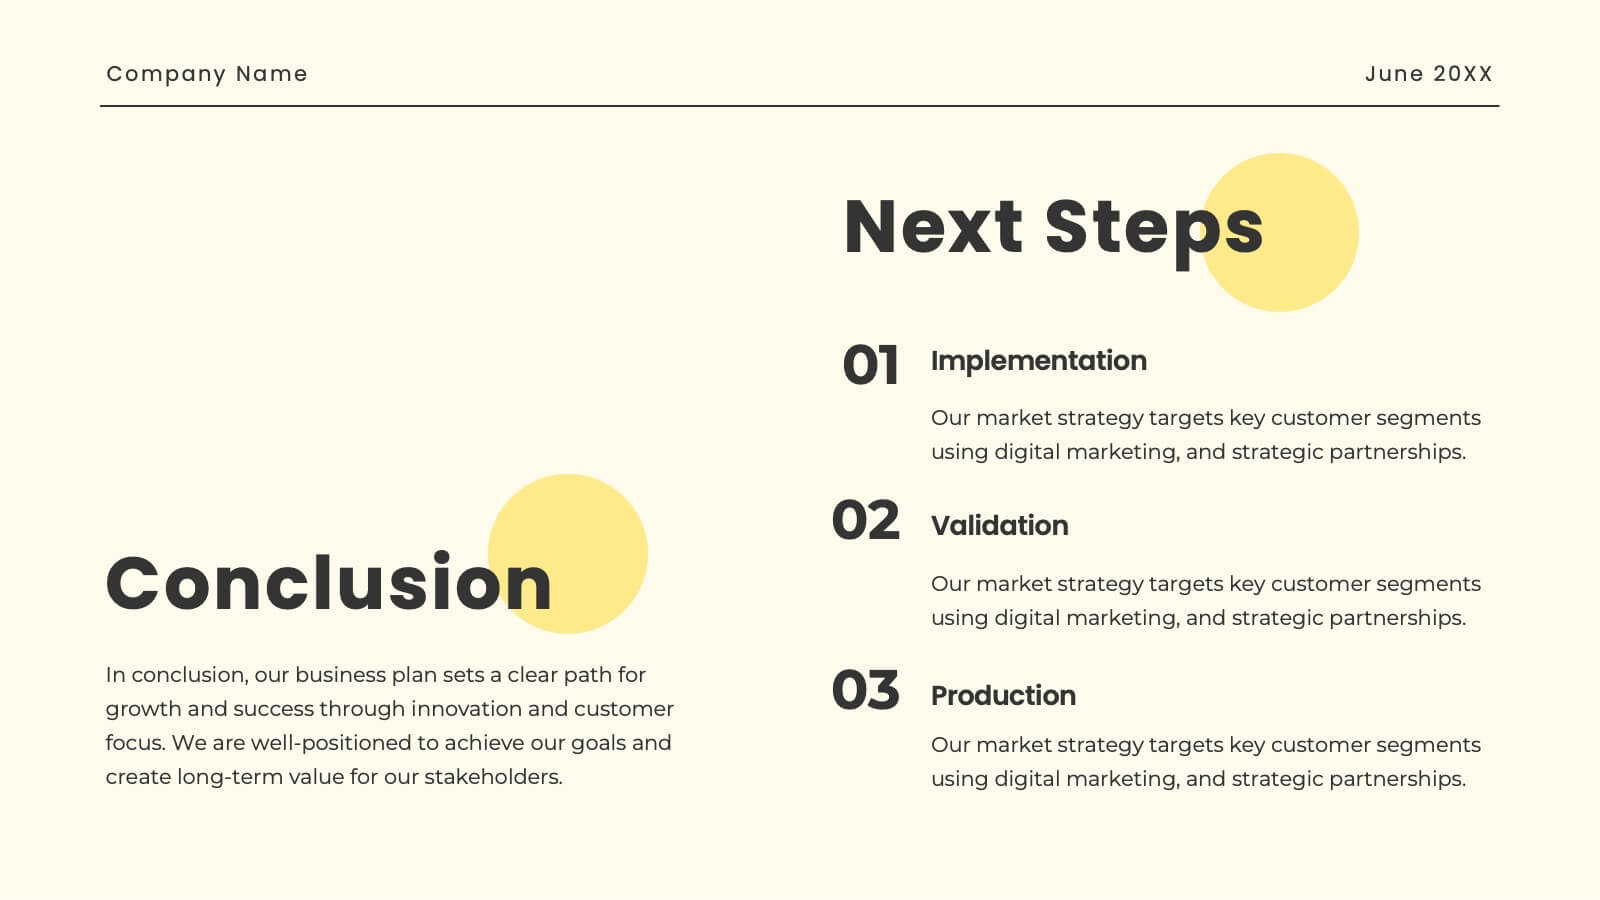
Oasis Startup Business Plan Presentation
Present your corporate business plan with confidence! This template includes sections for company overview, mission, vision, services, target market, and more. Showcase your market strategy, sales channels, growth plan, and financial overview. Perfect for conveying a professional and comprehensive business plan. Compatible with PowerPoint, Keynote, and Google Slides. Impress your audience today!


6 slides
Break Even Point Presentation
Turn your data into a story of profit and precision with this clean and modern presentation design. Ideal for showcasing financial performance, cost analysis, or revenue forecasts, it helps visualize where your business meets success. Fully customizable and compatible with PowerPoint, Keynote, and Google Slides for smooth editing.


6 slides
Business Performance Metric Presentation
Give your metrics a breath of fresh air with this modern, nature-inspired design. Perfect for presenting business KPIs, performance tracking, or growth data, this infographic layout uses vibrant pinwheel visuals to guide the viewer through key stats and insights. Fully compatible with PowerPoint, Keynote, and Google Slides for easy editing.


10 slides
Simplified Workflow in Four Clear Steps Presentation
Guide your audience through structured execution with the Simplified Workflow in Four Clear Steps Presentation. This vertical step diagram visually organizes key stages for task progression, planning, or implementation workflows. Each block is labeled, color-coded, and easy to customize—making your message direct and engaging. Fully editable in PowerPoint, Keynote, Google Slides, and Canva.


5 slides
Annual Overview Report Template Presentation
Bring your yearly achievements to life with this sleek and structured layout designed for clarity and impact. Ideal for summarizing company performance, milestones, and future goals, it organizes data into easy-to-follow visuals. Fully editable and compatible with PowerPoint, Keynote, and Google Slides for a smooth presentation experience.


5 slides
Business Figures and Key Numbers Overview Presentation
Present your data with clarity using this key-themed slide layout. Ideal for outlining five important metrics, business highlights, or strategic figures. The bold numerical format and clean design make your content easy to follow. Fully customizable in Canva, perfect for professional reports, pitches, and data-driven presentations.