


Features
- 6 Unique slides
- Fully editable and easy to edit in Microsoft Powerpoint, Keynote and Google Slides
- 16:9 widescreen layout
- Clean and professional designs
- Export to JPG, PDF or send by email


Do you have any questions?
Recommend


21 slides
Motionflux Project Milestones Report Presentation
Present project milestones with this structured template, covering objectives, methodology, timeline, budget, resource allocation, and risk management. Ideal for showcasing project progress and planning next steps. Perfect for PowerPoint, Keynote, and Google Slides, this design ensures a professional and clear presentation of key achievements and future plans.


4 slides
Project Responsibility Chart
Streamline team coordination with this Project Responsibility Chart. Clearly define who is Responsible, Accountable, Consulted, and Informed across key tasks. Ideal for project managers and team leads ensuring role clarity. Fully editable in PowerPoint, Keynote, and Google Slides.

23 slides
Crest Investor Pitch Presentation Presentation
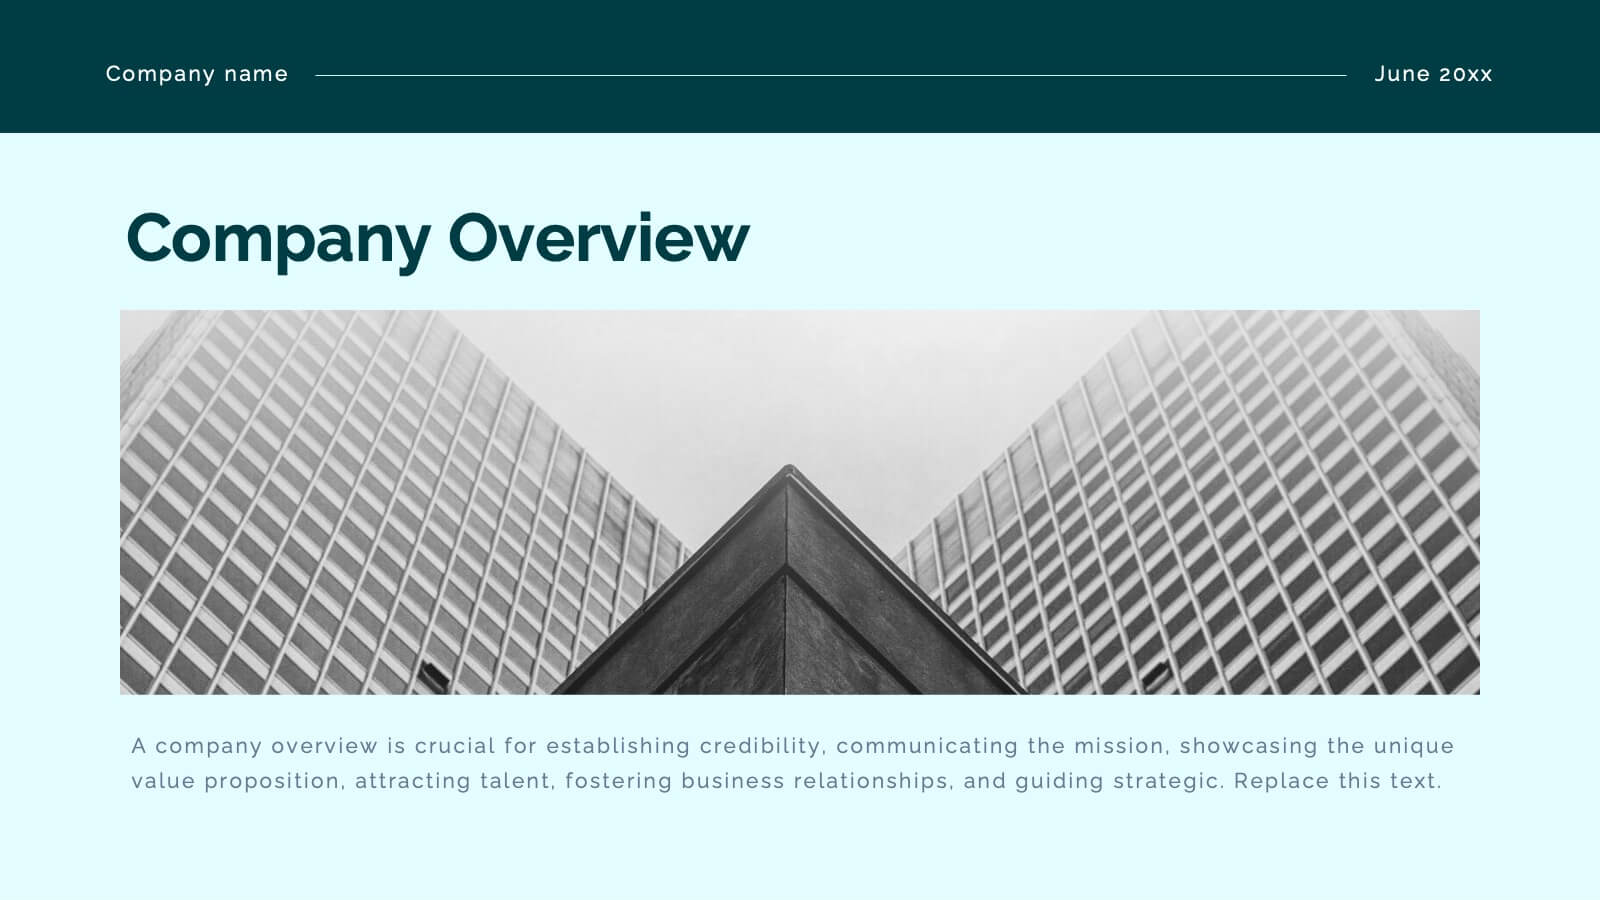
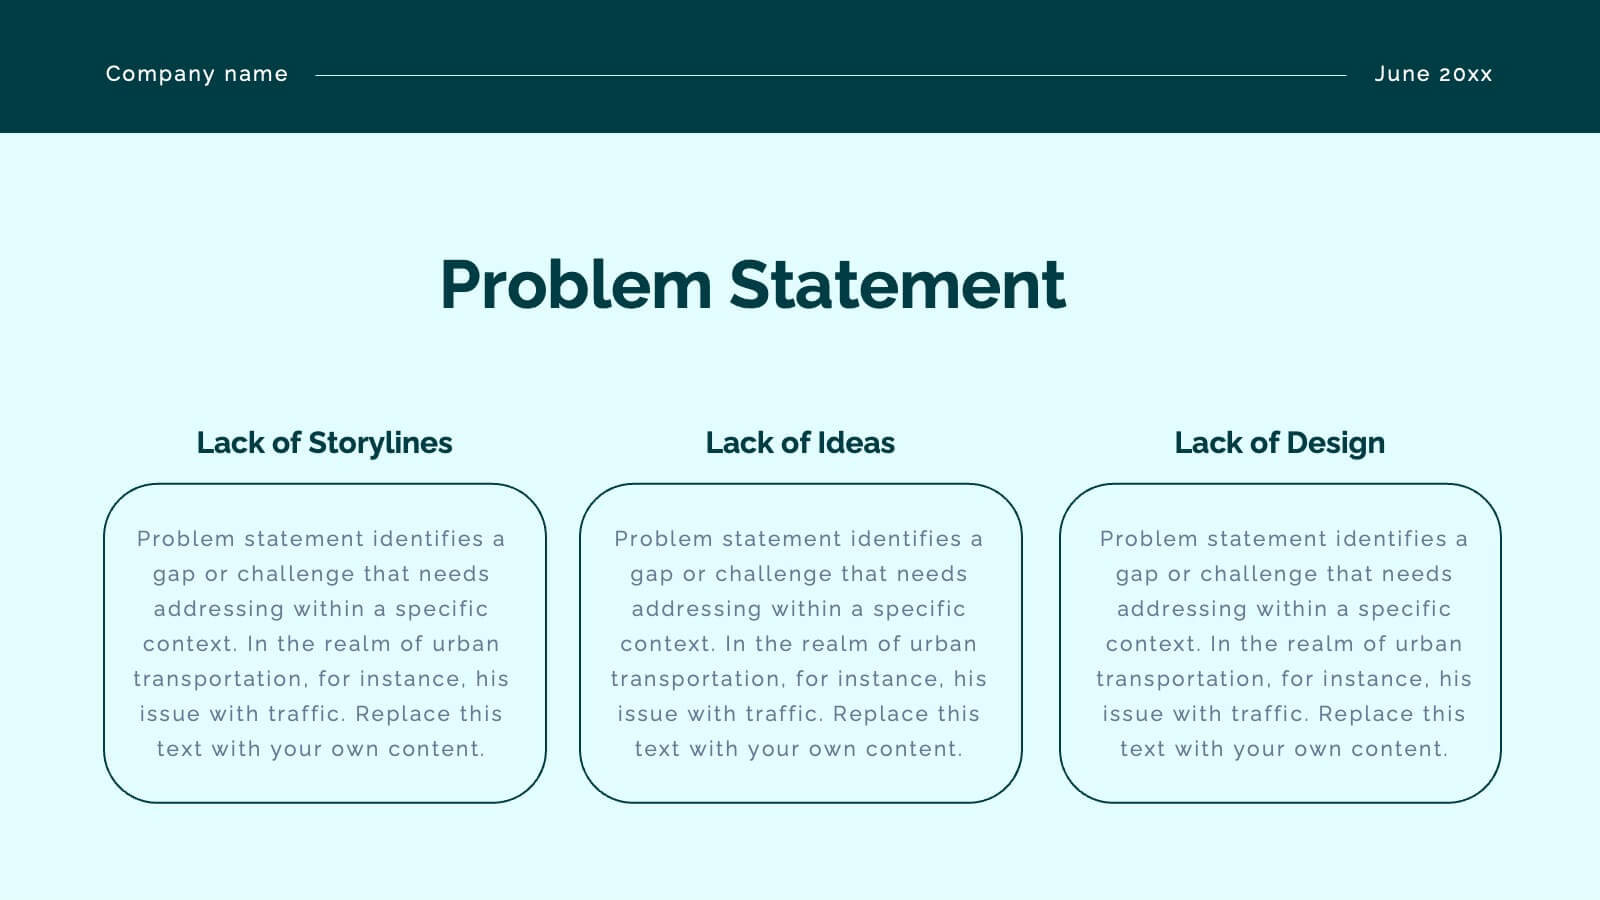
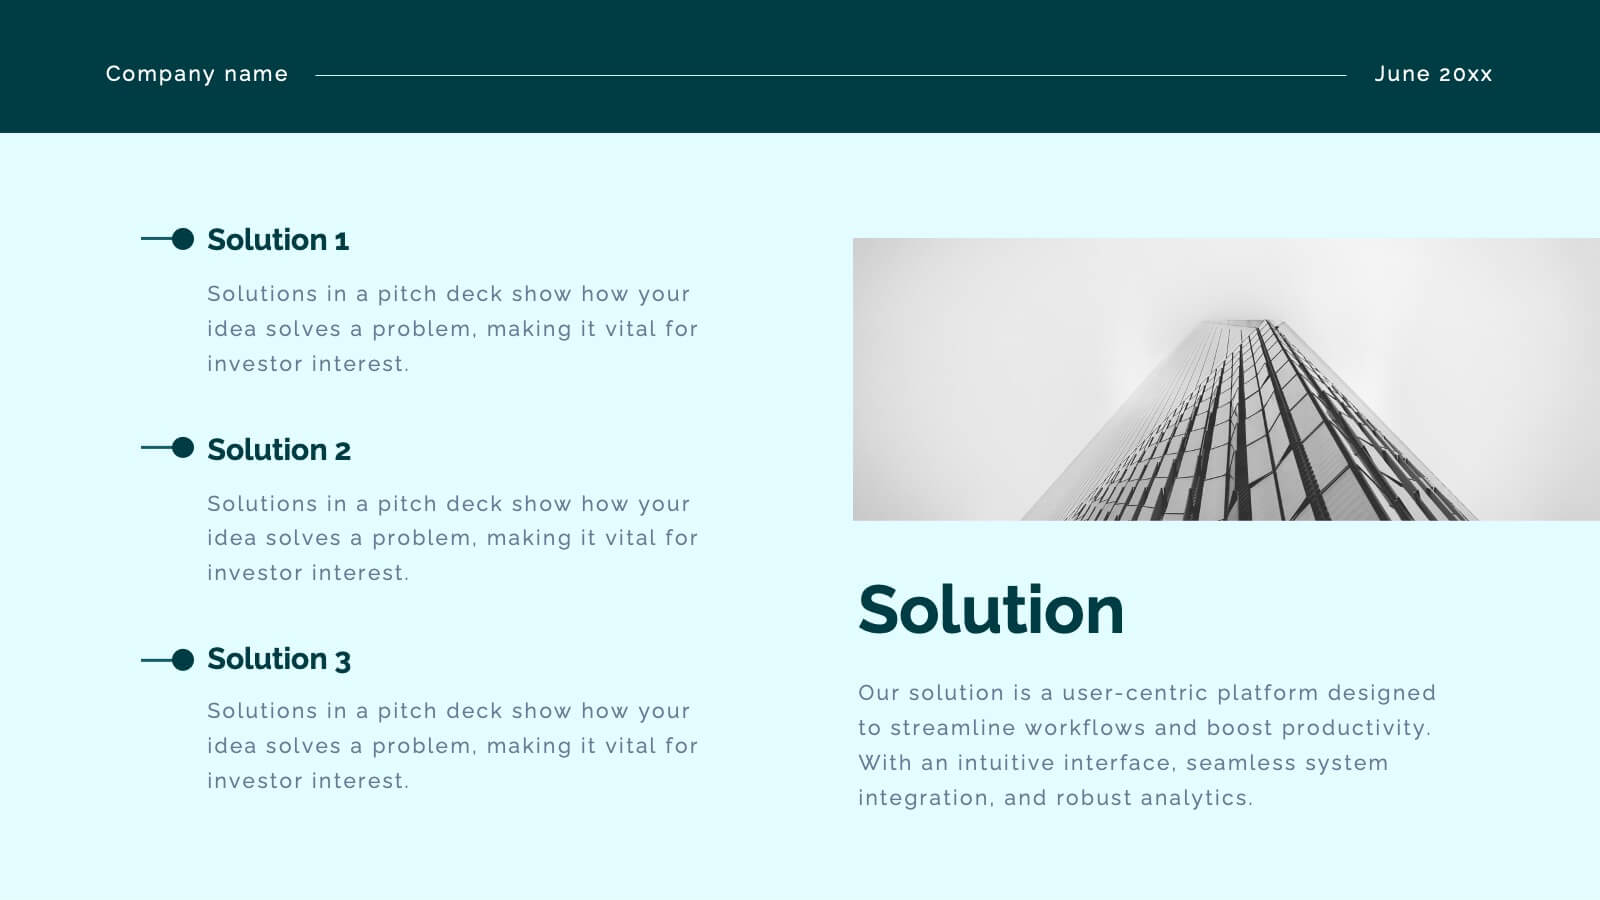
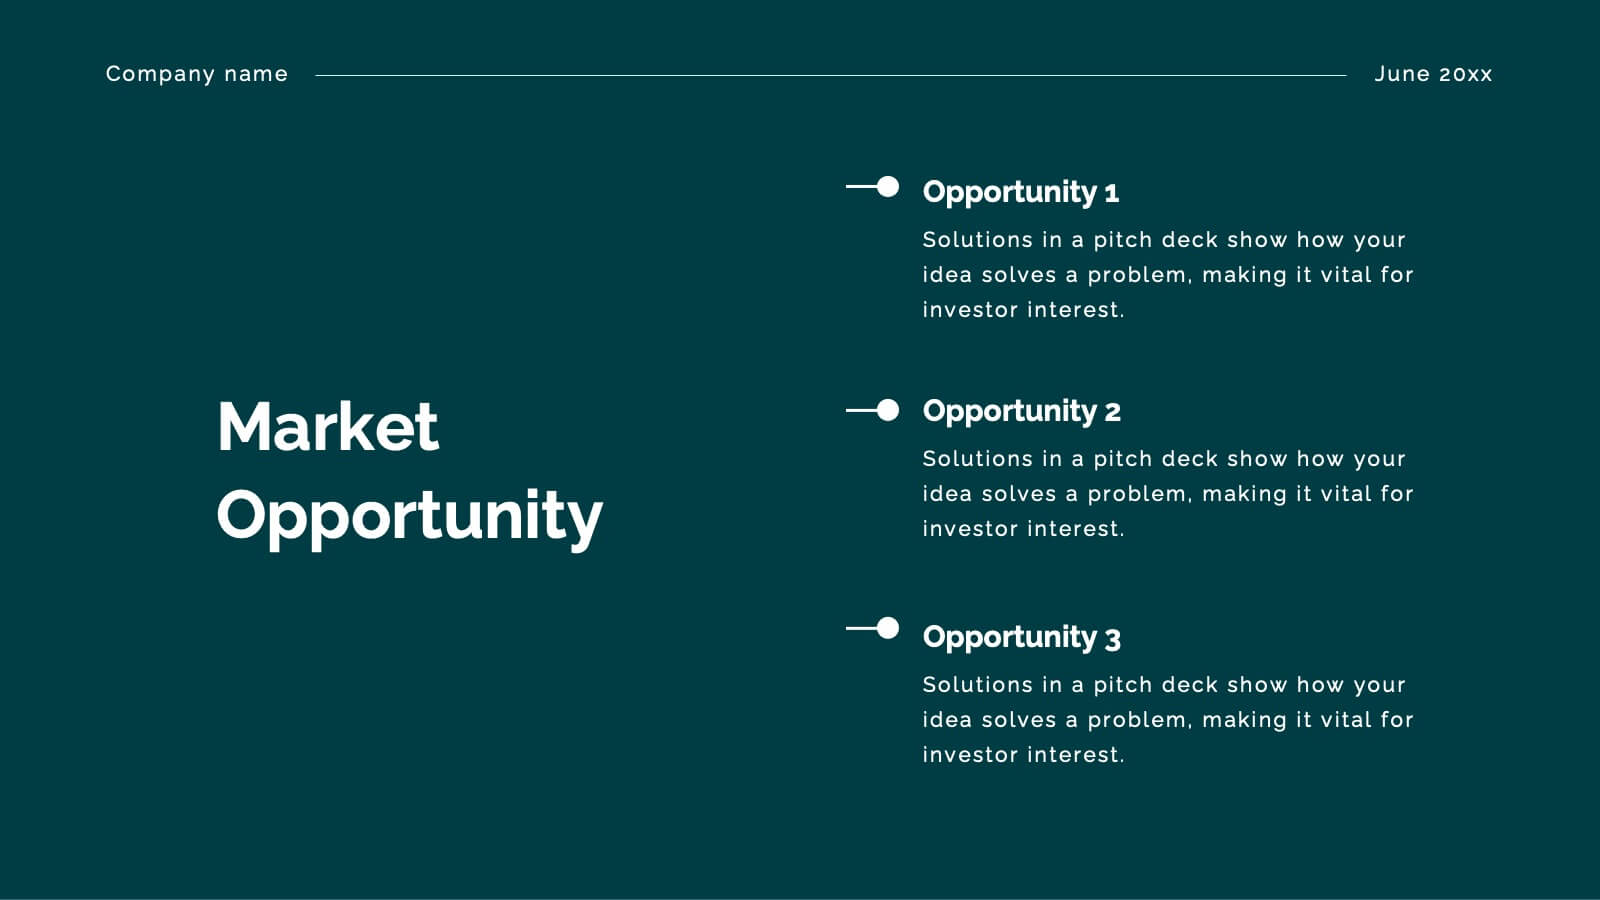
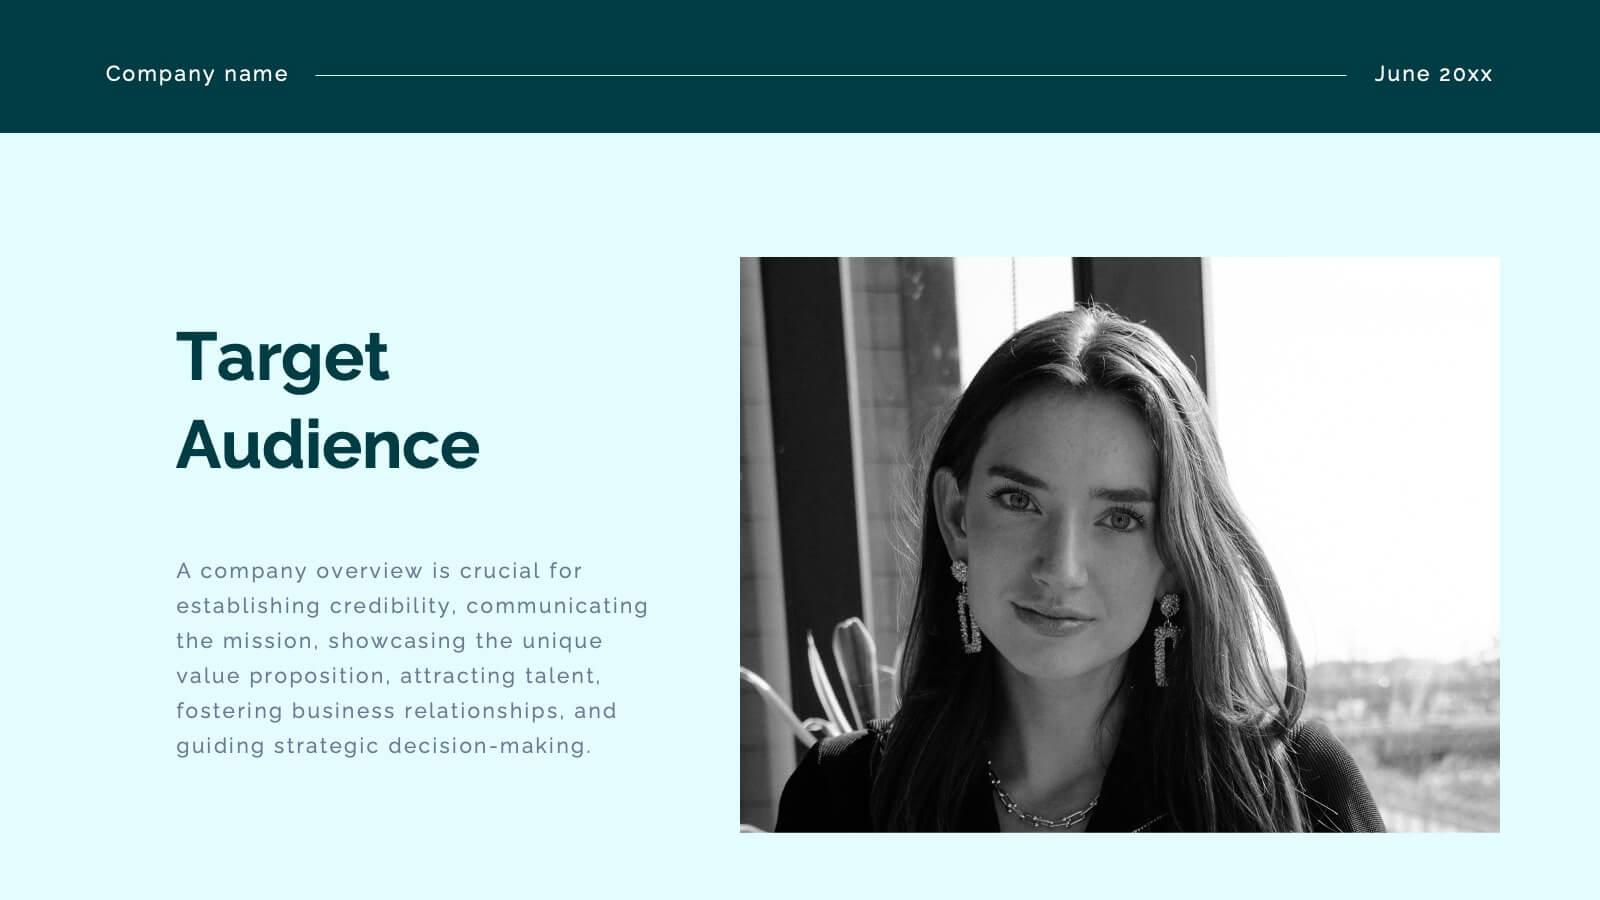
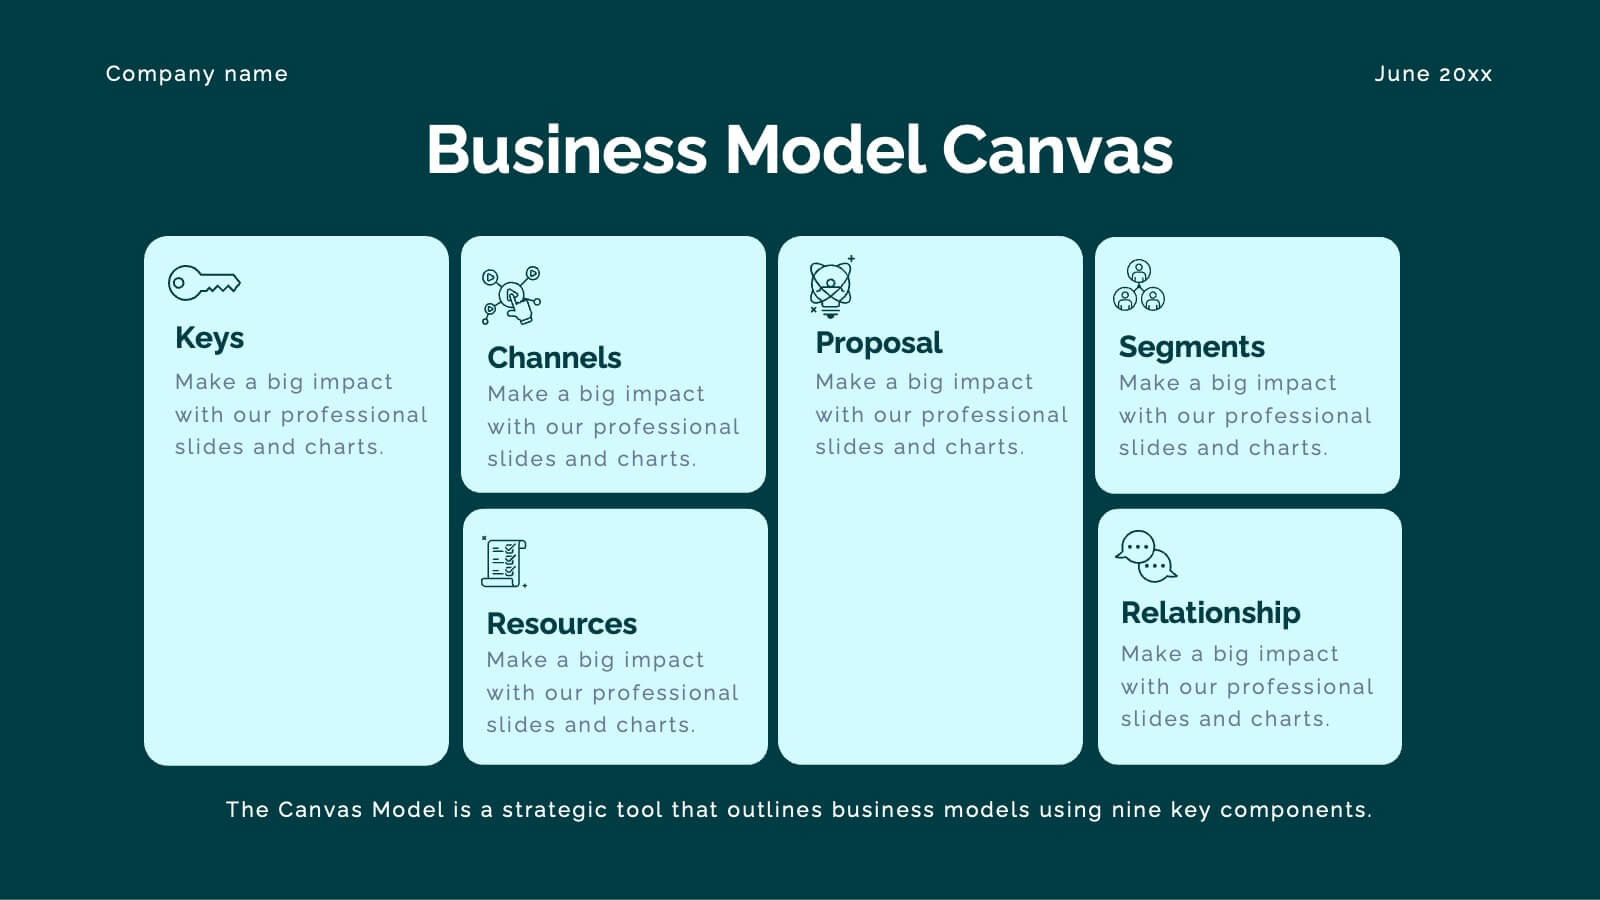
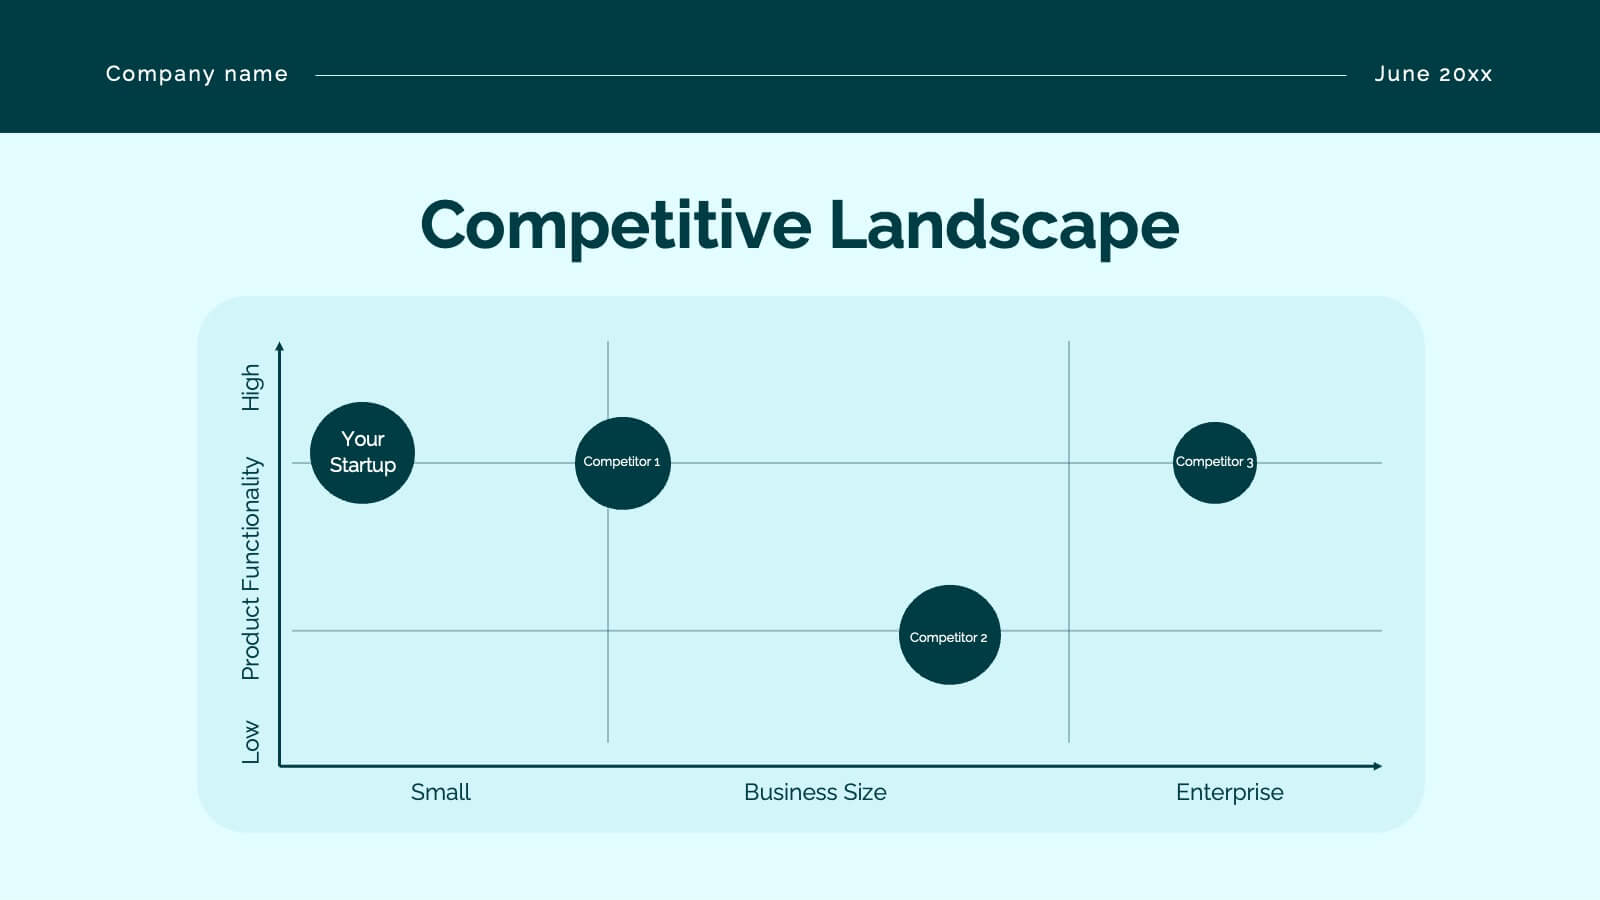
Unleash your potential with this powerful pitch deck template! Tailored for presenting innovative business ideas, it features slides for company overview, market opportunity, competitive landscape, and financial projections. Clearly communicate your value proposition and impress investors with professional design and concise content. Compatible with PowerPoint, Keynote, and Google Slides for seamless presentations on any platform.


5 slides
Next-Gen Networks and 5G Infrastructure Presentation
Build the future, one signal at a time. This engaging infographic presentation visually tracks the evolution of mobile network infrastructure, using a clean timeline layout with colorful tower icons and milestone markers. Perfect for tech educators, analysts, or engineers. Fully compatible with PowerPoint, Keynote, and Google Slides for seamless editing.


5 slides
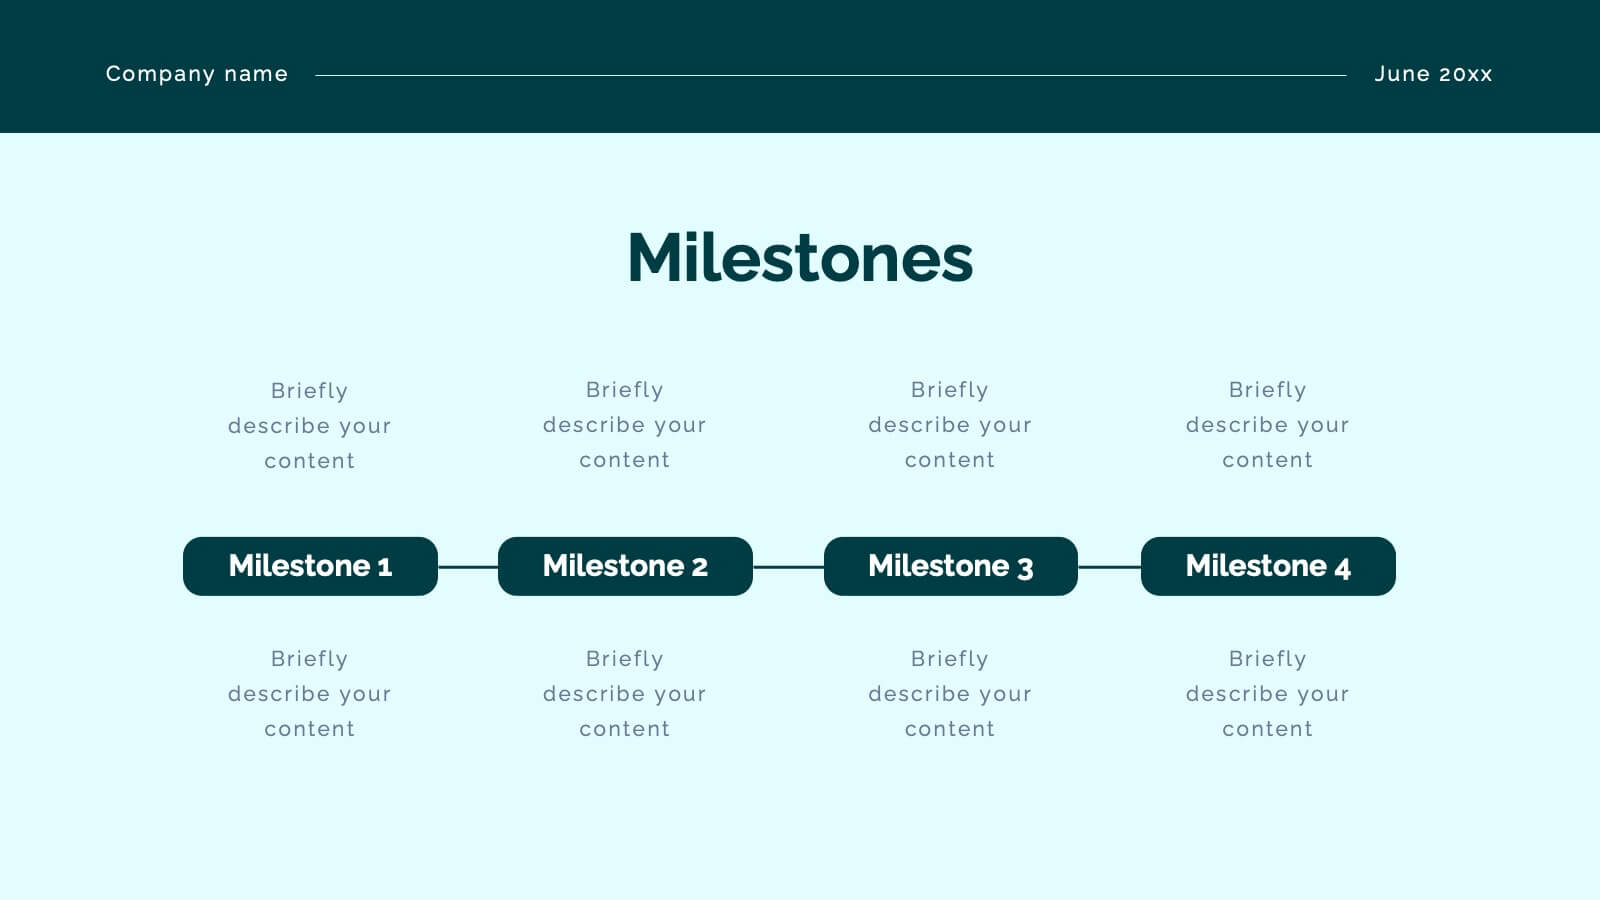
Future Planning and Next Steps Strategy Presentation
Map out your goals with clarity using the Future Planning and Next Steps Strategy Presentation. This slide features a sleek four-step curved timeline with editable icons and labels, ideal for outlining strategic actions or project phases. Easily customize each stage to match your business objectives. Compatible with PowerPoint, Keynote, and Google Slides.


6 slides
Project Proposal Goals Infographic
Maximize the impact of your project proposals with this professional collection of templates, designed to outline your project goals and strategies with precision. Each template facilitates clear communication of project objectives, timelines, and the desired outcomes, making them essential for project managers, consultants, and business analysts. These slides are crafted with a clean, corporate design that uses a harmonious blend of blue tones, engaging charts, and concise content layouts. This ensures that key points are easily digestible and effectively conveyed to stakeholders. The structured format of these templates is ideal for detailing the scope of work, expected milestones, and resource allocation, supporting a comprehensive overview of your project plan. Customize these templates to align with your organization's branding and project specifics, enhancing your presentation and strengthening the proposal's persuasive power. Whether for internal briefings or external pitches, these slides are tailored to help you present a coherent and compelling case for your projects.


6 slides
Go-to-Market Launch Plan Presentation
Launch with confidence using this Go-to-Market Launch Plan Presentation. This clean, step-by-step visual framework highlights each phase of your GTM strategy—from market research to execution metrics. Ideal for startups, product managers, and marketing teams. Fully customizable in PowerPoint, Keynote, and Google Slides.


6 slides
Business Project Proposal Template
Showcase your strategy with clarity and confidence using this sleek Business Project Proposal slide. Designed to highlight three core ideas or phases, it's perfect for pitching initiatives, presenting goals, or structuring deliverables. Compatible with PowerPoint, Google Slides, and Keynote for seamless editing and customization.


6 slides
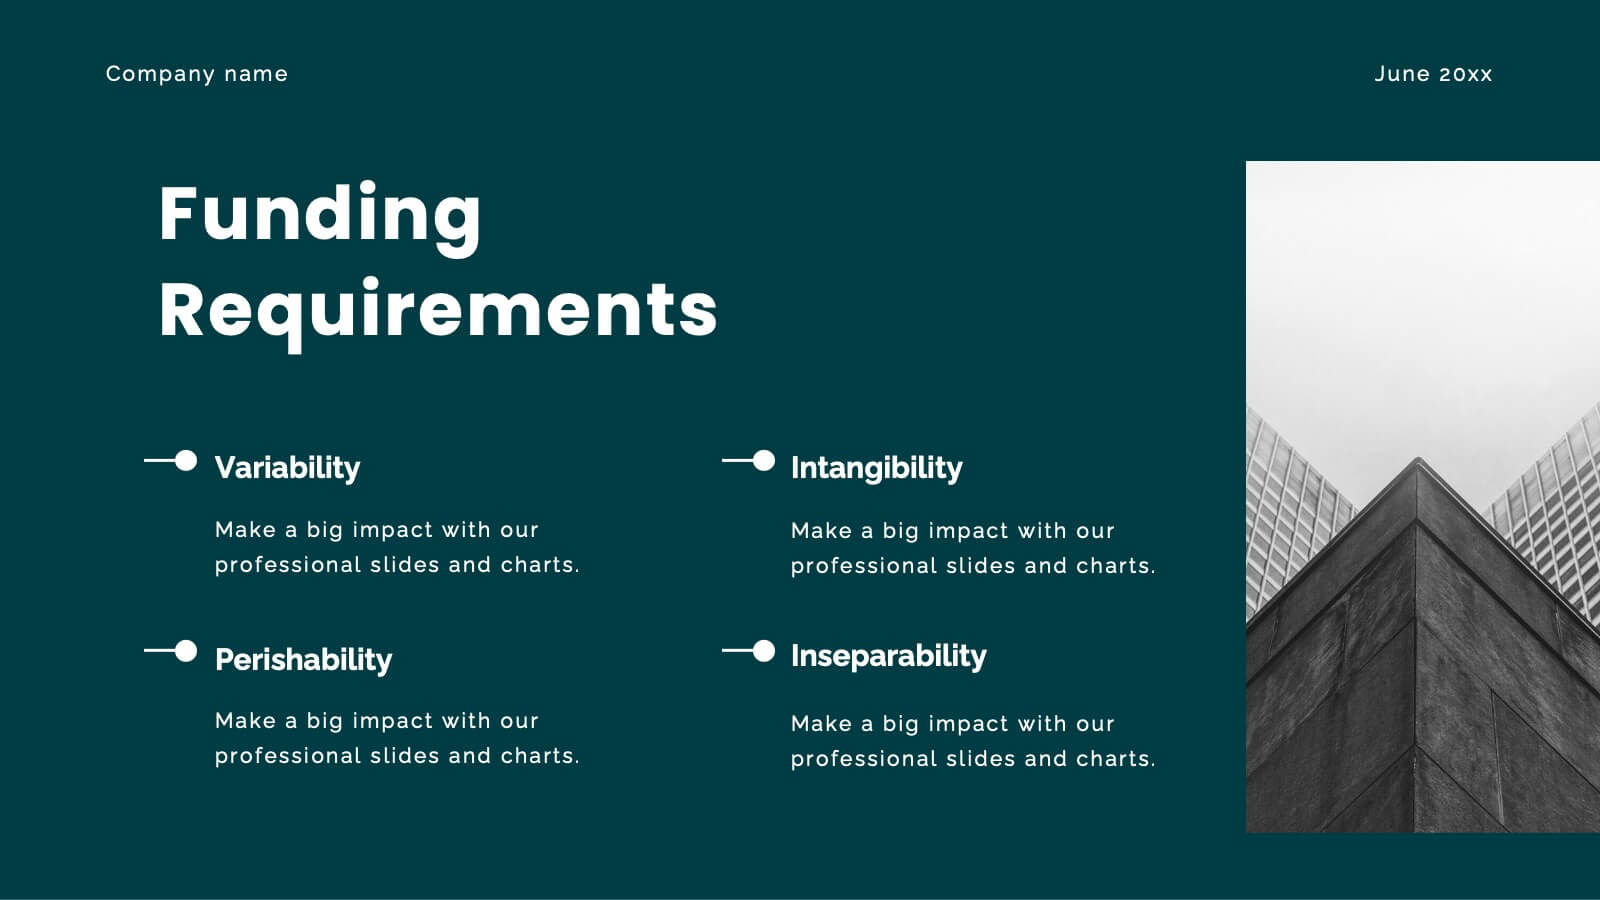
Key Points Overview Presentation
Bring your message to life with a slide that makes every key point feel clear, organized, and easy to follow. This presentation helps you highlight essential ideas, compare insights, and simplify complex information for any audience. Perfect for meetings, reports, or strategy updates. Fully compatible with PowerPoint, Keynote, and Google Slides.


5 slides
Concise Company Overview Executive Summary Presentation
Present your business snapshot with clarity using this Concise Company Overview Executive Summary Presentation. Featuring a colorful puzzle-style diagram with six customizable titles, this slide is ideal for outlining key departments, initiatives, or functions. Fully editable in PowerPoint, Keynote, Google Slides, and Canva for maximum flexibility.


4 slides
Resource Mapping in African Regions Presentation
Visualize regional distribution clearly with the Resource Mapping in African Regions Presentation. This engaging slide highlights key areas using color-coded map segments, helping you present data like resource allocation, project focus, or regional analysis with clarity. Ideal for NGOs, researchers, or government briefings. Compatible with PowerPoint, Keynote, Canva, and Google Slides.


3 slides
Business Ethics and Legal Guidelines Presentation
Navigate the complexities of corporate governance with the "Business Ethics and Legal Guidelines" template, designed to simplify and clarify the presentation of legal standards and ethical expectations in business environments.This visually engaging layout helps emphasize the progression and importance of each principle, ensuring clarity in communication. Ideal for training modules, compliance meetings, or strategic planning sessions, it's compatible with PowerPoint, Keynote, and Google Slides.


4 slides
Colorful Workflow Process Chart Presentation
Bring your workflow to life with a vibrant, easy-to-follow layout that makes every stage feel connected and purposeful. This presentation helps you map processes, explain team roles, and simplify complex steps using a clean, visual flow. Fully compatible with PowerPoint, Keynote, and Google Slides.


7 slides
IT Enterprise Architecture Infographic
IT Architecture, is a structured framework used to conceptualize software, hardware, network infrastructure, and related technology components and their relationships within an organization. This infographic template serves as a visual compass navigating the intricate realm of Information Technology architecture. Compatible with Powerpoint, Keynote, and Google Slides. Let the elegant design and comprehensive content guide you through the foundational pillars of digital excellence. Present an architectural framework illustration, outlining the fundamental structure that supports an organization's digital journey.


5 slides
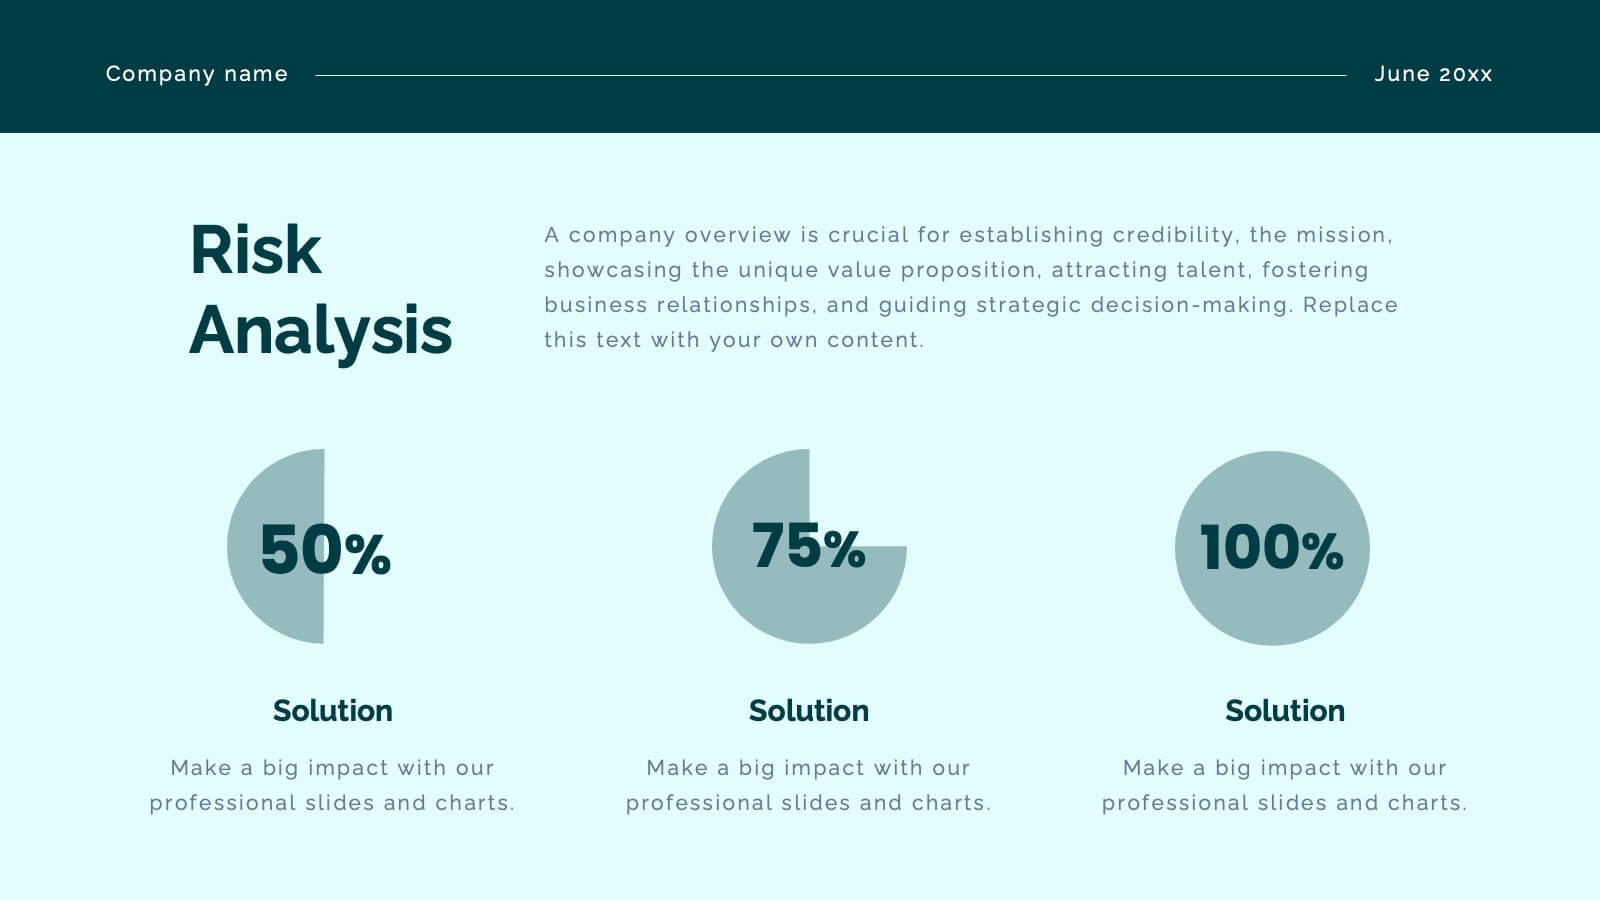
User Experience Survey Findings Presentation
Present key insights from your user research in a clean and impactful way with this survey findings slide. Designed to highlight percentages and categories clearly, it helps your audience quickly understand what users value most. Ideal for UX reports and product feedback reviews. Fully compatible with PowerPoint, Keynote, and Google Slides.


21 slides
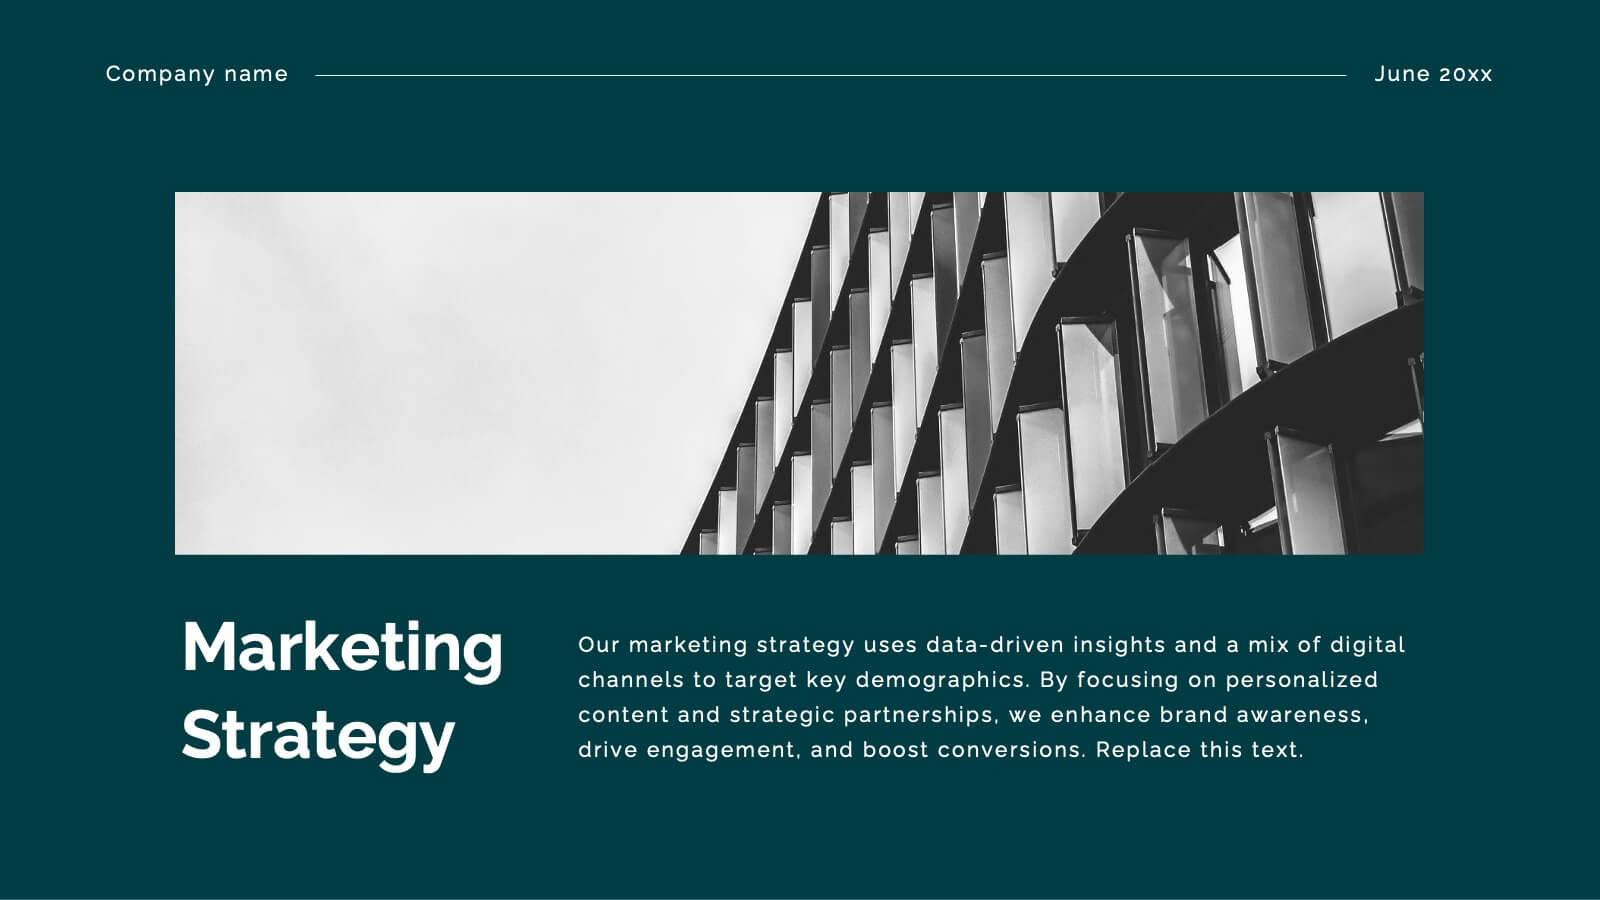
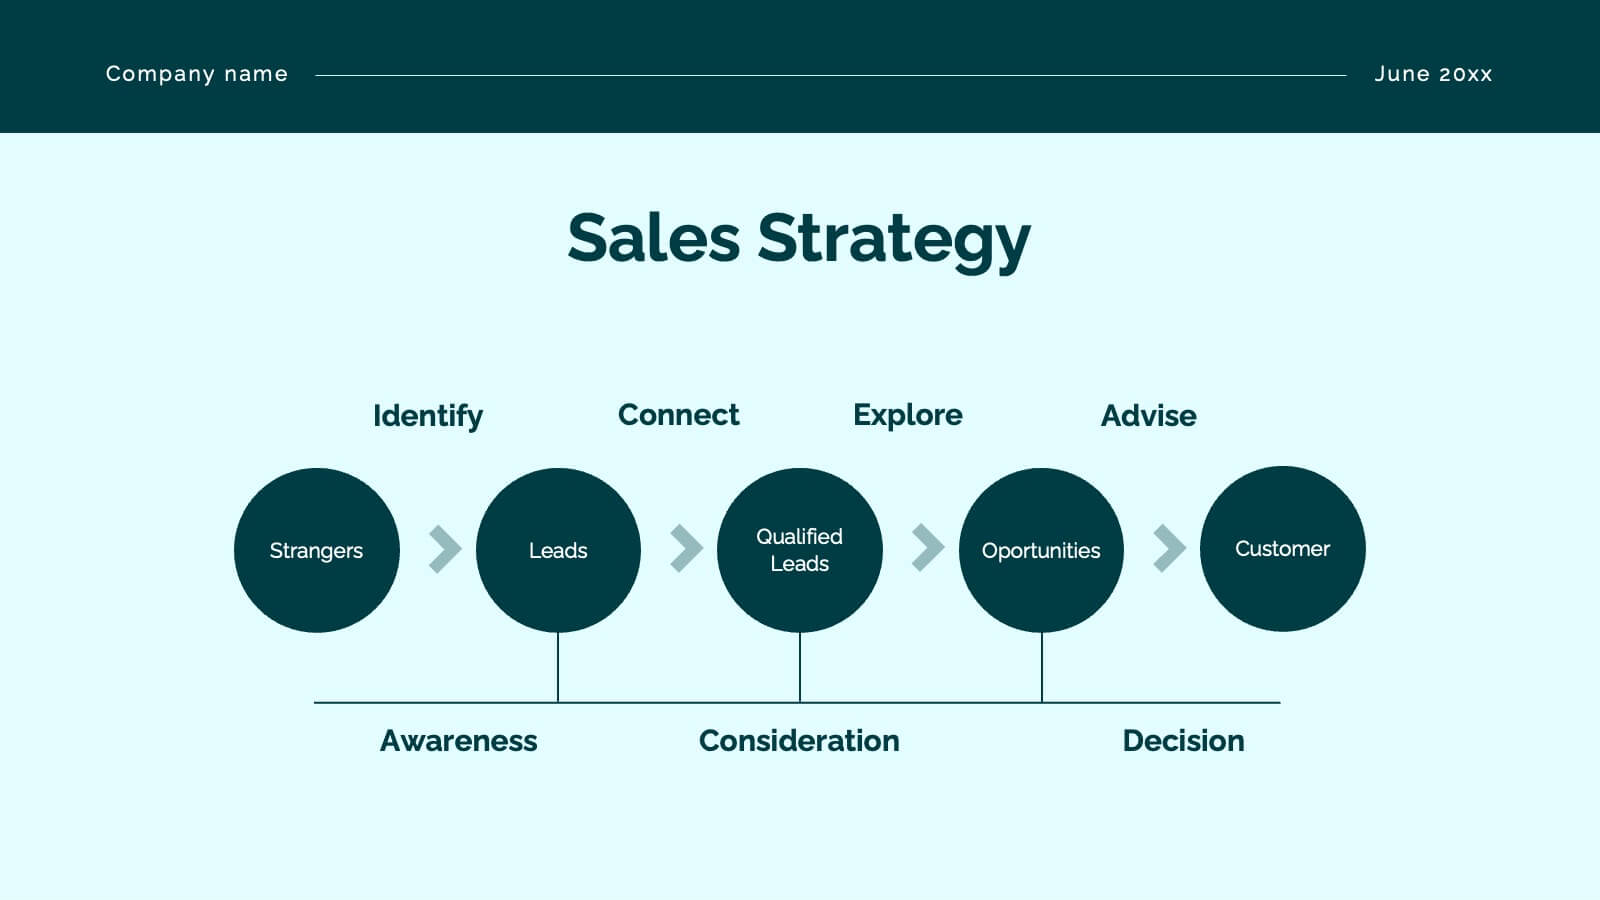
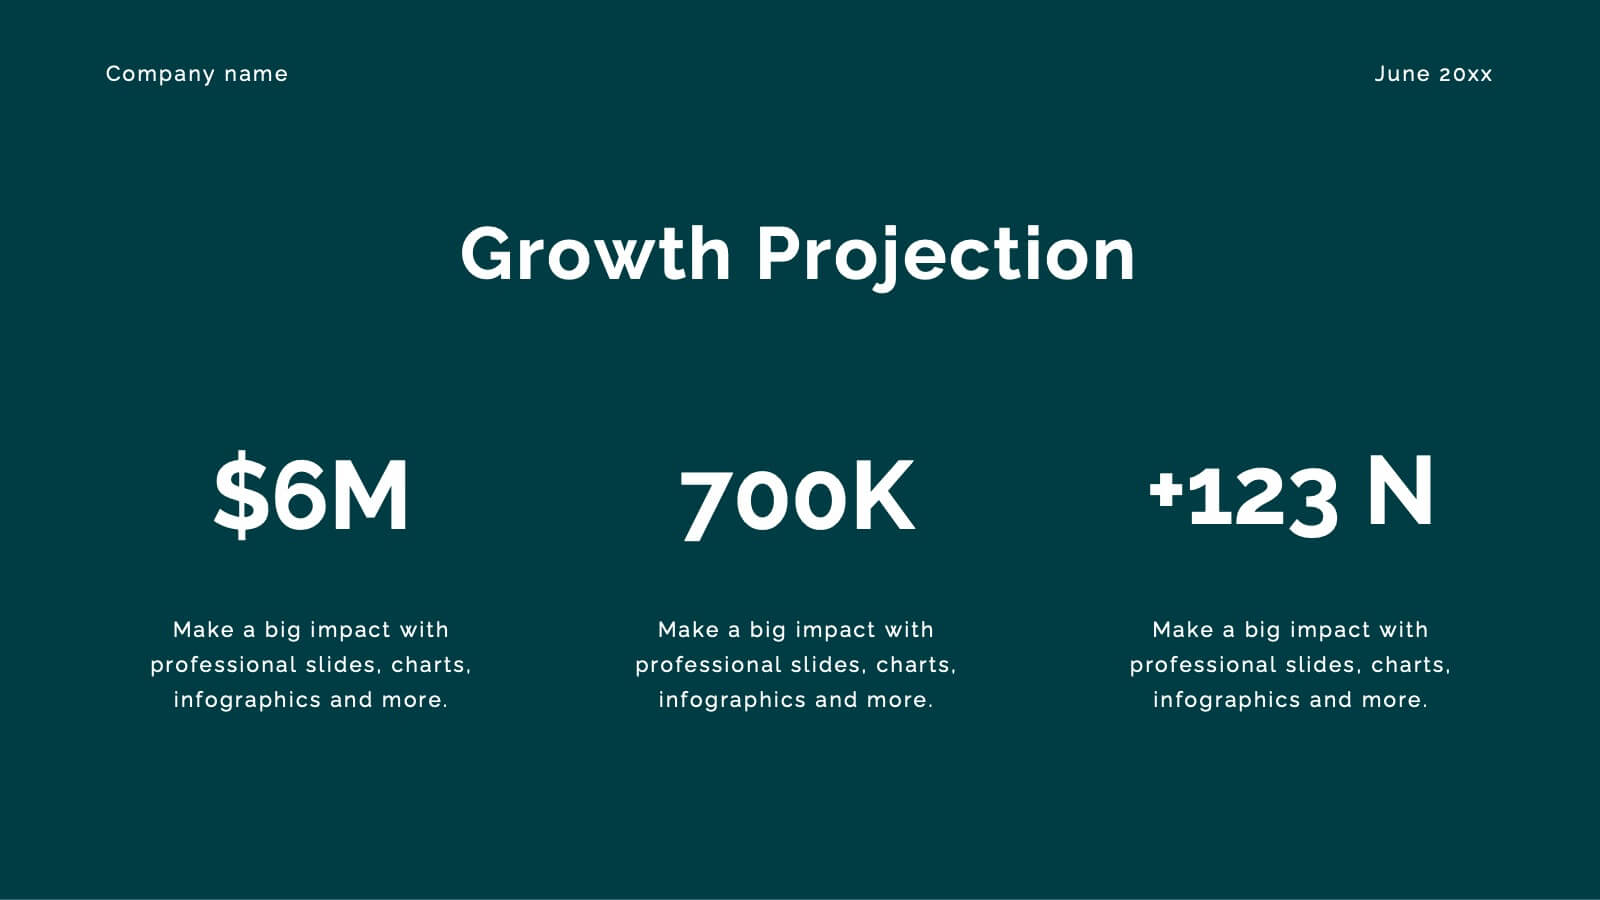
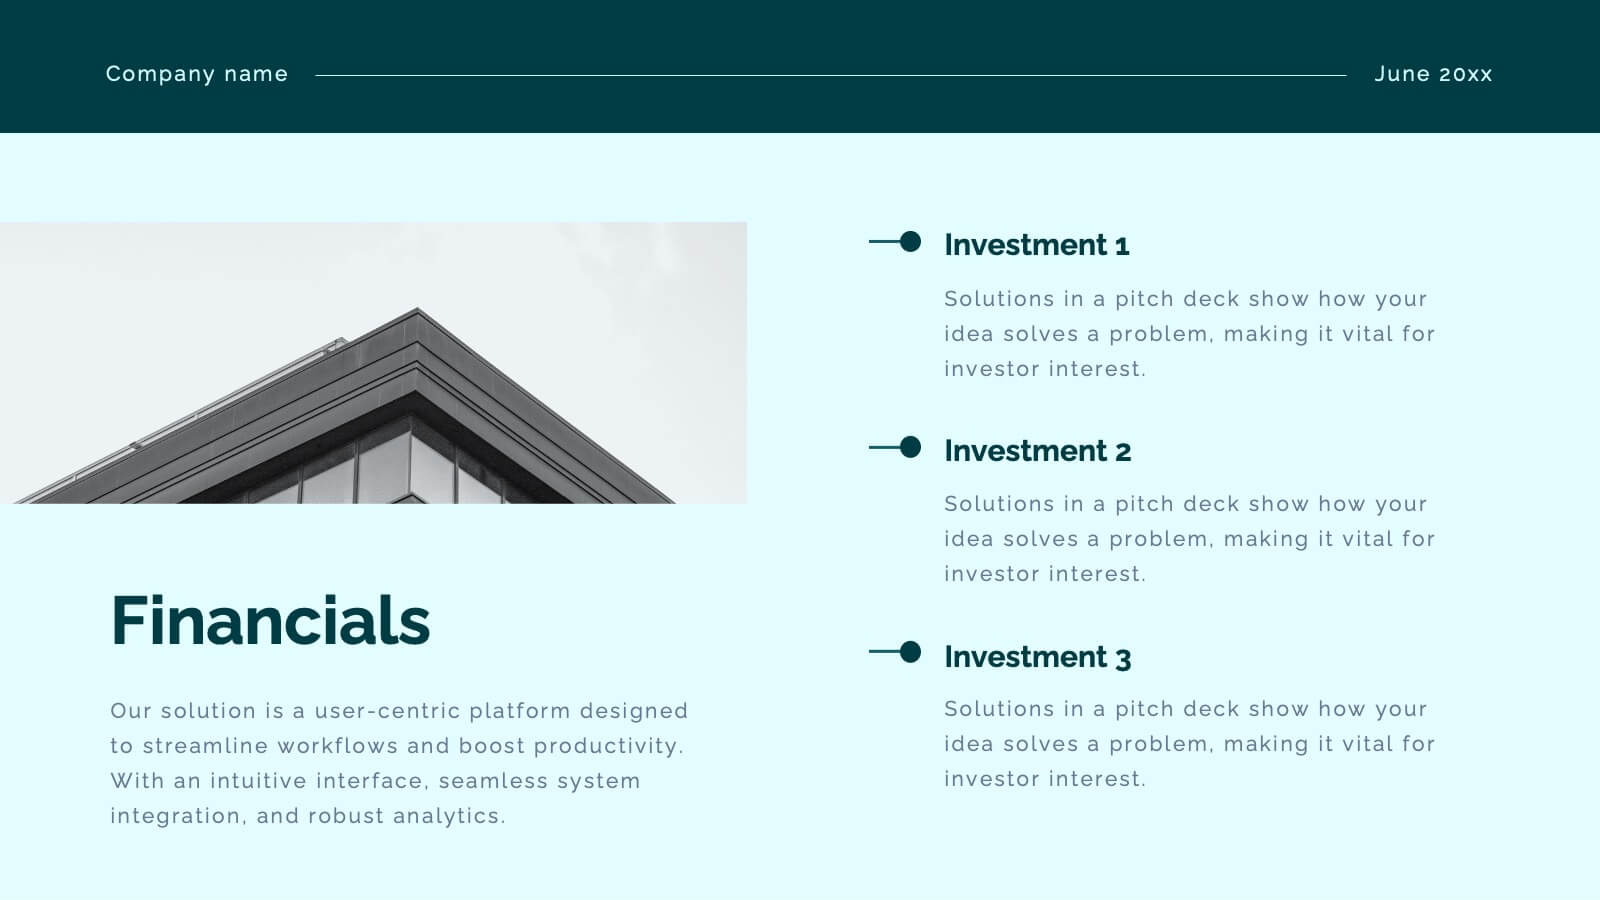
Delta Marketing Campaign Presentation
This dynamic Marketing Campaign template covers everything from market presence to target audience and financial highlights. With a sleek, professional design, it helps you showcase your brand’s unique selling points and industry recognition. Compatible with PowerPoint, Keynote, and Google Slides for easy, impactful presentations.


4 slides
USA, Canada & Mexico Business Reach Presentation
Showcase your regional presence with the USA, Canada & Mexico Business Reach Presentation. This slide helps you pinpoint key business activities or initiatives across North America using colorful map markers and customizable icons. Ideal for market updates or growth plans. Fully editable in Canva, PowerPoint, and Google Slides.