


Features
- 8 Unique slides
- Fully editable and easy to edit in Microsoft Powerpoint, Keynote and Google Slides
- 16:9 widescreen layout
- Clean and professional designs
- Export to JPG, PDF or send by email


Do you have any questions?
Recommend


7 slides
SCRUM Roles Infographic
Dive into the agile world with our SCRUM roles infographic. This template is designed to depict the various roles within the SCRUM framework, offering clarity and insight into the collaborative heart of agile methodologies. With a clean white canvas set against hues of blue, it provides a modern yet comprehensive overview of the roles. Ideal for agile coaches, trainers, and organizations transitioning to agile methodologies, this infographic is tailored to showcase the importance of each role. With its compatibility, spanning PowerPoint, Keynote, and Google Slides, presentations are bound to be a breeze, regardless of the platform you favor.


5 slides
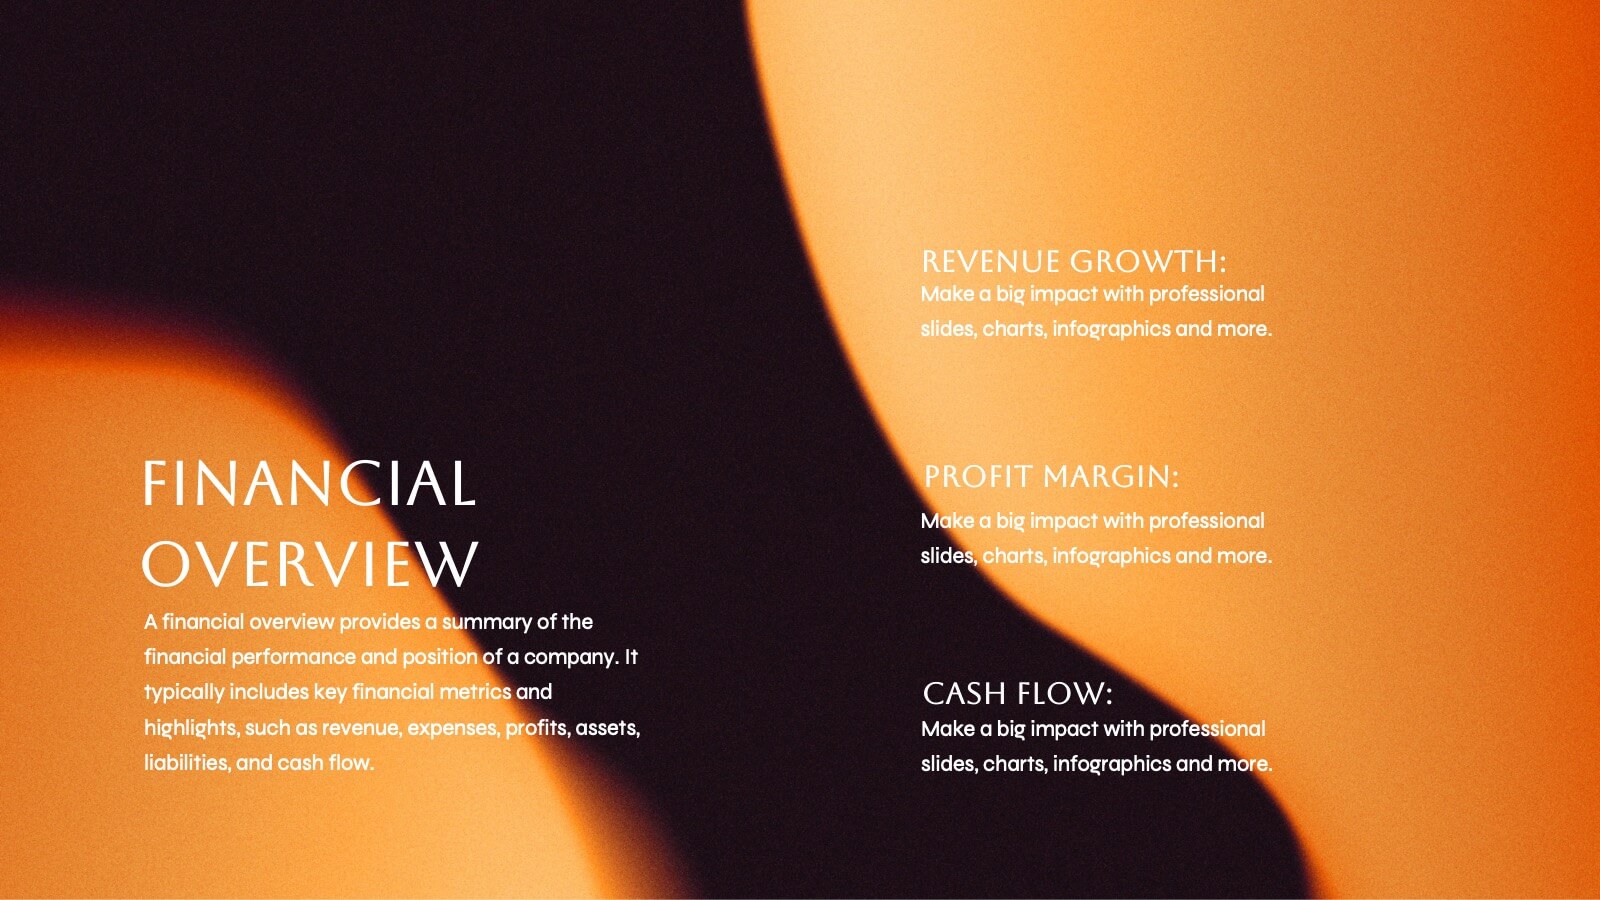
Business Problem Statement Presentation
Clarify challenges and drive solutions with this business problem statement template! Designed for strategic planning, this structured layout helps you define key issues, analyze root causes, and communicate insights effectively. Ideal for business leaders, consultants, and project managers. Fully customizable and compatible with PowerPoint, Keynote, and Google Slides for seamless use.

20 slides
Fire Spin Startup Pitch Deck Presentation
Ignite your pitch with this bold, fire-inspired presentation template, perfect for showcasing your startup’s potential! This deck helps you present key business elements like market research, revenue models, and growth strategies in a dynamic, visually engaging format. Stand out from the competition. Compatible with PowerPoint, Keynote, and Google Slides.


5 slides
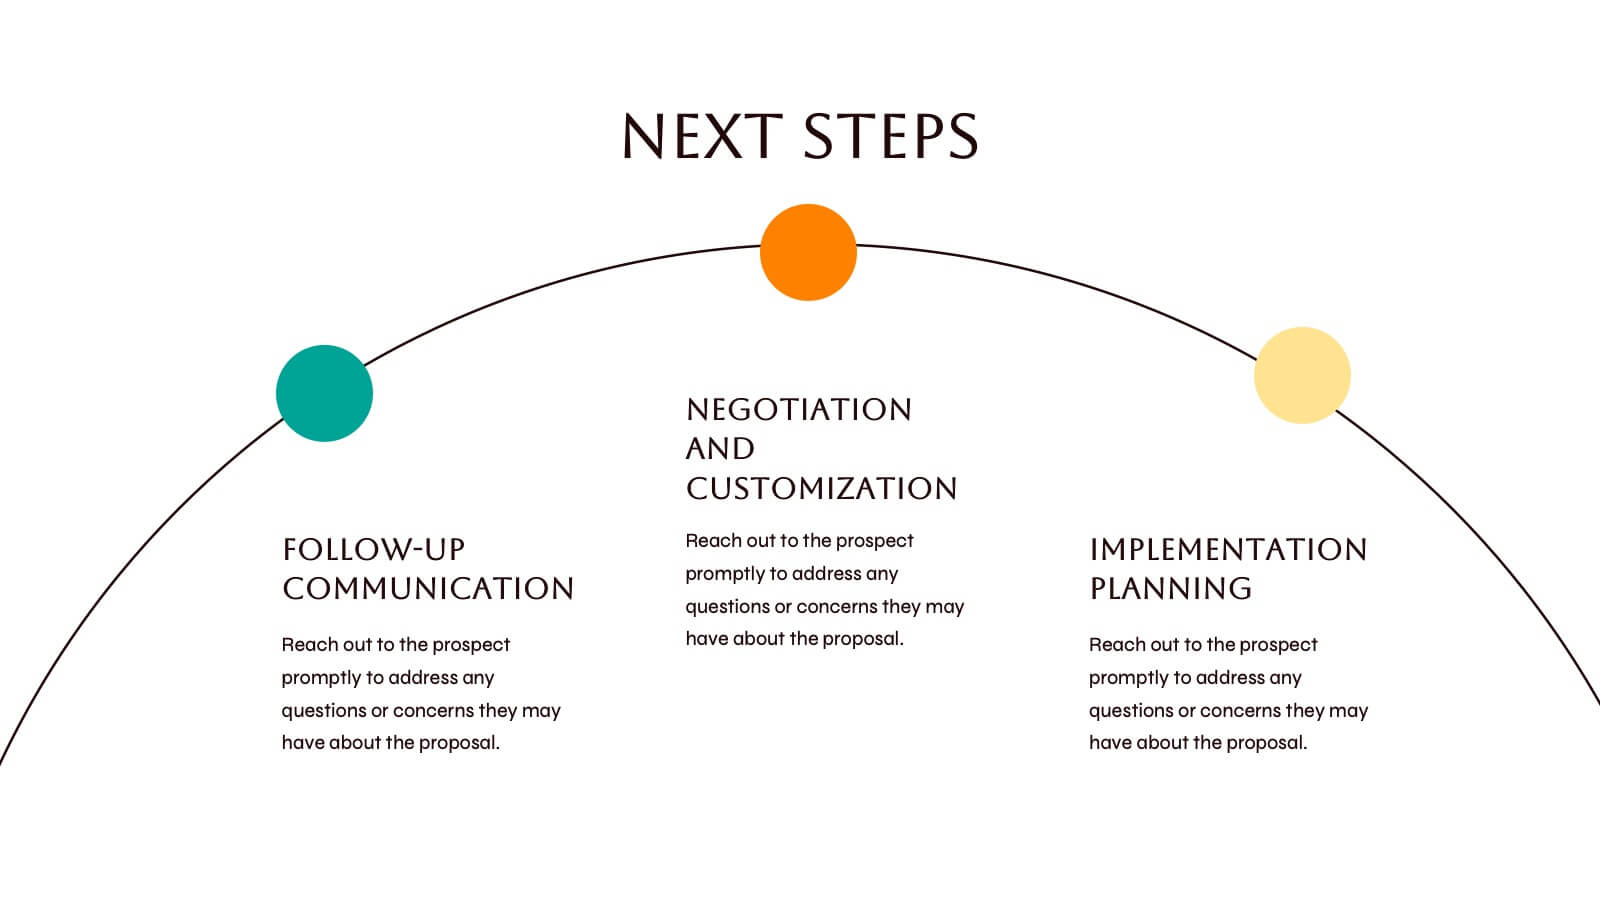
Key Drivers Behind Success Strategy Presentation
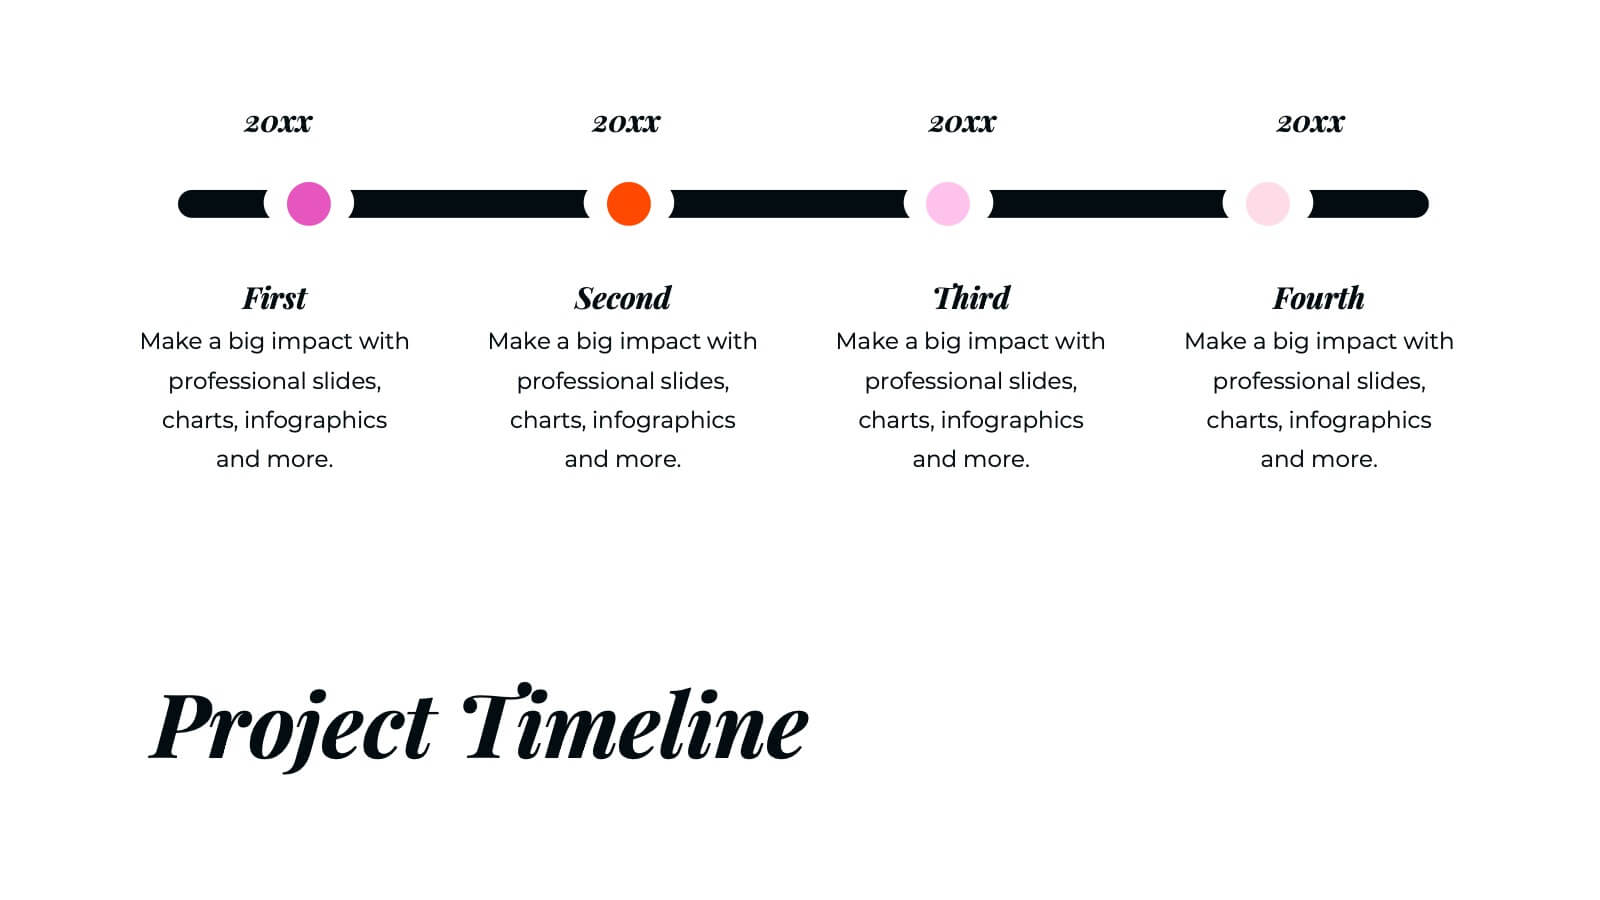
Highlight the building blocks of your business strategy with the Key Drivers Behind Success Strategy Presentation. This sleek, horizontal infographic uses a timeline-style layout with four labeled checkpoints—perfect for showcasing essential success factors, strategic pillars, or operational milestones. Ideal for leadership updates or corporate planning decks. Fully editable in Canva, PowerPoint, Keynote, and Google Slides.


7 slides
Modern Artificial Intelligence Infographic
Modern Artificial Intelligence refers to the contemporary state of AI technology, methods, and applications that have evolved significantly in recent years, especially from the early 21st century onwards. This infographic template is designed to present complex information in a clear and engaging manner. This template uses visuals like charts, graphs, icons, and text to enhance understanding. The objective of this infographic is to provide a visual and informative snapshot of the contemporary landscape of artificial intelligence, making complex concepts accessible to a broad audience.


5 slides
Real-Time KPI's Monitoring Dashboard Presentation
Track performance at a glance with this Real-Time KPI Monitoring Dashboard Presentation. Featuring clean bar visuals, circular gauges, and a numeric display, this layout is ideal for presenting five key metrics and their progress. Perfect for executive updates, marketing reports, or business reviews. Fully editable in PowerPoint, Keynote, Google Slides, and Canva.


6 slides
Product Launch Pitch Deck
Make your product debut unforgettable with this dynamic pitch deck slide. Featuring clean visuals, pie chart stats, and a mobile app mockup, it’s ideal for tech startups and innovative brands. Fully customizable in PowerPoint, Keynote, and Google Slides, it's perfect for presenting key product benefits and performance highlights.


6 slides
Green Innovation and Eco Impact Presentation
Present your sustainability initiatives with this circular eco infographic. Ideal for showcasing six stages of environmental impact, green innovation, or lifecycle analysis. Features clean, modern icons and color-coded segments. Fully editable in PowerPoint, Keynote, and Google Slides—perfect for corporate ESG updates, eco campaigns, or environmental project planning.


6 slides
5 Forces Market Strategy Framework Presentation
Visualize your competitive strategy with this 5 Forces Market Framework. Highlight key elements like Buyer, Supplier, New Entry, Substitutes, and Competitive Rivalry using a clean, circular layout. Ideal for strategic analysis, business planning, or investor pitches. Fully editable in PowerPoint, Keynote, and Google Slides for seamless customization.


7 slides
Programming Framework Infographic
Delve into the intricate world of coding with the programming framework infographic. With a harmonious palette of blue, white, and green, this template visualizes the intricacies of different programming frameworks in a clear and engaging manner. Tailor-made for developers, software engineers, educators, and tech enthusiasts, it transforms complex concepts into digestible visual snippets. Embedded with custom graphics, relevant icons, and adaptable image placeholders, it enhances any tech presentation. Moreover, its seamless adaptability with PowerPoint, Keynote, and Google Slides ensures you leave a lasting impression.


4 slides
Customers Journey Map Presentation
Take your audience on a smooth, visual adventure that clearly outlines each stage of the customer experience. This presentation helps you map behaviors, highlight key interactions, and explain decision points with clarity and style. Designed for easy customization and fully compatible with PowerPoint, Keynote, and Google Slides.


7 slides
Modern Food Menu Presentation
Bring your ideas to the table with a clean and modern layout that turns any food-related content into an easy, visually appealing story. This presentation helps you showcase dishes, categories, or menu insights with clarity and style, making information simple to follow. Fully compatible with PowerPoint, Keynote, and Google Slides.


26 slides
Company Profile Simple Duotone Presentation
Introducing our premier company profile presentation template, designed to beautifully encapsulate the essence of your business. Set against a backdrop that transitions from the serene blue sky to a deeper, more intense blue, this template evokes feelings of limitless possibilities and profound depth. This dual-tone theme, with its varying shades of blue, not only emphasizes trust, professionalism, and reliability but also creates an atmosphere of calm and stability, essential attributes for showcasing your company's strengths and accomplishments. Modern in its layout, our template facilitates a structured presentation of your company's history, mission, achievements, and future aspirations. The design intricately merges the visuals of the expansive sky with the profound depth of the darker hue, creating a narrative that speaks of a firm foundation with an eye on soaring to new heights. Perfectly compatible with both PowerPoint and Google Slides, this template offers ease of customization. Whether it's adjusting the content to fit your corporate story or tweaking the design elements, this template offers flexibility and user-friendliness. Dive deep into your company's journey and aspirations with this exquisite blue-themed template. It's not just a presentation; it's a reflection of your company's ethos and vision. Utilize this template to give stakeholders, partners, and employees a p....


4 slides
Strategic Gap Planning Template Presentation
Visually map the journey from current state to strategic goals with this puzzle-themed gap analysis template. Ideal for identifying key disconnects, setting priorities, and aligning teams. Fully editable and designed for clarity, this presentation works in PowerPoint, Keynote, and Google Slides—perfect for planning sessions, roadmaps, and executive briefings.


5 slides
Eco-Friendly Business Practices
Highlight sustainable strategies with this clean, eco-focused slide. Featuring a green triangle recycling loop with sprouting leaves, it's ideal for presenting environmental initiatives, green policies, or sustainability goals. Customize each section with your data to show actionable steps or impact metrics. Fully editable in PowerPoint, Keynote, and Google Slides.

22 slides
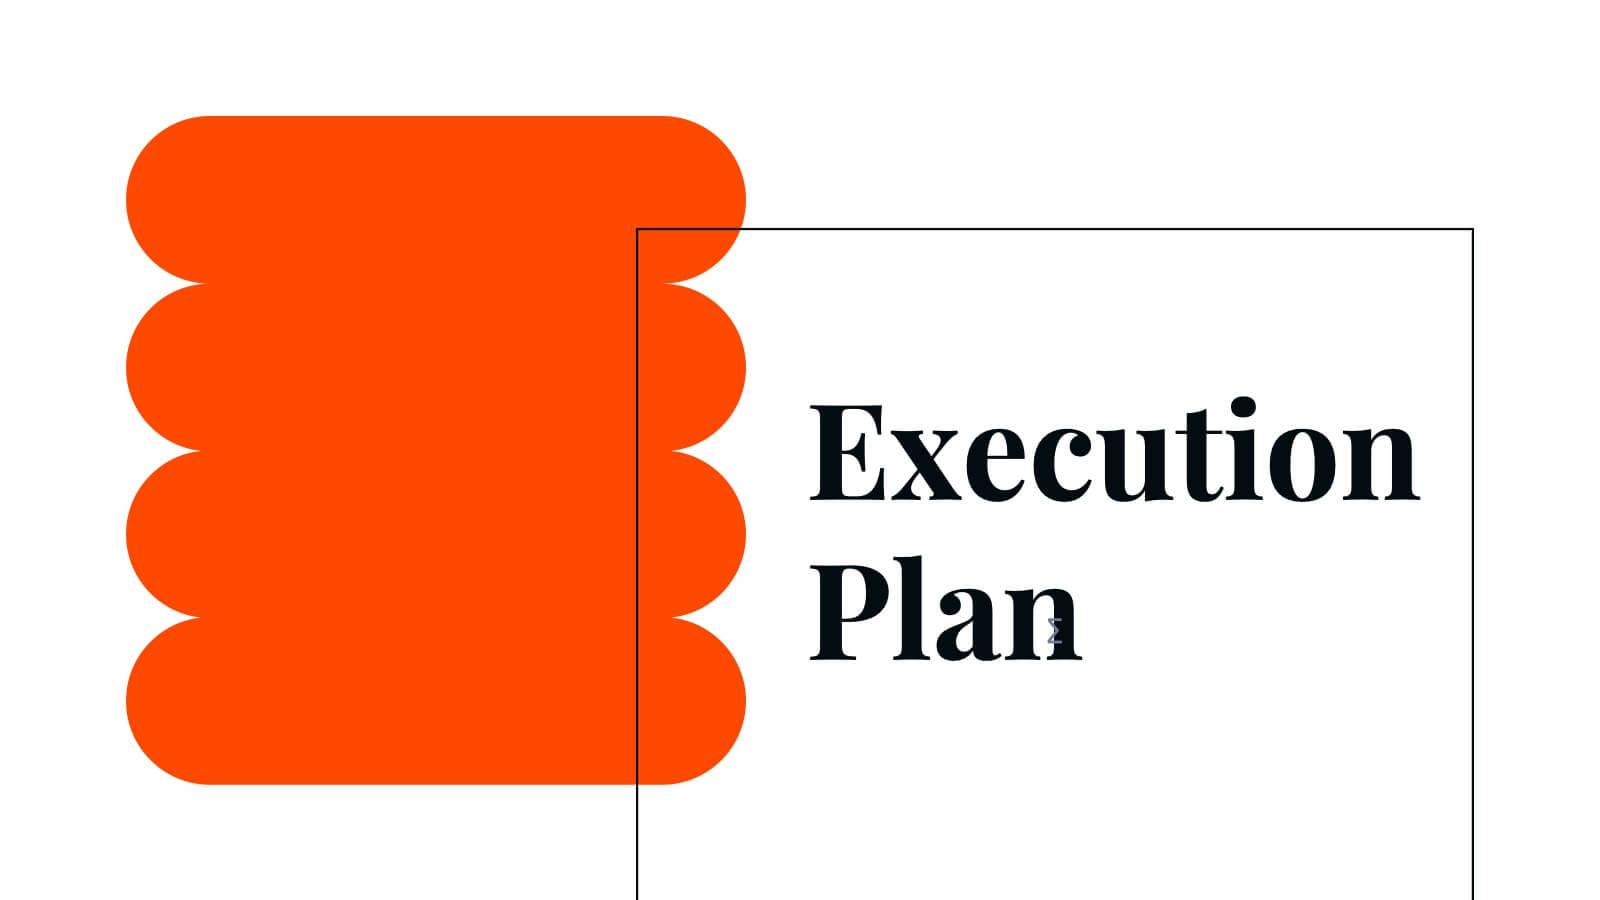
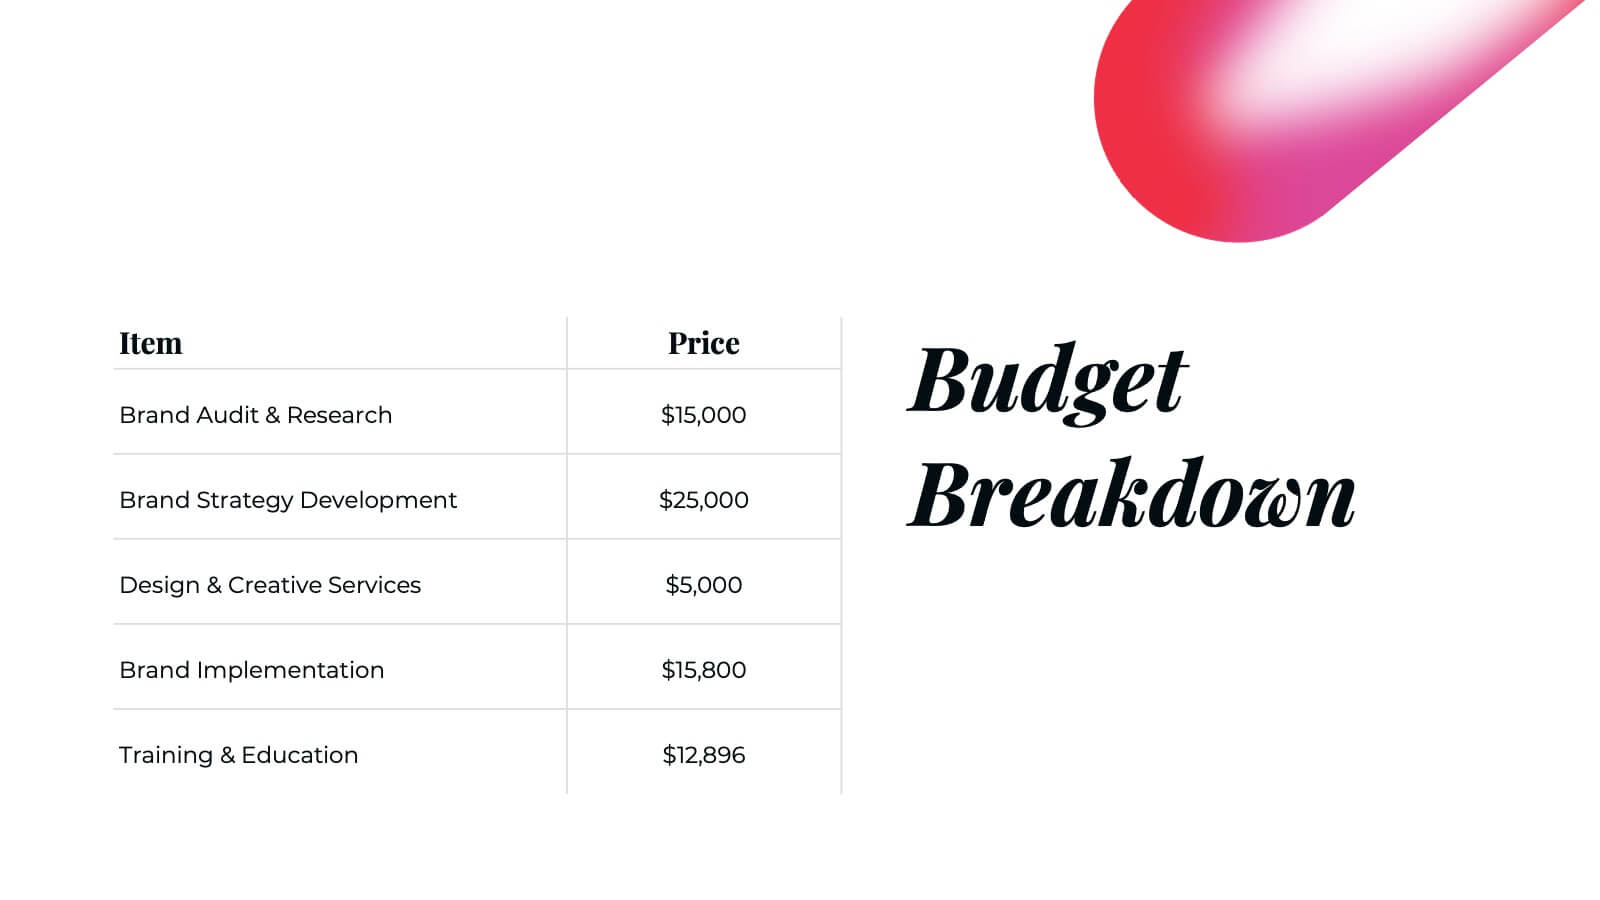
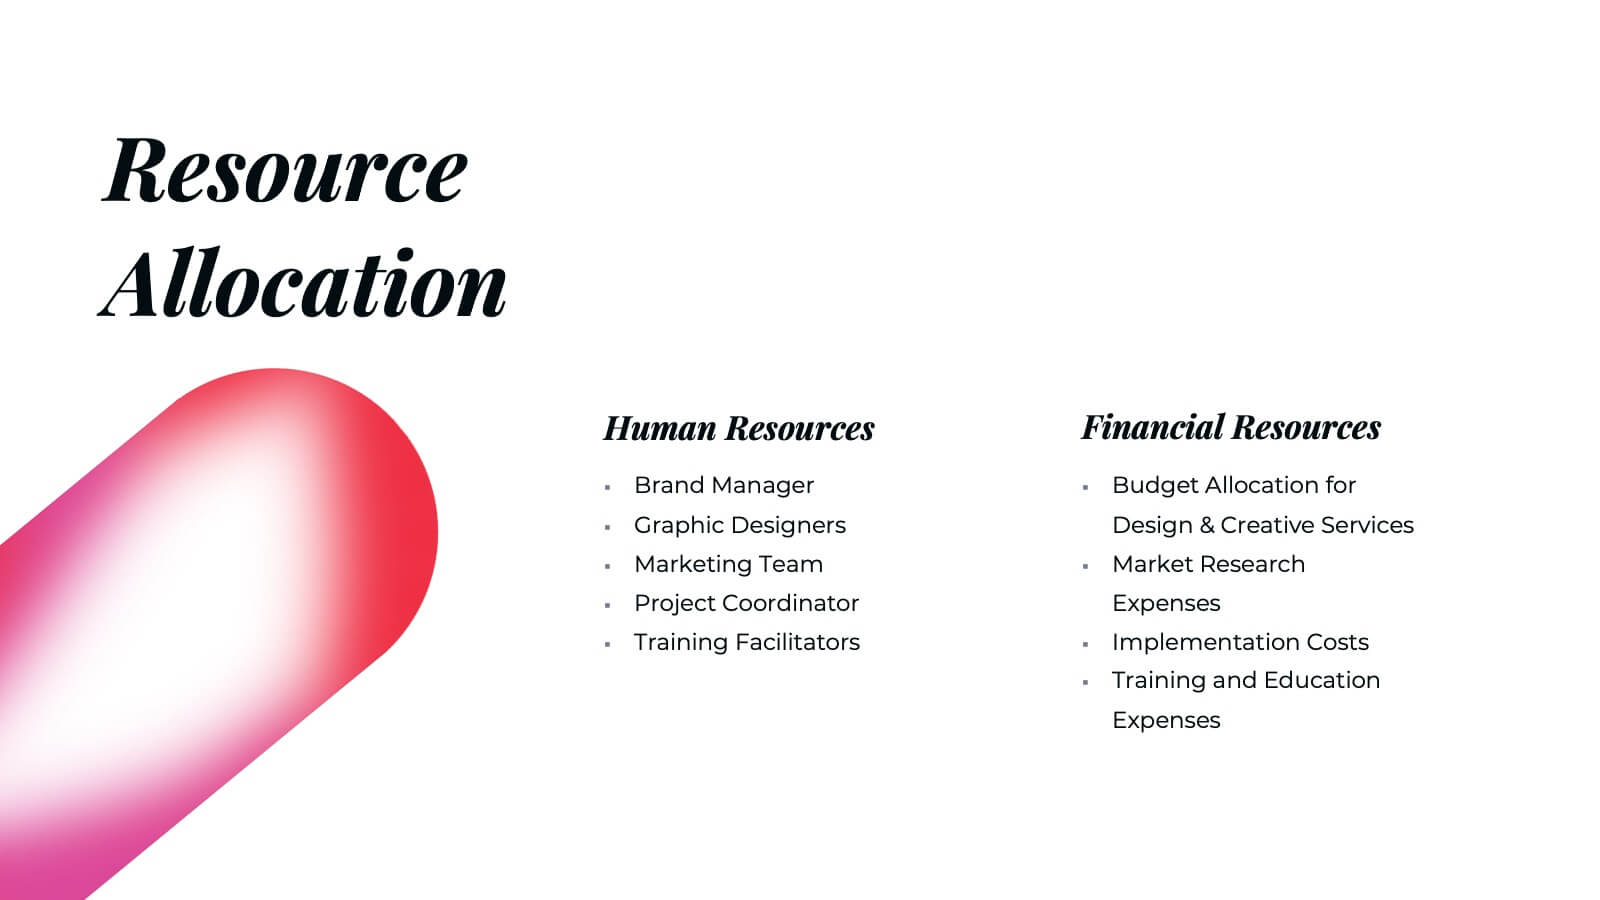
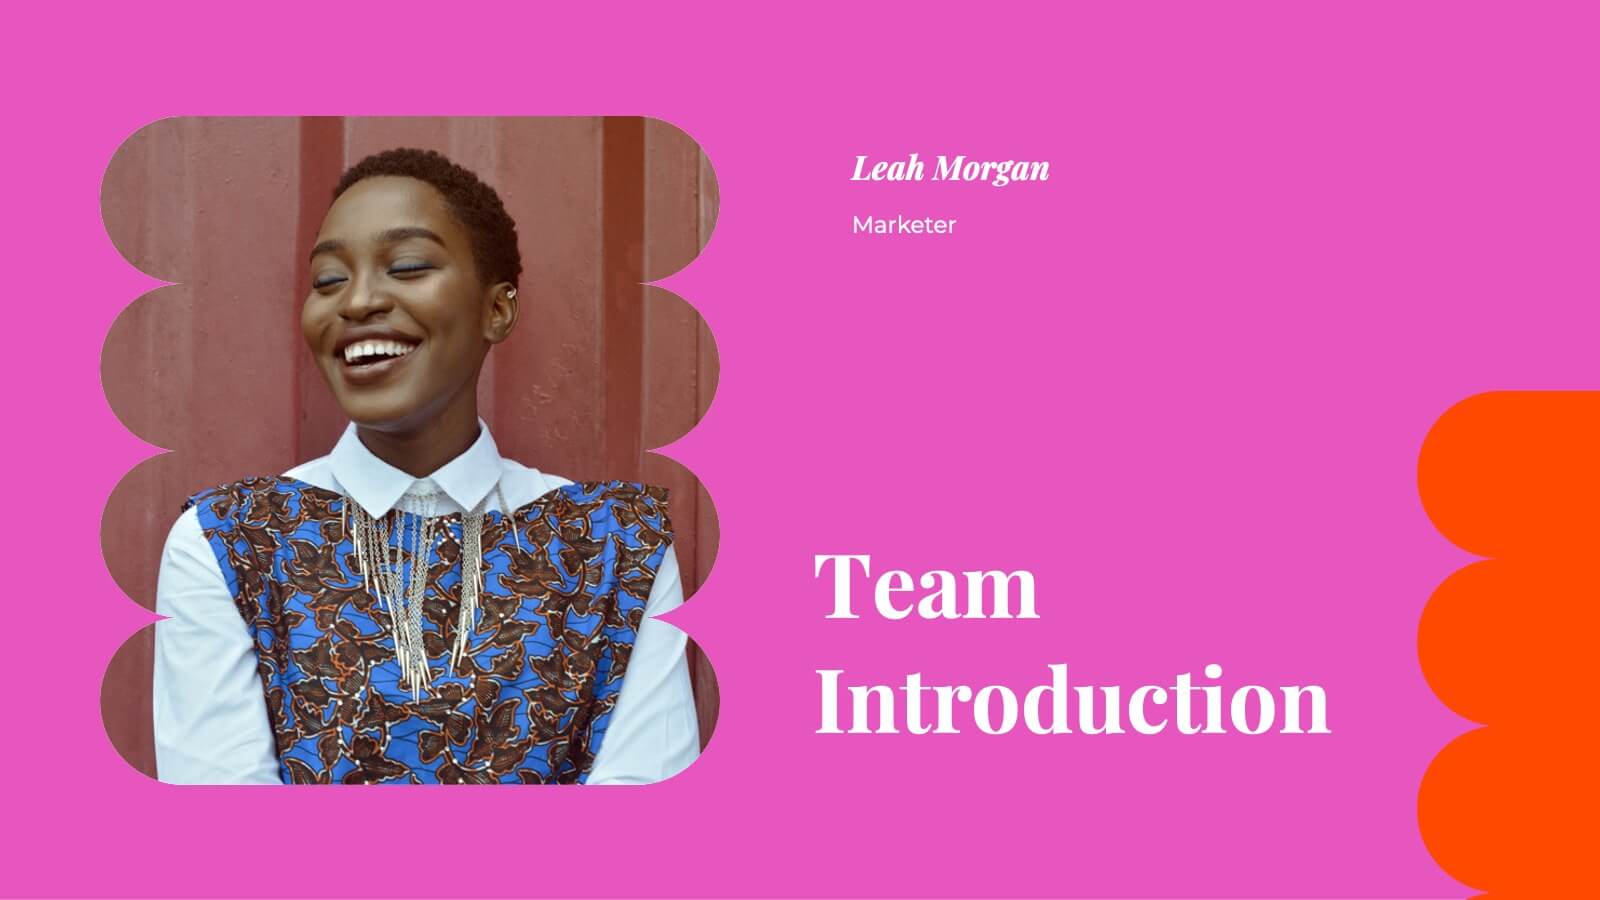
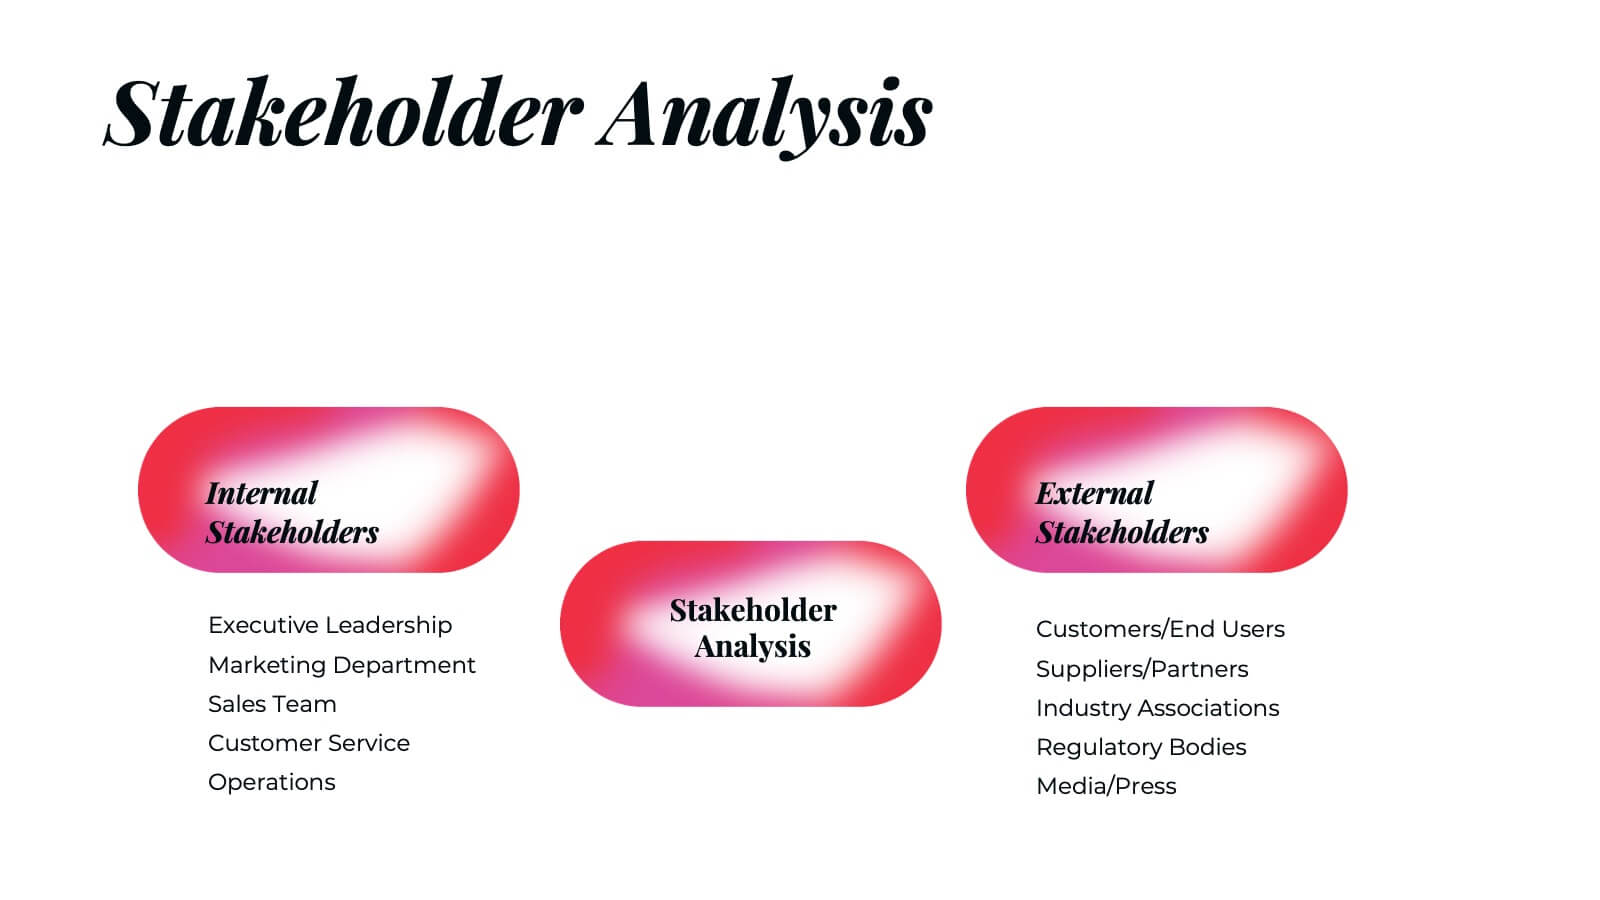
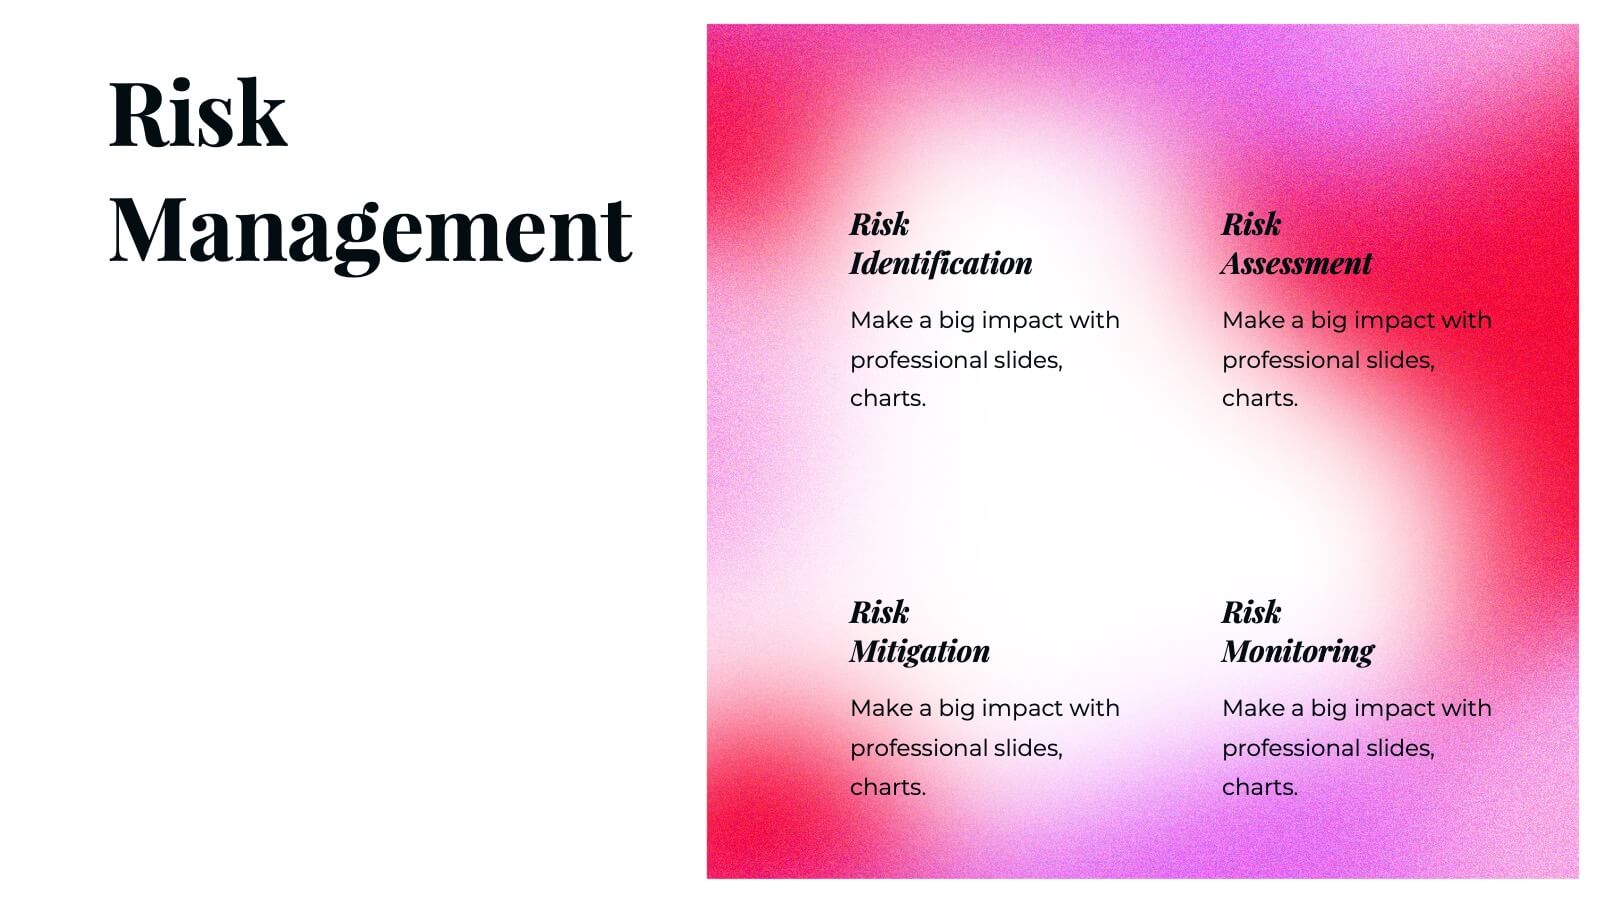
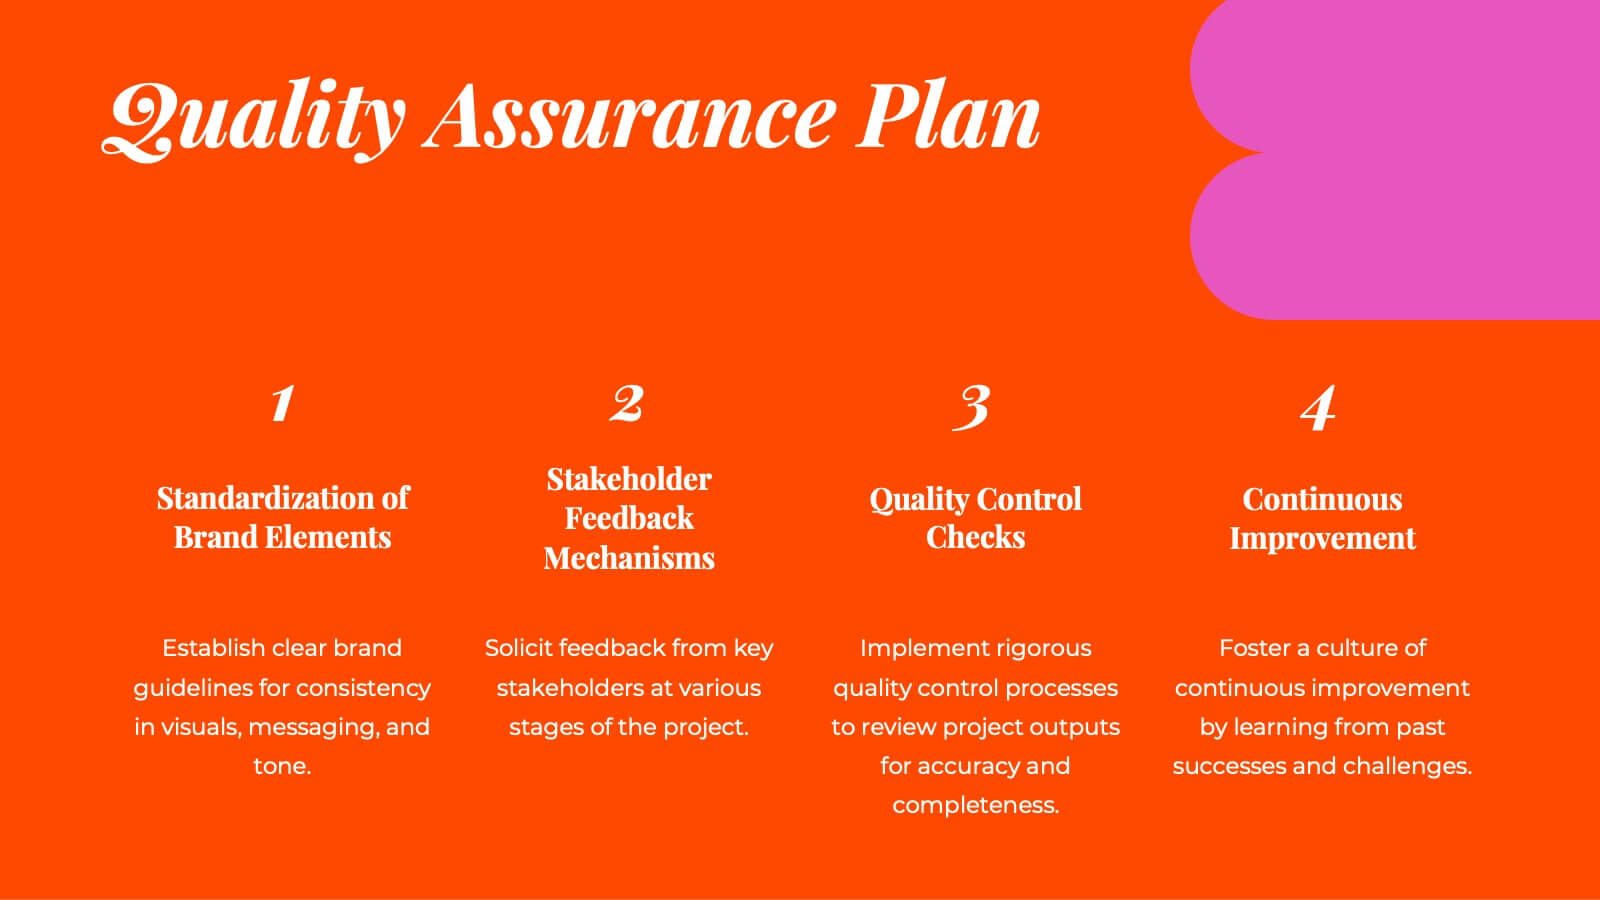
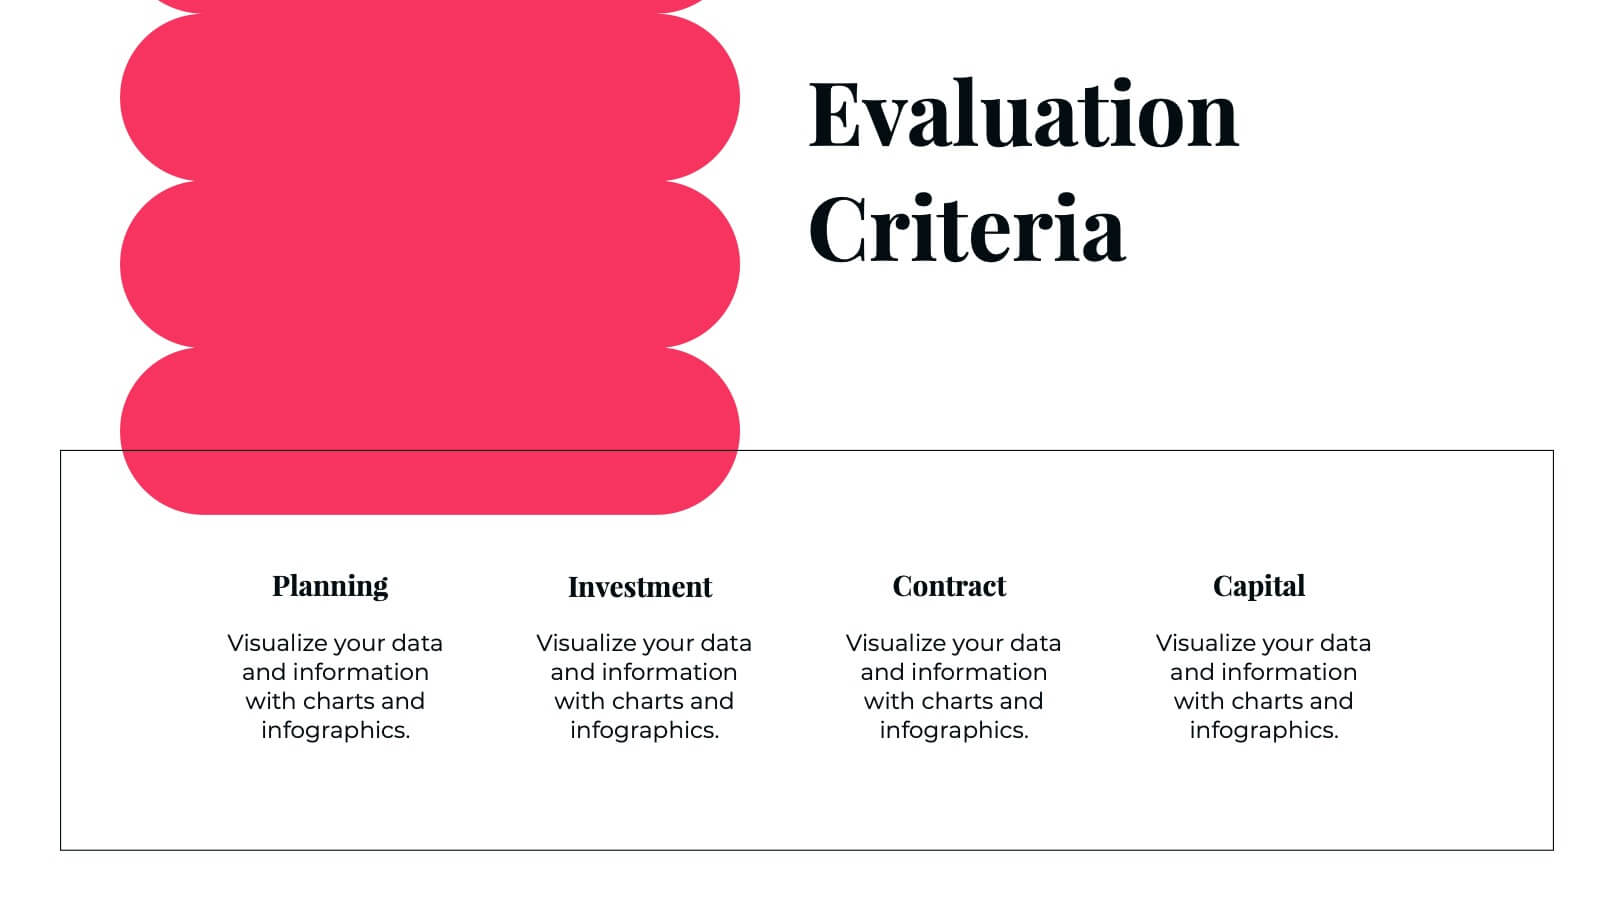
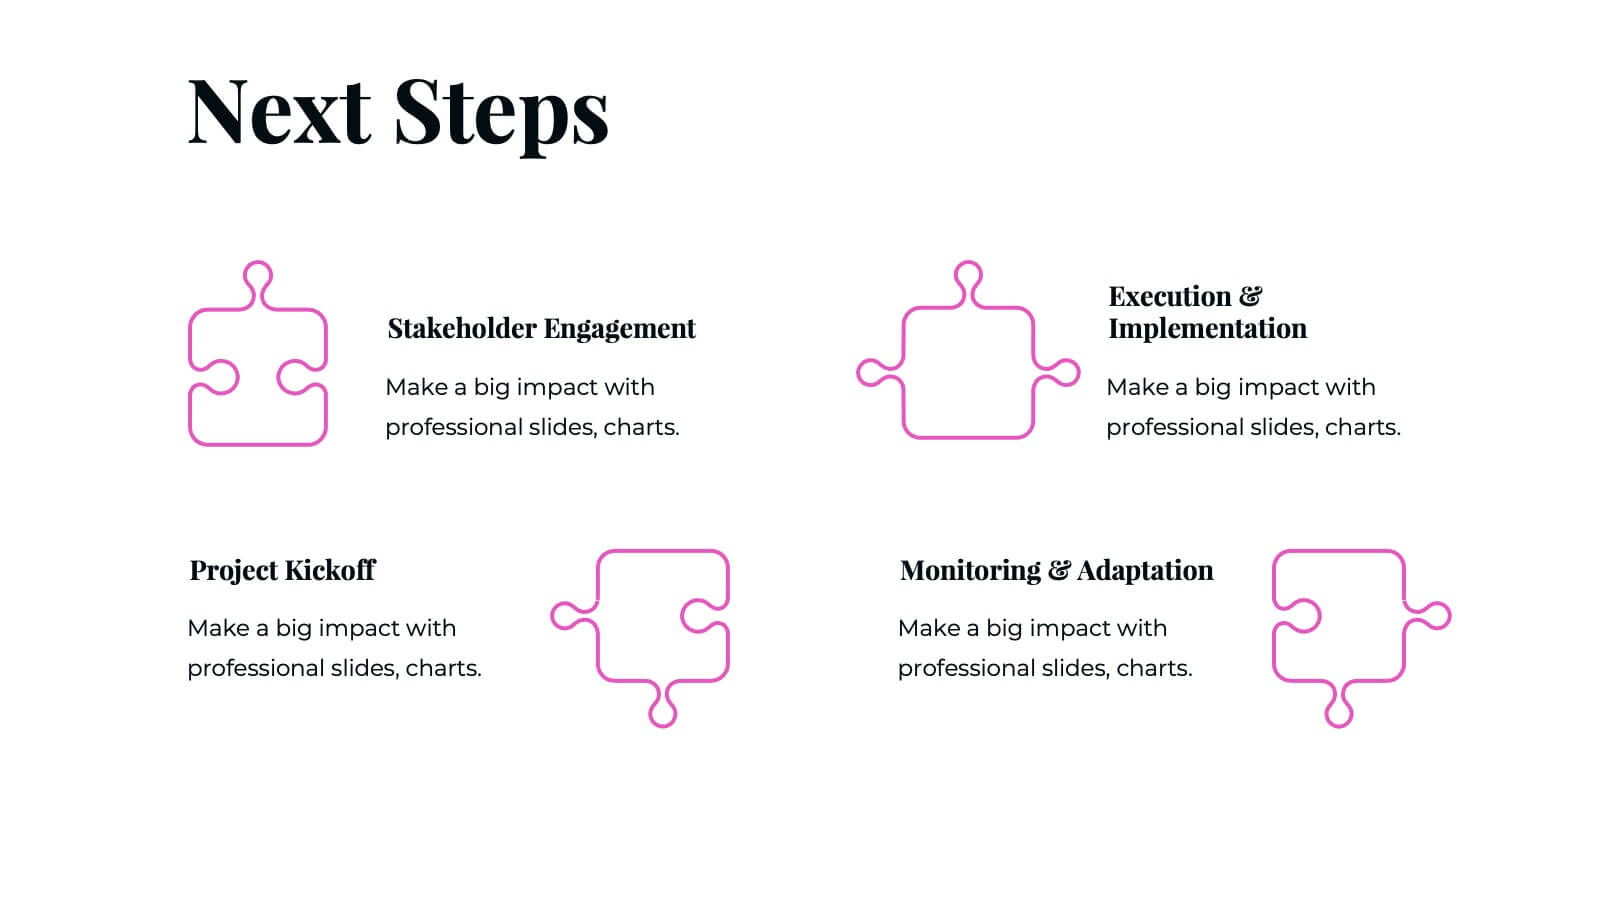
Moonstone Detailed Project Execution Plan Presentation
Create a compelling project execution plan with this vibrant and well-structured presentation template! Covering every key aspect from problem statements and objectives to risk management and quality assurance, this template provides a clear roadmap for your project. It’s perfect for organizing timelines, budget breakdowns, and stakeholder analysis. Compatible with PowerPoint, Keynote, and Google Slides for smooth presentations.


7 slides
Construction Site Infographic
Elevate your project presentations with our Construction Site Infographic, an essential tool for construction managers, engineers, and stakeholders. This infographic offers a visual breakdown of the construction process, stages, and key tasks, ensuring a comprehensive understanding of project progression and components. Our Construction Site Infographic is designed to detail various phases such as planning, foundation work, structural development, and finishing touches. It helps in communicating the complexity and sequence of construction activities, making it easier to track milestones and manage resources effectively. With customizable elements, you can represent specific site operations, timelines, and the deployment of labor and materials. This SEO-optimized infographic is crafted to aid in reporting, project tracking, and stakeholder briefings, making it a valuable asset for any construction-related project. Utilize this infographic to provide a clear and structured overview of your construction project, promoting transparency and aiding in the efficient management of your site operations.