


Features
- 26 Unique slides
- Fully editable and easy to edit in Microsoft Powerpoint, Keynote and Google Slides
- 16:9 widescreen layout
- Clean and professional designs
- Export to JPG, PDF or send by email


Do you have any questions?
Recommend


6 slides
SCAR Process Model Presentation
The "SCAR Process Model" presentation template provides a clear visualization of the SCAR (Supplier, Corrective, Action, Request) model, designed to help professionals manage and enhance supplier relationships effectively. Each quadrant of the template is dedicated to one of the SCAR components, neatly arranged around a central hub, symbolizing the interconnected nature of these processes. The circular layout facilitates the understanding of how each component influences the others, leading to a more streamlined approach in handling supplier interactions and corrective actions. This template is perfect for presentations in supply chain management, operational reviews, and strategic planning meetings, offering a practical framework for discussing and planning effective supply chain strategies.


5 slides
Employee Onboarding HR Presentation
Start your presentation with energy and clarity using this clean, engaging slide designed to simplify every step of the onboarding journey. It helps explain employee integration, training stages, and team alignment in a way that feels intuitive and visually organized. Fully compatible with PowerPoint, Keynote, and Google Slides.


5 slides
Investment Opportunity Business Case
Visualize the value behind your proposal with this key-themed layout, ideal for presenting compelling reasons to invest. Each section highlights a unique point, making it easy to walk stakeholders through critical benefits and insights. Fully editable and compatible with PowerPoint, Keynote, and Google Slides.


6 slides
Event and Meeting Schedule Calendar Presentation
Simplify your weekly planning with this modern and visually intuitive event calendar template. Featuring a clean grid layout, this presentation allows you to organize key meetings, deadlines, or project highlights across six weeks. Each week is color-coded for quick reference, and each event box is fully editable to include titles and custom notes. Ideal for team leaders, educators, corporate planners, and event organizers. Compatible with PowerPoint, Keynote, and Google Slides for effortless use.


6 slides
Competitor Benchmarking and Comparison Presentation
Present a side-by-side snapshot of your competitive landscape with the Competitor Benchmarking and Comparison Presentation. This clear layout lets you compare five key features or metrics between your brand and competitors using a visual central column. Fully editable in Canva, PowerPoint, Keynote, and Google Slides for fast, professional benchmarking.


5 slides
Institutional Historical Highlights Presentation
Present milestones with impact using this vertical bar layout designed to showcase historical achievements clearly. With icons, aligned titles, and color-coded steps, it’s perfect for timelines, growth overviews, or academic evolution. Fully editable in PowerPoint, Keynote, and Google Slides, it offers structured storytelling with a sleek, professional design.


5 slides
Customer Retention and Loyalty Marketing Presentation
Showcase your loyalty strategies in a visually compelling way with this modern shopping cart-themed slide. Ideal for outlining customer retention initiatives, this template highlights five key tactics or rewards using numbered icons and clean layout sections. Great for marketers, retail teams, and business consultants. Fully editable in PowerPoint, Keynote, and Google Slides.


5 slides
Employee Training Needs Presentation
Spark growth and strengthen team performance with a clear visual guide that highlights skill gaps, development priorities, and learning pathways. This presentation helps HR and managers map essential competencies and plan impactful training programs. Perfect for performance reviews and workforce planning. Fully compatible with PowerPoint, Keynote, and Google Slides.


20 slides
Quasar Design Strategy Proposal Presentation
Elevate your design strategy presentations with this modern, engaging template. Perfect for showcasing design briefs, concept development, and project timelines, it features a sleek layout with a cohesive color scheme. Highlight key elements like typography, textures, and feedback processes to captivate your audience. Compatible with PowerPoint, Keynote, and Google Slides, it ensures seamless presentations on any platform.


4 slides
Healthcare Medical Infographic Presentation
Bring your healthcare insights to life with a clean, calming design that makes complex medical data easy to follow. This presentation highlights key health metrics, patient information, and wellness topics using simple visuals and structured layouts for clarity. Fully compatible with PowerPoint, Keynote, and Google Slides.


5 slides
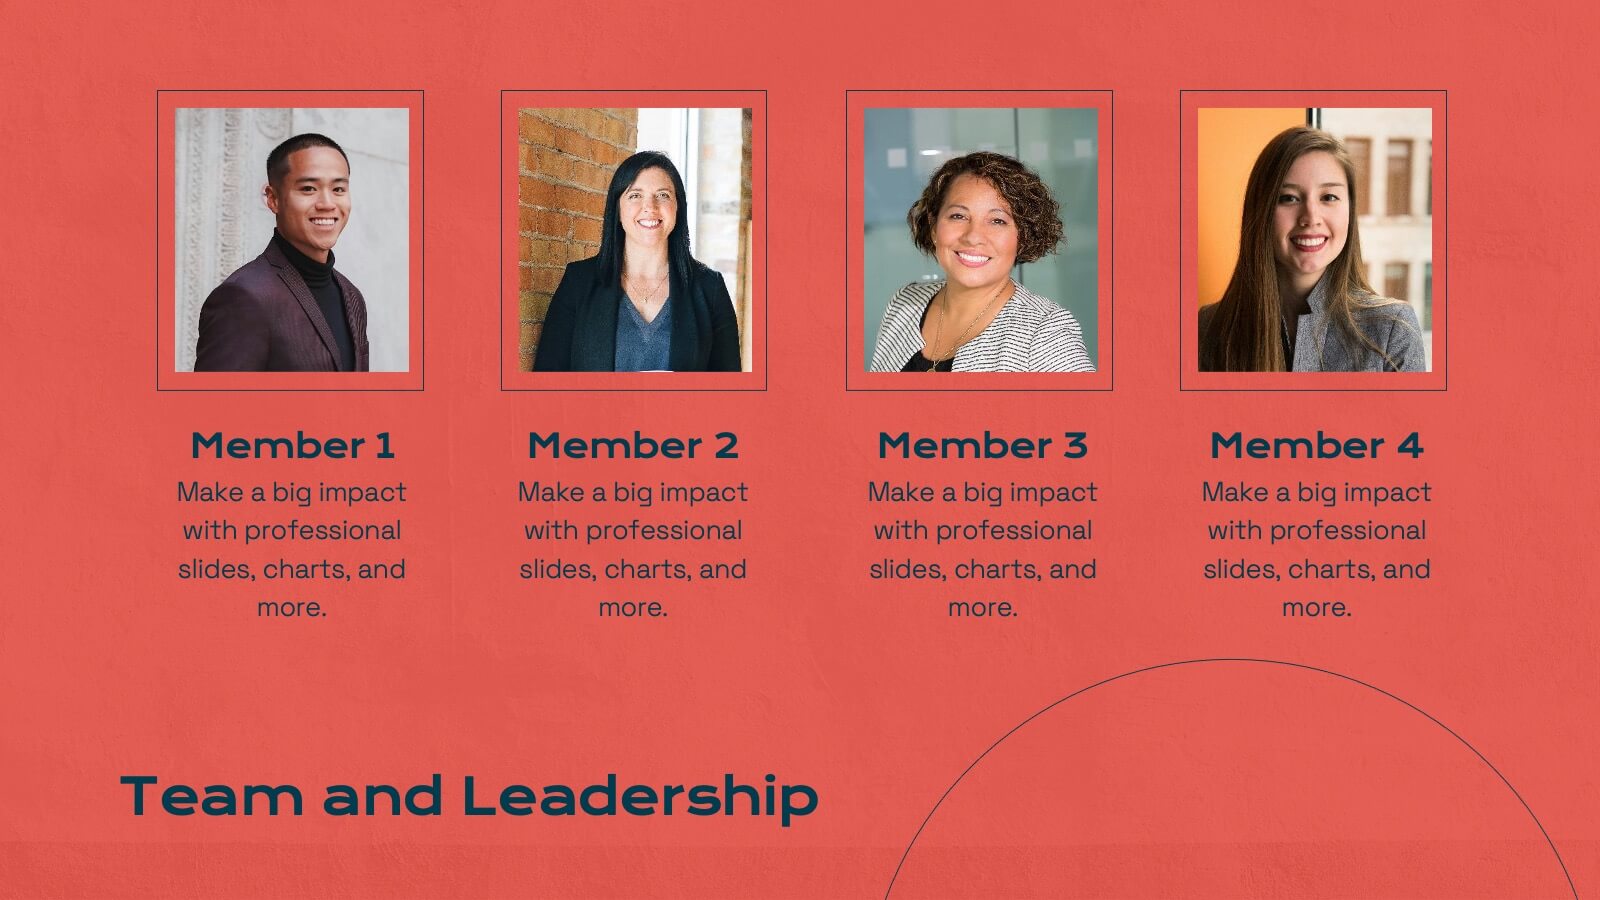
Leadership and Team Management
Showcase roles, responsibilities, and the structure of your team with this clear and engaging leadership diagram. Ideal for HR professionals, team leads, and project managers to explain reporting lines and team composition. Easily editable in PowerPoint, Keynote, and Google Slides—customize colors, icons, and content in minutes.


4 slides
Iceberg Metaphor Diagram Presentation
Make your message feel deeper and more intriguing with a visual that instantly shows there’s more beneath the surface. This presentation helps you highlight hidden factors, core insights, and layered data using a clear, structured iceberg illustration. Ideal for strategy, analysis, and storytelling. Fully compatible with PowerPoint, Keynote, and Google Slides.


4 slides
Wheel of Progress Planning Tool Presentation
Visualize goals, track development stages, or outline key initiatives with the Wheel of Progress Planning Tool Presentation. This dynamic circular design divides progress into four customizable quadrants (A–D), perfect for strategic planning, KPI tracking, or team milestone updates. Each segment features editable labels and supporting descriptions. Ideal for PowerPoint, Keynote, and Google Slides.


26 slides
Creative Programming Presentation
The process of Developing Software involves the development of everything from a simple application or web page to complex enterprise systems. Software development is a collaborative effort between developers, designers, and other stakeholders. This Creative Template is perfect for delivering presentations about the latest projects, apps and ideas. The simple layout allows you to focus on what matters most, your idea. Make your most important presentation spectacular with this template. With high-powered visual content and a smooth flow, you’ll keep your audience engaged from beginning to end!


4 slides
AI Trends and Use Cases Presentation
Step into the future with a clean, modern layout that makes complex technology easy to grasp and exciting to explore. This presentation helps you break down emerging innovations, real-world applications, and industry opportunities using clear visuals and structured sections. Fully customizable and compatible with PowerPoint, Keynote, and Google Slides.


21 slides
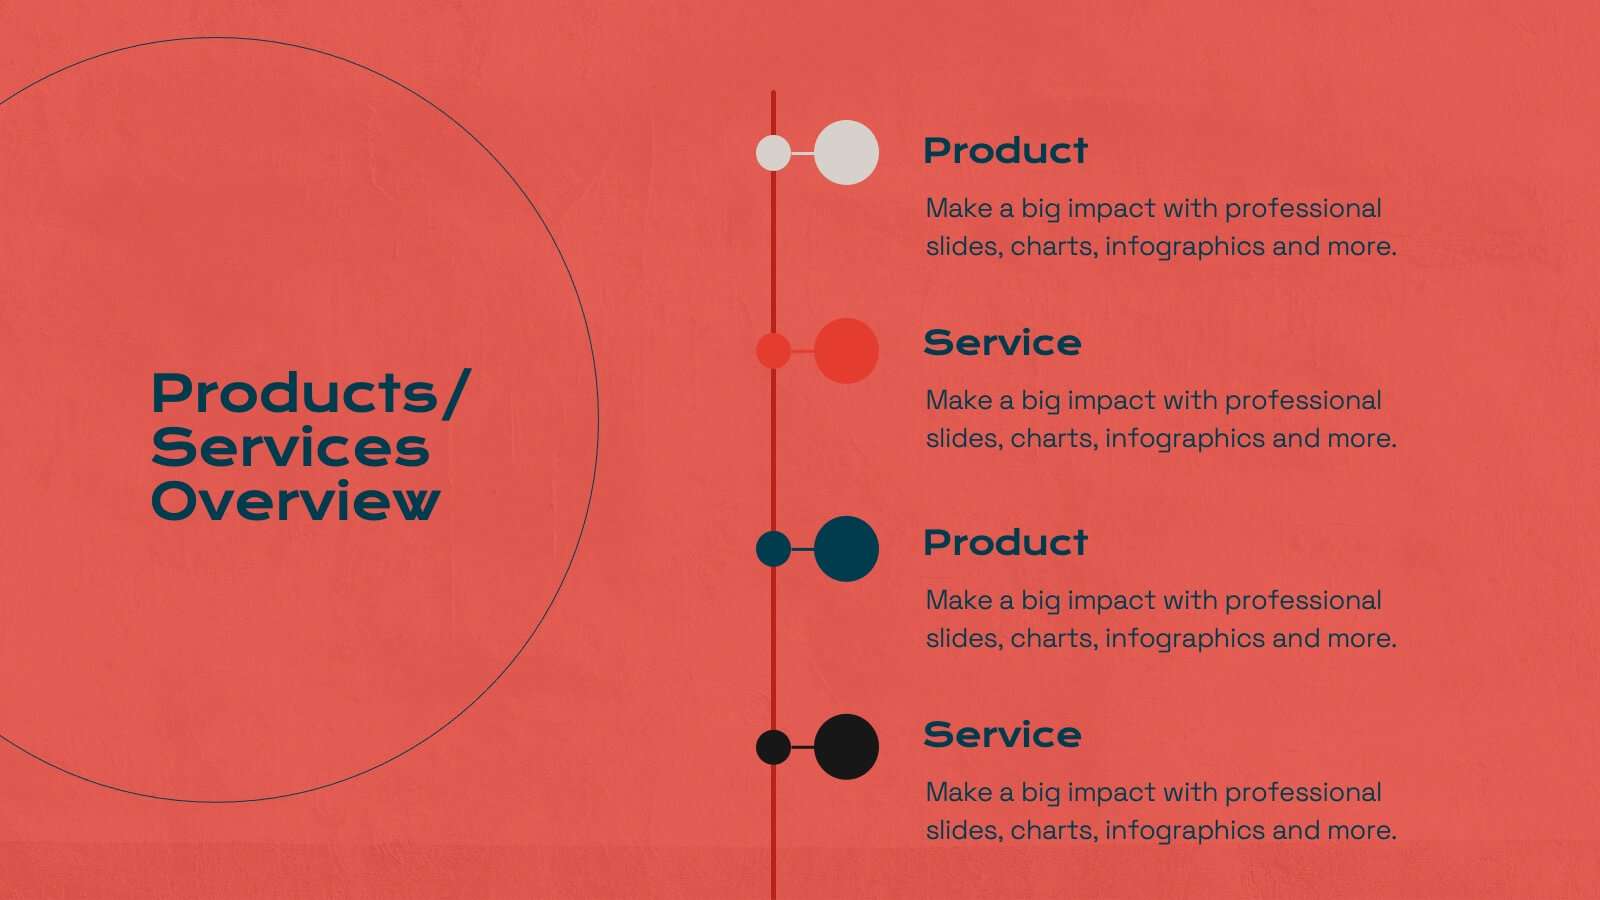
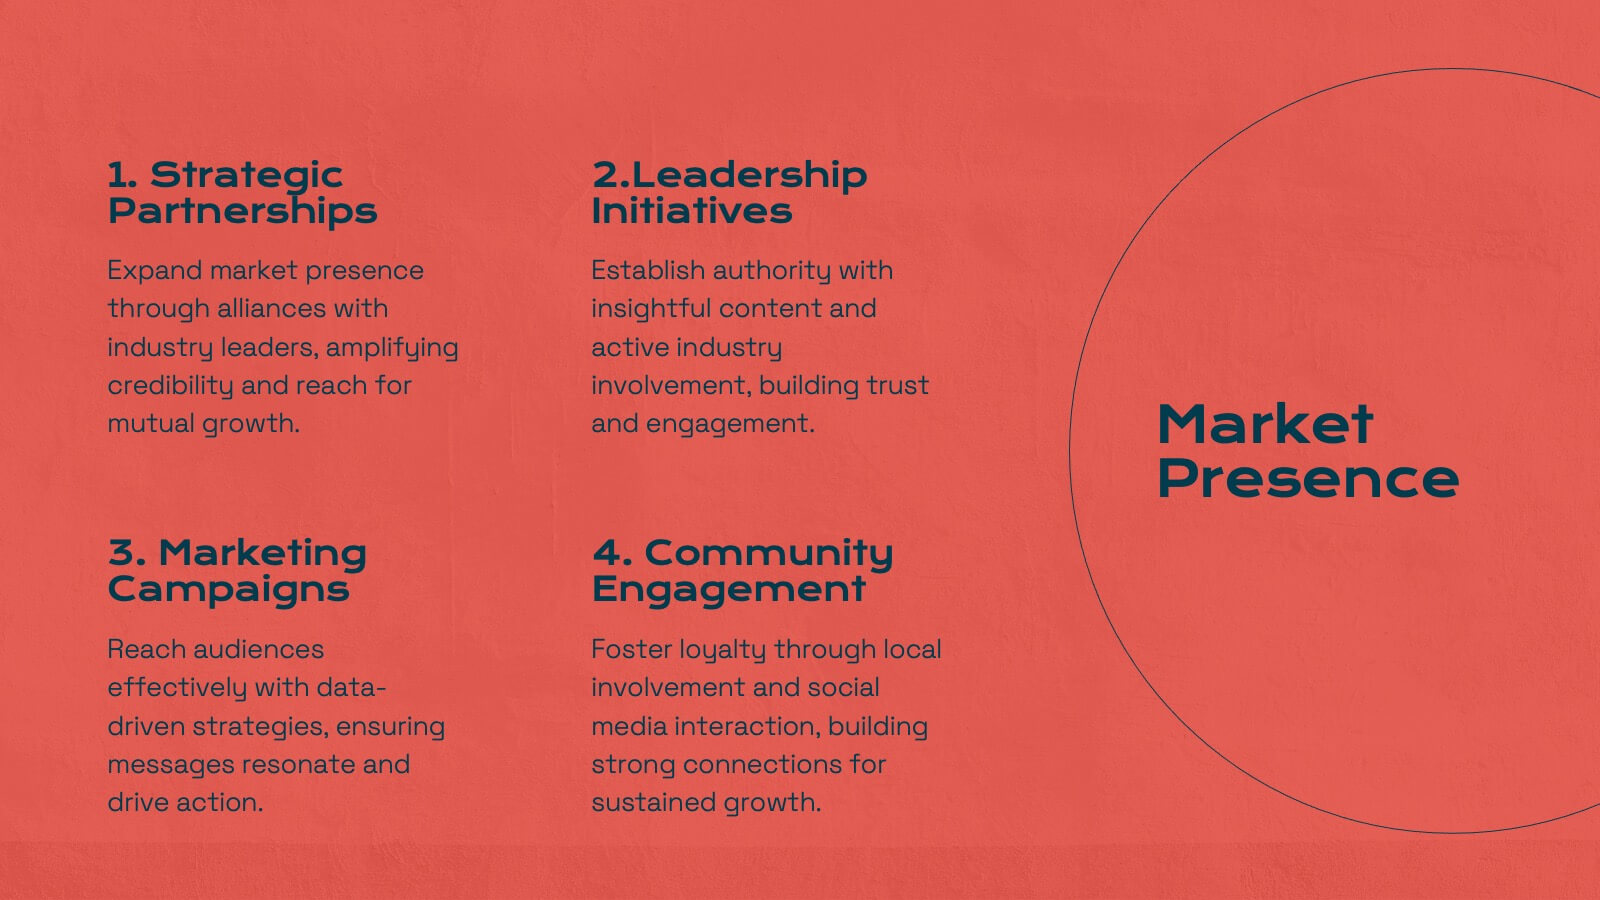
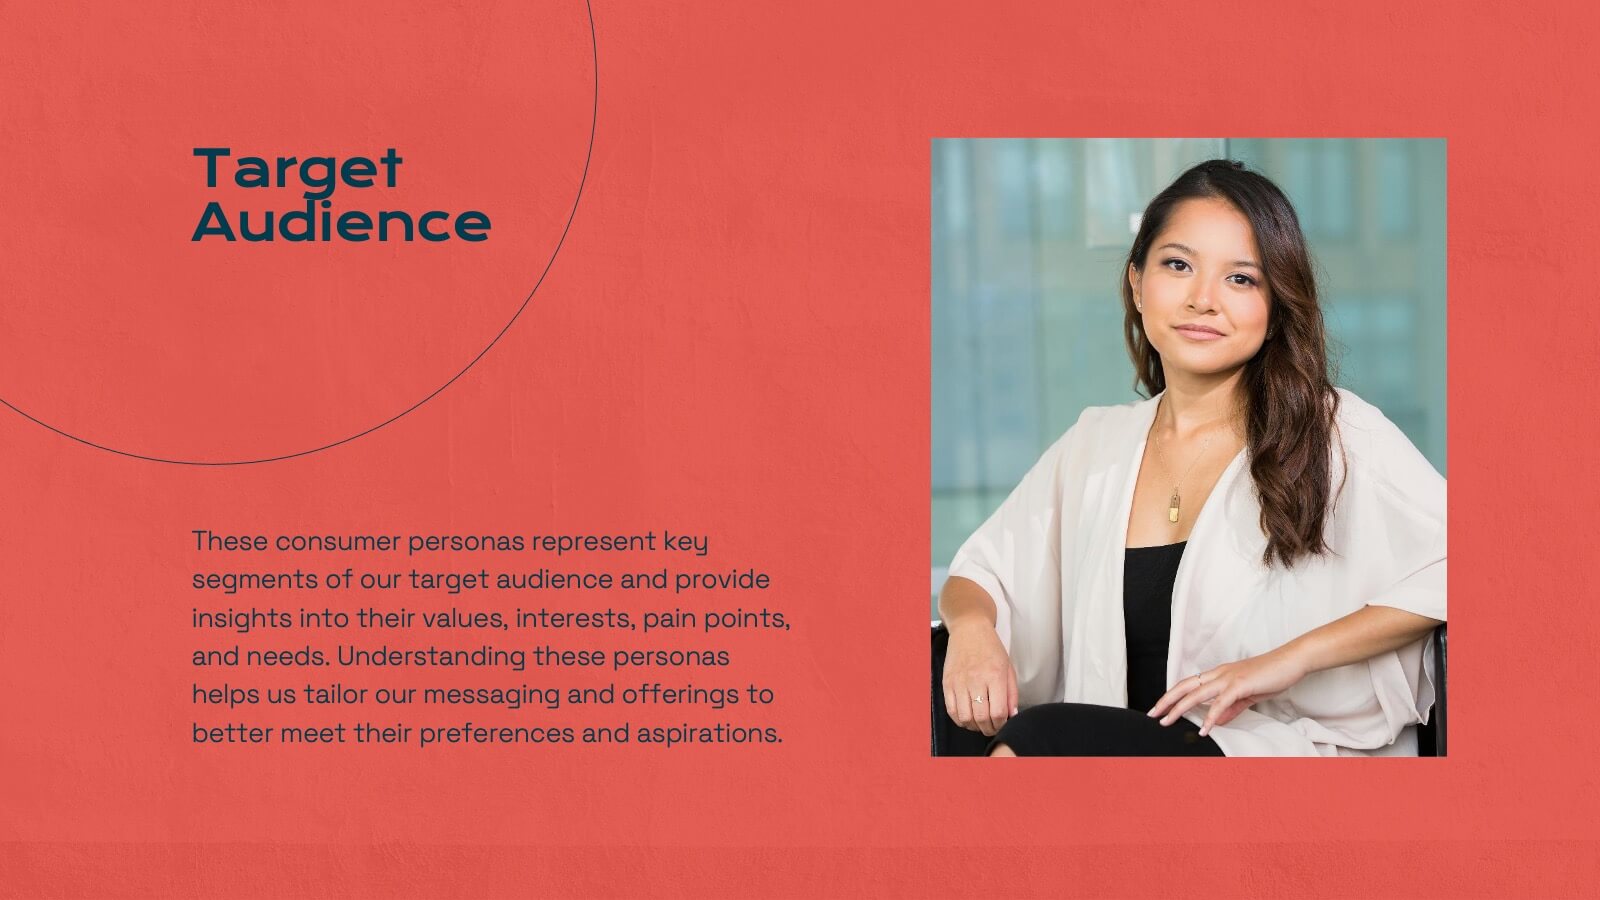
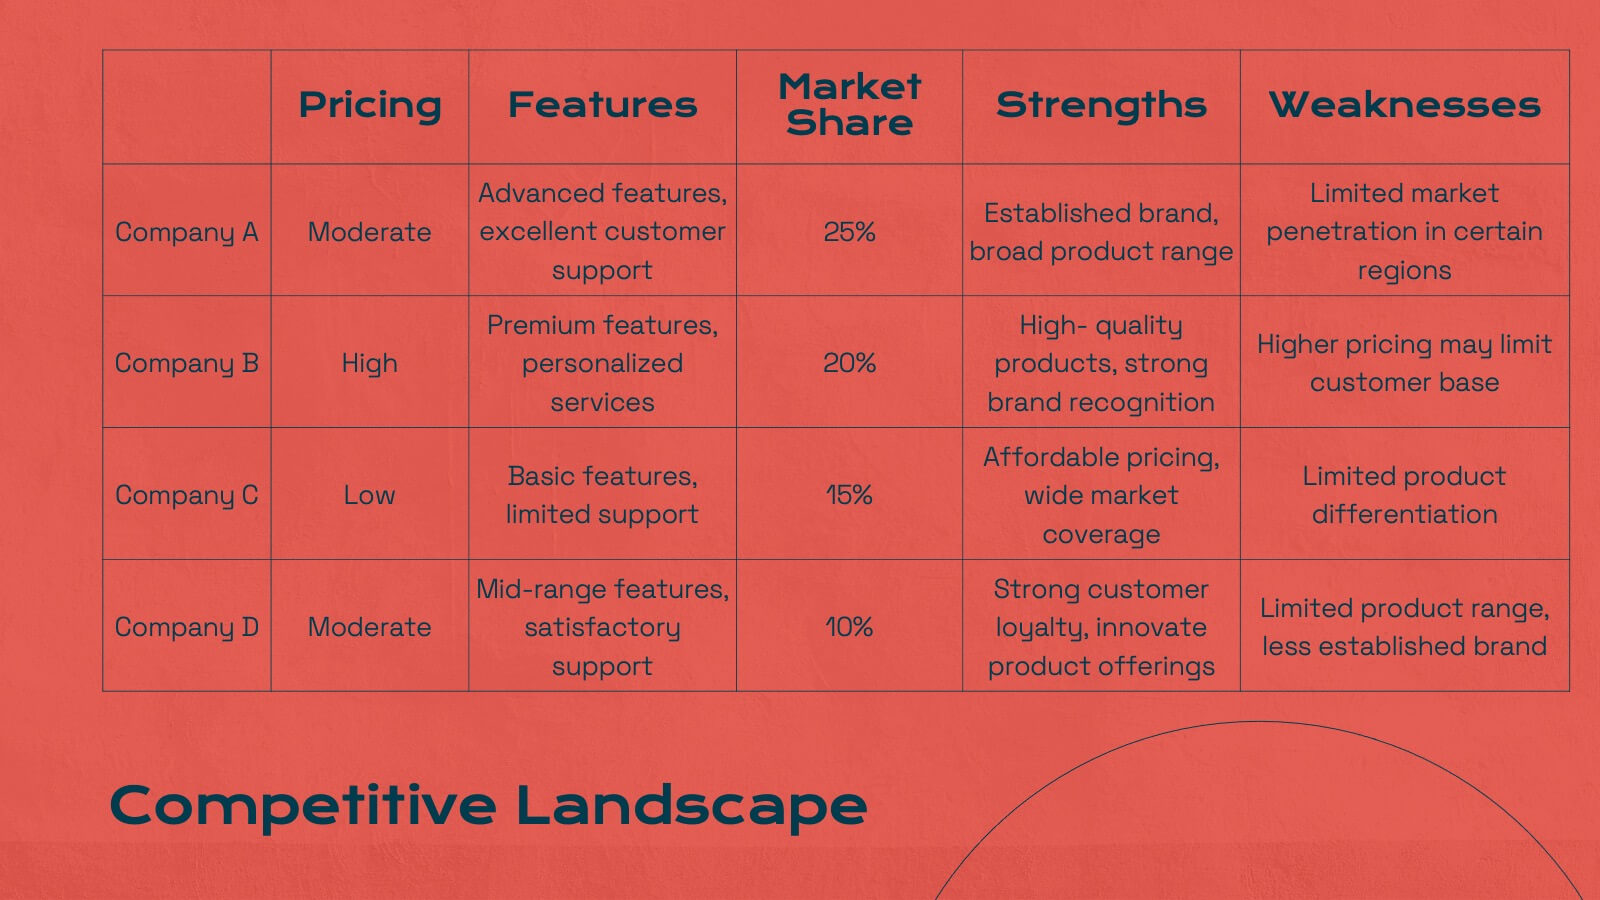
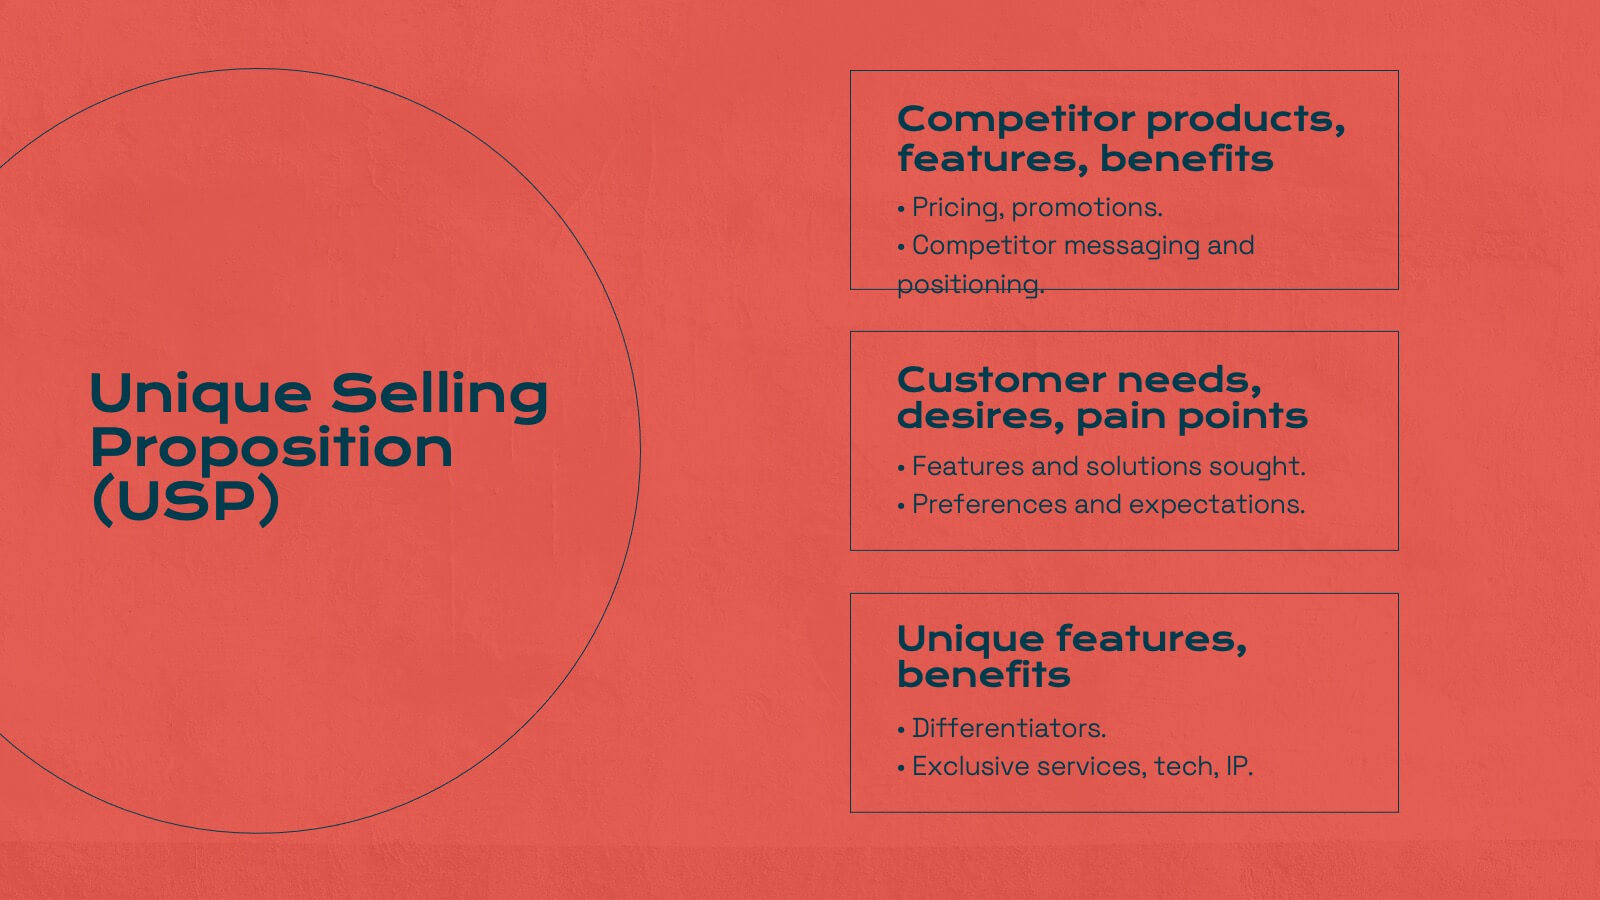
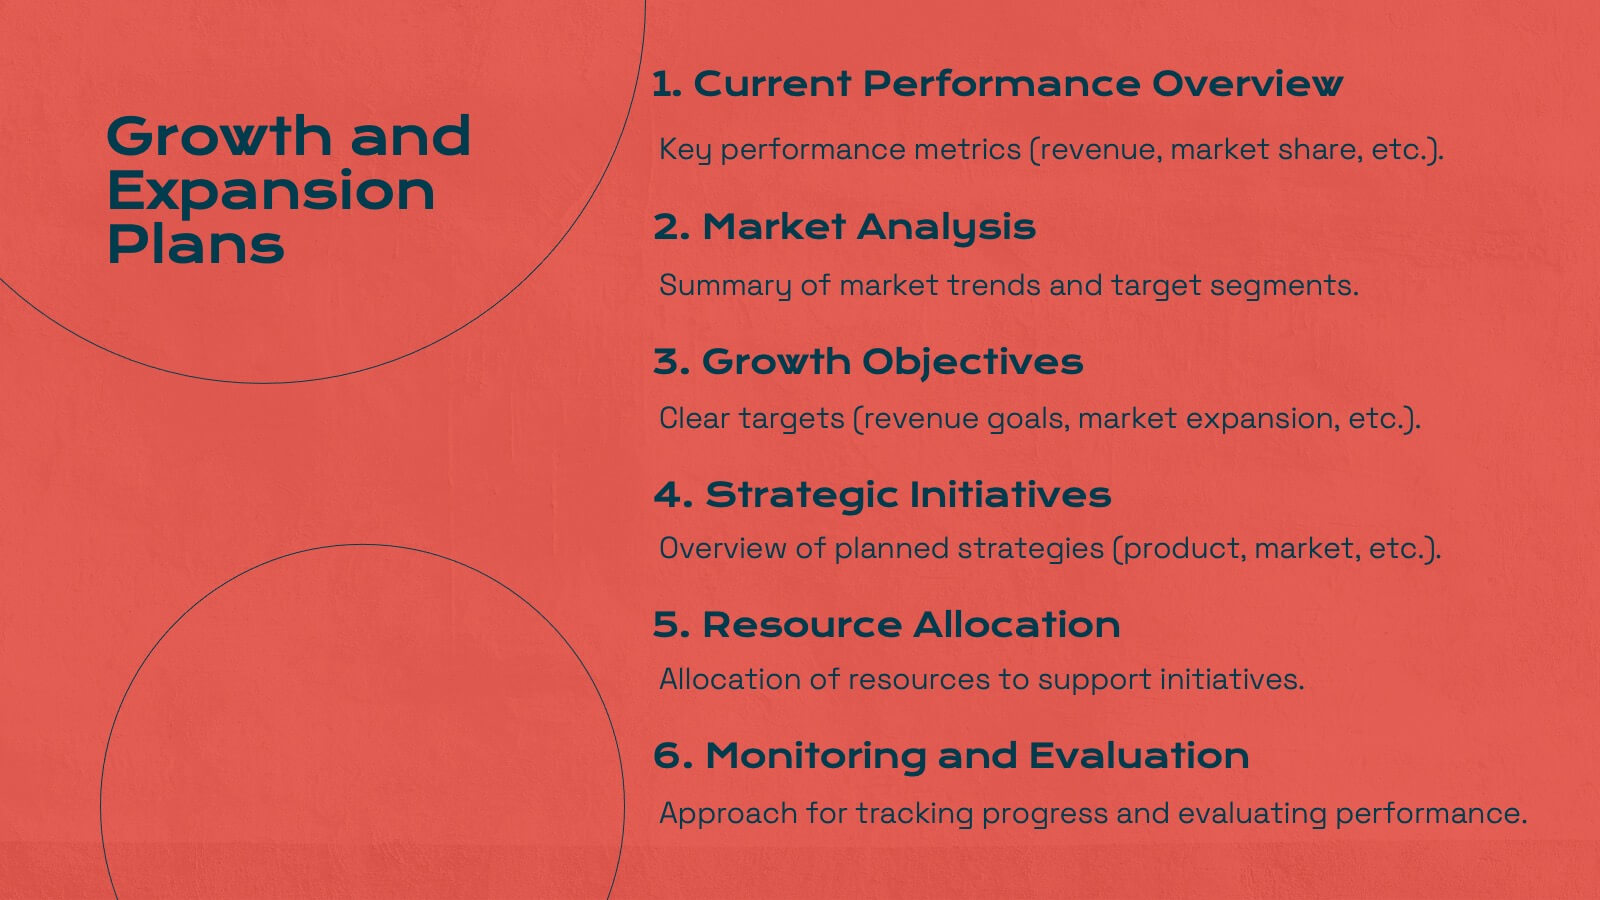
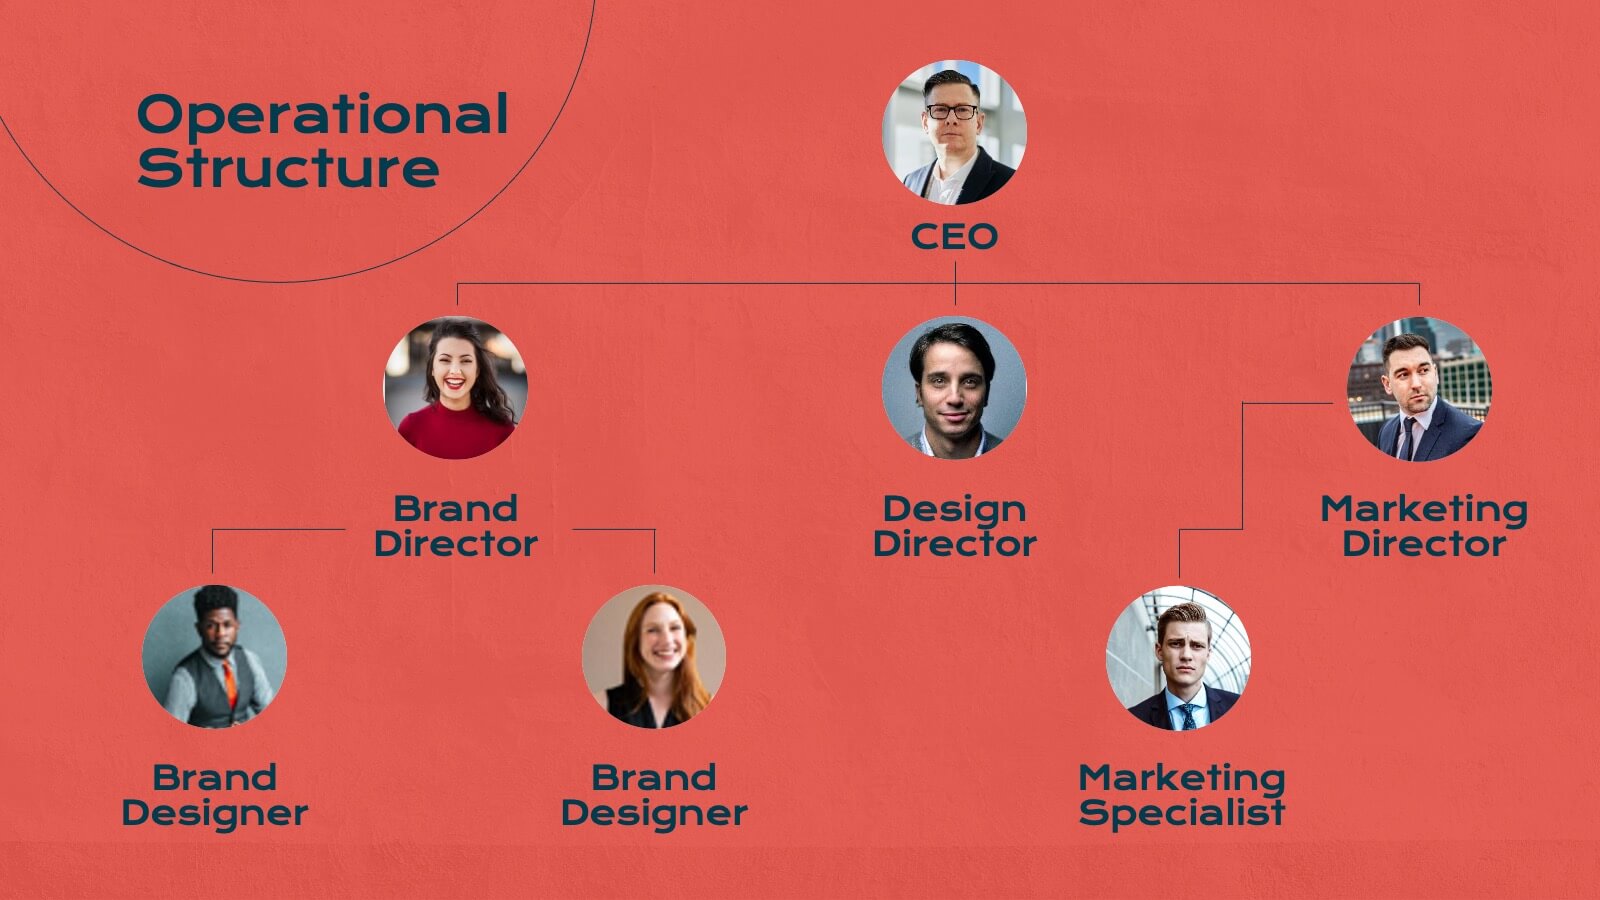
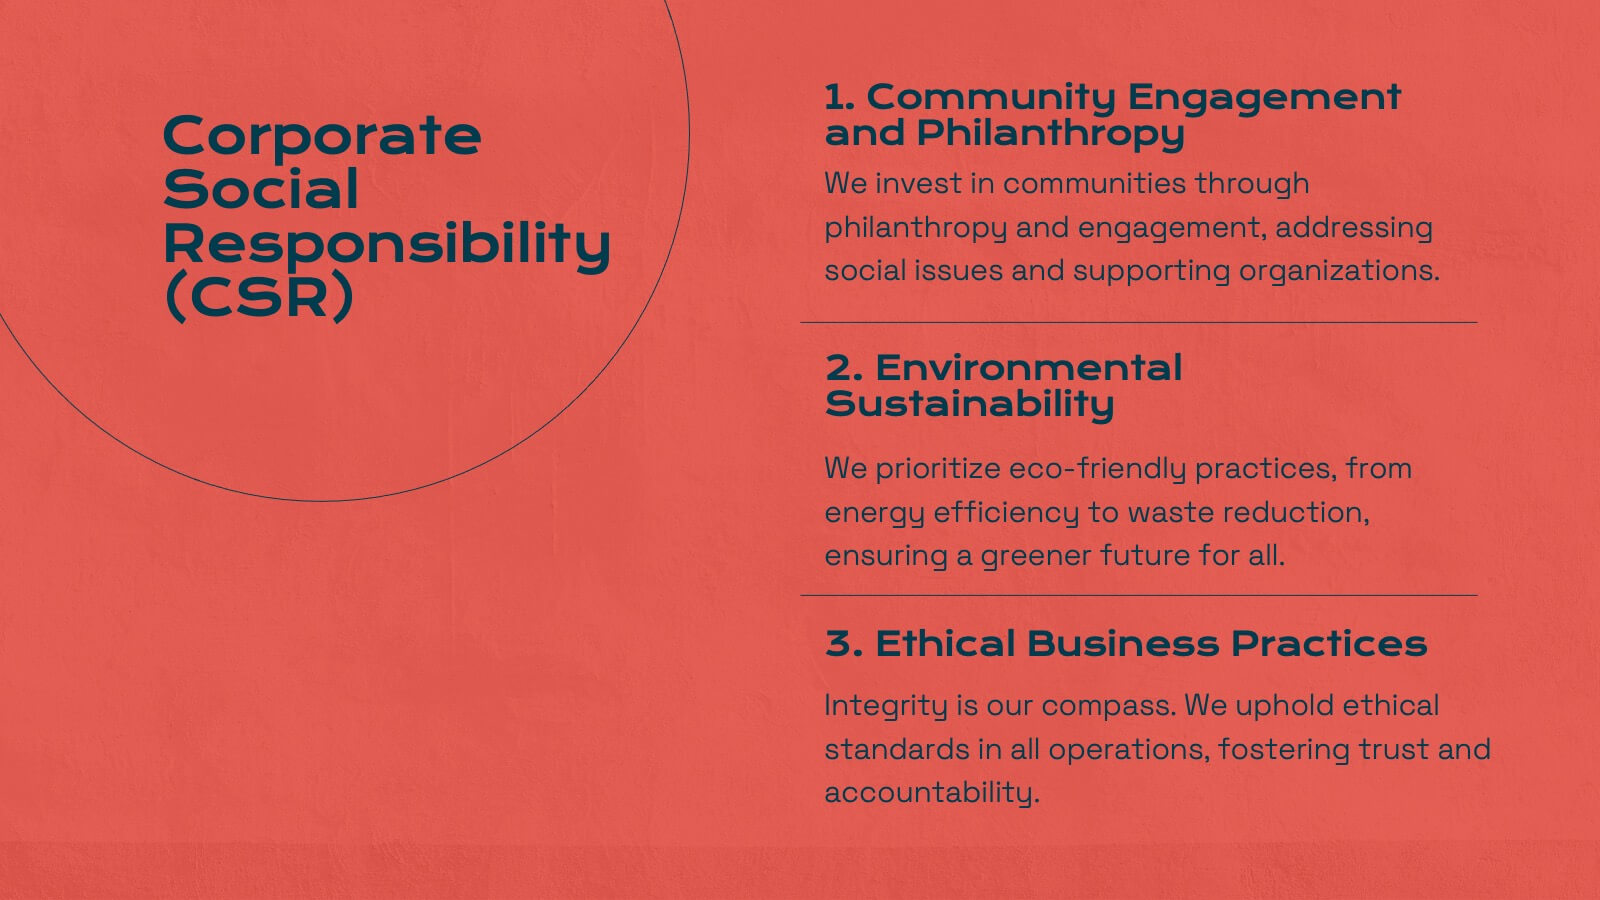
Titan Marketing Research Report Presentation
Energize your marketing research presentations with this bold, vibrant template. Perfect for detailing company history, market presence, and competitive landscapes, it features a striking red design that captures attention. Highlight key insights like target audience, financial highlights, and growth plans to engage your audience. Compatible with PowerPoint, Keynote, and Google Slides, it ensures seamless presentations on any platform.


21 slides
Vortexia Small Business Pitch Deck Presentation
Deliver an impressive pitch with a modern and sleek presentation template tailored for small businesses. Dive into critical aspects like team updates, current projects overview, and key achievements to showcase progress and potential. Address challenges and solutions in a structured way, while outlining departmental goals and performance metrics for transparency. The template includes slides for resource allocation, collaboration opportunities, and training and development strategies, ensuring a comprehensive narrative. Use the process improvement and feedback and suggestions sections to invite engagement and innovation. With fully editable slides, this template is compatible with PowerPoint, Google Slides, and Keynote, offering a polished and professional platform to highlight your business strengths and future plans. Perfect for entrepreneurs and small businesses ready to captivate stakeholders.