


Features
- 5 Unique Slides
- Fully editable and easy to edit in Microsoft Powerpoint, Keynote and Google Slides
- 16:9 widescreen layout
- Clean and professional designs
- Export to JPG, PDF or send by email


Do you have any questions?
Recommend


8 slides
User-Centered Design with Empathy Map
Step into your user's shoes—literally. This engaging empathy map slide helps you visualize user behavior, thoughts, emotions, and needs in one clean layout. Ideal for UX strategies, product development, or customer journey sessions. Fully editable and works seamlessly with PowerPoint, Keynote, and Google Slides.


6 slides
Decision Analysis Infographics
Enhance your decision-making skills with our Decision Analysis infographic template. This template is fully compatible with popular presentation software like PowerPoint, Keynote, and Google Slides, allowing you to easily customize it to illustrate and communicate various aspects of decision analysis. The Decision Analysis infographic template offers a visually engaging platform to explore and explain the principles, methodologies, and tools used in making informed decisions. Whether you're a business leader, analyst, project manager, or simply interested in effective decision-making, this template provides a user-friendly canvas to create informative presentations and educational materials. Optimize your decision analysis processes with this SEO-optimized Decision Analysis infographic template, thoughtfully designed for clarity and ease of use. Customize it to showcase decision trees, risk assessment techniques, decision matrices, and the importance of data-driven choices, ensuring that your audience gains valuable insights into this critical skill. Start crafting your personalized infographic today to become a more proficient decision analyst.


4 slides
Minimal Title Page Variations Presentation
Highlight key ideas with style using the Minimal Title Page Variations Presentation. These clean and colorful layouts feature bold numbers, pastel text boxes, and abstract 3D artwork to instantly draw attention. Perfect for agendas, summaries, or content previews. Includes multiple layout options and is fully editable in PowerPoint, Keynote, and Google Slides.


6 slides
USA Market Reach Heatmap Presentation
Showcase your geographic impact with this USA Market Reach Heatmap template. Ideal for visualizing regional data, customer density, or sales performance. Features pinpoint markers, editable callouts, and a clean U.S. map layout. Fully customizable in PowerPoint, Keynote, and Google Slides—perfect for marketing, sales, or expansion strategy presentations.


4 slides
Business Development Roadmap Presentation
Visualize your growth journey with this Business Development Roadmap Presentation. Featuring a winding road design with four milestones, it’s perfect for showcasing project phases, strategic goals, or quarterly plans. Each checkpoint is color-coded and icon-based for easy comprehension. Fully editable in PowerPoint, Keynote, and Google Slides.


7 slides
Product Life Cycle Infographic
Illuminate the journey of a product from its inception to its eventual decline with our product life cycle infographic. Streamlined to convey the critical phases of a product's life in the market, this infographic weaves a tale from the introduction, growth, maturity, to the decline stages, enabling viewers to grasp the nuances of each phase effortlessly. The base color is a clean, neutral white, with varying shades of blue to ensure consistency and clarity. The additional burst of colors helps differentiate each stage, making the information easily digestible at a glance. Compatible with PowerPoint, Keynote, or Google Slides.


10 slides
Environmental Sustainability Strategy
Bring your green initiatives to life with this vibrant, four-step sustainability roadmap. Ideal for visualizing eco-friendly practices, CSR programs, or environmental policy rollouts. The organic flow, icons, and plant-themed accents enhance clarity and engagement. Fully customizable in PowerPoint, Keynote, and Google Slides.


5 slides
Mental Health Disorders Infographics
Mental Health Disorder Infographics play a crucial role in raising awareness, combating misinformation, and advocating for better mental health support. These Infographics are visual representations of information about mental health disorders. They include statistics, images, and text to provide information on the prevalence of these disorders, common symptoms, risk factors, and available treatments. These infographics are designed with the goal to raise awareness about mental health disorders and to help people better understand and identify the signs and symptoms of these conditions.


20 slides
Storynix New Product Proposal Presentation
This beautifully designed presentation template is your perfect tool to showcase a new product with style and professionalism. It covers everything from company overview and product features to pricing strategies and distribution plans, ensuring a comprehensive and persuasive pitch. Compatible with PowerPoint, Keynote, and Google Slides for seamless customization.


24 slides
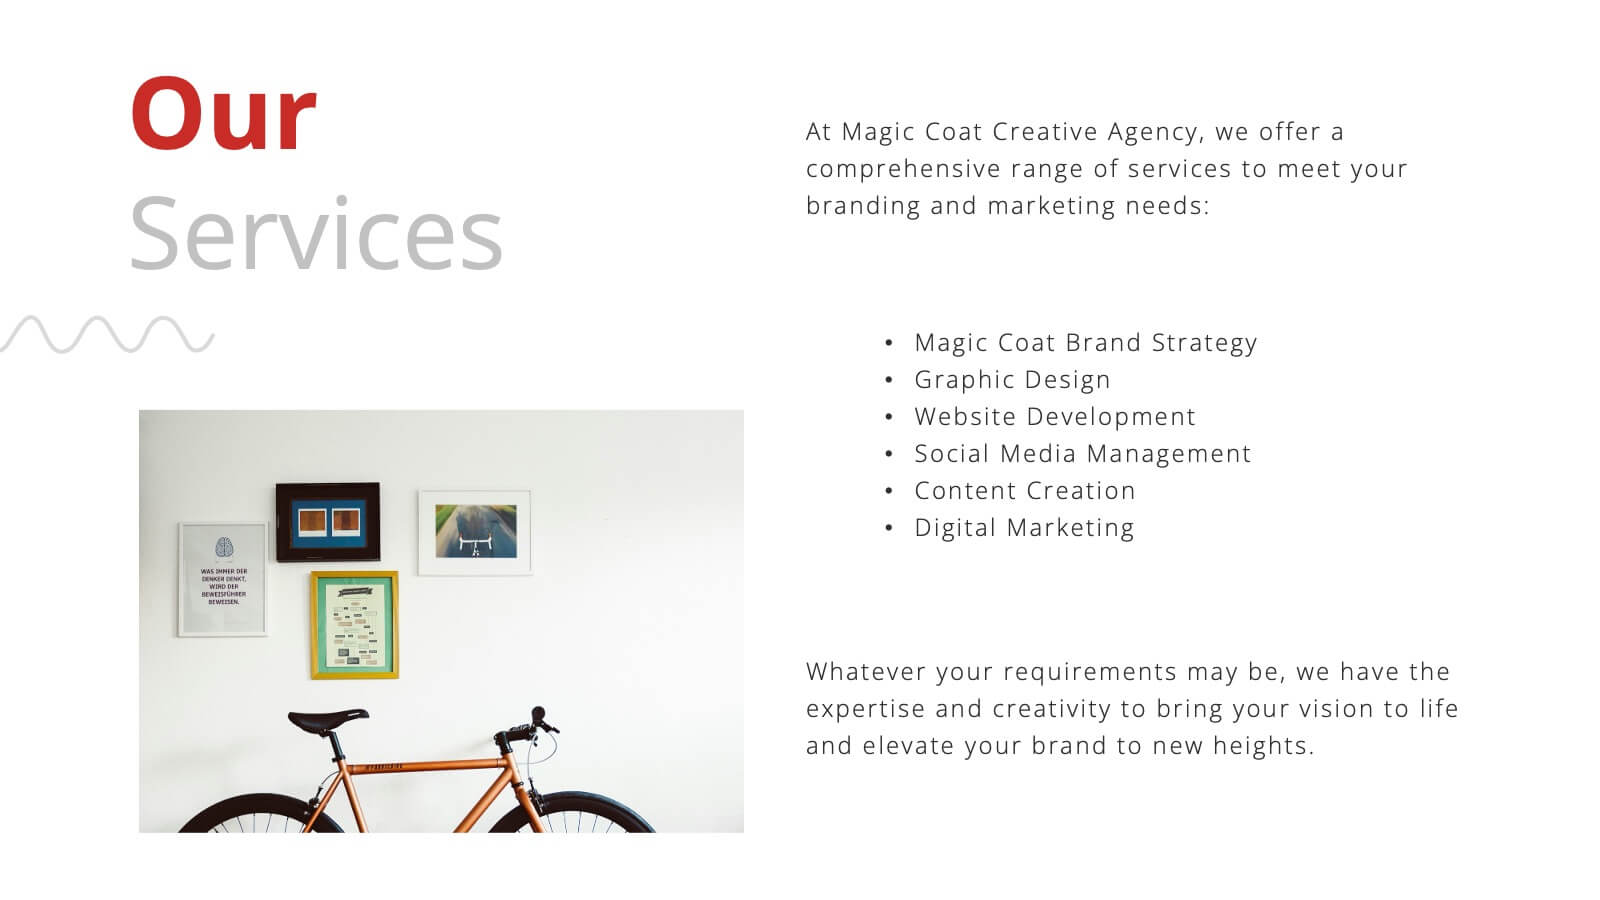
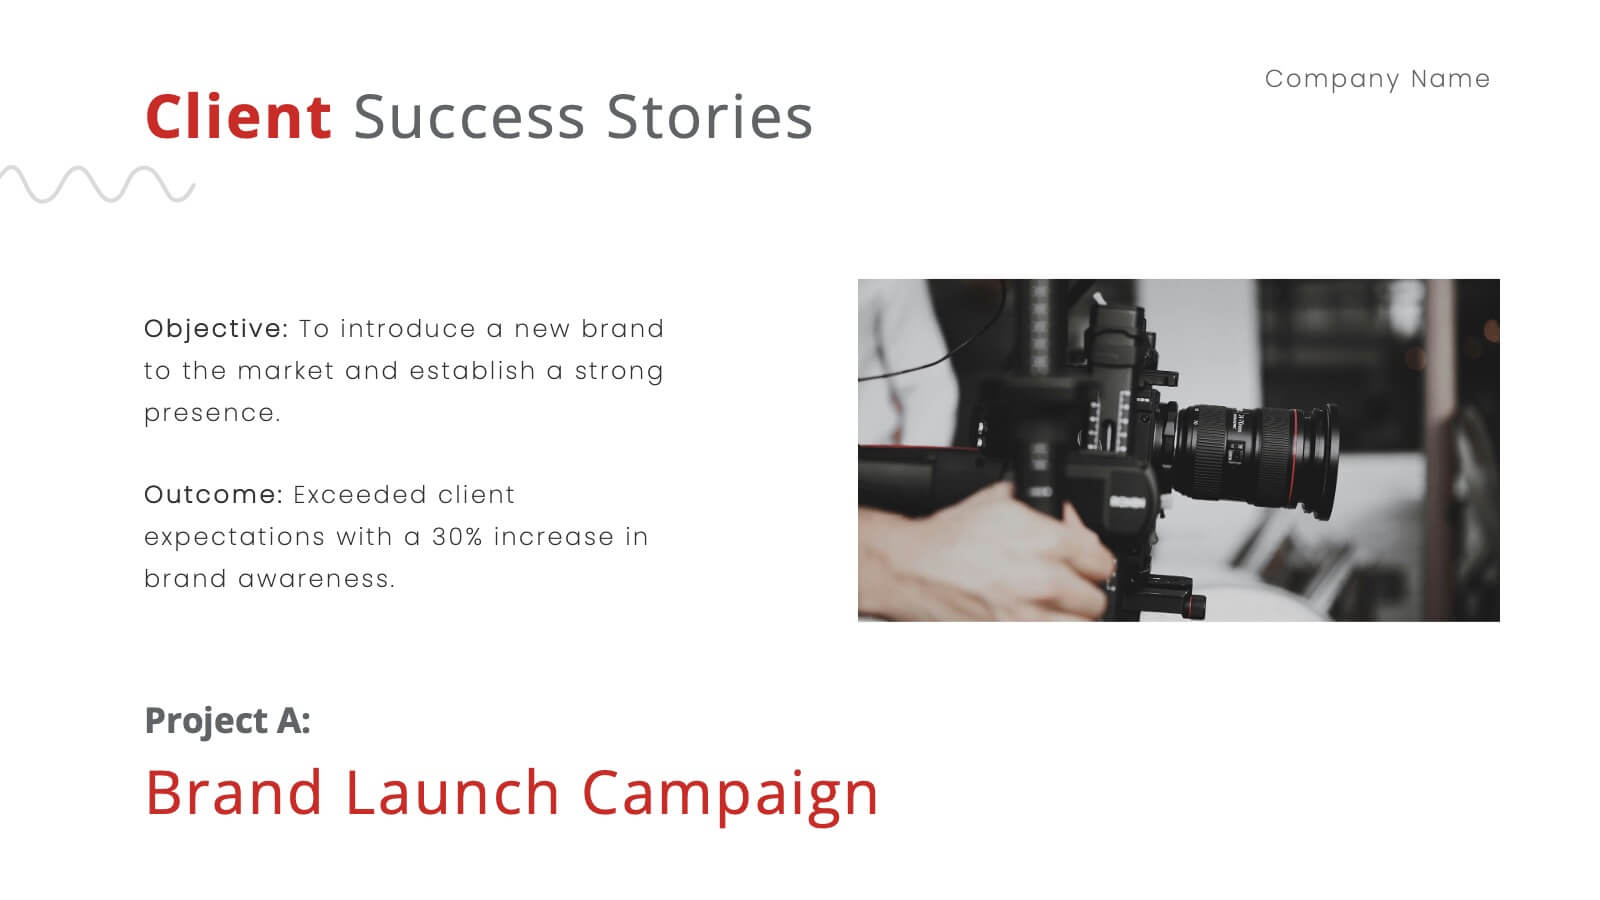
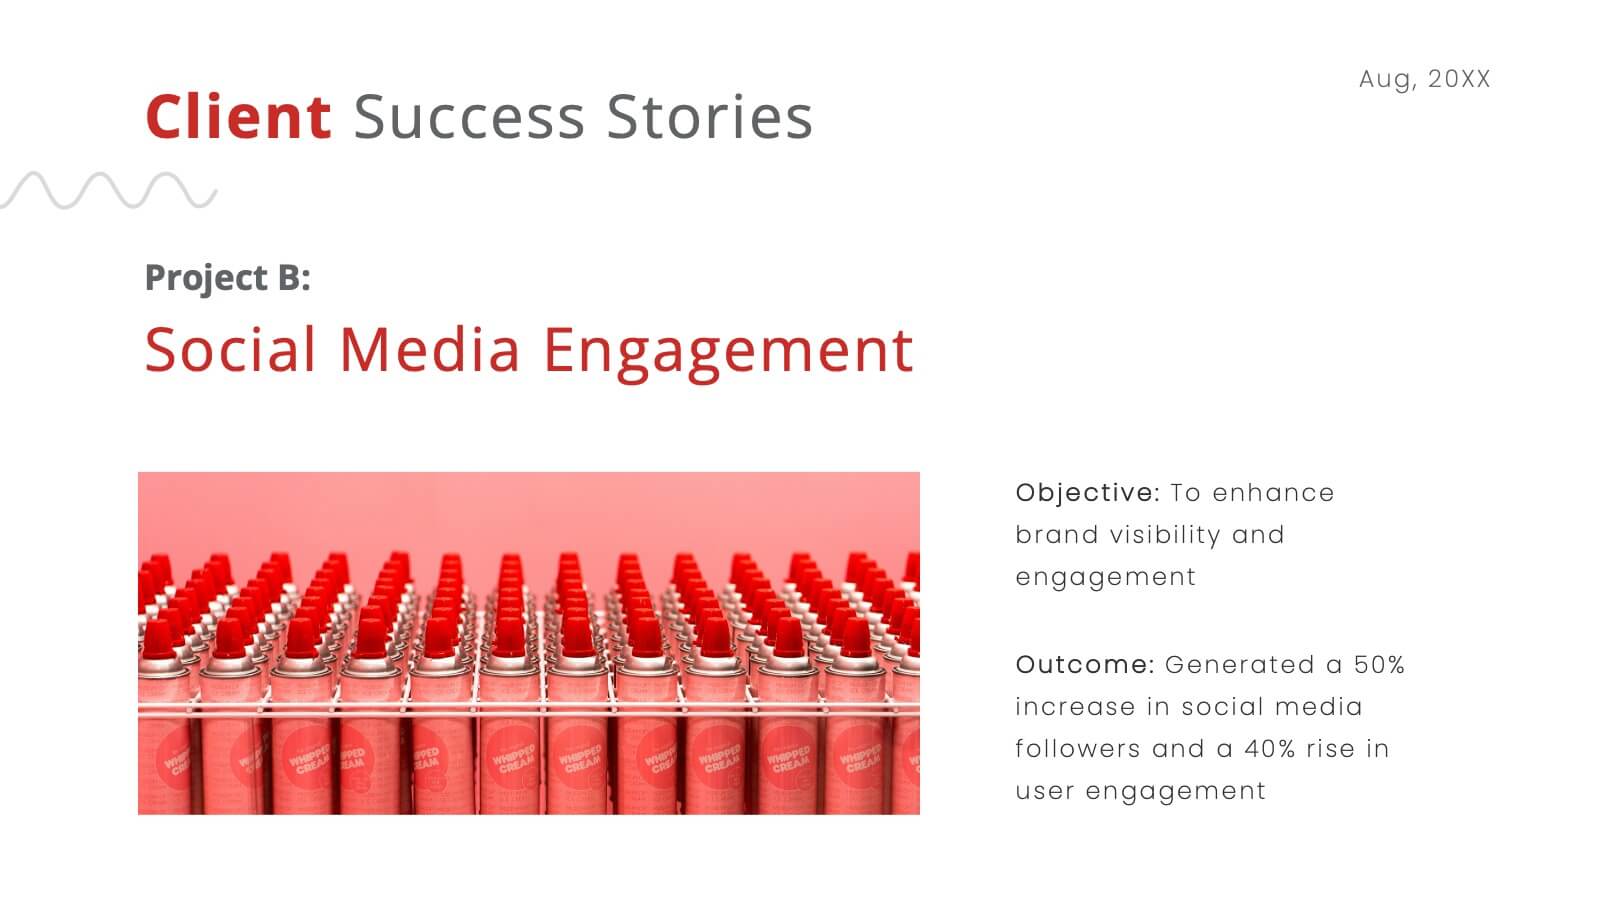
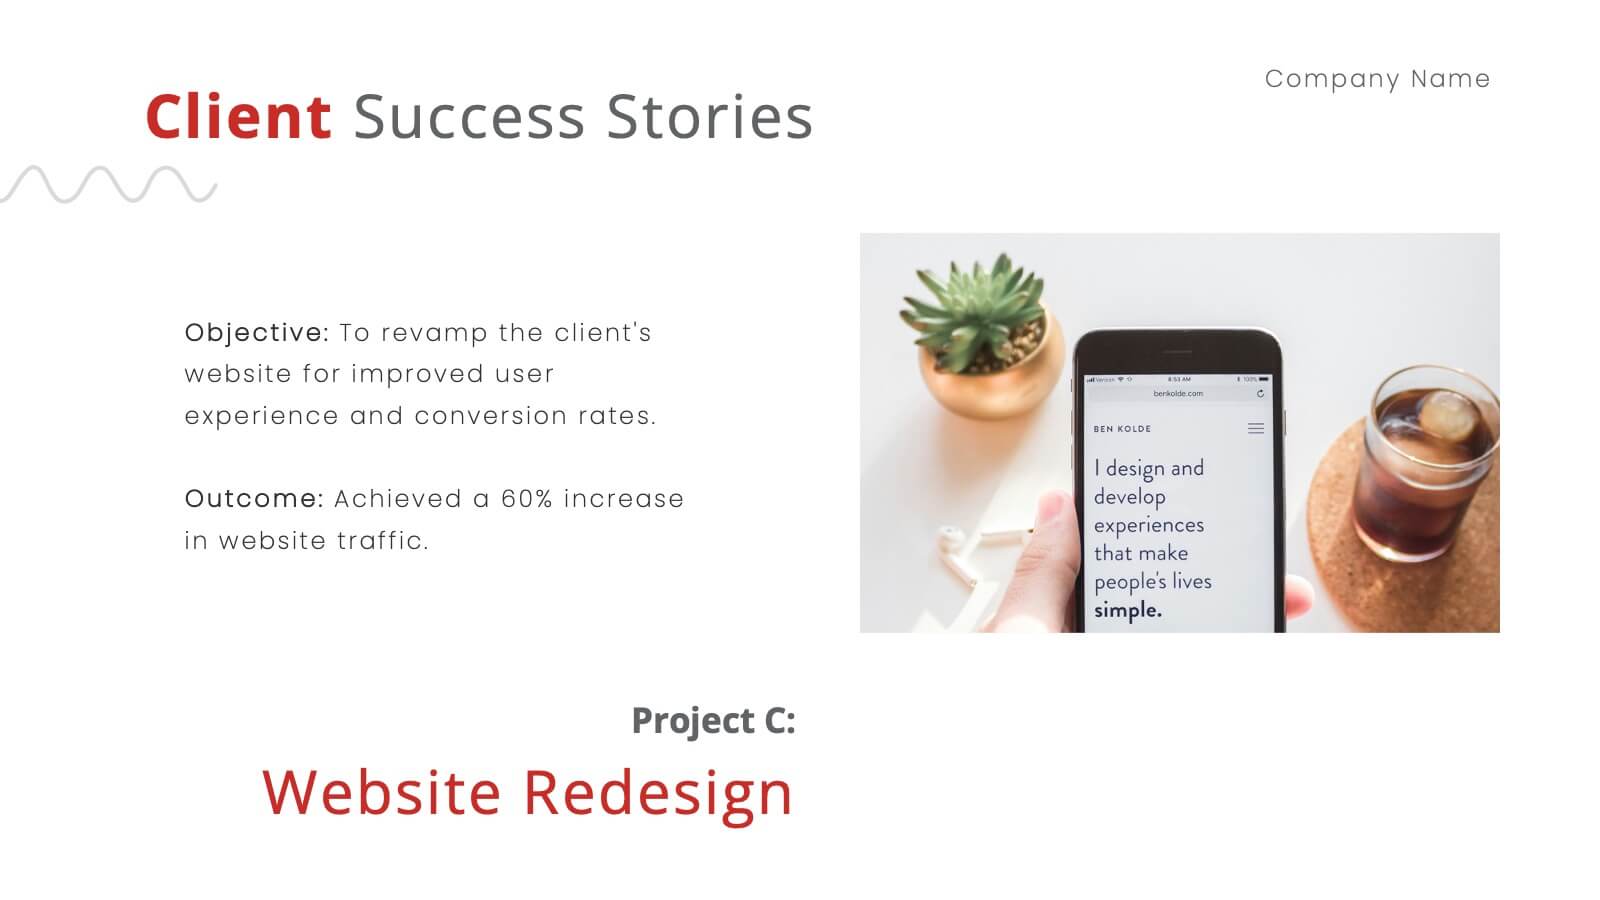
Nickel Advertising Agency Proposal Presentation
Take your advertising agency to the next level with this sleek and modern presentation template! Highlighting your services, team, success stories, and marketing strategies, it’s the perfect tool to showcase your agency’s strengths and capabilities. Fully customizable and compatible with PowerPoint, Keynote, and Google Slides, this template is ideal for impressing potential clients and partners.


5 slides
Social Media Strategy Infographic
Social Media refers to digital platforms and websites that allow users to create and share content, engage with others, and participate in online communities. This presentation template is a powerful tool to help you create a comprehensive social media strategy. It provides a visually appealing and easy-to-understand overview of the key elements of a successful social media strategy. Use this template to plan and communicate your social media strategy effectively, ensuring that you make the most of your social media presence and engage your target audience efficiently. This template is compatible with Powerpoint, Keynote, and Google Slides.


4 slides
Boardroom Strategy Meeting Overview Presentation
Align leadership goals and present strategic priorities with the Boardroom Strategy Meeting Overview presentation. Featuring a clean visual of executive collaboration, this template helps organize key discussion points, initiatives, and responsibilities in a structured layout. Ideal for quarterly planning, leadership updates, and strategic alignment sessions. Fully editable in PowerPoint, Keynote, and Google Slides.


7 slides
Customer Service Profile Infographic Presentation
A Customer Profile infographic is a visual representation of a target customer or customer segment that provides important information about their demographics, behavior, preferences, and needs. This template can help businesses and organizations understand their customers better, tailor their products or services to meet their needs, and develop effective marketing strategies. This template can be used for various purposes, such as to guide product development, to inform marketing campaigns, or to improve customer service. This template is compatible with Powerpoint, keynote and google slides.


10 slides
Brand Loyalty and Customer Retention Presentation
Strengthen your brand’s relationship with your audience using the "Brand Loyalty and Customer Retention" presentation template. This design effectively illustrates how strong branding strategies enhance customer loyalty and retention rates. Ideal for marketers and business strategists, this template is fully compatible with PowerPoint, Keynote, and Google Slides, making it perfect for presentations aimed at improving customer engagement and business growth.


6 slides
Agile Development Process Presentation
Bring your process to life with a bold circular workflow that makes each development stage easy to explain and visually engaging. This presentation helps teams outline steps, refine tasks, and communicate progress with clarity and flow. Fully editable and compatible with PowerPoint, Keynote, and Google Slides.


5 slides
Geographic Distribution Heat Map Layout Presentation
Visualize regional trends at a glance with the Geographic Distribution Heat Map Layout Presentation. This template helps you showcase location-based performance, market presence, or demographic data across the U.S. using a clean gradient heat map. Ideal for sales reports, marketing reach, or expansion strategies. Fully editable in Canva, PowerPoint, Keynote, and Google Slides.


7 slides
Bubble Map Diagram Presentation
A Bubble Map Infographic is a visual representation that uses bubbles to convey information. It is used to display geographic data, such as population density, sales figures, or distribution of resources. In this template the size of the bubbles represents the value of the data being presented, with larger bubbles indicating a higher value. The color of the bubbles may also be used to indicate different categories or levels of the data. This infographic can be customized with different colors, fonts, graphics, text boxes, charts, and other visual aids to suit all your needs.