


Features
- 4 Unique slides
- Fully editable and easy to edit in Microsoft Powerpoint, Keynote and Google Slides
- 16:9 widescreen layout
- Clean and professional designs
- Export to JPG, PDF or send by email


Do you have any questions?
Recommend


5 slides
Comprehensive Sex Education Infographics
Navigate the sensitive landscape of human sexuality education with our comprehensive sex education infographics. Cast on a canvas of bold colors like black, yellow, and red, these infographics delicately handle the topics inherent to sex education. This tool is invaluable for educators, health professionals, advocacy groups, and policymakers who champion for informed, safe, and healthy choices. Compatible with Powerpoint, Keynote, and Google Slides. Ensuring the content resonates with audiences of diverse ages and backgrounds. The inclusion of compelling graphics and intuitive icons, fosters an environment of learning and openness, essential for impactful discussions.


6 slides
ABC Alphabet Infographic
An "Alphabet Infographic" is a visually engaging way to present the letters of the alphabet along with corresponding words or images that start with each letter. This type of infographic is often used in educational settings to teach young children the alphabet and basic vocabulary. Display the letters of the alphabet in a clear and appealing layout. You can arrange them in rows or columns, using a bold and easily readable font. Use colorful and child-friendly illustrations for the images associated with each letter. This will make the infographic more captivating and engaging for young learners.


2 slides
Online Course Structure and Syllabus Deck Presentation
Welcome students with a vibrant and modern course intro slide. This template is perfect for online educators outlining course objectives and syllabus details. Features an image placeholder and text sections for clear communication. Fully editable in PowerPoint, Keynote, and Google Slides—ideal for virtual learning environments and eLearning programs.
21 slides
Velocity Startup Growth Plan Presentation
Accelerate your startup's growth with this dynamic plan template! Perfect for outlining your mission, vision, business model, and marketing strategy. Ideal for entrepreneurs aiming to secure funding and drive success. Compatible with PowerPoint, Keynote, and Google Slides, this template ensures your growth plan is clear, professional, and compelling. Achieve your startup goals today!


2 slides
Thank You Message and Contact Info Presentation
End your presentation on a polished note with the Thank You Message and Contact Info Presentation slide. This clean, professional layout features space for your name, company details, and contact information—plus a photo to humanize your brand. Includes light and dark theme options. Fully editable in Canva, PowerPoint, Keynote, and Google Slides.


10 slides
Leadership and Organizational Vision Presentation
Showcase your company’s path to growth and alignment with this sleek Leadership and Organizational Vision slide. The diamond-shaped infographic flow is perfect for outlining mission pillars, executive strategies, or value-driven goals across five stages. Each section includes icons and editable descriptions for clarity and engagement. Ideal for strategic planning sessions, team briefings, or executive reports. Fully customizable in PowerPoint, Keynote, and Google Slides for seamless integration into your presentation.


20 slides
Leafsong Design Strategy Proposal Presentation
This Design Strategy Presentation Template is perfect for showcasing your creative process, key design elements, and project planning. Covering essential aspects like moodboards, prototypes, and design assets, it ensures a structured and visually appealing approach. Fully customizable and compatible with PowerPoint, Keynote, and Google Slides.


5 slides
Performance Metrics and KPI Review Presentation
Visualize performance at a glance with the Performance Metrics and KPI Review presentation template. Featuring sleek gauge charts in various color schemes, this layout makes it easy to display progress, thresholds, and KPIs across categories. Customize each dial and label to reflect your own business metrics. Compatible with PowerPoint, Keynote, and Google Slides.


5 slides
Strategic Roadmap with Milestone Tracks
Chart your progress with clarity using the Strategic Roadmap with Milestone Tracks Presentation. This visual template showcases a dotted milestone path connecting key yearly events or business phases—perfect for illustrating timelines, strategic goals, and transformation journeys. Fully editable in PowerPoint, Keynote, and Google Slides.


7 slides
Healthy Food Infographic
Healthy food is of paramount importance for overall well-being and a good quality of life. This infographic template aims to promote understanding and adoption of a healthy diet through a visually appealing and informative layout. This template is designed to showcase a balanced and nutritious diet by educating individuals on healthy food choices, portion control, and incorporating superfoods into their meals. This infographic is fully customizable and compatible with Powerpoint, Keynote, and Google Slides. This allows you to easily customize, add visuals, and design as per your needs and preferences.


5 slides
Innovation Framework Presentation
Turn bold ideas into structured success with this engaging presentation design. Perfect for mapping creative processes, innovation systems, and project development stages, it helps present ideas clearly and visually. Fully editable and easy to customize, this presentation is compatible with PowerPoint, Keynote, and Google Slides for effortless use.
22 slides
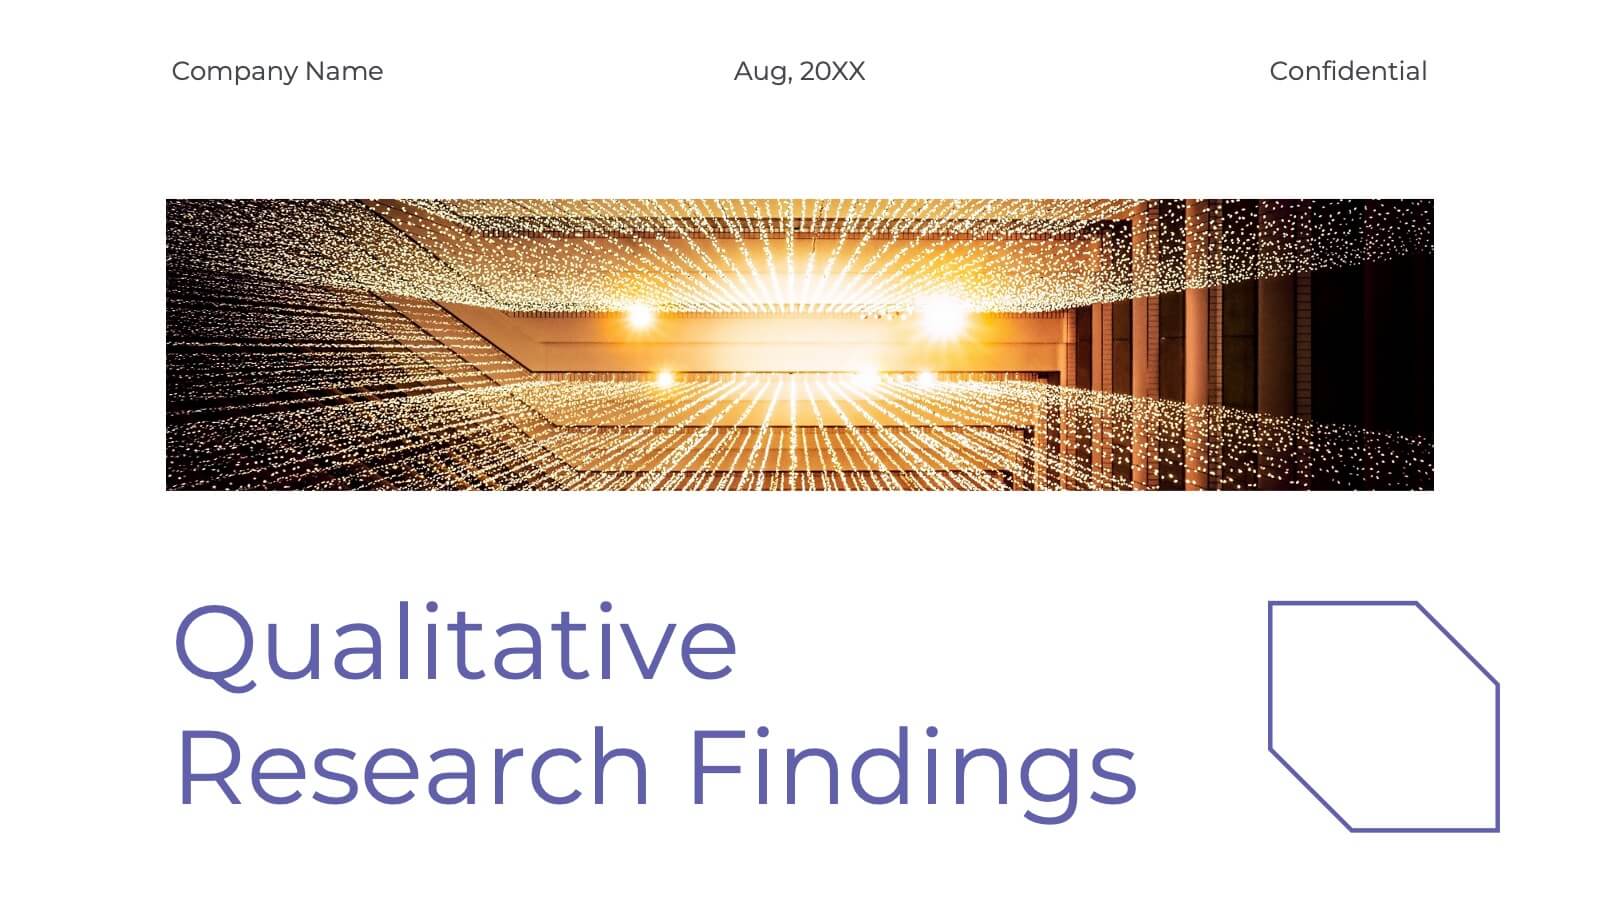
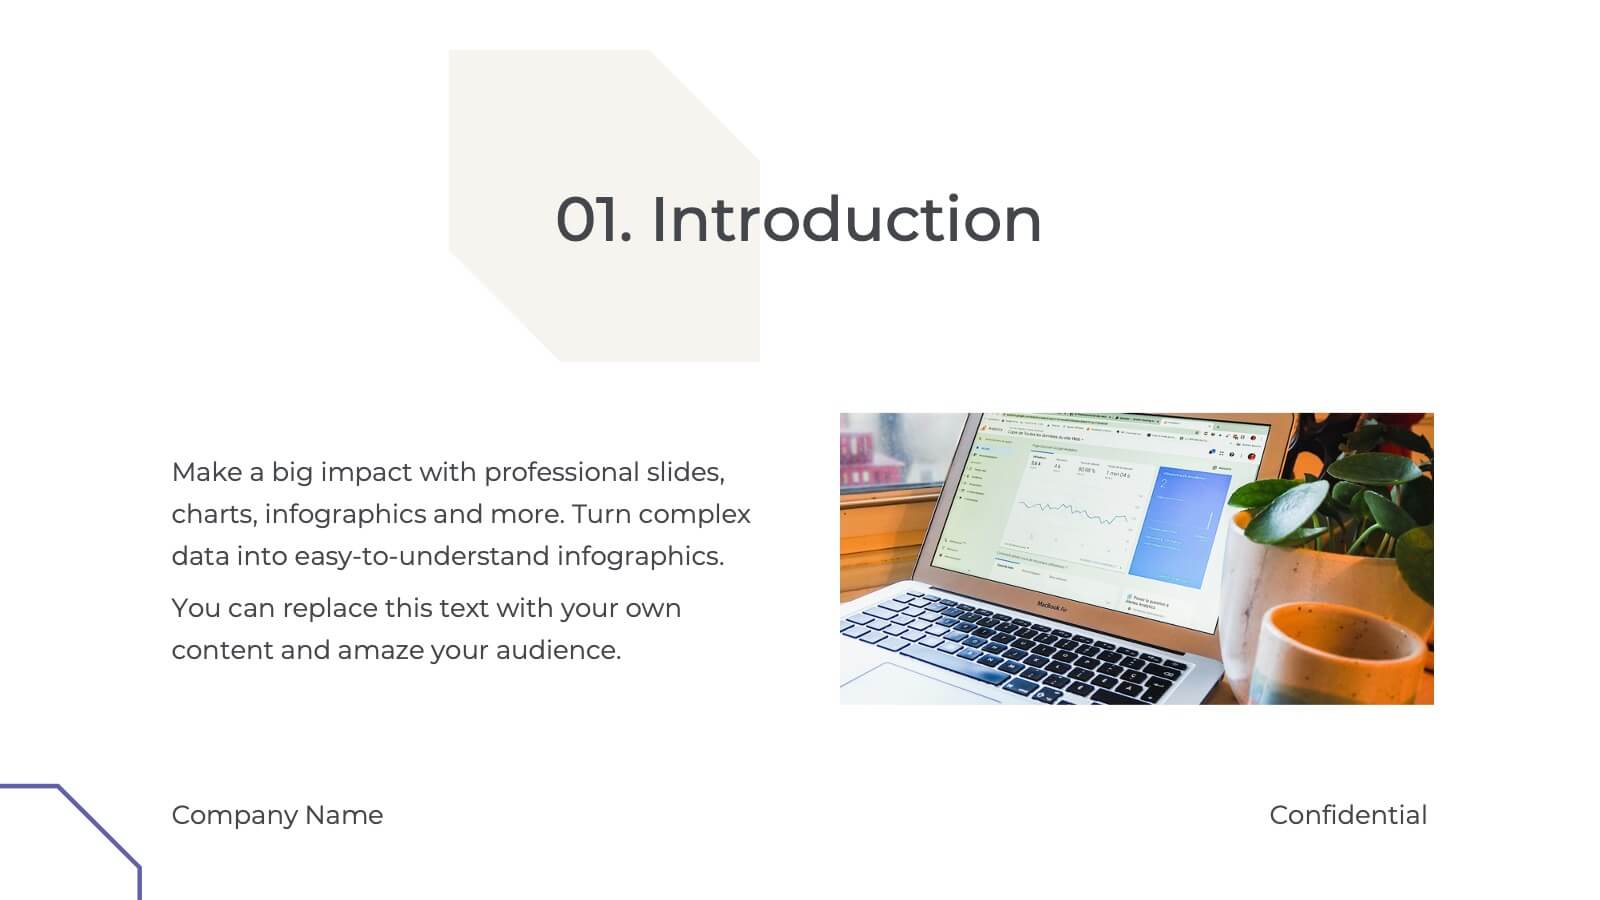
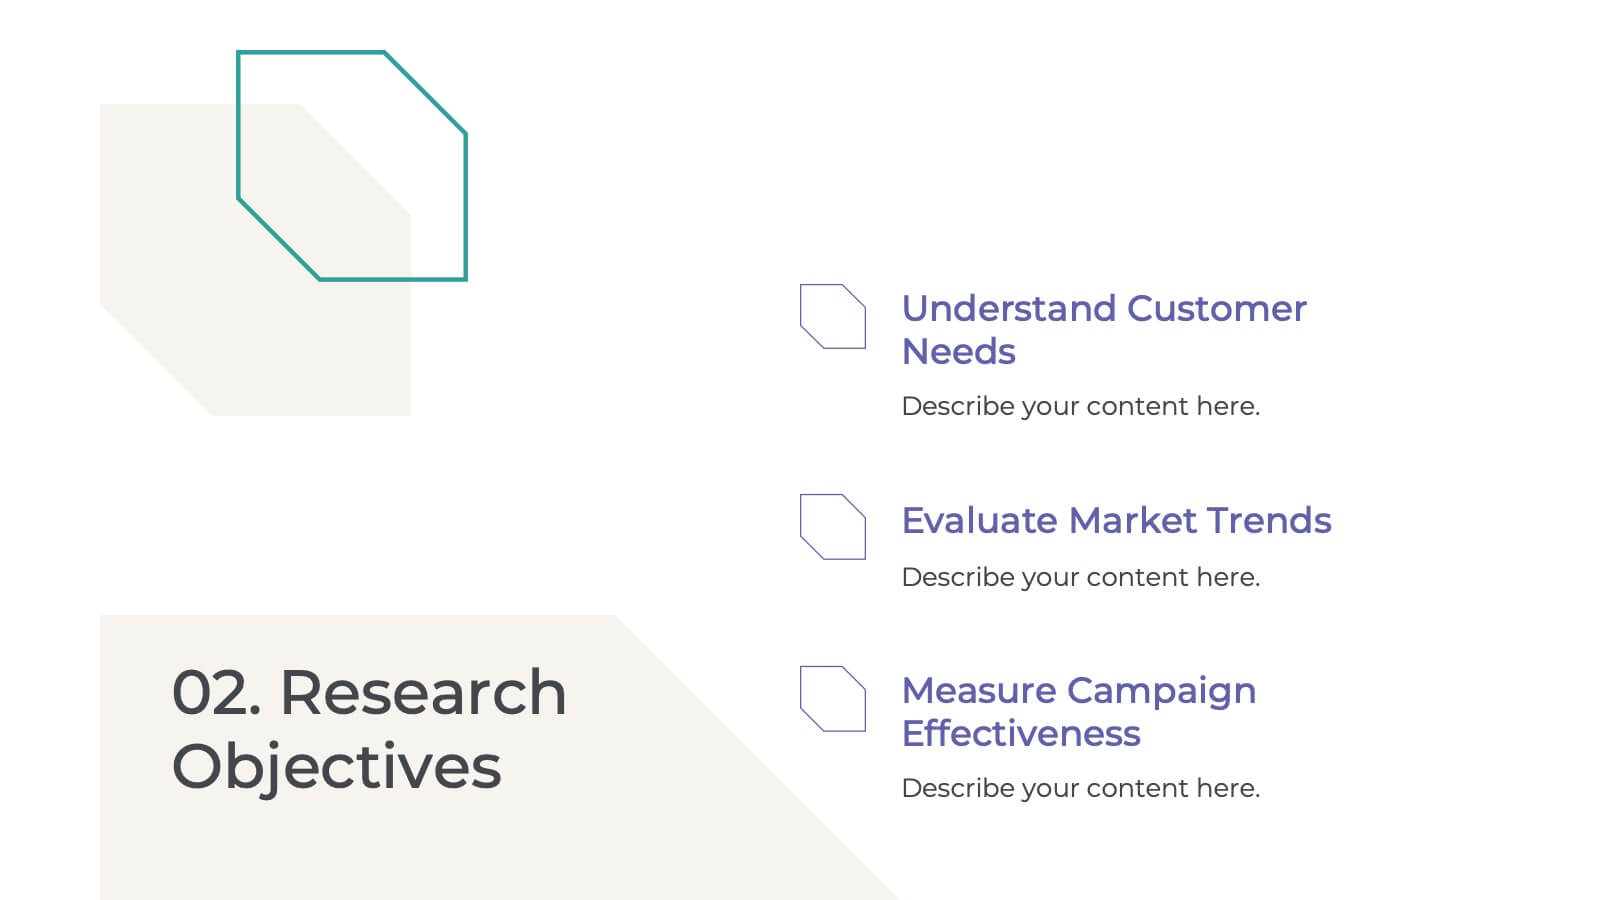
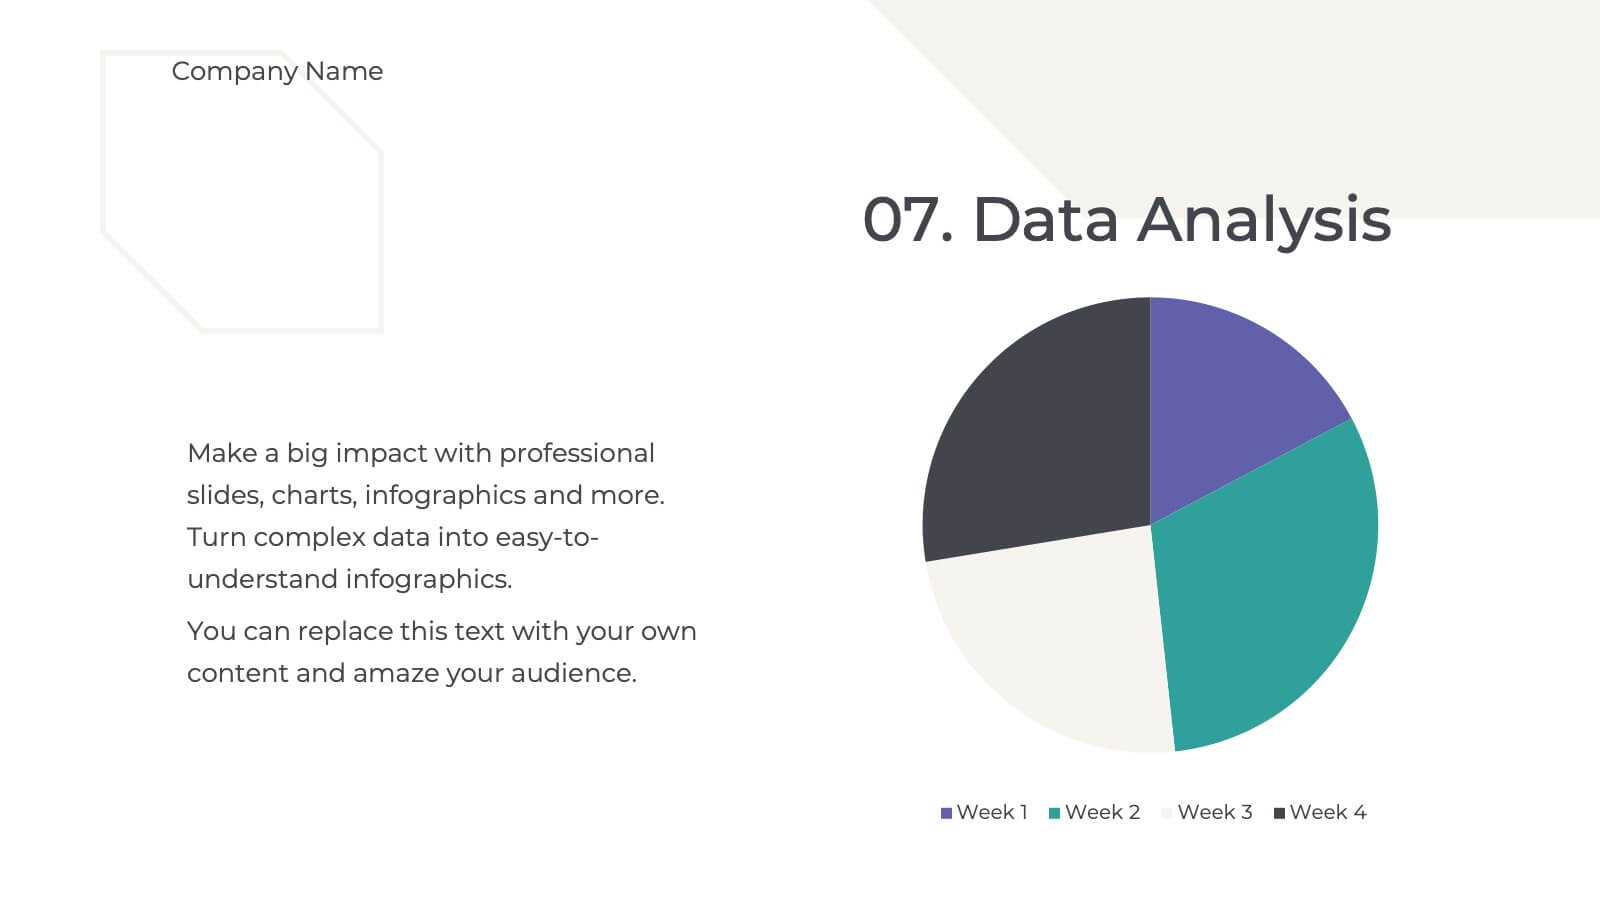
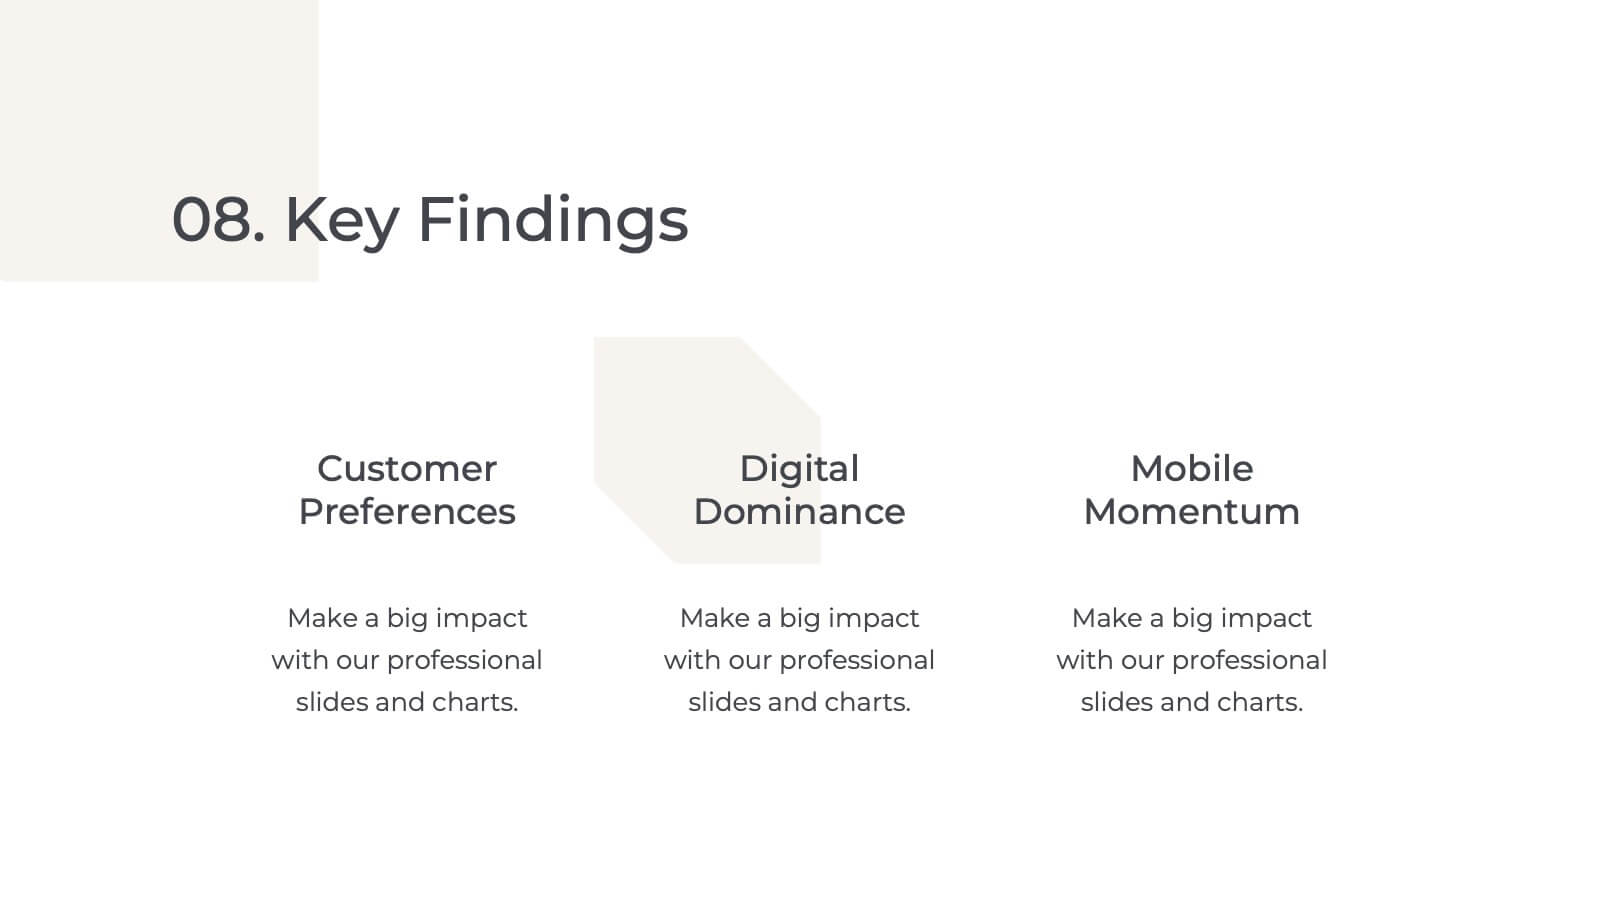
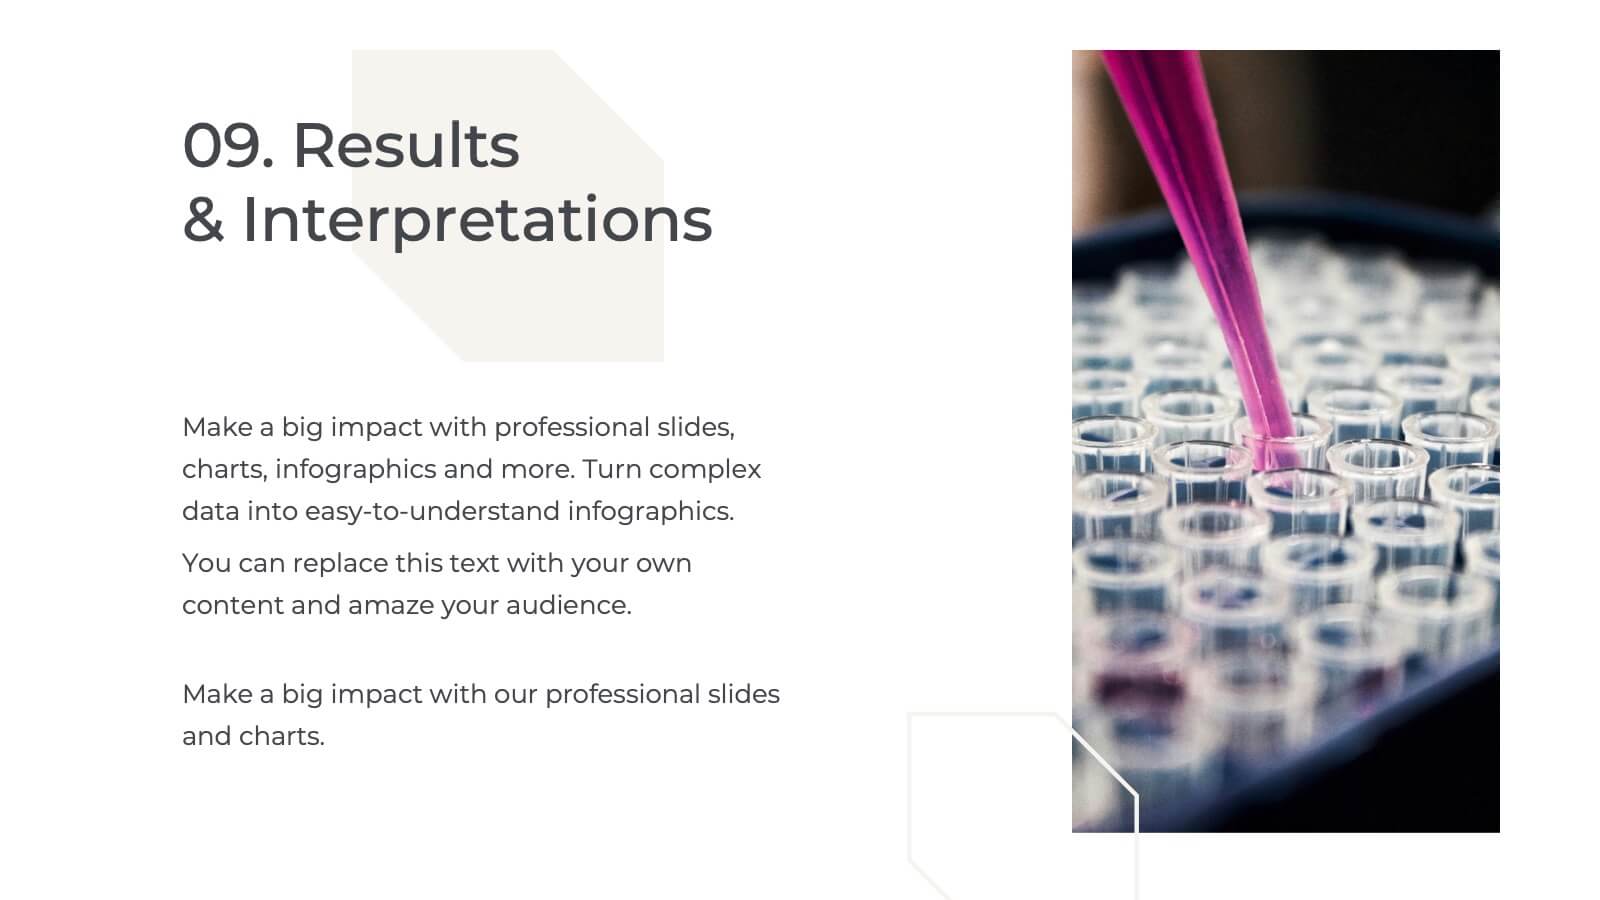
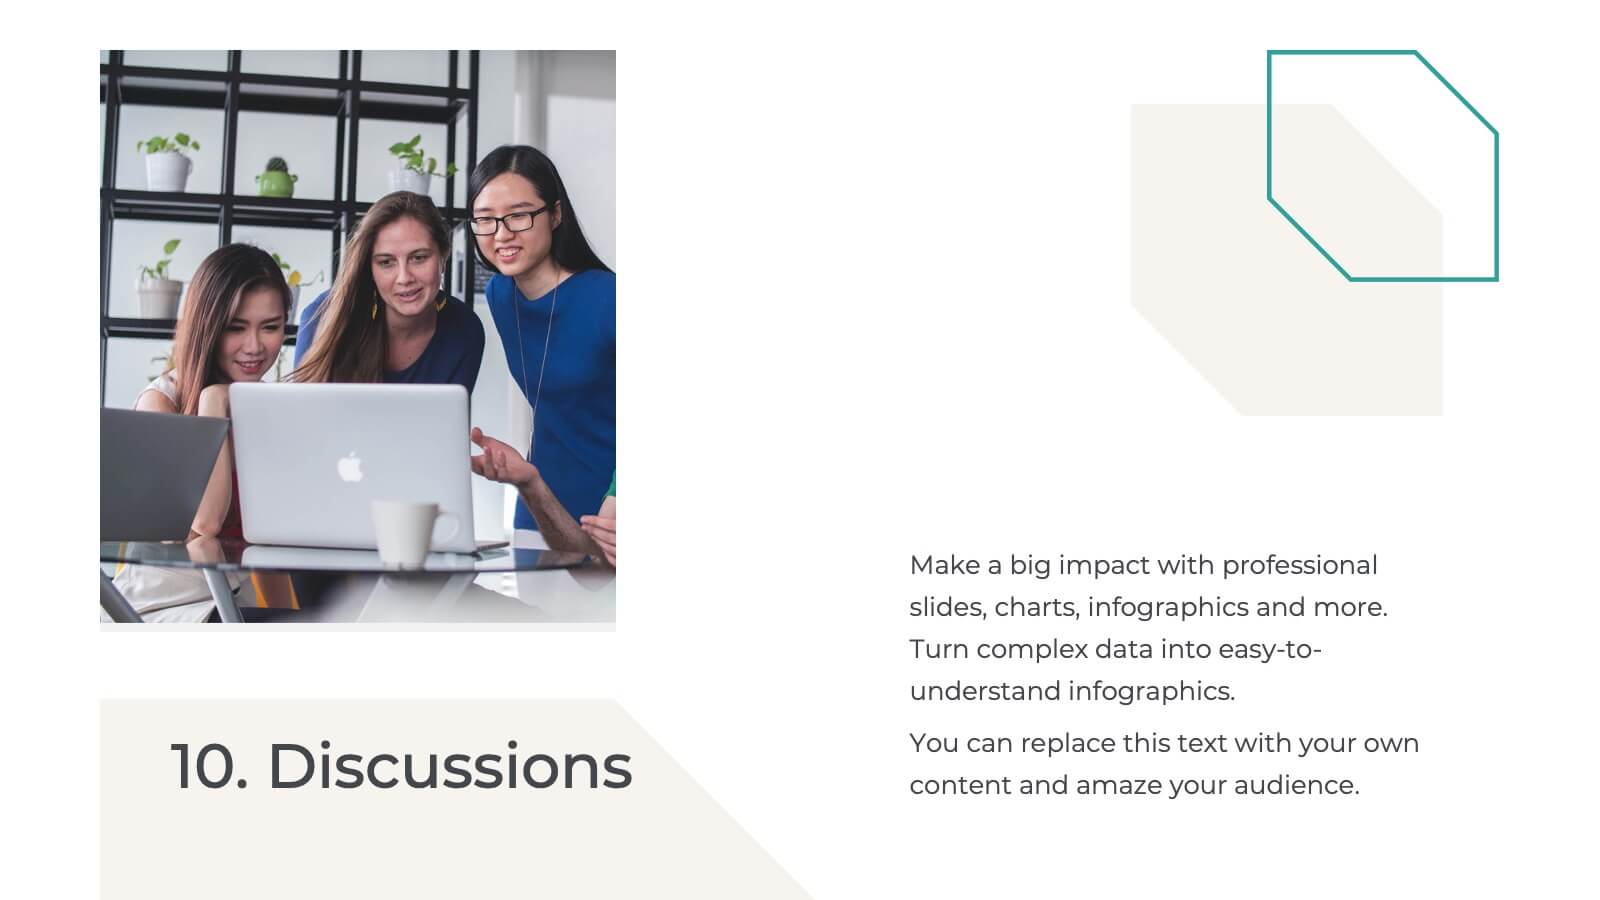
Palladium Qualitative Research Findings Presentation
Present your qualitative research findings effectively with this sleek, professional template. It includes sections for objectives, data analysis, key findings, and recommendations. Ideal for organizing research insights clearly, it's customizable and compatible with PowerPoint, Keynote, and Google Slides, ensuring smooth collaboration and impactful presentations for your audience.


5 slides
OKR-Based Goal Setting Approach
Clarify your objectives and key results with this visual OKR-Based Goal Setting slide. Each target icon represents a focused initiative, helping teams align and measure progress clearly. Fully editable in PowerPoint, Keynote, and Google Slides.


5 slides
Risk Detection Techniques Presentation
Spot potential risks before they escalate with this step-by-step risk detection visual. Featuring ascending block elements and a dynamic layout, this template is ideal for illustrating detection stages or evaluation metrics. Fully editable in PowerPoint, Keynote, and Google Slides—perfect for risk management, audit reports, or compliance presentations.


7 slides
McKinsey 7S Model Strategy Presentation
Bring clarity to complex organizational relationships with a clean, structured layout that highlights how key elements connect and influence performance. This presentation helps you explain core components, identify alignment gaps, and guide strategic decision-making with confidence. Easy to customize and fully compatible with PowerPoint, Keynote, and Google Slides.


7 slides
Behavior Psychology Infographic Presentation
A Psychology Infographic is a visual representation of information related to the field of psychology. This template includes charts, diagrams, and other visual elements that help illustrate concepts, theories, and research findings in psychology. Use this infographic to cover a wide range of topics, such as personality traits, cognitive processes, mental disorders, and social behavior. The purpose of this psychology template is to help people better understand the complex concepts related to psychology. Compatible with Powerpoint, Keynote, and Google Slides this template is fully editable.


7 slides
Leadership Infographic Presentation Template
Leadership is a vital function of management. It helps to direct an organization's resources toward improved efficiency and the achievement of goals. While leadership can be defined in many ways, it is best explained as the ability to motivate and inspire others through example, providing them with direction and being a source of inspiration for those under your authority. This template is designed for you to build the key skills of leadership. Leadership is important for the success of any organization. This template will help you identify your leadership strengths and how to use them.