


Features
- 6 Unique Slides
- Fully editable and easy to edit in Microsoft Powerpoint, Keynote and Google Slides
- 16:9 widescreen layout
- Clean and professional designs
- Export to JPG, PDF or send by email


Do you have any questions?
Recommend


4 slides
Cost Comparison Analysis Chart Presentation
Turn your price evaluations into something visually compelling with this sleek and modern layout. Perfect for showcasing product features, service packages, or market comparisons, it simplifies decision-making with a clear side-by-side design. Fully editable and compatible with PowerPoint, Keynote, and Google Slides for effortless customization.


5 slides
Value Chain Business Model Presentation
Spark fresh insight into how your organization creates value with this clean, arrow-based layout that makes every step feel intuitive and action-ready. This presentation breaks down key activities, support processes, and improvement opportunities in a clear visual flow perfect for strategy discussions. Fully compatible with PowerPoint, Keynote, and Google Slides.


5 slides
Project Status Update Report Presentation
Keep your project tracking transparent and effective with the "Project Status Update Report" presentation templates. These templates help you visually communicate the progress of tasks, timelines, and milestones, ensuring stakeholders stay informed and engaged. Ideal for project managers needing a streamlined, professional format compatible with PowerPoint, Keynote, and Google Slides, they simplify reporting and enhance project visibility.


4 slides
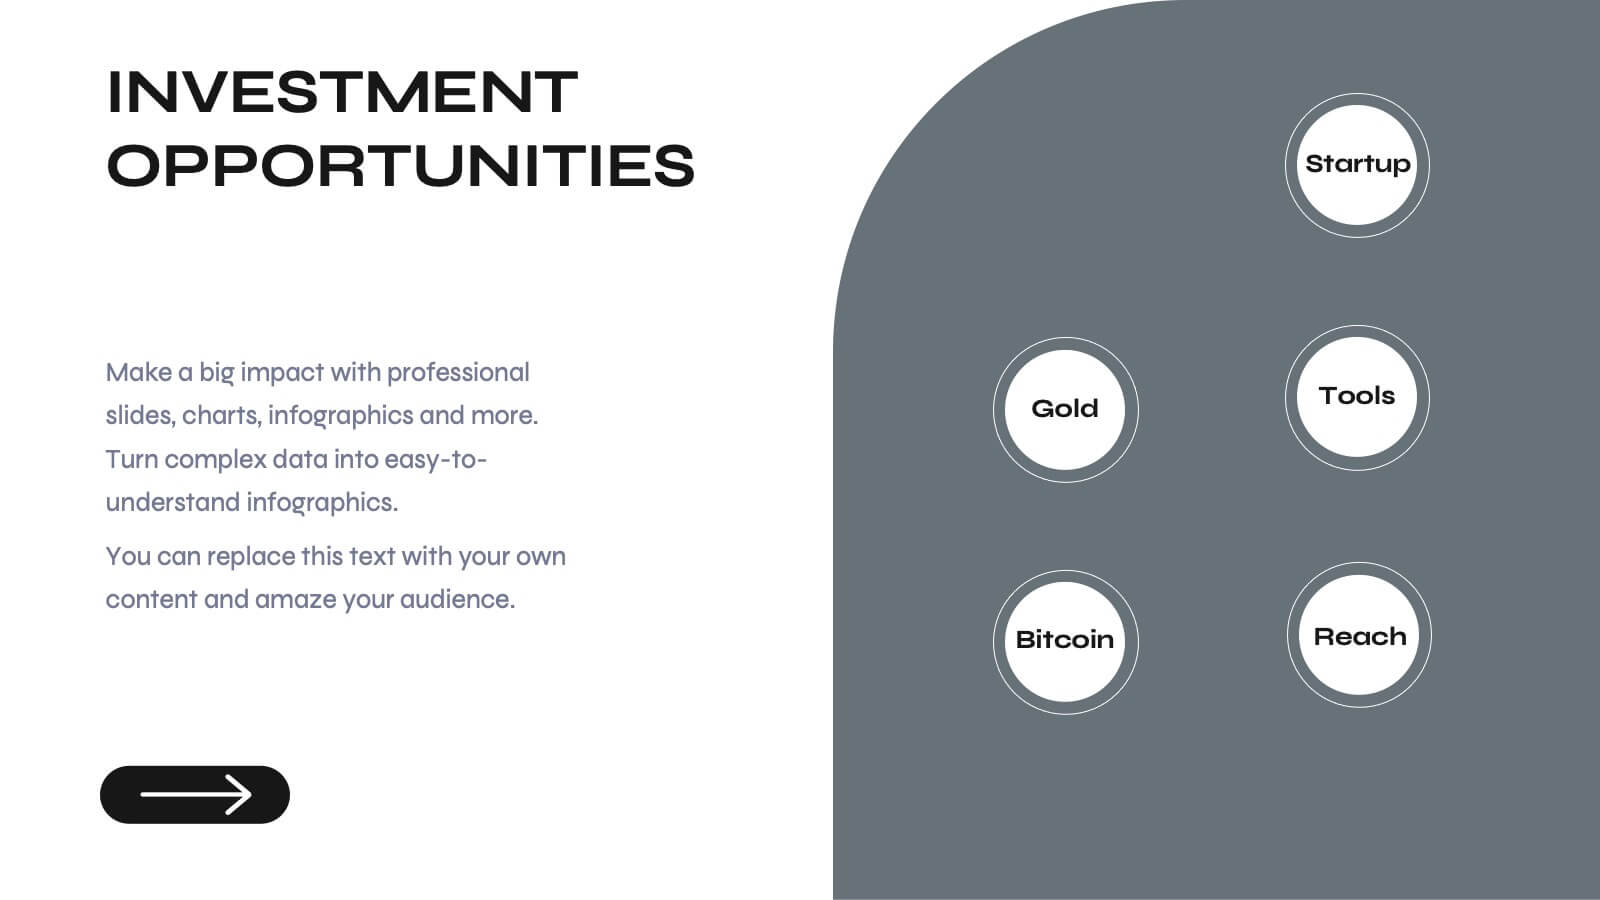
Investment Planning and Risk Guide
Simplify your financial presentation with the Investment Planning and Risk Guide Presentation. This 3-step visual layout walks viewers through the key stages of financial decision-making, from initial capital to potential return. Perfect for illustrating risk assessment, investment flow, or budgeting strategies. Fully editable in PowerPoint, Keynote, and Google Slides.


6 slides
Cognitive Psychology Infographics
Delve into the fascinating realm of Cognitive Psychology with our customizable infographic template. This template is fully compatible with popular presentation software like PowerPoint, Keynote, and Google Slides, allowing you to easily tailor it to convey essential concepts and insights within the field of Cognitive Psychology. The Cognitive Psychology infographic template serves as a visually engaging platform for summarizing key principles, theories, and research findings. Whether you're a psychology student, educator, or simply intrigued by the workings of the human mind, this template provides a user-friendly canvas to create informative presentations and educational materials. Enhance your understanding of Cognitive Psychology with this SEO-optimized infographic template, designed for clarity and ease of use. Customize it to showcase cognitive processes, influential experiments, and practical applications, making complex concepts more accessible to your audience. Start crafting your personalized infographic today to explore the depths of Cognitive Psychology.


21 slides
Frostwind Financial Report Presentation
Deliver a comprehensive financial report with the Frostwind Financial Report Presentation. This sleek and modern template is designed to captivate your audience while showcasing essential business metrics and insights. With dedicated sections for key highlights, financial summaries, performance metrics, and operational updates, this presentation ensures clarity and professionalism. Dive deeper into customer feedback, market trends analysis, and competitive insights to provide a well-rounded view of your organization's performance. Showcase strategic initiatives, goals review, and next week's priorities with visually engaging charts and graphics. The inclusion of a Q&A and recommendations for improvement slide allows for seamless interaction with your audience. Perfect for corporate meetings, annual reviews, and financial updates, this template is fully customizable to suit your branding. Compatible with PowerPoint, Google Slides, and Keynote, it offers versatility and ease of use, ensuring you leave a lasting impression. Take your financial reporting to the next level!


23 slides
Odyssey Small Business Pitch Deck Presentation
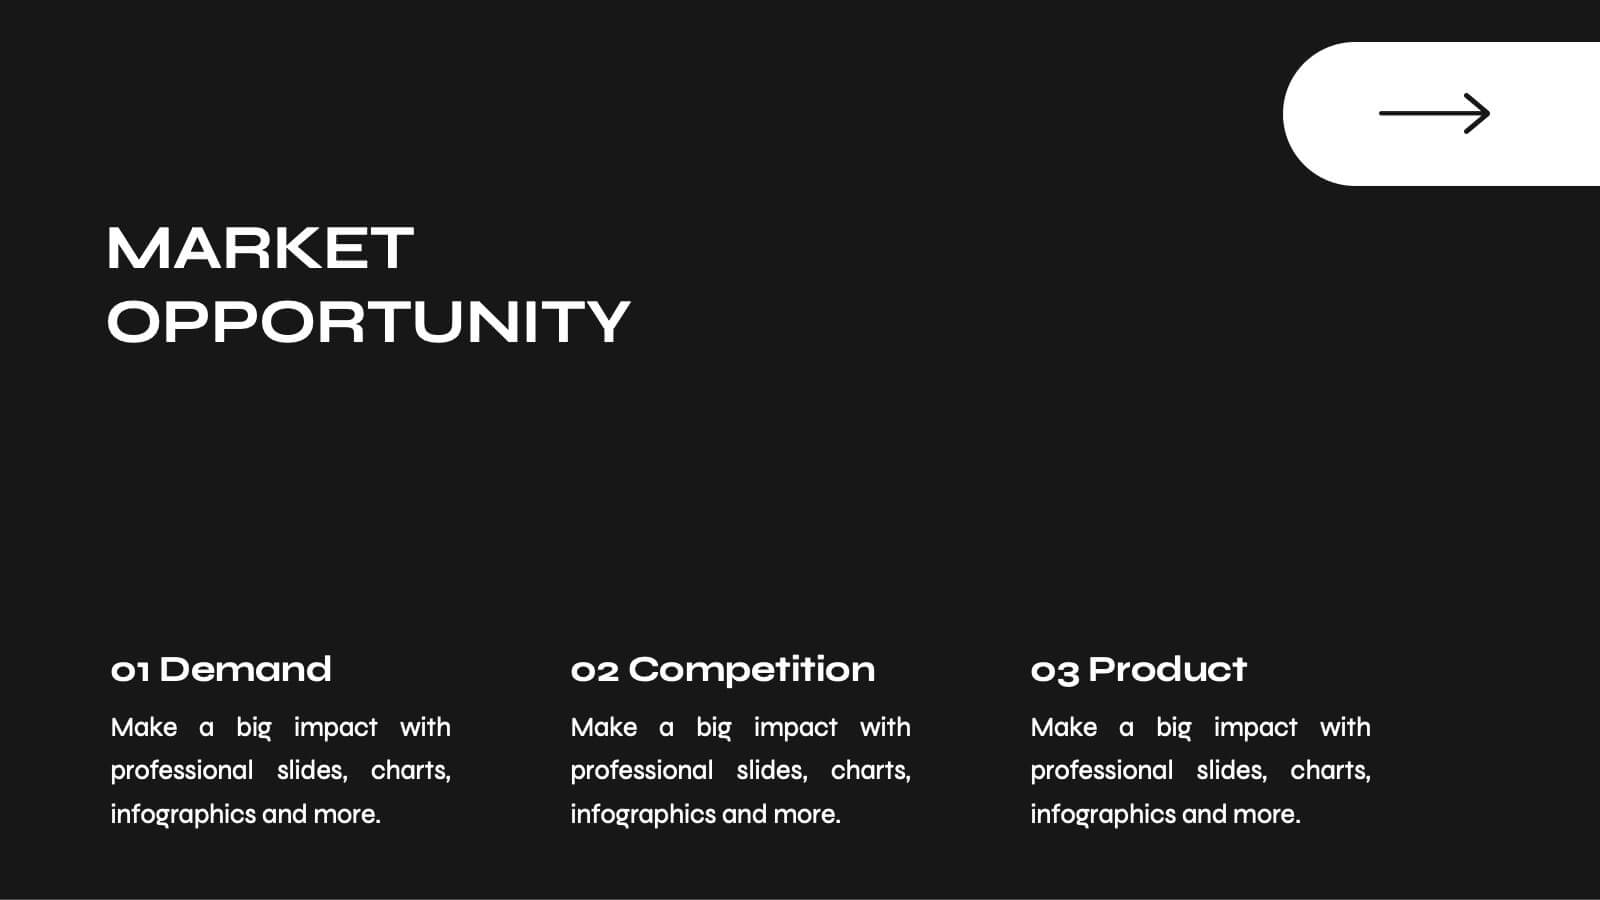
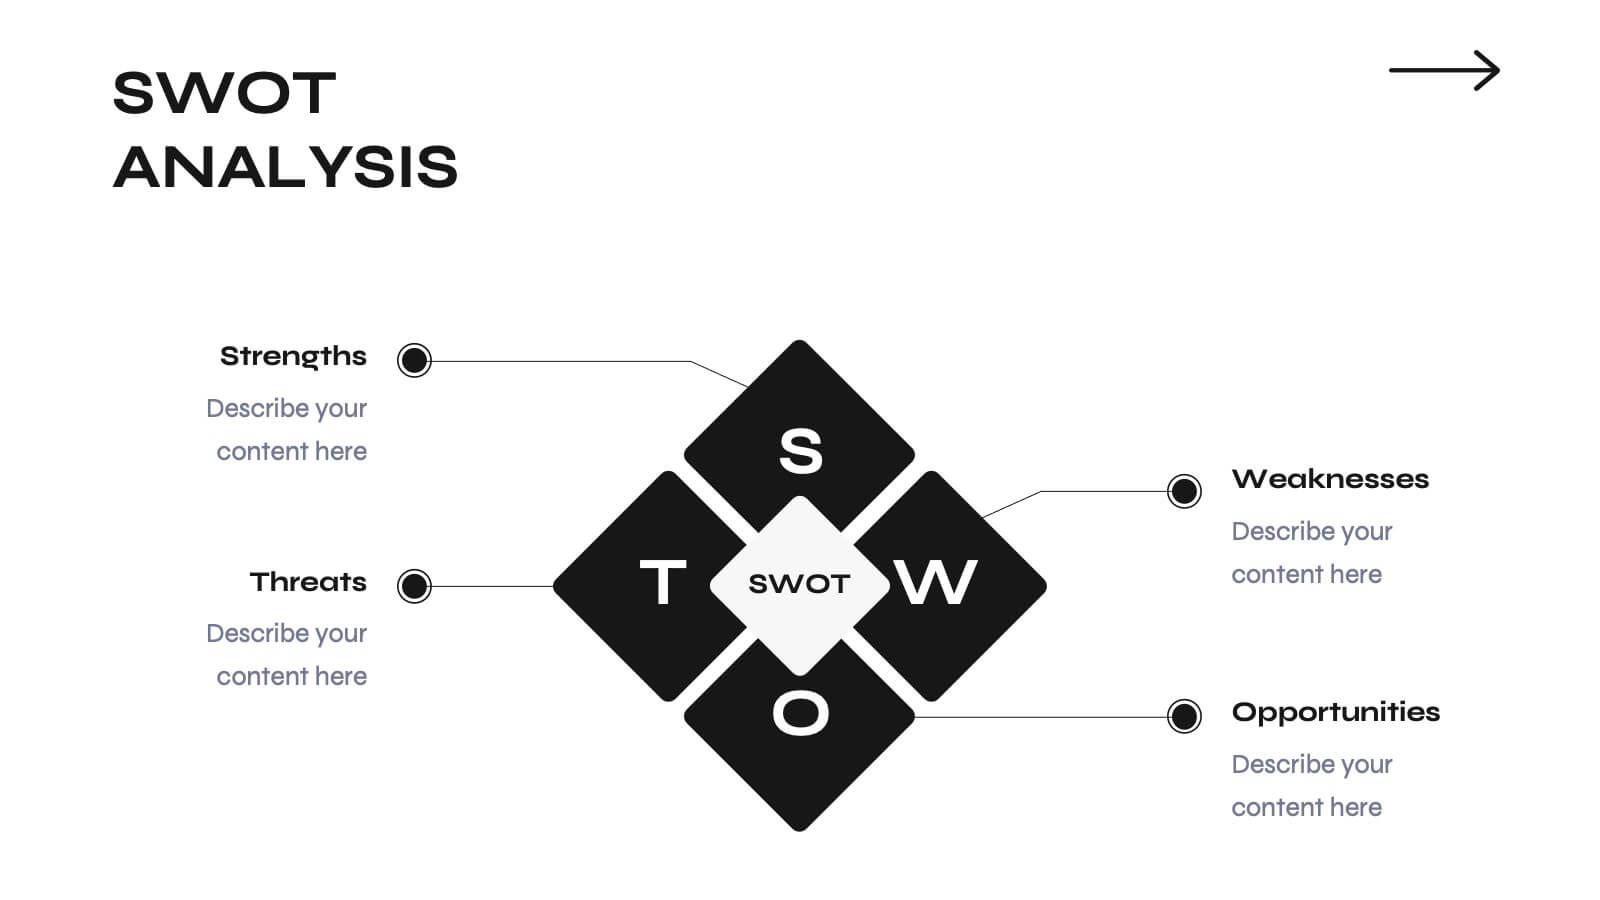
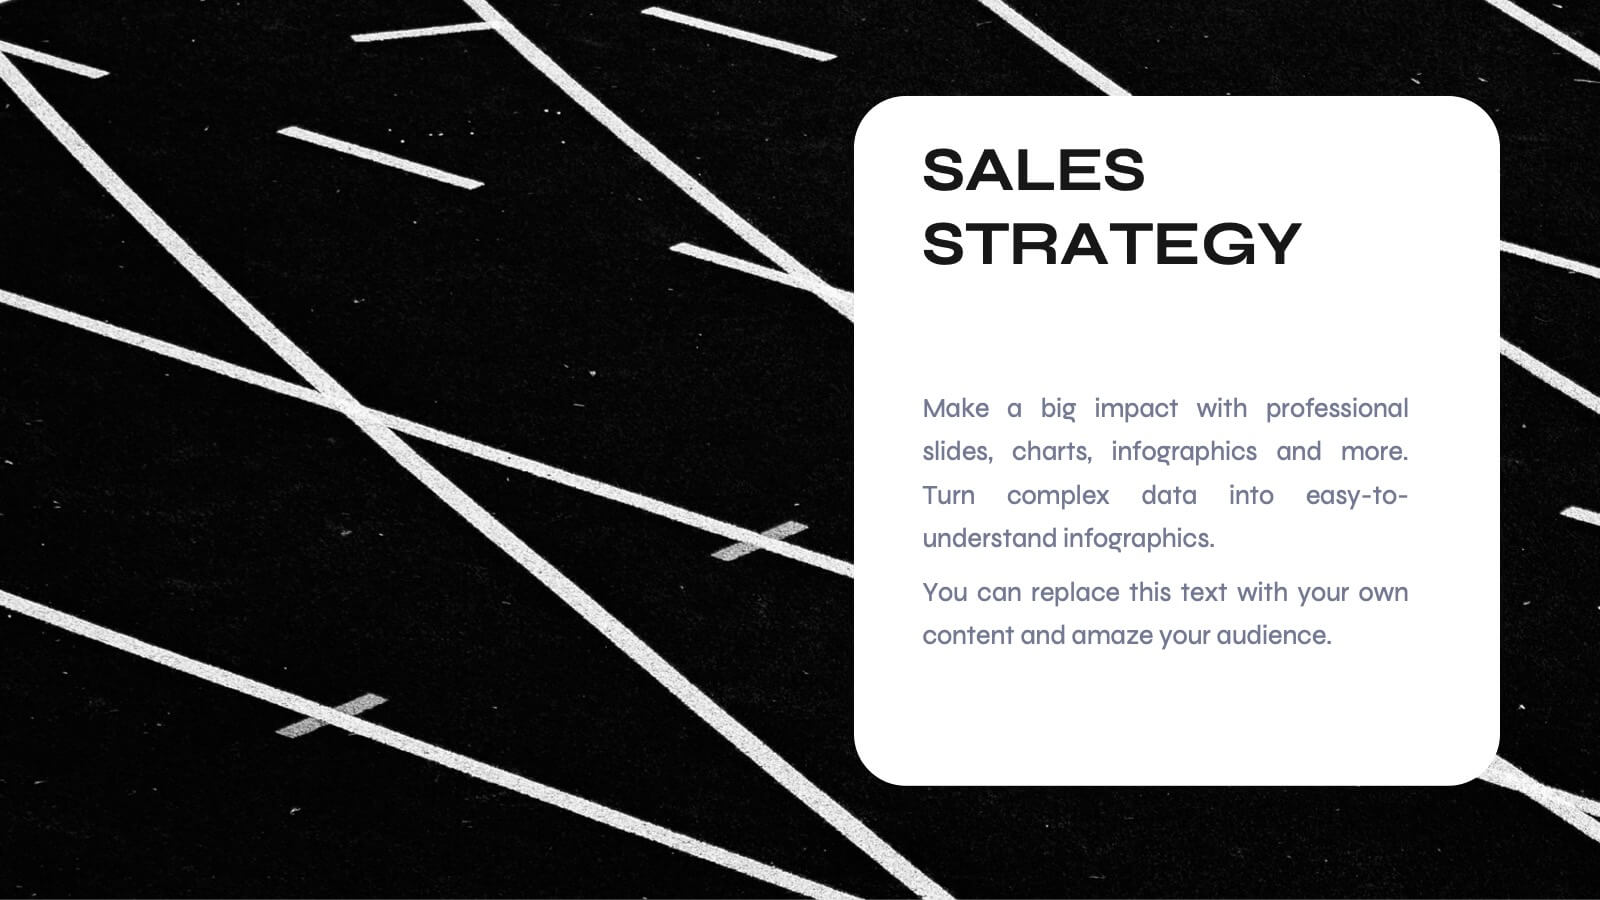
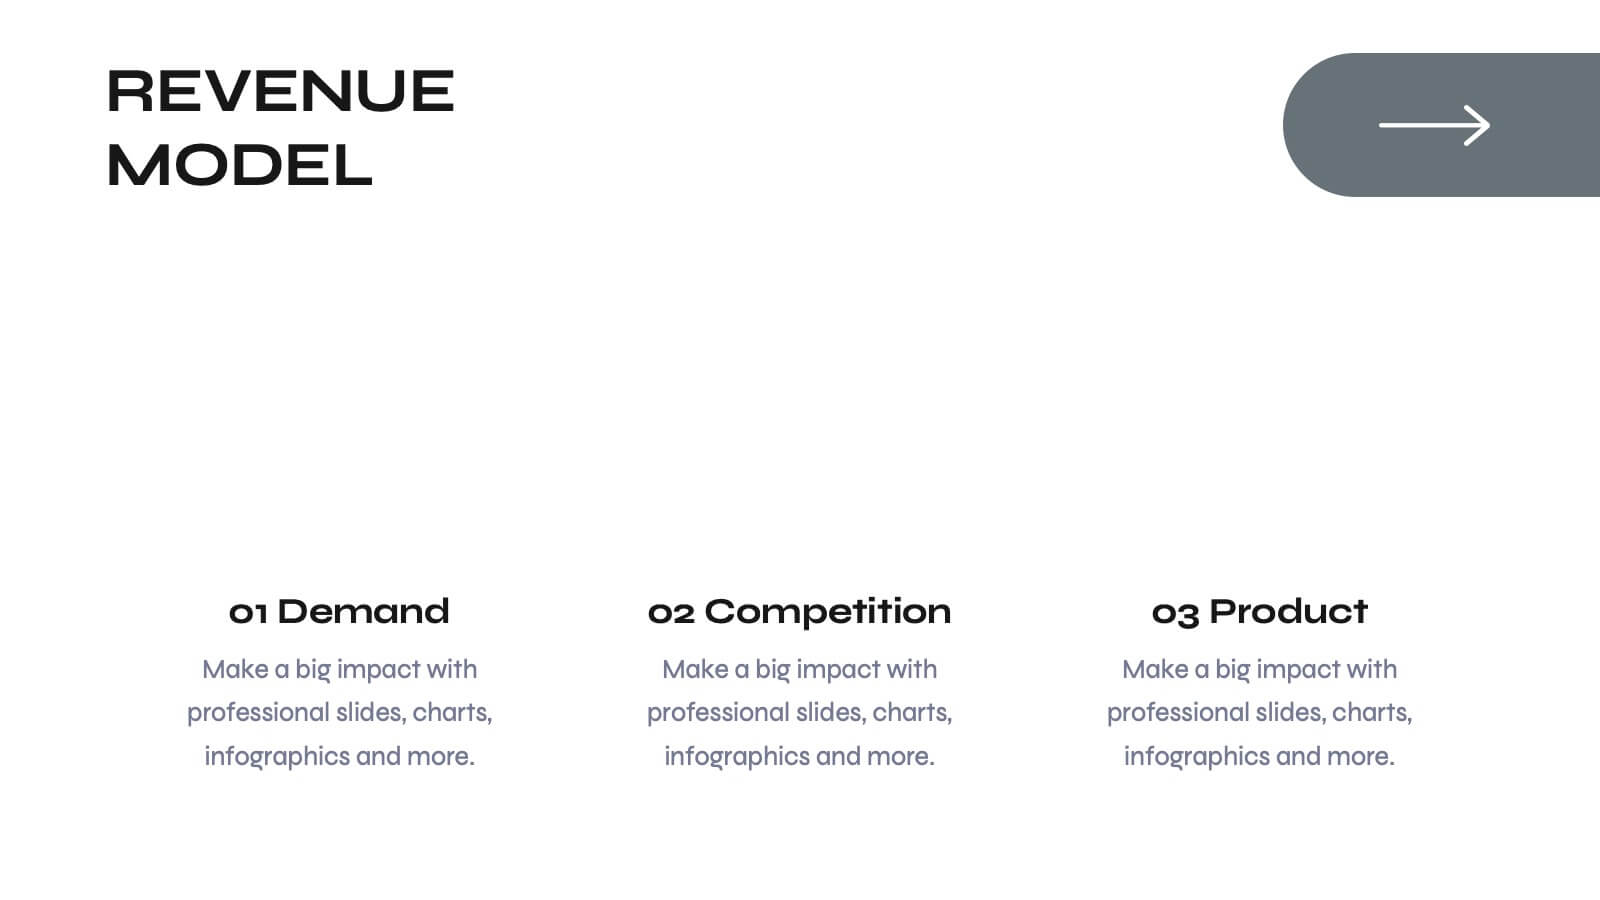
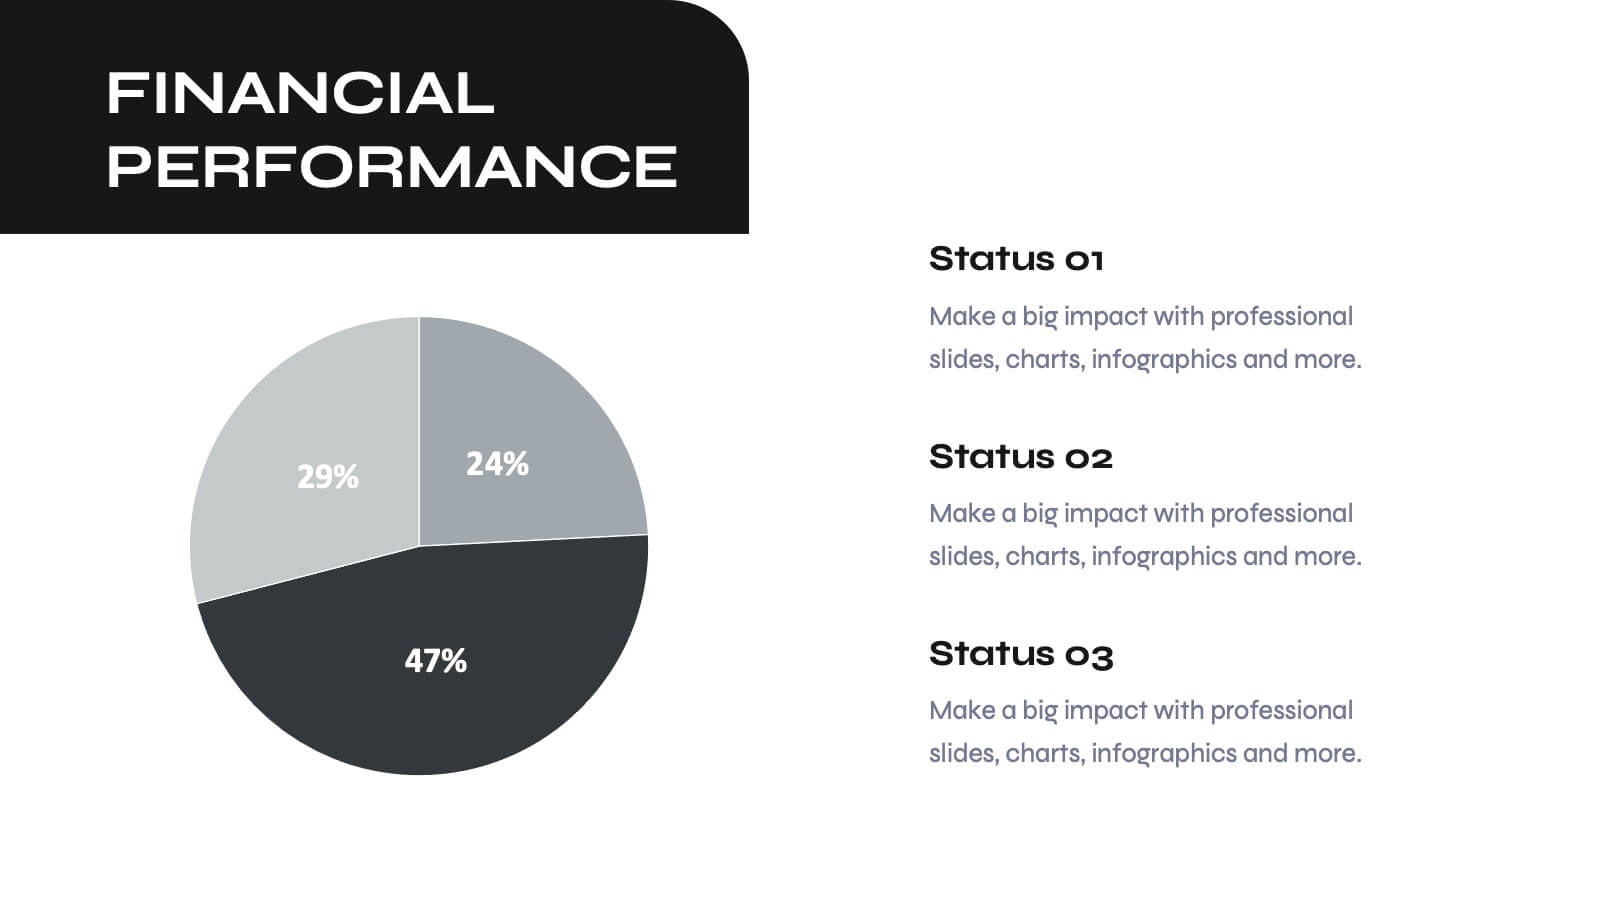
Elevate your business pitch with this sleek, monochrome presentation template. Perfect for presenting company backgrounds, market opportunities, and financial performance, it features a minimalist design that enhances clarity and impact. Highlight your value proposition and strategic plans to captivate investors. Compatible with PowerPoint, Keynote, and Google Slides, it ensures seamless presentations on any platform.


21 slides
Fahrenheit Scientific Research Presentation
Present your findings with clarity using this scientific research presentation template. Designed for researchers, it includes sections for objectives, methodology, data analysis, results, and recommendations. Perfect for academic and professional use, this template ensures a polished, organized presentation and is fully compatible with PowerPoint, Keynote, and Google Slides.


7 slides
Transportation & Logistics Solutions Infographic
Navigate the intricate pathways of transportation and logistics with our infographic. With a refreshing color palette of white and yellow, the infographic is reminiscent of the roads and paths that make up the very heart of this sector. The design incorporates intuitive icons that represent various facets of transportation – from vehicles, ships, and planes to route optimization. Each segment is clearly defined, ensuring the conveyed data is crisp and engaging. Compatible with PowerPoint, Keynote, and Google Slides. The use of yellow provides a cheerful, optimistic backdrop that accentuates the intricate details, making the content vibrant and easy to understand.


10 slides
Step-by-Step Customer Lifecycle
Clearly outline each phase of your customer journey with the Step-by-Step Customer Lifecycle Presentation. This slide template features a circular flow layout with five distinct stages, making it ideal for showcasing onboarding, engagement, retention, and loyalty strategies. Customize the icons, titles, and descriptions to match your brand message. Fully editable in PowerPoint, Keynote, and Google Slides.


6 slides
Professional Meeting Agenda Presentation
Plan your meetings with clarity and structure using the Professional Meeting Agenda Presentation. This clean, 5-step layout visually organizes agenda items alongside bold numbers and relevant icons to guide discussion. Perfect for team syncs, business reviews, or project briefings. Fully customizable in PowerPoint, Keynote, and Google Slides.


6 slides
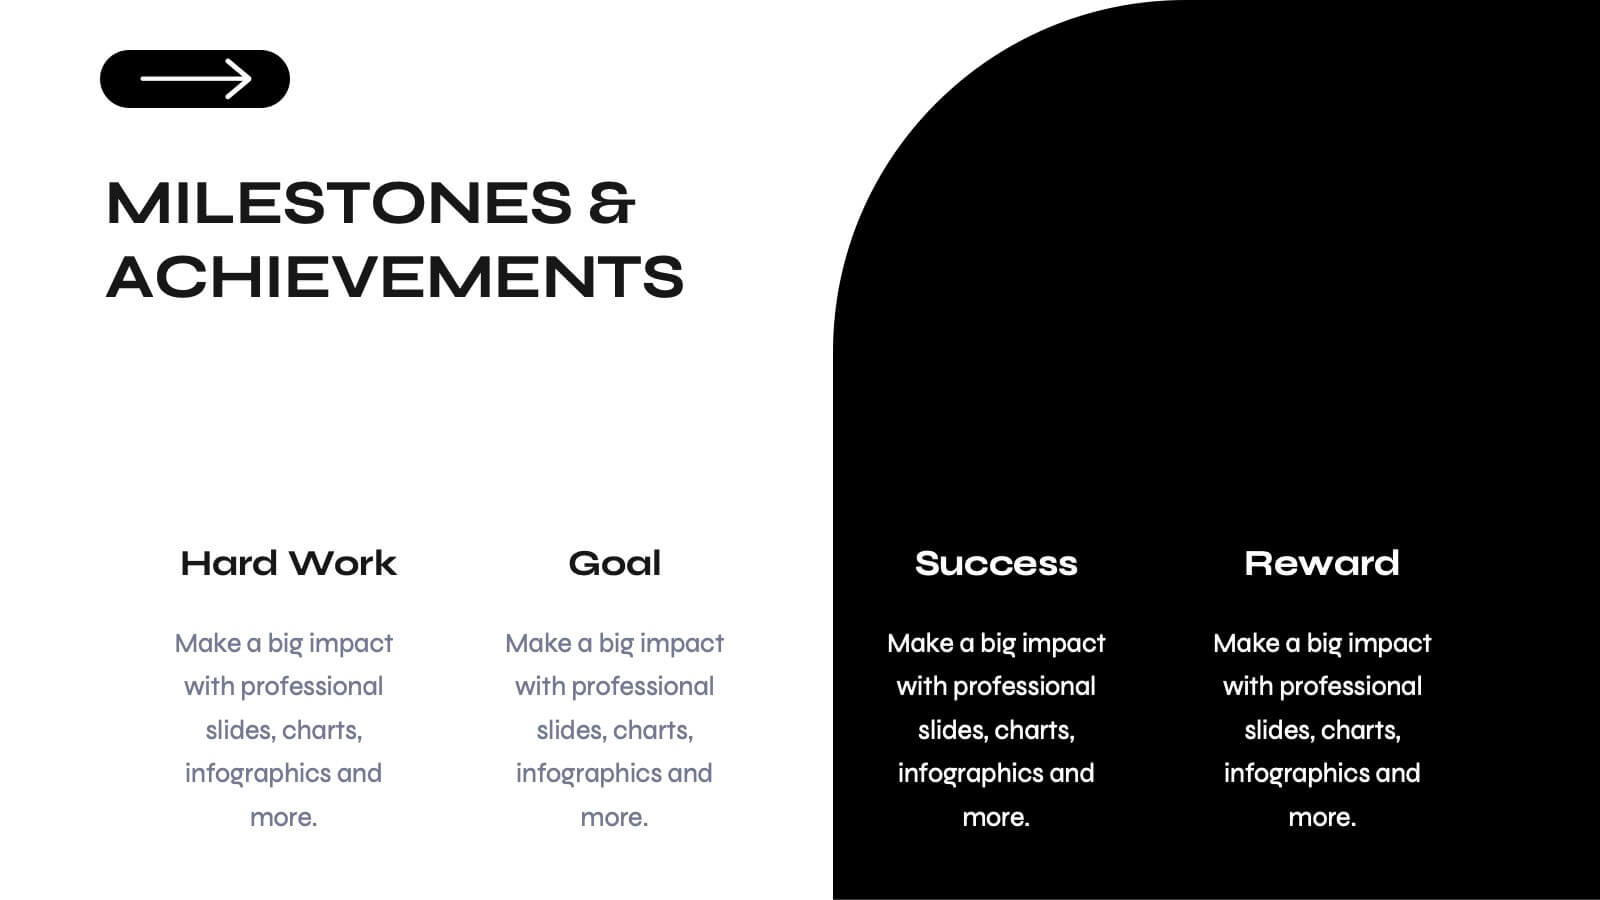
Mission Goals Infographic
These professionally designed slide templates are tailored to help you articulate your organization's mission goals with clarity and impact. Each slide is structured to emphasize the strategic objectives that guide your operations, making them ideal for communicating with stakeholders, teams, and external partners. Featuring a variety of layouts that include real-life imagery and concise text areas, these templates not only convey your goals but also illustrate the values that underpin your mission. They are perfect for enhancing corporate presentations, annual meetings, or internal strategy discussions, providing a visual and textual guide to what drives your organization forward. Customizable for various communication needs, these templates can be adapted to highlight specific mission goals or to align with different thematic elements of your presentations. They are an essential tool for organizations aiming to foster a unified understanding of their mission and to inspire alignment and action among all stakeholders.


5 slides
African Continent Map Slide Presentation
Visualize your data across Africa with a modern, easy-to-read map design that highlights regional trends and insights. Perfect for showcasing demographics, market distribution, or project reach, this template combines clarity and impact. Fully compatible with PowerPoint, Keynote, and Google Slides for smooth customization and presentation flexibility.


12 slides
Corporate Hierarchy Structure Presentation
Showcase your Corporate Hierarchy Structure with a sleek and professional design. This template helps visualize organizational roles, reporting relationships, and team structures for clear communication. Perfect for HR teams, business leaders, and project managers, it’s fully customizable and compatible with PowerPoint, Keynote, and Google Slides for easy editing.


26 slides
Carson Presentation Template
If you want a futuristic and bold design, this is the presentation template for you. The colors are bold and captivating to the eye. The font goes with technology and security. We designed the template to provide a magnificent structure for information. It's easy to use, resulting in high quality presentations. Since the colors are editable, you can personalize this presentation by adding colors that tie directly back to your company and its image. This template can be used for both personal use as well as professional use. Enhance your details with our Carson template for your next project.


8 slides
Product Showcase on Devices Presentation
Present your features in a sleek, mobile-first layout with the Product Showcase on Devices Presentation. This vertical slide design mimics a smartphone screen, making it ideal for displaying app features, service tiers, or digital tool highlights. Each section is clearly segmented, perfect for comparisons or step-by-step product walkthroughs. Fully editable in PowerPoint, Keynote, Canva, and Google Slides.


7 slides
Cloud Architecture Infographic
Cloud technology is reshaping the digital landscape, and understanding its architecture is paramount. Dive into the intricacies of cloud systems with our cloud architecture infographic, crafted in a crisp white and serene blue palette. This visual tool demystifies the layers and components that constitute cloud frameworks. IT professionals, enterprise architects, and business decision-makers will greatly benefit from this structured depiction. Fully tailored for a smooth experience on PowerPoint, Keynote, and Google Slides, this infographic serves as a cornerstone for all looking to harness the potentials of cloud infrastructure.