


Features
- 4 Unique slides
- Fully editable and easy to edit in Microsoft Powerpoint, Keynote and Google Slides
- 16:9 widescreen layout
- Clean and professional designs
- Export to JPG, PDF or send by email


Do you have any questions?
Recommend


21 slides
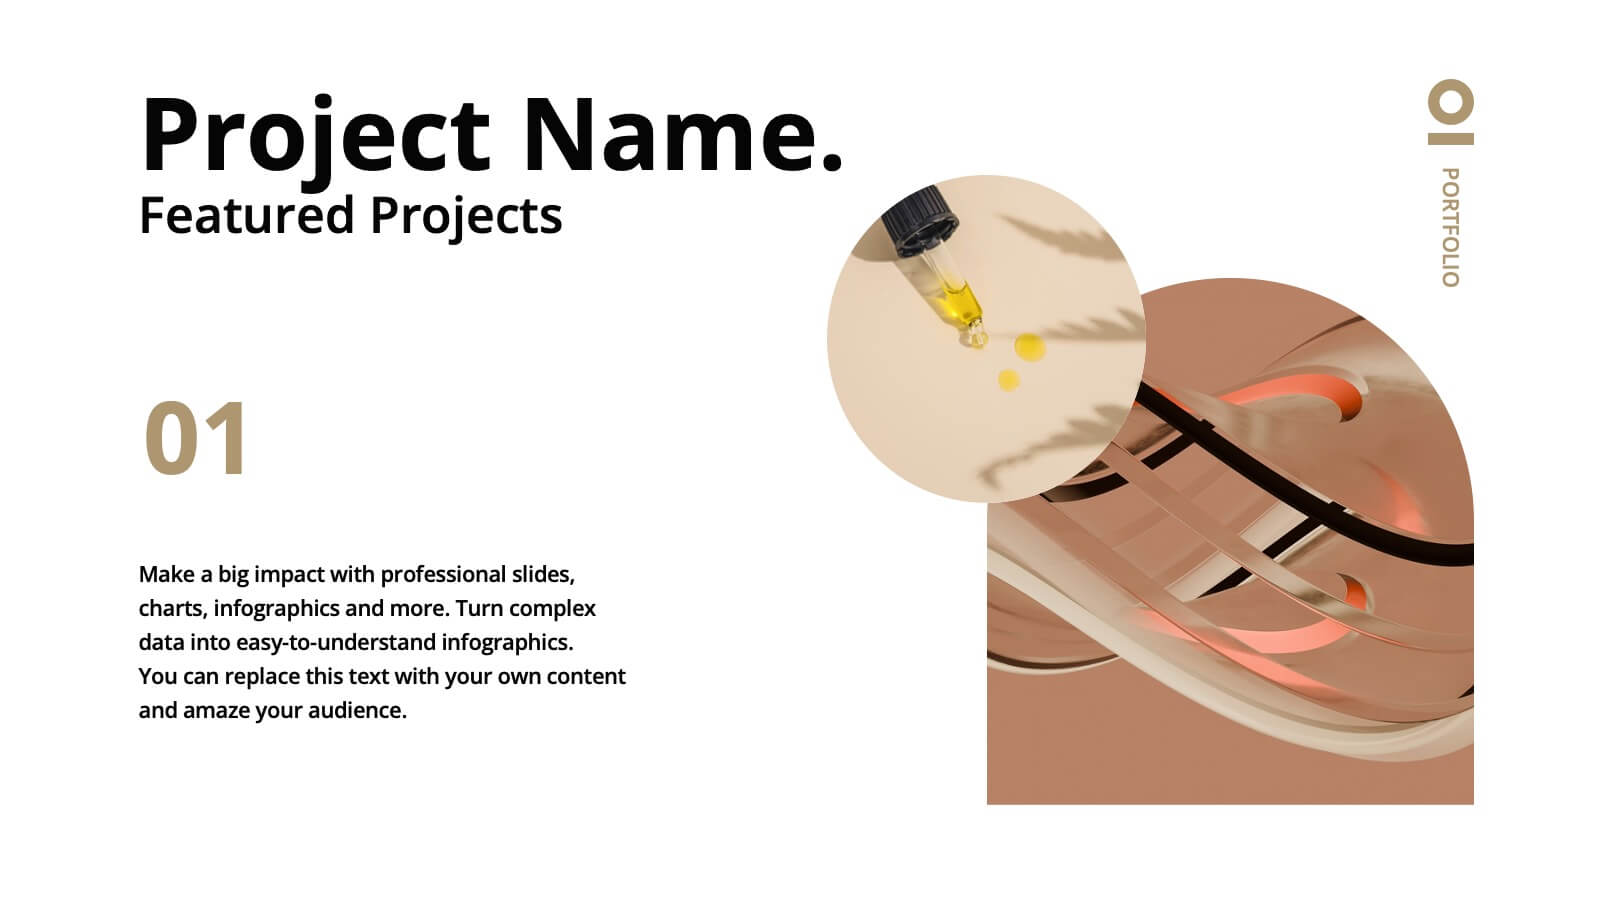
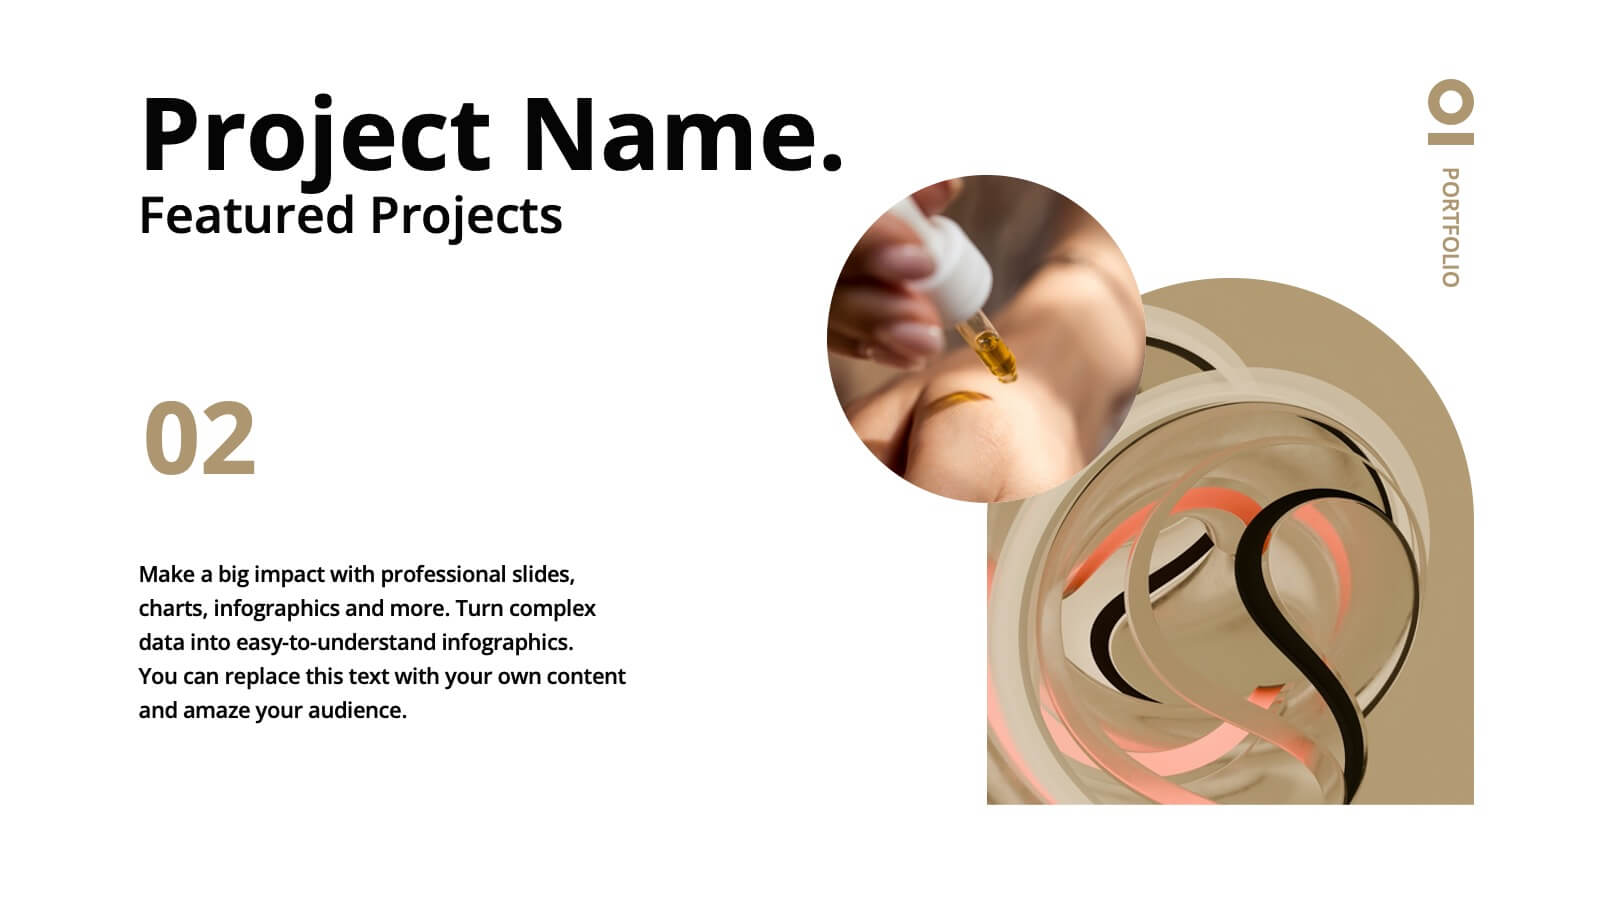
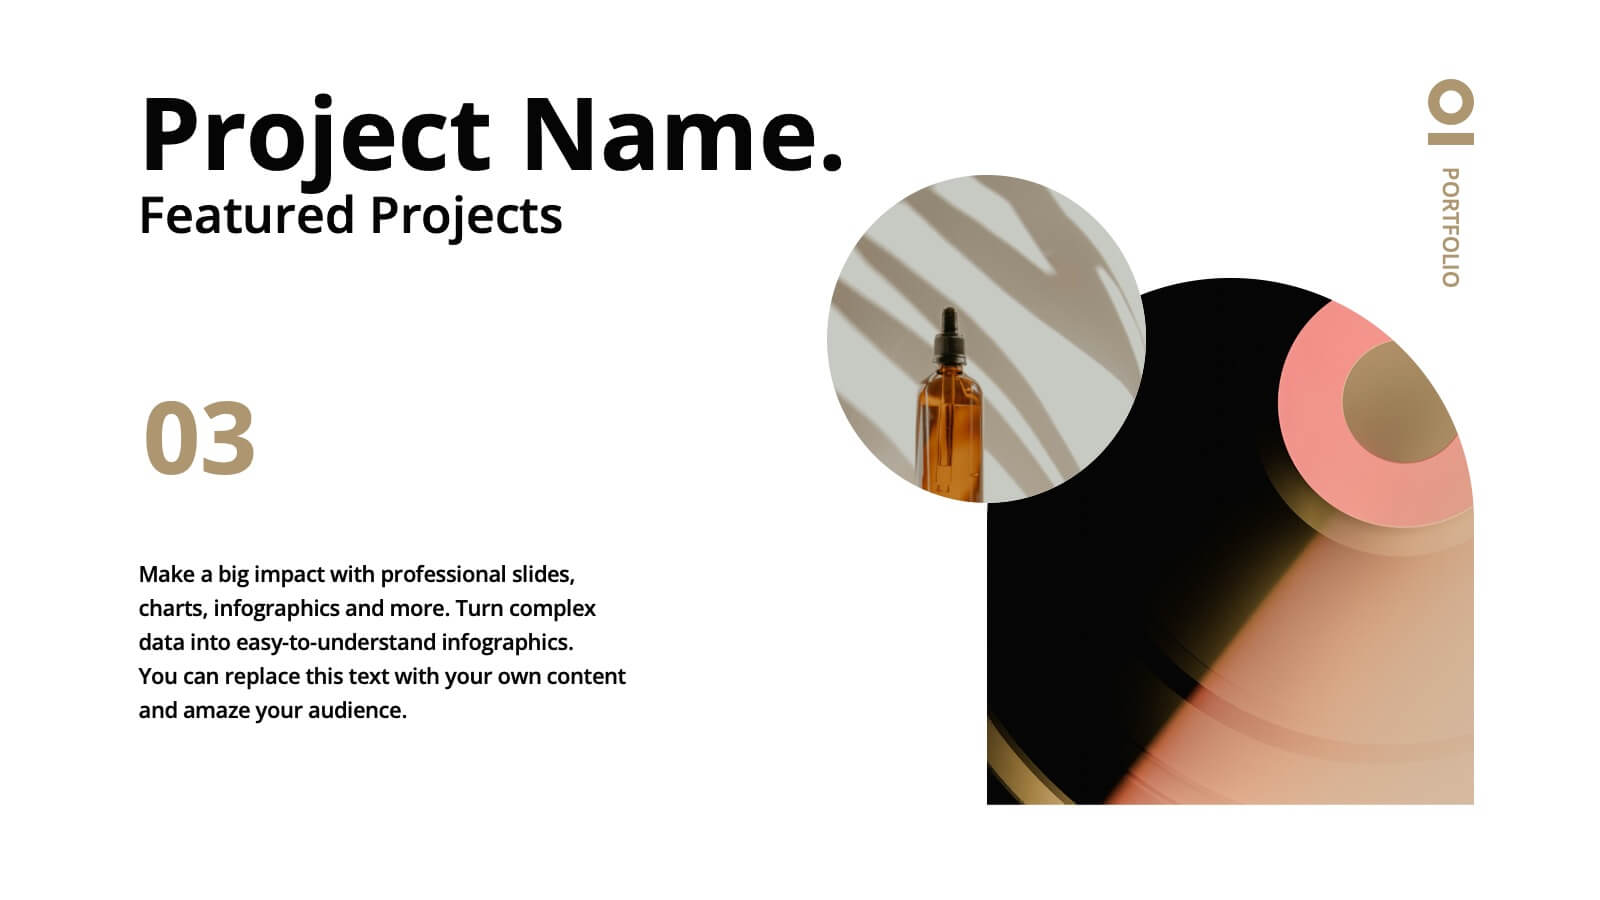
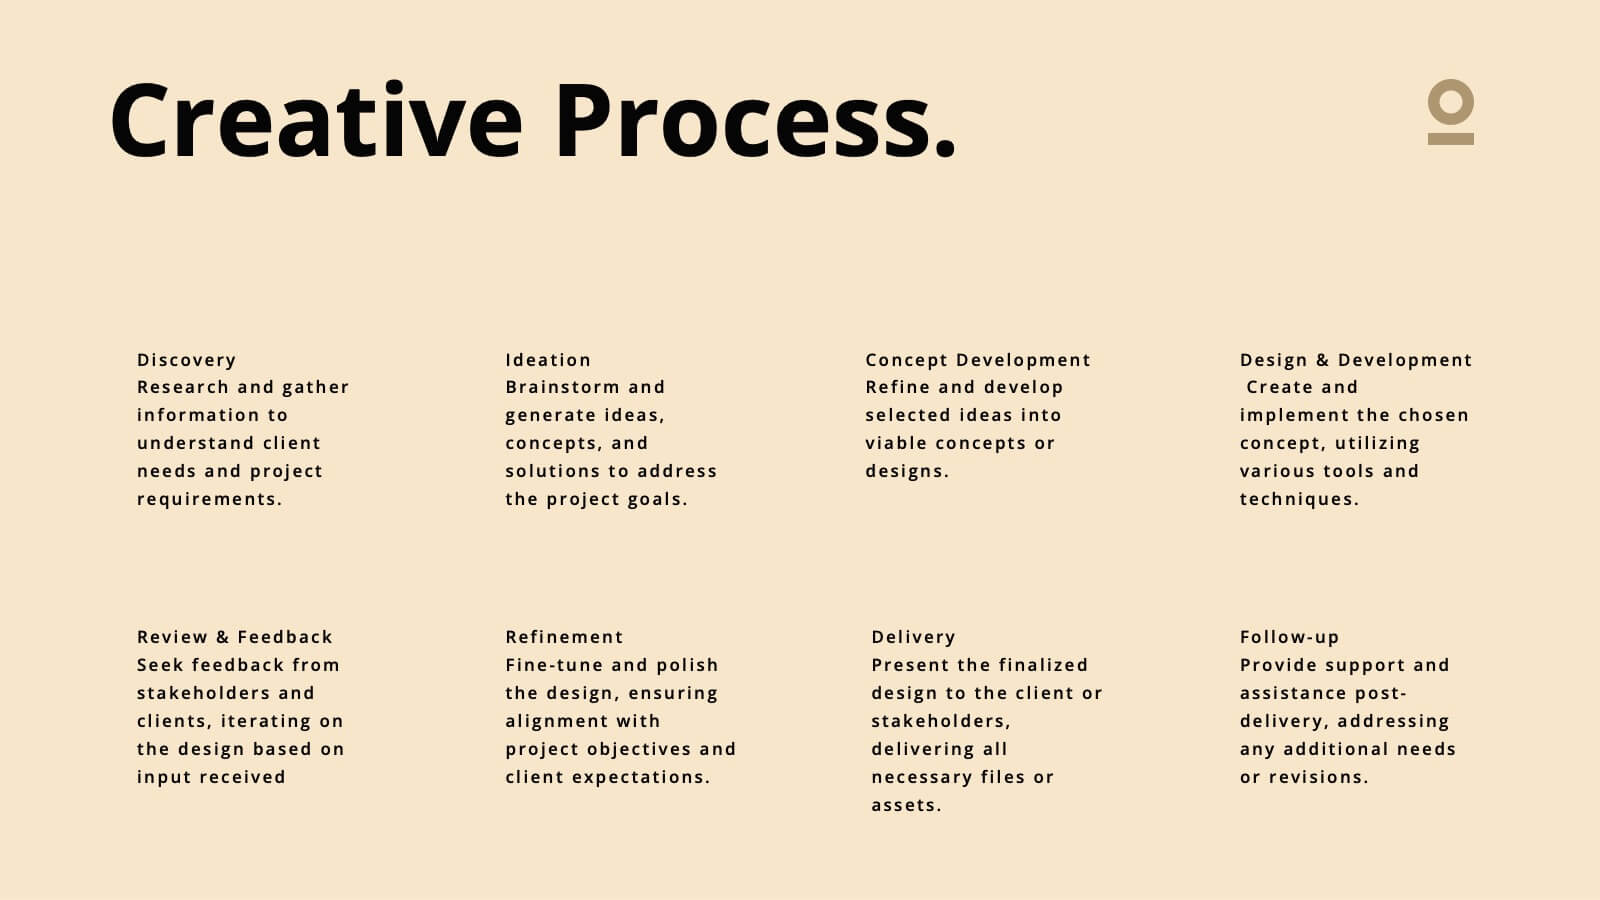
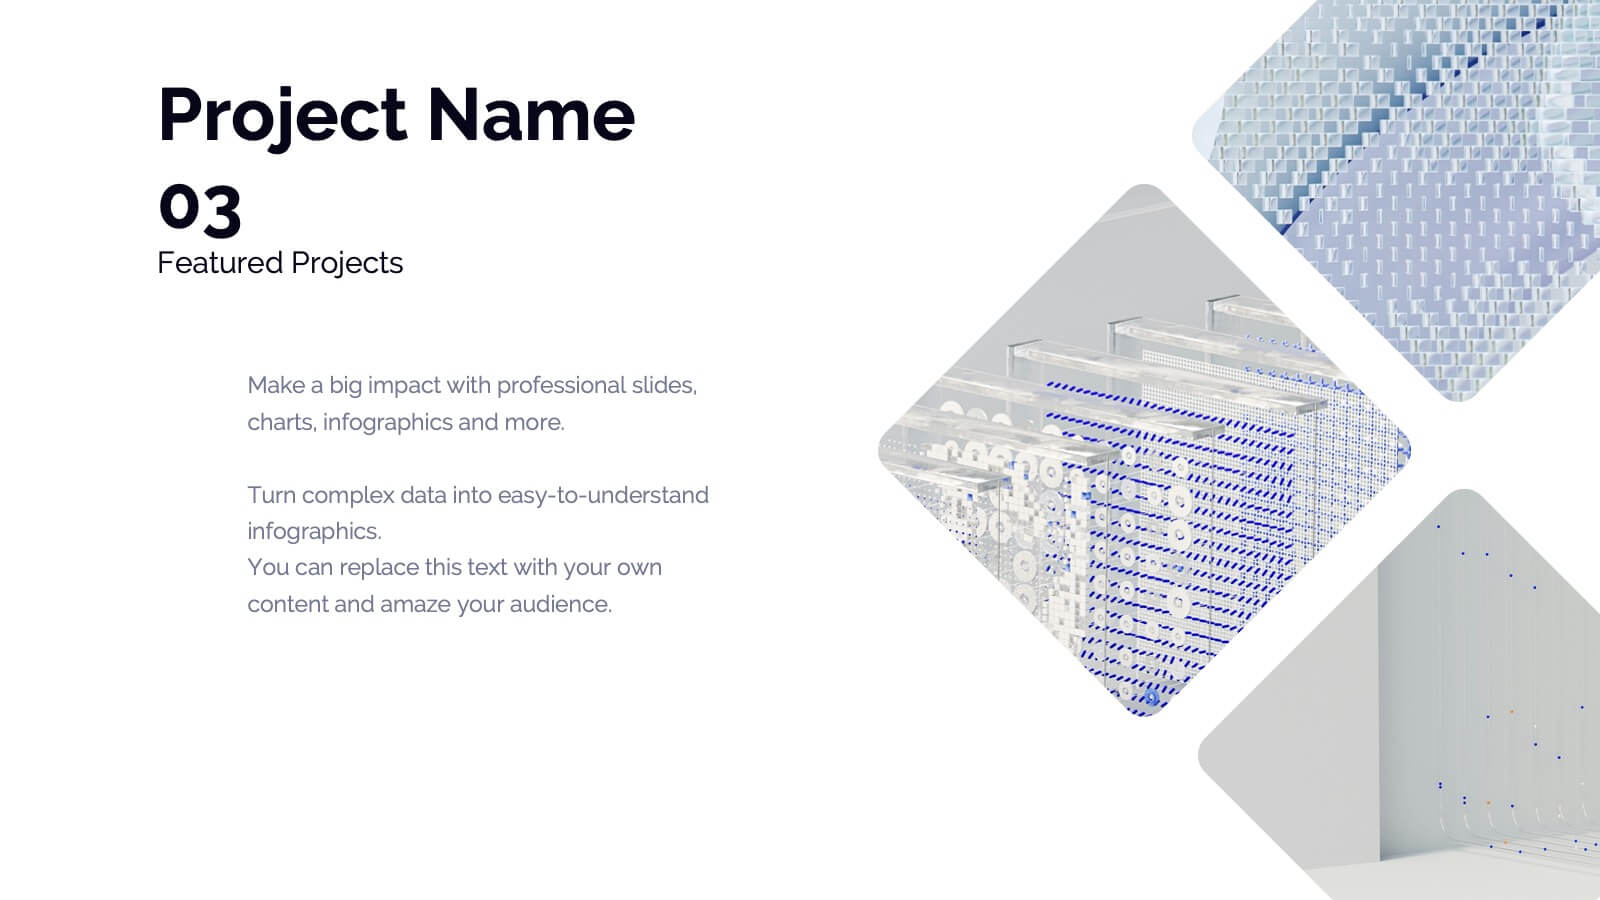
Haze Professional Portfolio Showcase Presentation
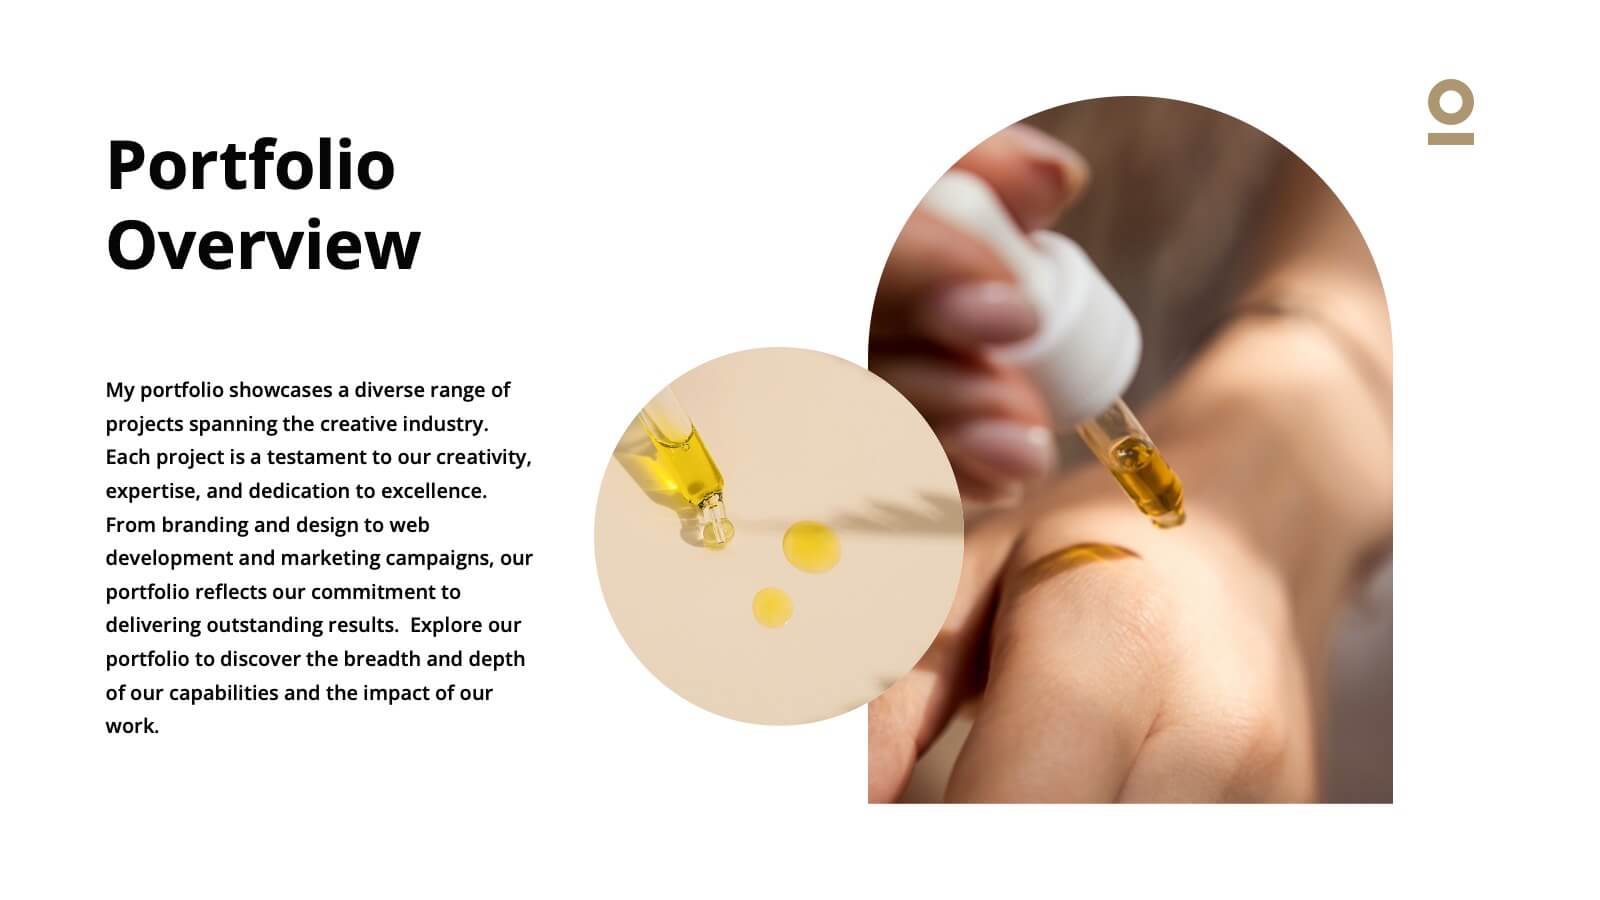
Elevate your professional presence with this stunning haze-inspired presentation template! Ideal for showcasing your portfolio, it beautifully highlights your skills, projects, and achievements with a clean and sophisticated design. This template ensures your work stands out, captivating potential clients and employers. Compatible with PowerPoint, Keynote, and Google Slides.


26 slides
Dayne Presentation Template
This beautiful and professional Wedding Cake Template Dayne is the perfect template to boost your business with impressive wedding cake portfolio. Dayne is a great template for showing off bakers, who are sharing about wedding cakes. It also can be used for other themes, as well as personal or business. The color scheme works well with this theme. Pictures and charts are also made for easy editing as well as easy readability. The design is clean and professional looking, so clients feel comfortable and excited about their upcoming events or products. Look no further this is the one for you!


7 slides
Property Market Forecast and Trends Presentation
Present your real estate insights clearly with this Property Market Forecast and Trends Presentation. Featuring a central isometric house graphic surrounded by six editable segments, this layout is perfect for highlighting key indicators like market trends, pricing shifts, and investment zones. Use the icons and color-coded areas to enhance clarity. Ideal for housing reports and investor decks. Fully compatible with PowerPoint, Canva, Keynote, and Google Slides.


6 slides
Risk Management in Insurance Presentation
Ensure Stability and Security with this Risk Management in Insurance Presentation template. Featuring a shield-themed layout, this slide effectively communicates key risk assessment strategies, mitigation plans, and compliance measures in the insurance sector. Ideal for insurance professionals, financial risk analysts, and compliance teams, this fully editable template is compatible with PowerPoint, Keynote, and Google Slides, allowing you to tailor the content to your specific risk management needs.


5 slides
Social Myths & Facts Infographics
A Social Myth might be a certain belief, while a Social Fact would be the correct answer with data. This engaging and informative Infographics template is designed to help you dispel common misconceptions and provide accurate information on various social topics. With this template you can cover stereotypes, challenge myths, or present facts to promote understanding and awareness. The template features a modern design with vibrant colors and captivating visuals, making it visually appealing and easy to navigate. It includes a variety of design elements such as icons, illustrations and timelines that can all be customized.


5 slides
Business Future Vision Strategy Presentation
Visualize the roadmap to your company’s future with this engaging Business Future Vision Strategy slide. The stacked cylinder infographic helps you layer key initiatives, goals, or timelines in a clean and structured format. With five editable tiers and corresponding text areas, this layout is perfect for showcasing development phases, innovation strategies, or long-term planning. Ideal for strategic meetings, business proposals, or future-focused pitches. Compatible with PowerPoint, Keynote, and Google Slides for seamless customization.


23 slides
Dryad Photography Portfolio Template Presentation
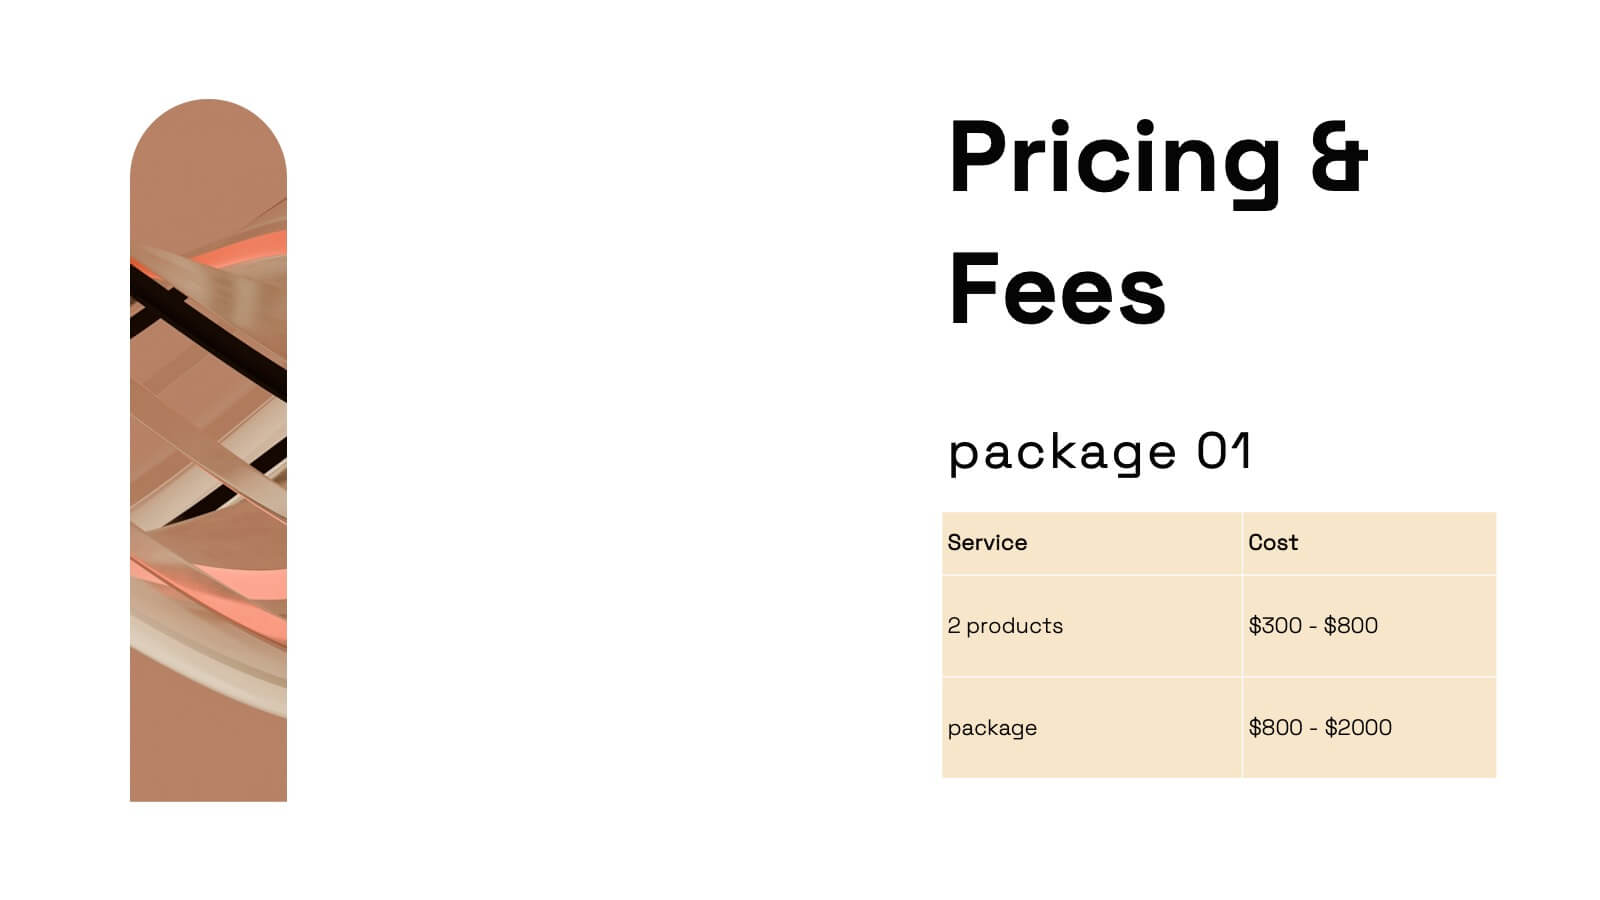
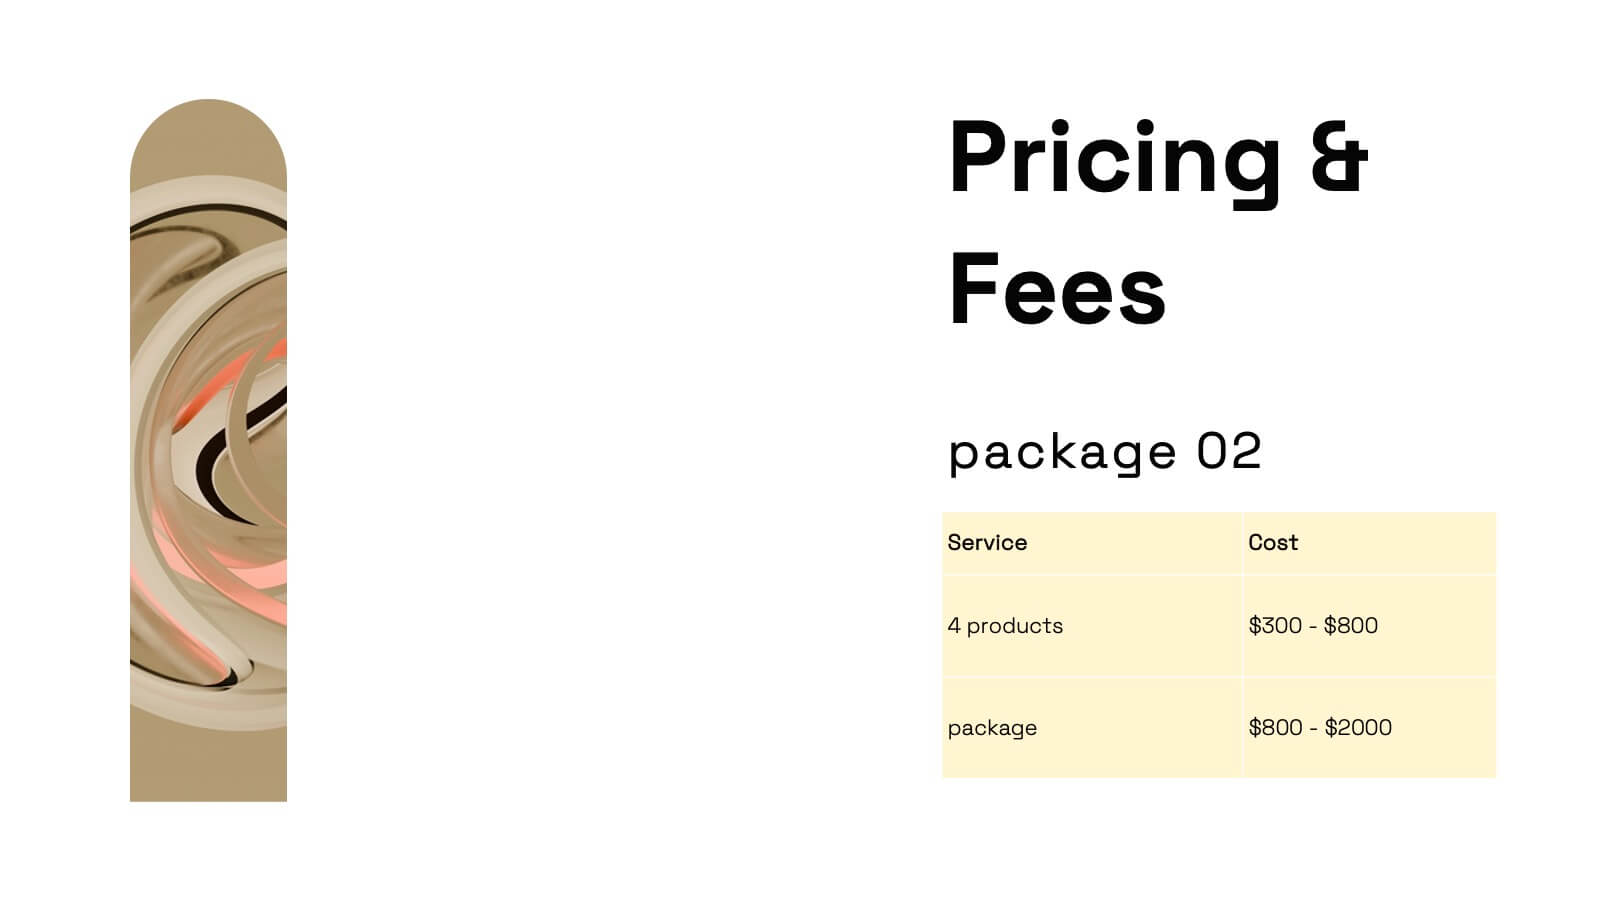
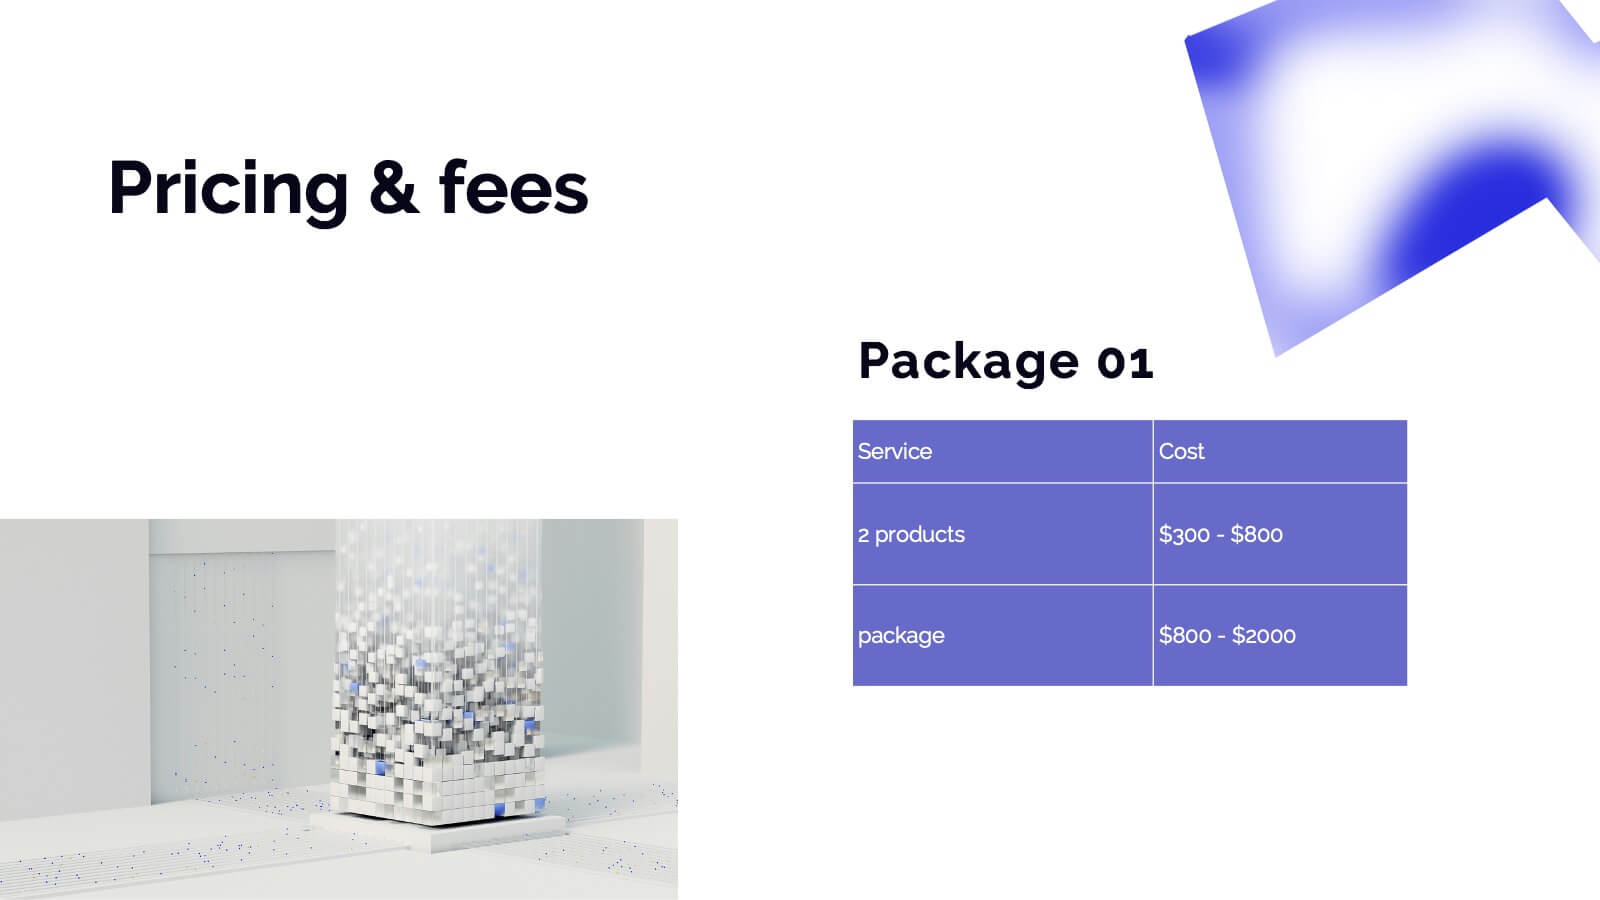
Showcase your photography skills with this elegant and professional portfolio presentation template! Perfect for highlighting your projects, style, and creative process, this template covers everything from client testimonials to pricing and services offered. It’s ideal for photographers wanting to present their work with style and clarity. Compatible with PowerPoint, Keynote, and Google Slides for effortless sharing and presentations.


20 slides
Momentum Business Proposal Presentation
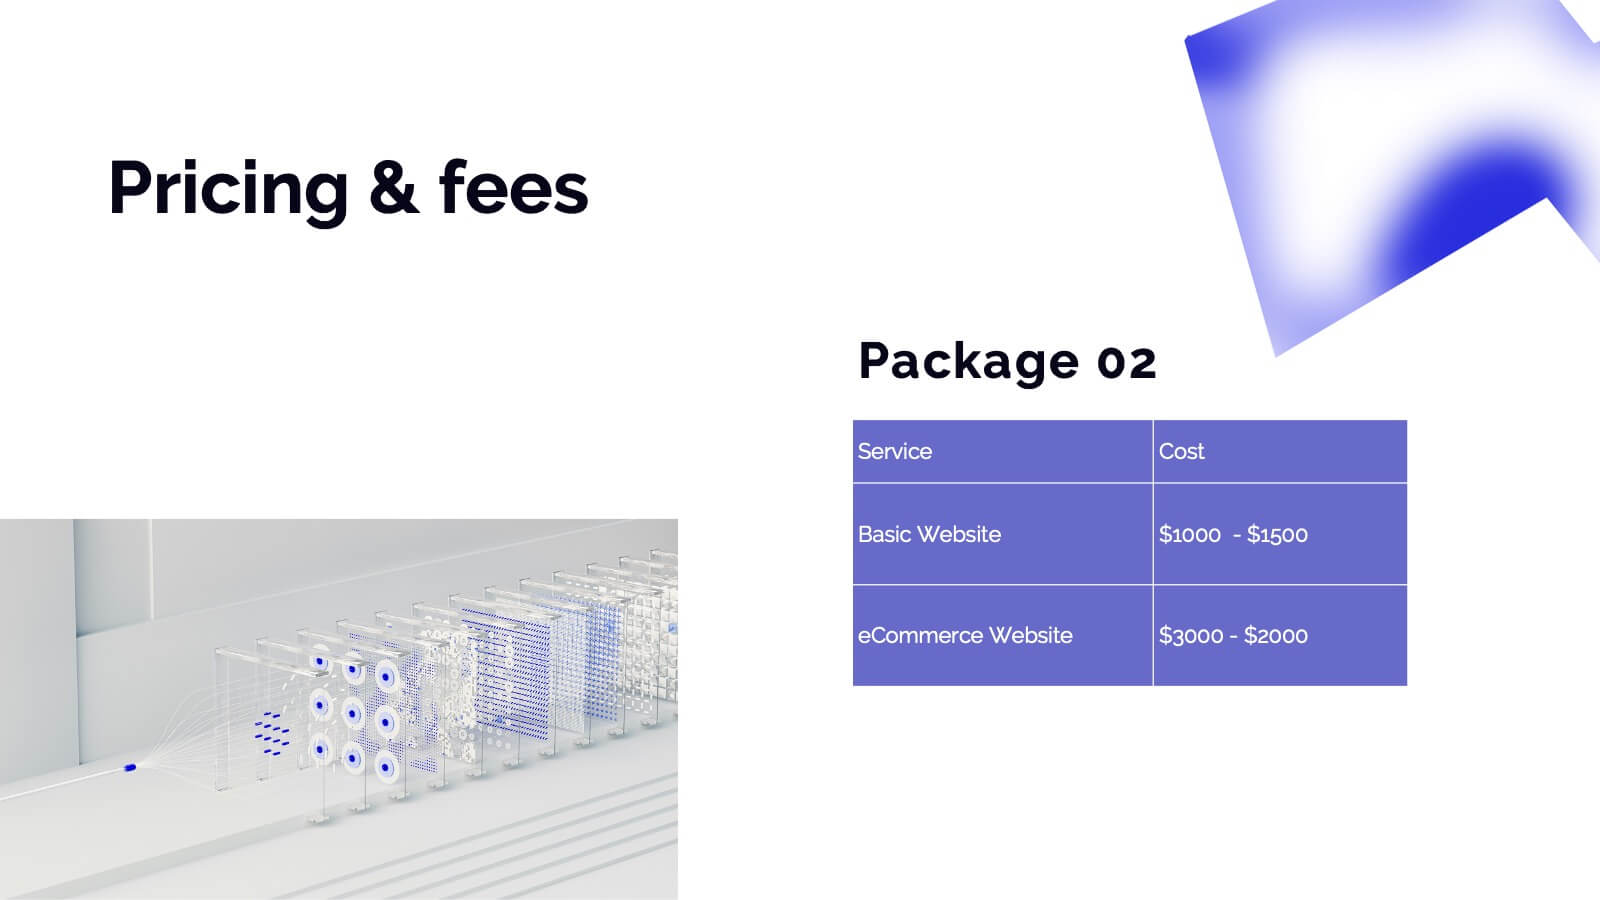
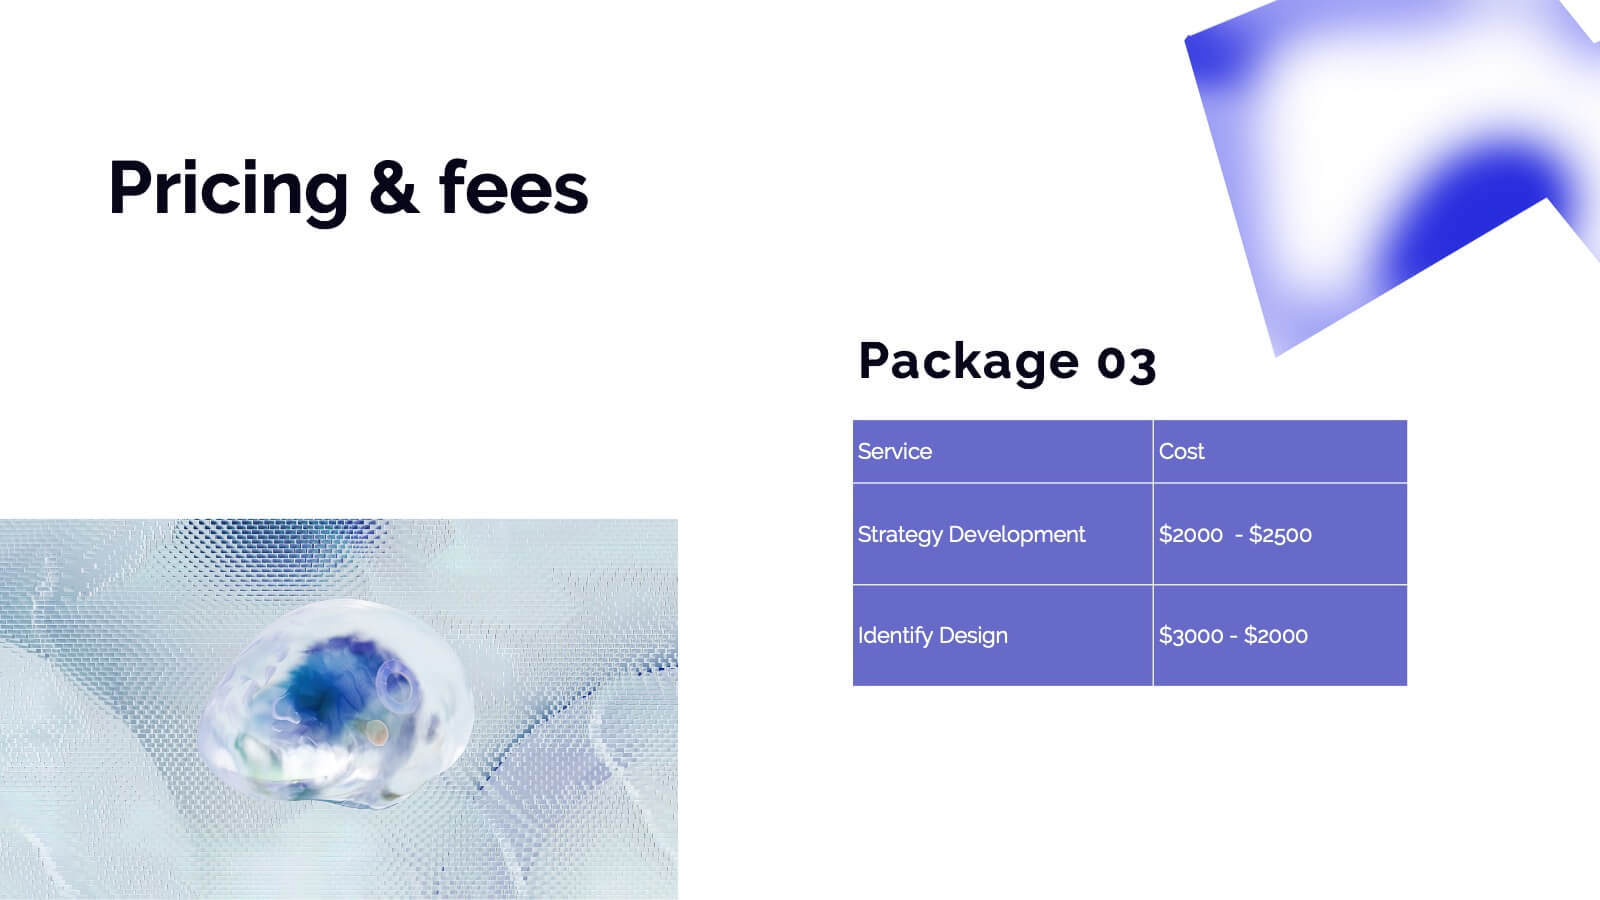
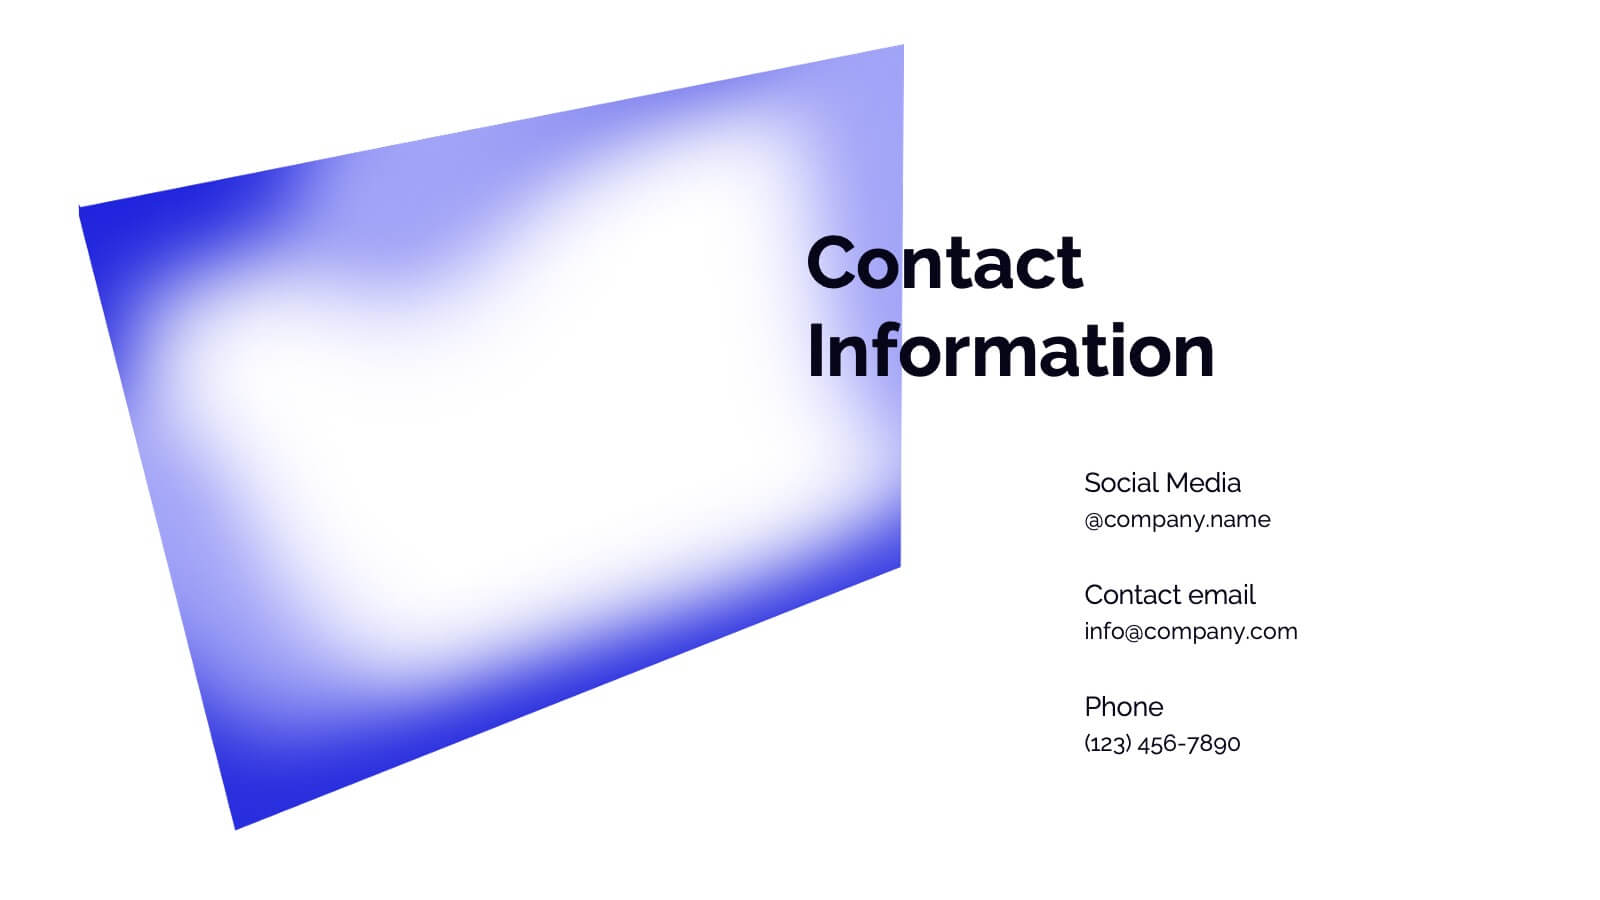
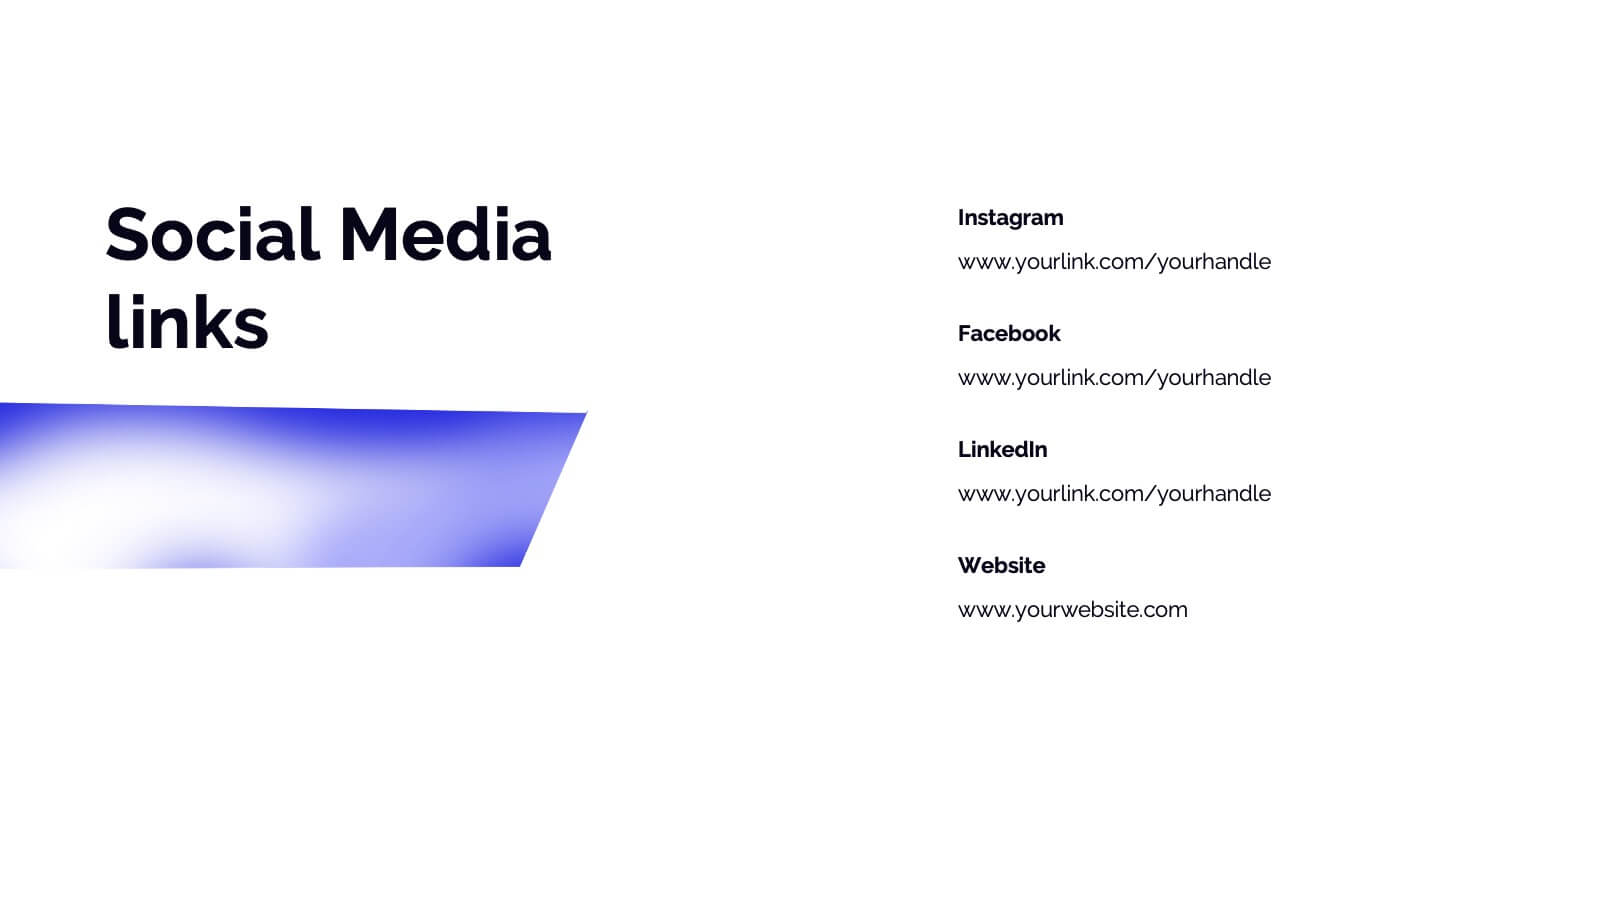
Elevate your business proposals with this vibrant, dynamic template designed to impress and persuade. Featuring a sleek design and a structured layout, this template is perfect for outlining project summaries, methodologies, and pricing structures. It's ideal for conveying professionalism and clarity. Compatible with PowerPoint, Keynote, and Google Slides, it ensures seamless presentations across all platforms.


6 slides
Airline Business Strategy and Trends Presentation
Navigate your industry insights with clarity using this sleek aviation-themed slide. Perfect for showcasing five core data points or trends, each positioned along a stylized airplane graphic. This layout is ideal for airline professionals, aerospace consultants, and logistics analysts. Fully customizable in PowerPoint, Keynote, and Google Slides.


4 slides
Step-by-Step Process Flowchart Presentation
Simplify complex workflows with this Step-by-Step Process Flowchart presentation. Designed for clarity and structure, this layout guides your audience through each phase of a process using visual arrows and color-coded stages. Ideal for operations, planning, or training. Fully editable in Canva, PowerPoint, and Google Slides.


6 slides
Business Competitive Analysis Presentation
Evaluate your market position with the Business Competitive Analysis Presentation. This structured template provides a clear side-by-side comparison of key business factors like price, quality, features, speed, and service against competitors. Ideal for strategy planning, business development, and market research, it features customizable colors, text, and layouts. Compatible with PowerPoint, Keynote, and Google Slides for seamless editing and presentation.


4 slides
Psychological Drivers in Consumer Behavior Presentation
Unlock deeper insights into buyer motivations with the Psychological Drivers in Consumer Behavior Presentation. This visually compelling template highlights four key drivers influencing decision-making, from logic to emotion. Perfect for marketing strategies, brand positioning, and behavioral research. Fully editable in Canva, PowerPoint, Google Slides, and Keynote.


26 slides
Thadd Presentation Template
Thadd presents your business in a professional light. The bold fonts and colors make for a clean, professional aesthetic that won't distract from your message. It features a strong horizontal identity that instantly communicates your brand. Charts, timelines and easy to edit text give this template an edge over the competition. It comes with easy to edit text and images, making changing content a breeze. It makes for a great business tool for companies who want to get their message across without wasting time on graphics and design. Invest in your future and download this template today.


26 slides
Leadership and Management Skills Presentation
Elevate your leadership and management training with a presentation template that's as organized and efficient as it is visually appealing. The design is tailored for clarity, with a clean, contemporary layout that speaks to professionals eager to enhance their skills. Each slide is crafted with purpose, using a smart blend of graphics and space to highlight key concepts in leadership and management. This template includes a variety of slides to cover all training aspects: from the core qualities of a leader to the intricacies of team management. Graphs and charts provide a clear representation of management theories, while comparison slides help illustrate different leadership styles. Whether for a corporate training session, a workshop for budding entrepreneurs, or a classroom lecture, this set is ready for use in PowerPoint, Keynote, and Google Slides, making it a valuable tool for any leadership development program.


5 slides
Country Breakdown South America Map Presentation
Turn complex regional data into clear visual insights with this modern map layout designed for South America. Perfect for showcasing country statistics, market segmentation, or performance comparisons, this slide keeps information clean and engaging. Fully compatible with PowerPoint, Keynote, and Google Slides for easy editing and professional presentations.


5 slides
Large Scale Data Insights Presentation
A clean, modern slide that makes complex information feel surprisingly easy to explain, this layout helps you break down large-scale data in a way your audience can instantly understand. Use it to outline key insights, visualize processes, or highlight system components. Fully compatible with PowerPoint, Keynote, and Google Slides.


10 slides
North America Editable Map Presentation
Transform your regional insights into a visually striking map that highlights data points and key locations across the United States. Ideal for showcasing market reach, demographic trends, or regional performance, this design blends clarity with professionalism. Fully compatible with PowerPoint, Keynote, and Google Slides for effortless editing and use.