


Features
- 21 Unique Slides
- Fully editable and easy to edit in Microsoft Powerpoint, Keynote and Google Slides
- 16:9 widescreen layout
- Clean and professional designs
- Export to JPG, PDF or send by email


Do you have any questions?
Recommend


25 slides
Hollowfern Brand Identity Presentation
Showcase your brand's unique essence with this structured and visually appealing brand identity presentation template. Highlight key elements like brand values, logo design, color palettes, and typography, providing a cohesive foundation for your brand's image. Dive deeper into the brand tone, consumer personas, and competitive positioning to ensure clarity and alignment with your target audience. This template offers dedicated sections for market analysis, unique selling proposition, and brand guidelines, helping you communicate your strategy with professionalism. Whether you're crafting a social media presence, building a website, or refining packaging designs, this template empowers you to stay consistent and compelling. Fully compatible with PowerPoint, Google Slides, and Keynote, it's tailored for seamless customization and presentation across platforms.


5 slides
Employee and Team Performance Analysis Presentation
Visualize individual and team contributions with this clear and structured performance analysis template. Showcase key metrics, employee growth, and team achievements using easy-to-read layouts and progress indicators. Ideal for HR reports, performance reviews, and team evaluations. Fully editable in PowerPoint, Keynote, and Google Slides.


6 slides
Business Cloud Transformation Strategy Presentation
Streamline your cloud transition with this Business Cloud Transformation Strategy template. Perfect for IT leaders, cloud architects, and business executives, this slide provides a visual roadmap for migrating, integrating, and optimizing cloud solutions. With a modern, data-driven layout, it highlights key transformation phases, challenges, and benefits. Fully customizable and compatible with PowerPoint, Keynote, and Google Slides for professional presentations.


5 slides
Business Performance Dashboard Presentation
Bring your data to life with a crisp, unified view of metrics that matter. This presentation helps you track performance, compare results, and visualize progress through charts and KPIs that keep teams aligned. Clean, modern, and easy to adapt. Fully compatible with PowerPoint, Keynote, and Google Slides.


7 slides
Break-Even Model for Revenue Planning Presentation
Simplify financial planning with this break-even model presentation. Designed to visualize the transition from loss to profit, it highlights cost reduction, sales increase, and profit margins. Ideal for strategy sessions, budgeting, or forecasts. Fully editable in PowerPoint, Keynote, and Google Slides for seamless customization across business presentations.


6 slides
Real Estate Investment Portfolio Presentation
Bring your presentation to life with a clean, engaging layout that makes complex property portfolios easy to understand. This slide helps you break down key investments, showcase performance, and highlight essential insights with clarity and flow. Perfect for real estate reports or pitch decks, and fully compatible with PowerPoint, Keynote, and Google Slides.


4 slides
Sales Conversion with AIDA Stages Presentation
This modern presentation breaks down the AIDA model—Attention, Interest, Desire, and Action—using clean 3D cube visuals. Perfect for sales teams and marketers aiming to explain conversion funnels clearly. Fully customizable in Canva, making it easy to adapt to any brand or campaign strategy. Ideal for pitch decks and workshops.


6 slides
Milestone Roadmap and Deadlines Presentation
Track progress with clarity using the Milestone Roadmap and Deadlines Presentation. This curved timeline layout highlights six key stages or deliverables with color-coded markers and icons. Perfect for visualizing project phases, quarterly goals, or deadline-driven strategies. Fully editable and compatible with PowerPoint, Keynote, and Google Slides.


20 slides
Astrolight Startup Growth Plan Presentation
A modern and vibrant presentation template tailored for startups. It includes slides for business models, growth plans, competitive analysis, and financial overviews. The visually appealing layout ensures clarity and impact for stakeholders. Fully customizable and compatible with PowerPoint, Keynote, and Google Slides for seamless adaptability.


22 slides
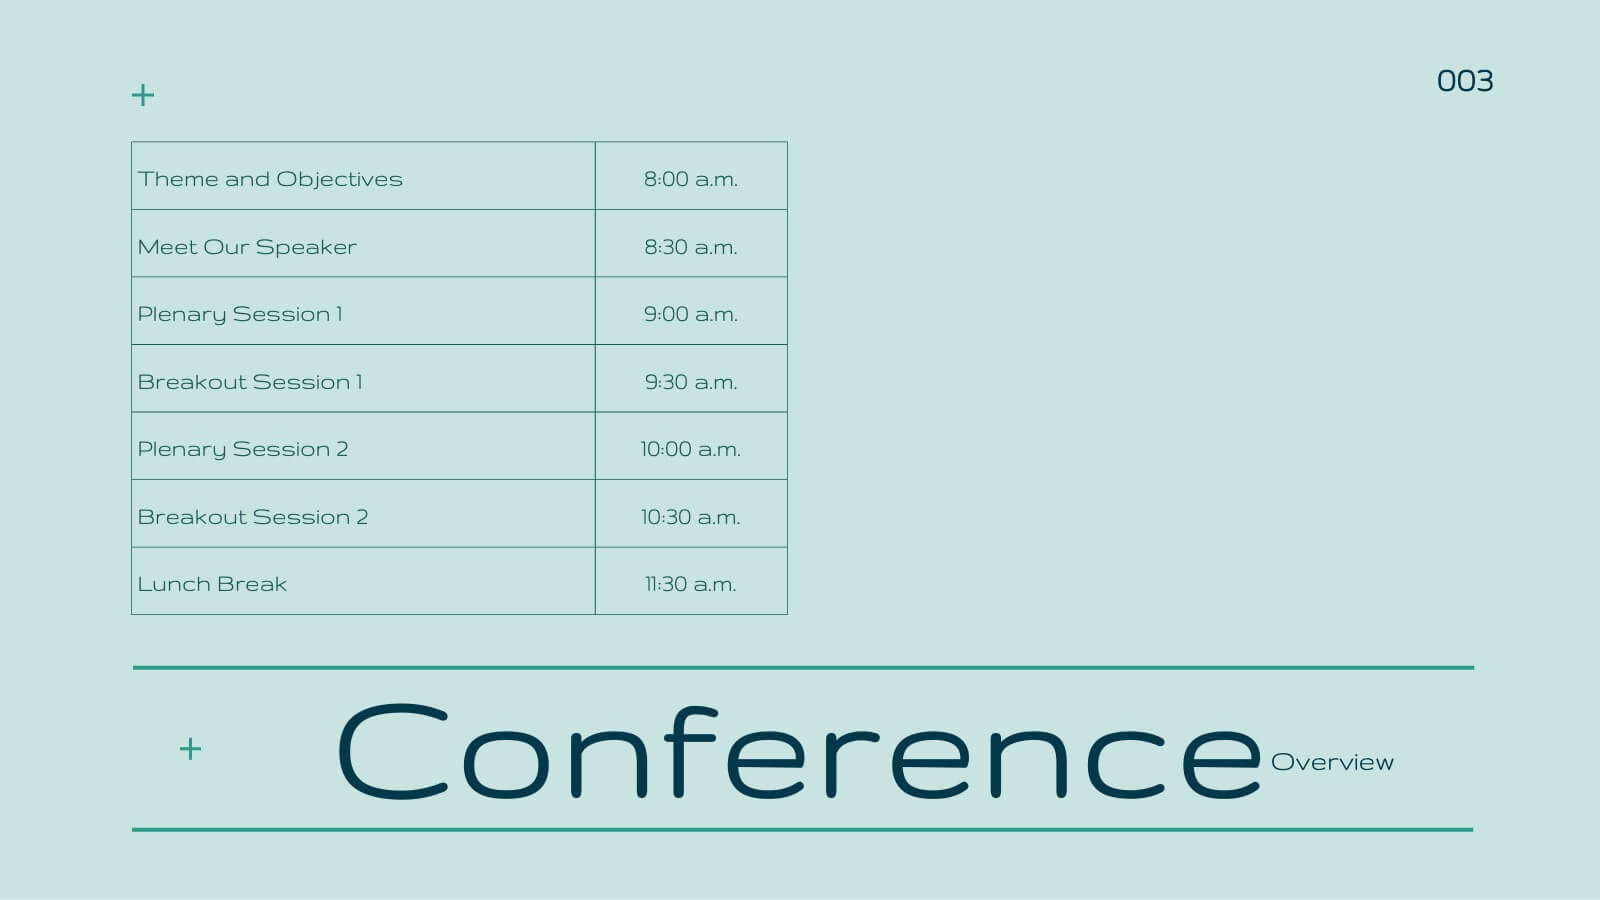
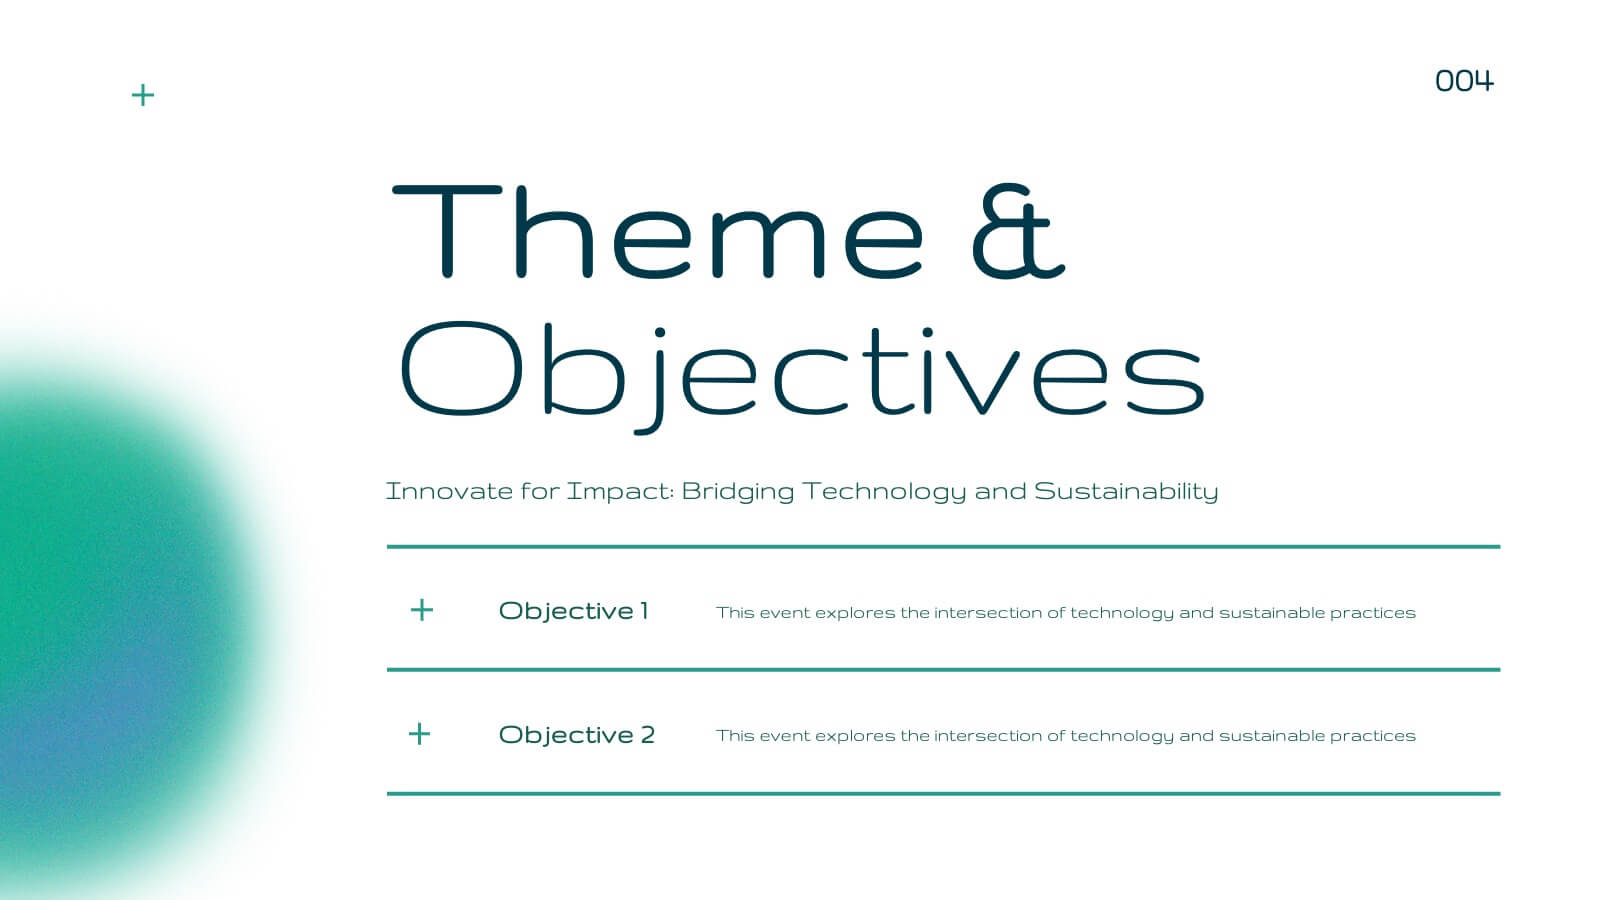
Blaze Business Operations Plan Presentation
Elevate your business presentations with this elegant, modern template designed for comprehensive business operations. Perfect for covering themes, objectives, workshops, and panel discussions, it ensures a professional and engaging delivery. The clean design and structured layout enhance clarity and impact. Compatible with PowerPoint, Keynote, and Google Slides, it’s versatile for any platform.


4 slides
HR Policies and Employee Management Presentation
Clearly outline your workplace strategies with this HR Policies and Employee Management slide. Featuring four color-coded segments alongside an illustration of employee analysis, this layout is ideal for presenting onboarding steps, employee benefits, internal policies, or training procedures. Fully editable and compatible with PowerPoint, Keynote, and Google Slides for seamless customization.
6 slides
Team Objective Tracker and Milestone Plan Presentation
Stay on top of team goals with the Team Objective Tracker and Milestone Plan Presentation. Designed for performance reviews, progress reports, or planning meetings, this template visualizes KPIs with clarity. Each slide is fully customizable in PowerPoint, Keynote, or Google Slides—ideal for project leads and department managers.


6 slides
Learning and Development Plan Presentation
Turn growth goals into action with a presentation built for clarity and impact. Perfect for HR teams, managers, or educators, it helps outline training paths, skill development, and employee progress with a clean, organized layout. Fully editable and compatible with PowerPoint, Keynote, and Google Slides for easy customization.


6 slides
Five Key Pillars of Organizational Strength Presentation
Highlight the foundational strengths of your business with the Five Key Pillars of Organizational Strength presentation. This visual framework uses classical column structures to represent five core principles, ideal for showcasing leadership values, corporate strategy, operational focus, or departmental roles. Each pillar is clearly labeled and customizable, making it easy to align with your organization’s unique message. Fully editable in PowerPoint, Keynote, and Google Slides, this template is perfect for board meetings, company culture decks, or executive planning sessions.


5 slides
Messaging Strategy and Flow Presentation
Communicate with clarity using this streamlined messaging strategy and flow presentation template. Designed to visualize the stages of message planning—from audience segmentation to final delivery—this layout helps teams align communication goals and channels. Ideal for marketing, PR, or internal comms presentations. Fully compatible with PowerPoint, Keynote, and Google Slides.


4 slides
Networking Strategy Plan Presentation
Make every connection count with this clean and modern presentation design. Perfect for outlining relationship-building strategies, collaboration methods, or communication plans, it presents ideas clearly using a structured circular layout. Fully customizable and compatible with PowerPoint, Keynote, and Google Slides for a seamless and professional presentation experience.


26 slides
Spellis Rebranding Project Plan Presentation
Revamp your brand’s identity with this sleek and strategic presentation template. Covering key aspects such as brand values, audience personas, strategy, positioning, and future development, this template ensures a comprehensive rebranding approach. Fully customizable and compatible with PowerPoint, Keynote, and Google Slides for seamless use.