


Features
- 5 Unique Slides
- Fully editable and easy to edit in Microsoft Powerpoint, Keynote and Google Slides
- 16:9 widescreen layout
- Clean and professional designs
- Export to JPG, PDF or send by email


Do you have any questions?
Recommend


6 slides
Technology Trends Overview Presentation
Step into the future with a sleek visual that maps out emerging ideas in a way anyone can follow. This presentation helps you break down key innovations, highlight major shifts, and explain how new technologies influence your strategy. Ideal for reports and trend discussions. Fully compatible with PowerPoint, Keynote, and Google Slides.


4 slides
Cybersecurity and Data Protection Presentation
Safeguard your digital assets with this Cybersecurity and Data Protection template. Designed for IT security professionals, compliance officers, and business leaders, this slide illustrates key security measures, risk mitigation strategies, and data protection protocols. Featuring a modern cloud security theme, it effectively conveys network safety, encryption, and compliance frameworks. Fully editable and compatible with PowerPoint, Keynote, and Google Slides for seamless customization.


5 slides
The Future of Food Waste Infographics
Food Waste refers to the loss or disposal of food that is still edible or could have been consumed. These infographic template are designed with the aim of raising awareness, inspiring change, and empowering individuals and organizations to take action towards a more sustainable food system. These infographics are perfect for anyone interested in understanding the future trajectory of food waste and exploring potential solutions. With these infographic templates, create a presentation that inspires action and foster a collective commitment to combating food waste for a more sustainable future.


6 slides
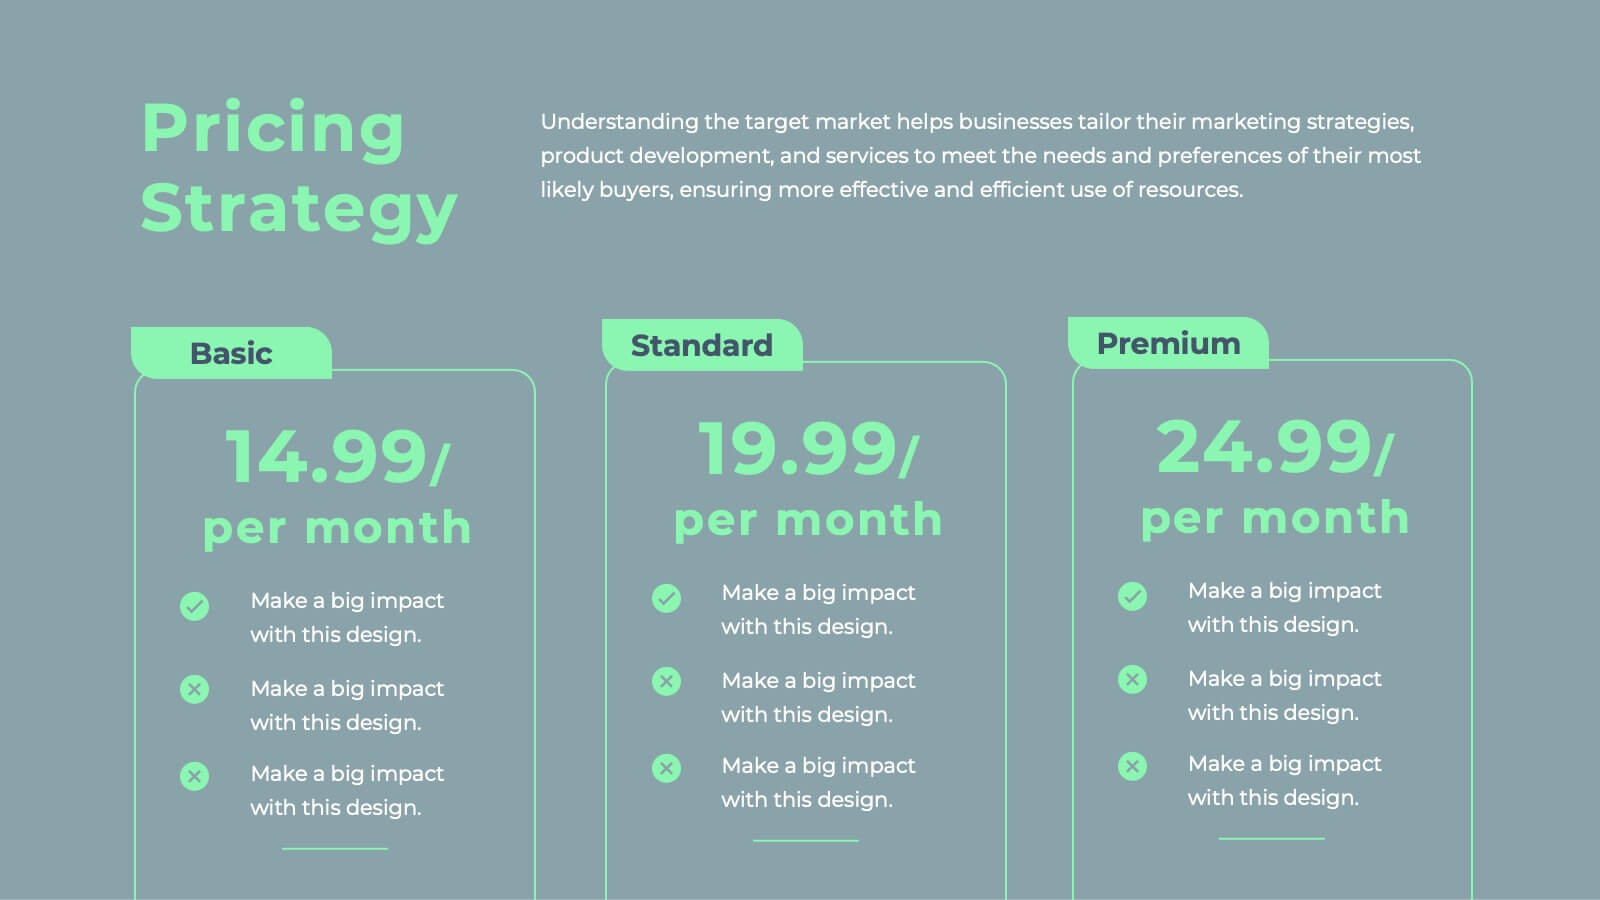
Best Pricing Tables Infographics
Maximize your product or service presentation with our Best Pricing Tables infographic template. This template is fully compatible with popular presentation software like PowerPoint, Keynote, and Google Slides, allowing you to easily customize it to showcase your pricing structures effectively. The Best Pricing Tables infographic template offers a visually appealing platform to display different pricing tiers, features, and benefits. Whether you're a business owner, marketer, or sales professional, this template provides a user-friendly canvas to create pricing tables that captivate your audience. Optimize your pricing strategy with this SEO-optimized Best Pricing Tables infographic template, thoughtfully designed for clarity and ease of use. Customize it to highlight competitive advantages, discounts, and special offers, helping you convert potential customers into loyal clients. Start crafting your personalized pricing tables today to boost your sales and revenue!


10 slides
Business Planning and Risk Assessment Presentation
Visualize risk levels and strategic priorities with this matrix-style business planning template. Ideal for mapping uncertainties against impact and likelihood, it supports clear, data-driven decisions. Fully customizable in PowerPoint, Keynote, and Google Slides—perfect for risk reports, operational planning, and stakeholder communication in corporate, finance, or project management settings.


5 slides
Supply Chain Process Infographics
Unravel the complexities of logistics with supply chain process infographics. This vibrant template, splashed with energetic shades of orange, purple, and green, is designed to streamline the convolutions of supply chain management into an easily digestible format. Ideal for business analysts and logistics professionals, these vertical infographics offer a visually engaging narrative. The template features innovative graphics, intuitive icons, and versatile image placeholders, meticulously crafted to aid in visualizing the intricate processes within supply chain dynamics. These infographics are the tool you need to bring clarity to your audience.


4 slides
Design and Project Work Samples Presentation
Showcase your creative projects with this visually structured layout. Featuring a bold title area and three image slots for key works, it’s perfect for portfolios, proposals, or pitch decks. Fully editable in PowerPoint, Keynote, and Google Slides to suit your brand and project presentation needs.


25 slides
Luminous Qualitative Research Findings Presentation
Elevate your qualitative research findings with this sleek and professional template. It covers research objectives, methodology, data collection, and key findings. Ideal for clear and compelling presentations. Fully compatible with PowerPoint, Keynote, and Google Slides for seamless integration.


7 slides
Project Stakeholder Analysis Infographic
Stakeholder analysis is a technique used in project management and organizational strategy to identify and understand the interests, influence, and impact of individuals or organizations that can significantly affect or be affected by a project or decision. This infographic template is your compass to navigating the intricate landscape of stakeholders, understanding their influence, and engaging them effectively for project success. Compatible with Powerpoint, Keynote, and Google Slides. The vibrant design and strategic insights of our template will empower you to navigate the stakeholder cosmos and steer your project towards triumph.


5 slides
Studio Photography Infographics
Studio Photography is the practice of capturing photographs in a controlled environment, typically a dedicated photography studio. These infographic templates highlight the key aspects of studio photography with examples of fashion photography, photojournalism, and photography terminology. These are designed to assist photographers, photography studios, and enthusiasts in showcasing the essential elements and techniques involved in capturing stunning images in a studio setting. Use these to provides valuable insights and techniques to help your audience create stunning images in a studio environment. Compatible with Powerpoint, Keynote, and Google Slides.


4 slides
Cause-Effect Relationships Bowtie Format Presentation
Clearly illustrate the connection between causes and outcomes with the Cause-Effect Relationships Bowtie Format Presentation. Designed to simplify complex business logic, this layout uses a symmetrical bowtie shape to contrast contributing factors with resulting effects. Ideal for strategy, operations, or risk analysis. Fully editable in Canva, PowerPoint, Google Slides, and Keynote.


26 slides
Crypto Currency Dark Presentation
Navigate the dynamic world of digital finance with our Crypto Currency presentation template, compatible with PowerPoint, Keynote, and Google Slides. This template is an invaluable tool for financial analysts, crypto enthusiasts, and educators in the realm of digital currencies. The design boasts a bold and modern aesthetic, with cryptocurrency motifs that capture the essence of this revolutionary market. With this template, you can present complex financial data and crypto concepts with clarity. Its range of slides includes comparative analyses, timeline infographics, and process diagrams, enabling a thorough exploration of the cryptocurrency landscape. The vibrant colors and creative graphics make it easy to highlight market trends, investment opportunities, and the technology behind cryptocurrencies. By using our Crypto Currency template, you'll engage and educate your audience on the nuances of blockchain and digital assets. Download it today to deliver a presentation that's as innovative and forward-thinking as the topic itself.


5 slides
Business Influence Stakeholder Analysis Presentation
Enhance your project's success with our Business Influence Stakeholder Analysis Presentation template, designed to identify and prioritize stakeholders based on their influence and impact. This template is ideal for strategic planning and ensuring all key stakeholders are considered. Compatible with PowerPoint, Keynote, and Google Slides."


4 slides
Layered Strategy Circles Presentation
Bring your strategy to life with a sleek circular layout that visually connects goals, actions, and outcomes in a unified flow. Perfect for showcasing layered processes or business frameworks, this design keeps complex ideas simple. Fully editable and compatible with PowerPoint, Keynote, and Google Slides for smooth customization.


24 slides
Fictara UX Research Report Presentation
Present your UX research findings effectively with this modern and professional template. Covering essential topics such as user personas, wireframes, usability guidelines, and feedback iteration, it’s designed to showcase insights clearly. Fully editable and compatible with PowerPoint, Keynote, and Google Slides.


6 slides
Public Health and Wellness Strategy Process
Promote holistic well-being with this visually engaging 6-step wellness infographic. Designed around a meditative figure and circular path, it’s ideal for health initiatives, public outreach, and lifestyle improvement strategies. Fully editable in PowerPoint, Keynote, and Google Slides—perfect for wellness coaches, health educators, and public health teams.


20 slides
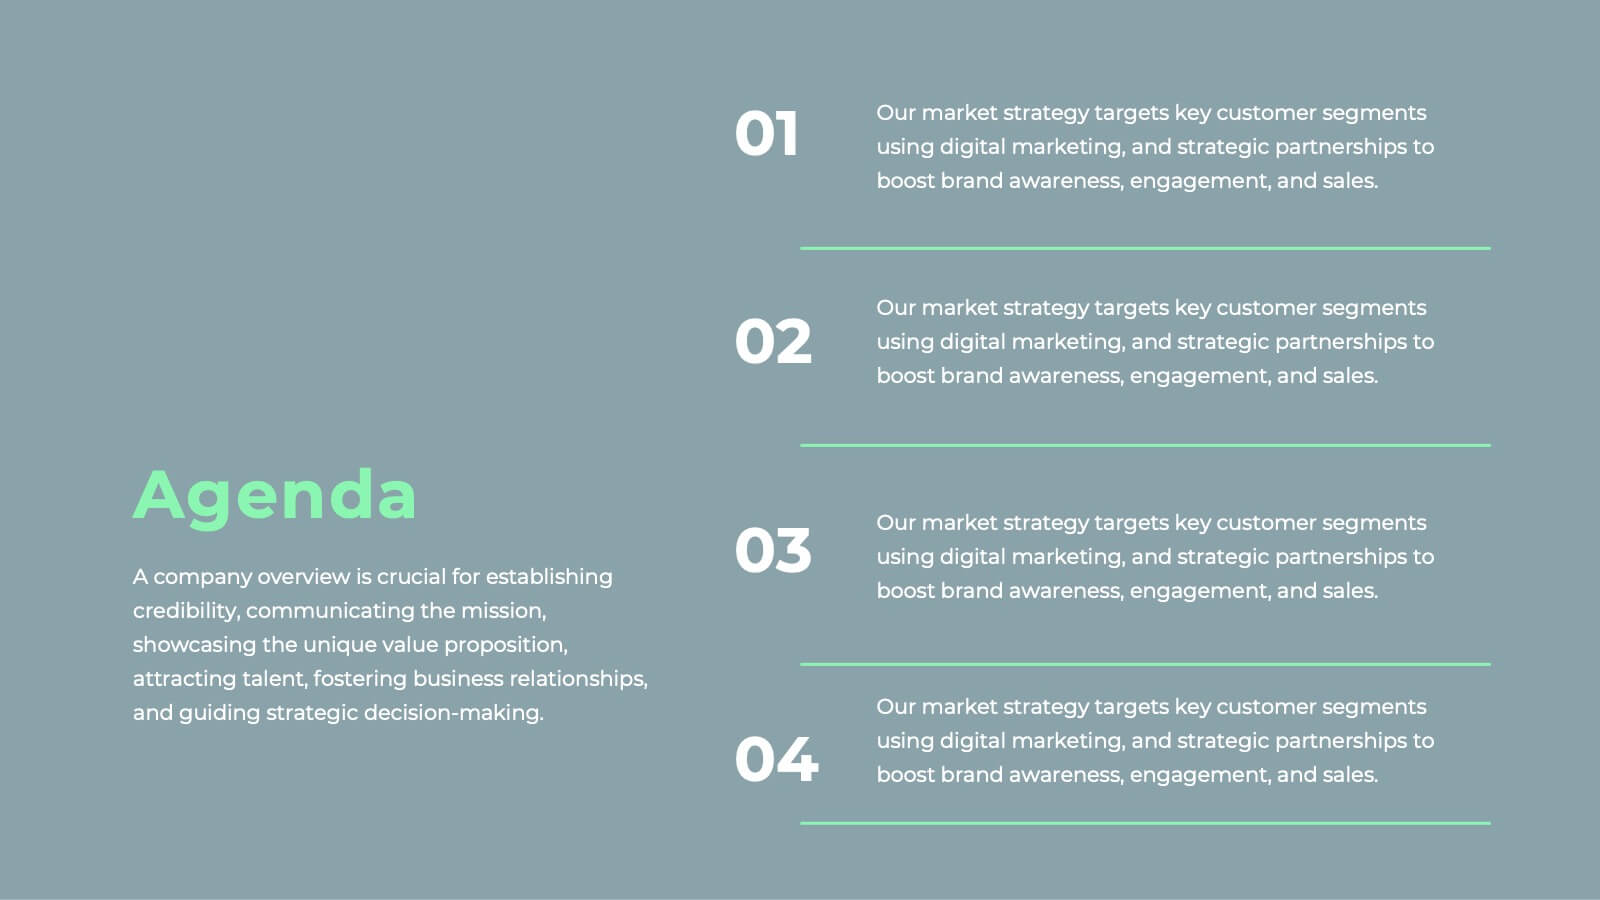
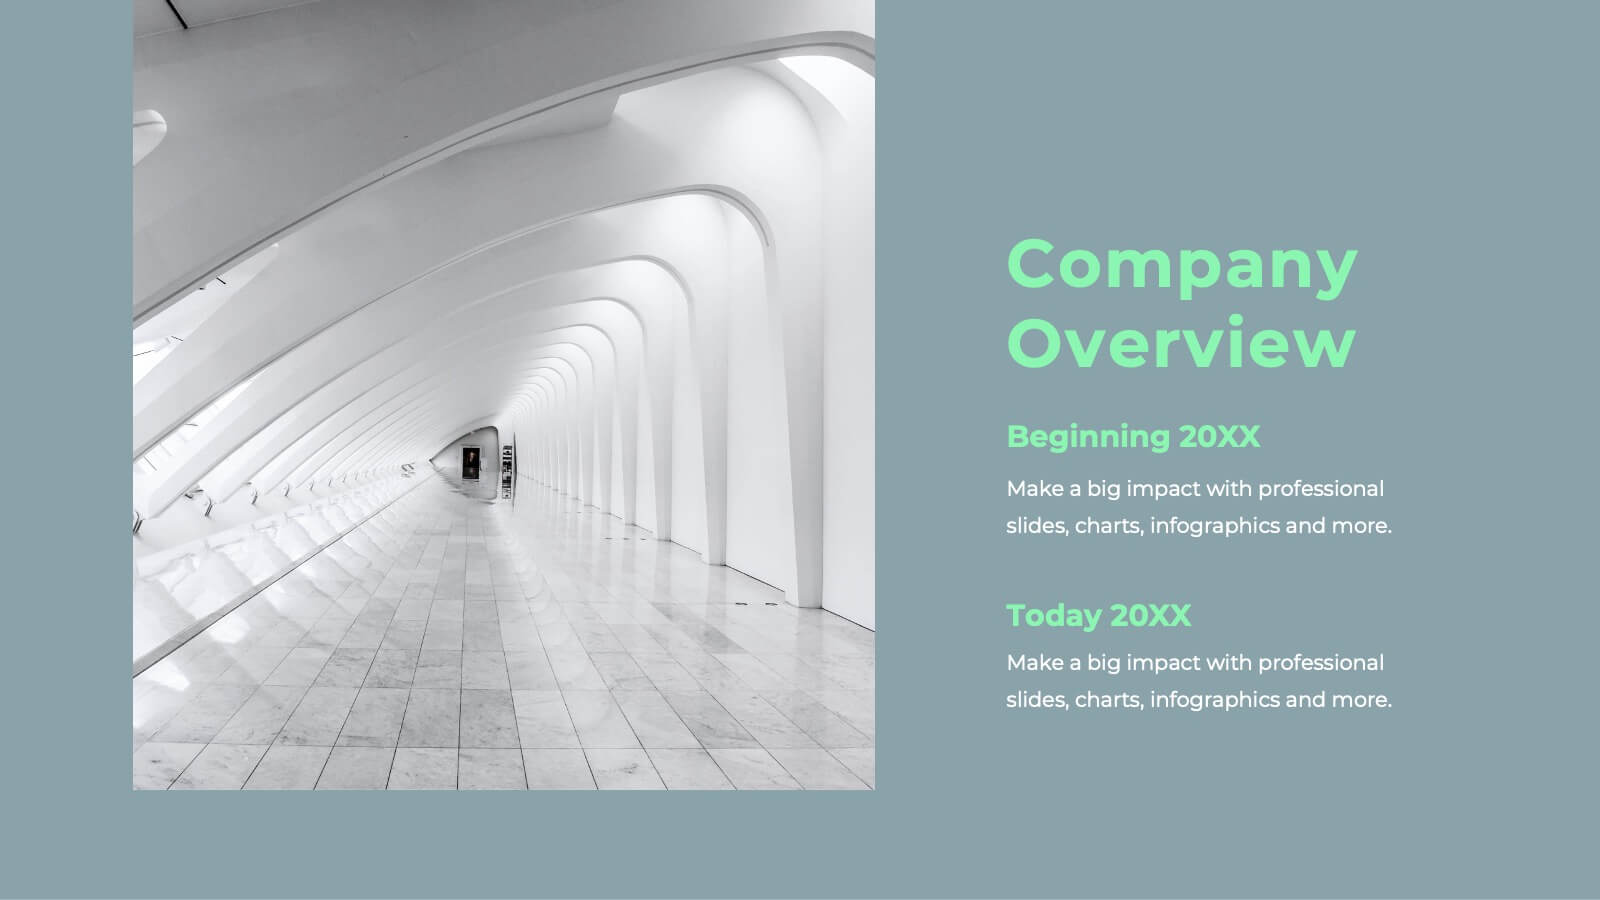
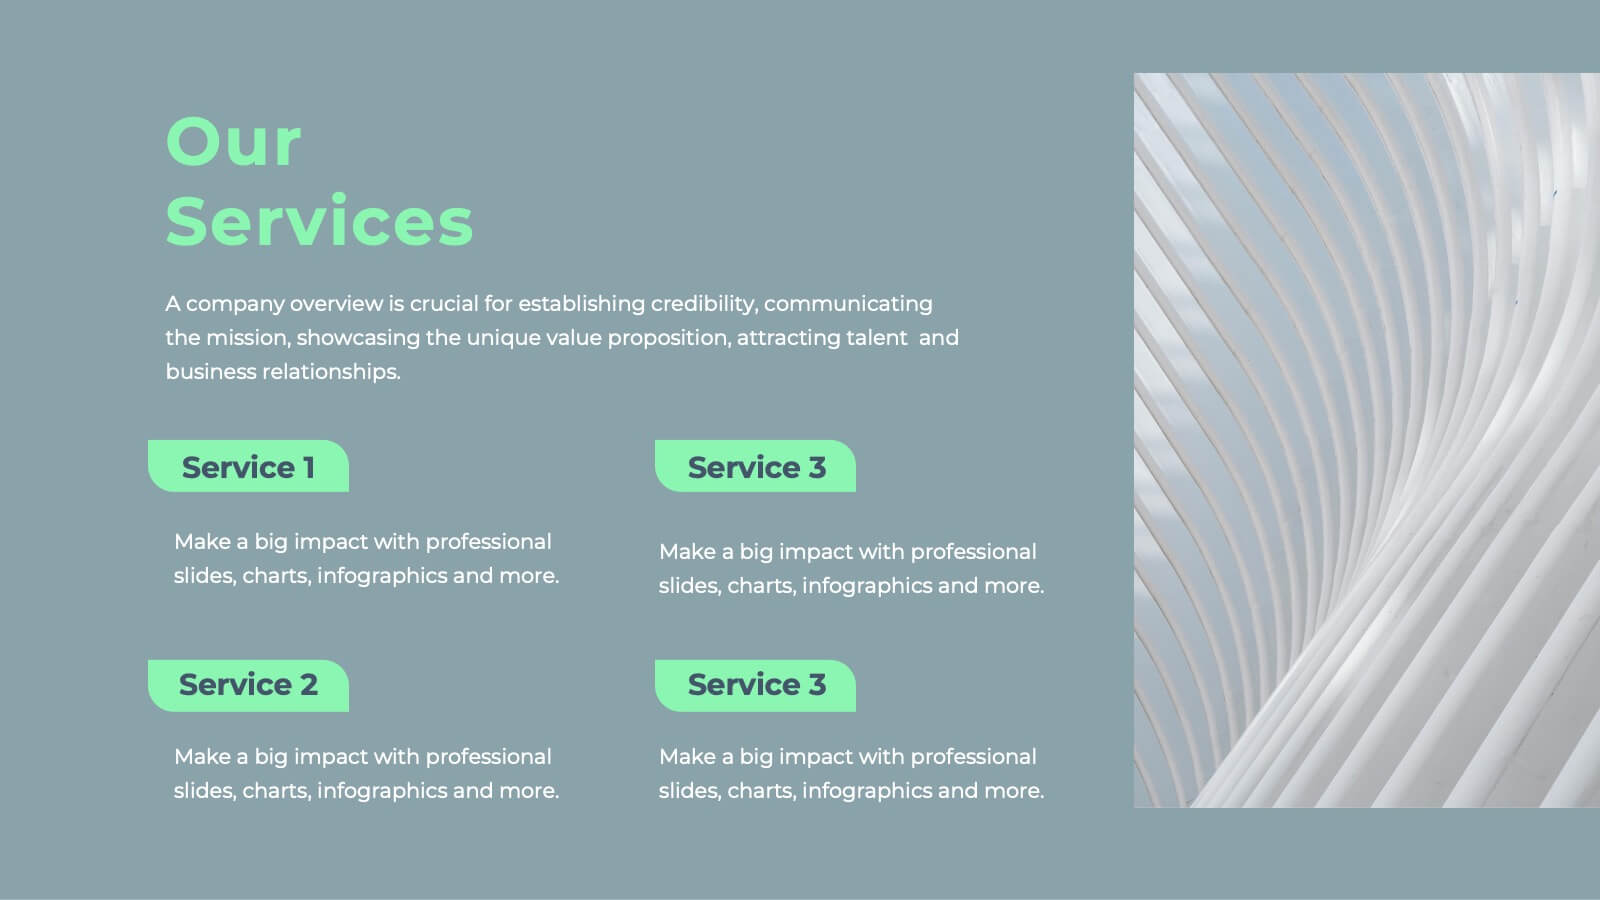
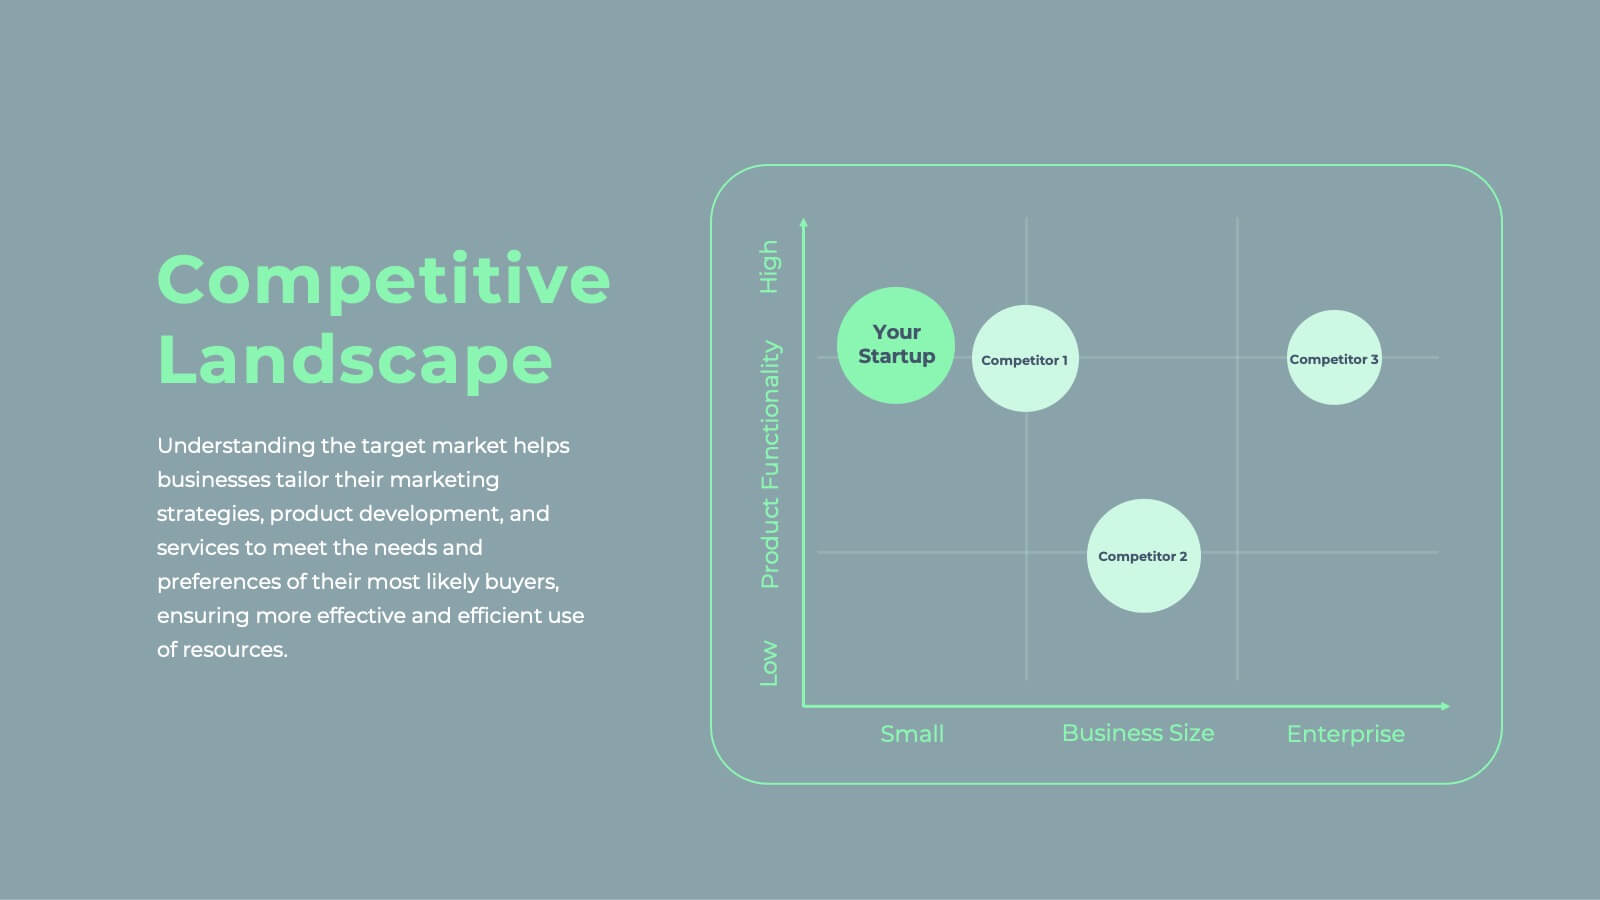
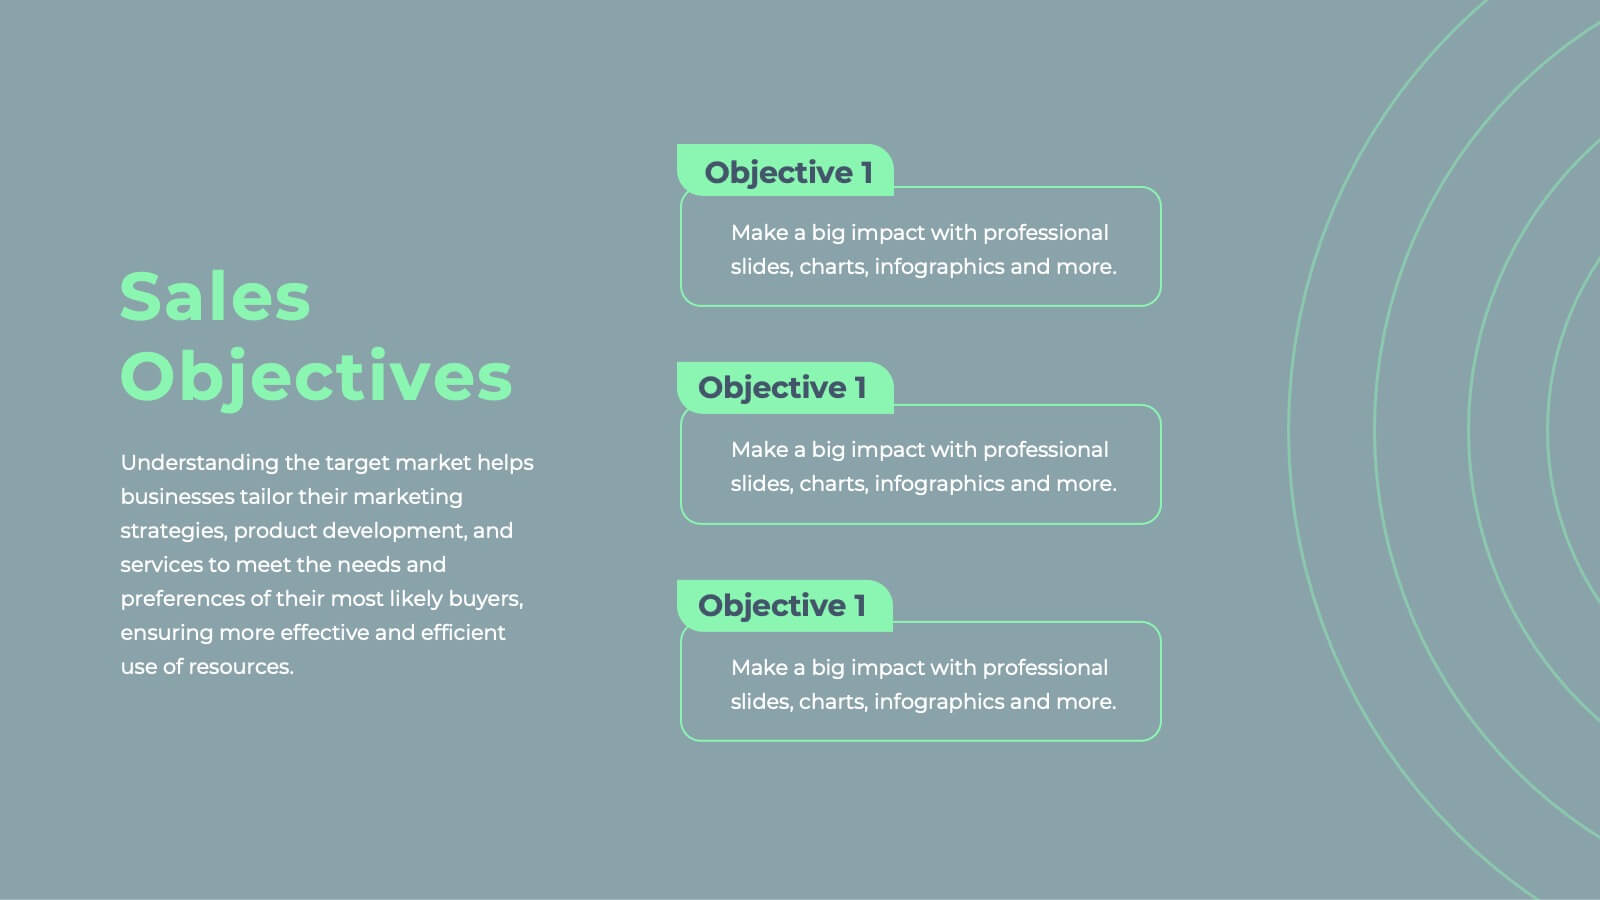
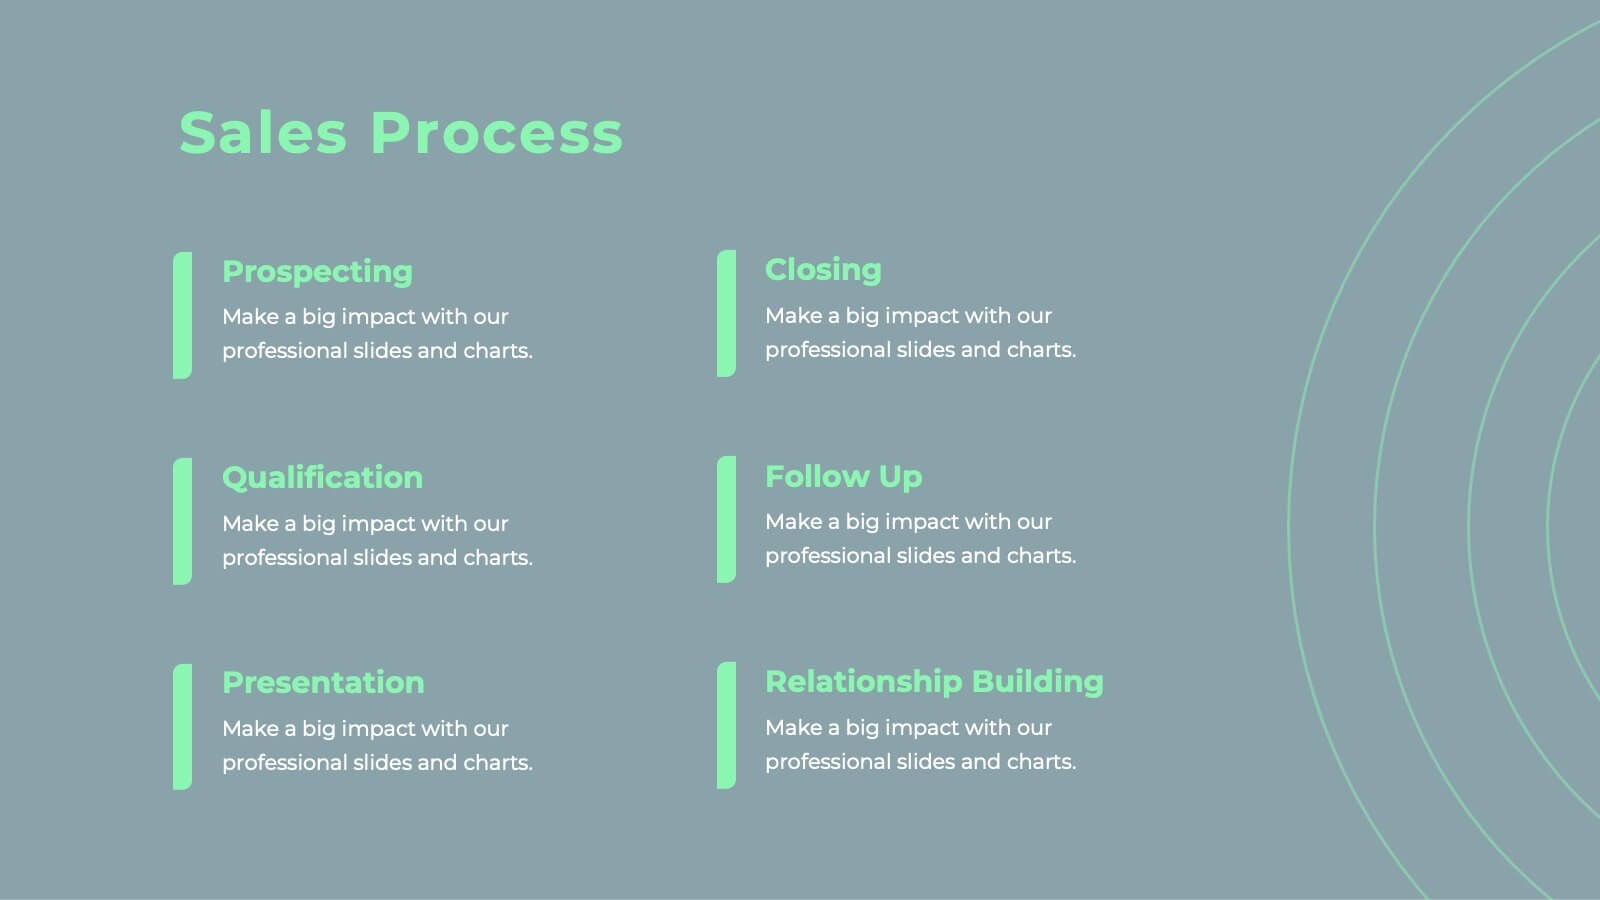
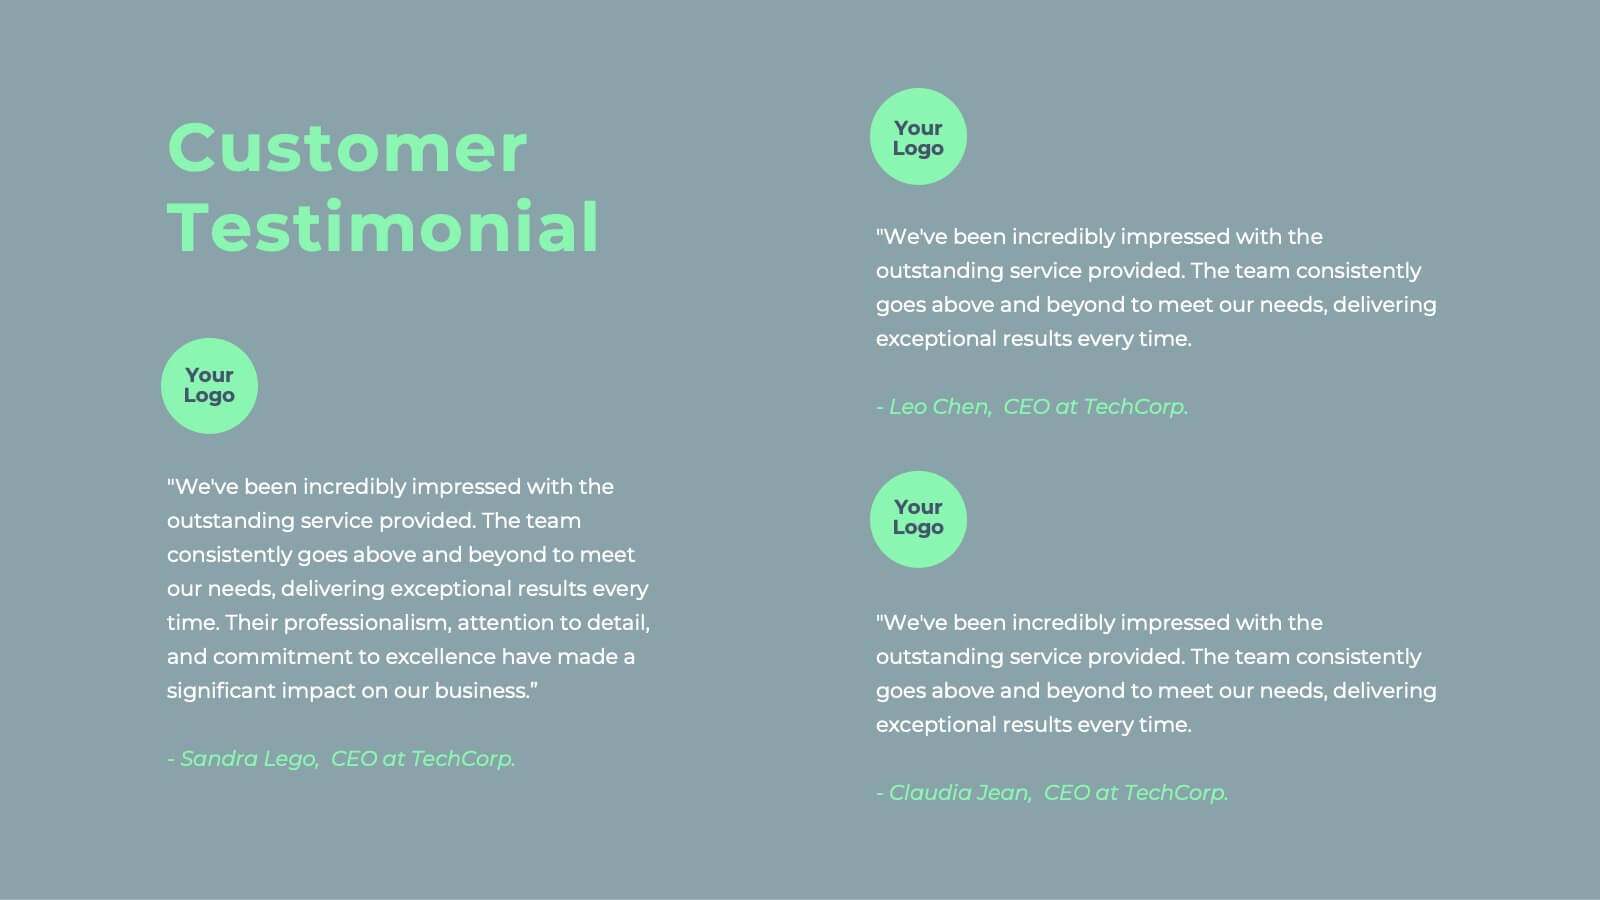
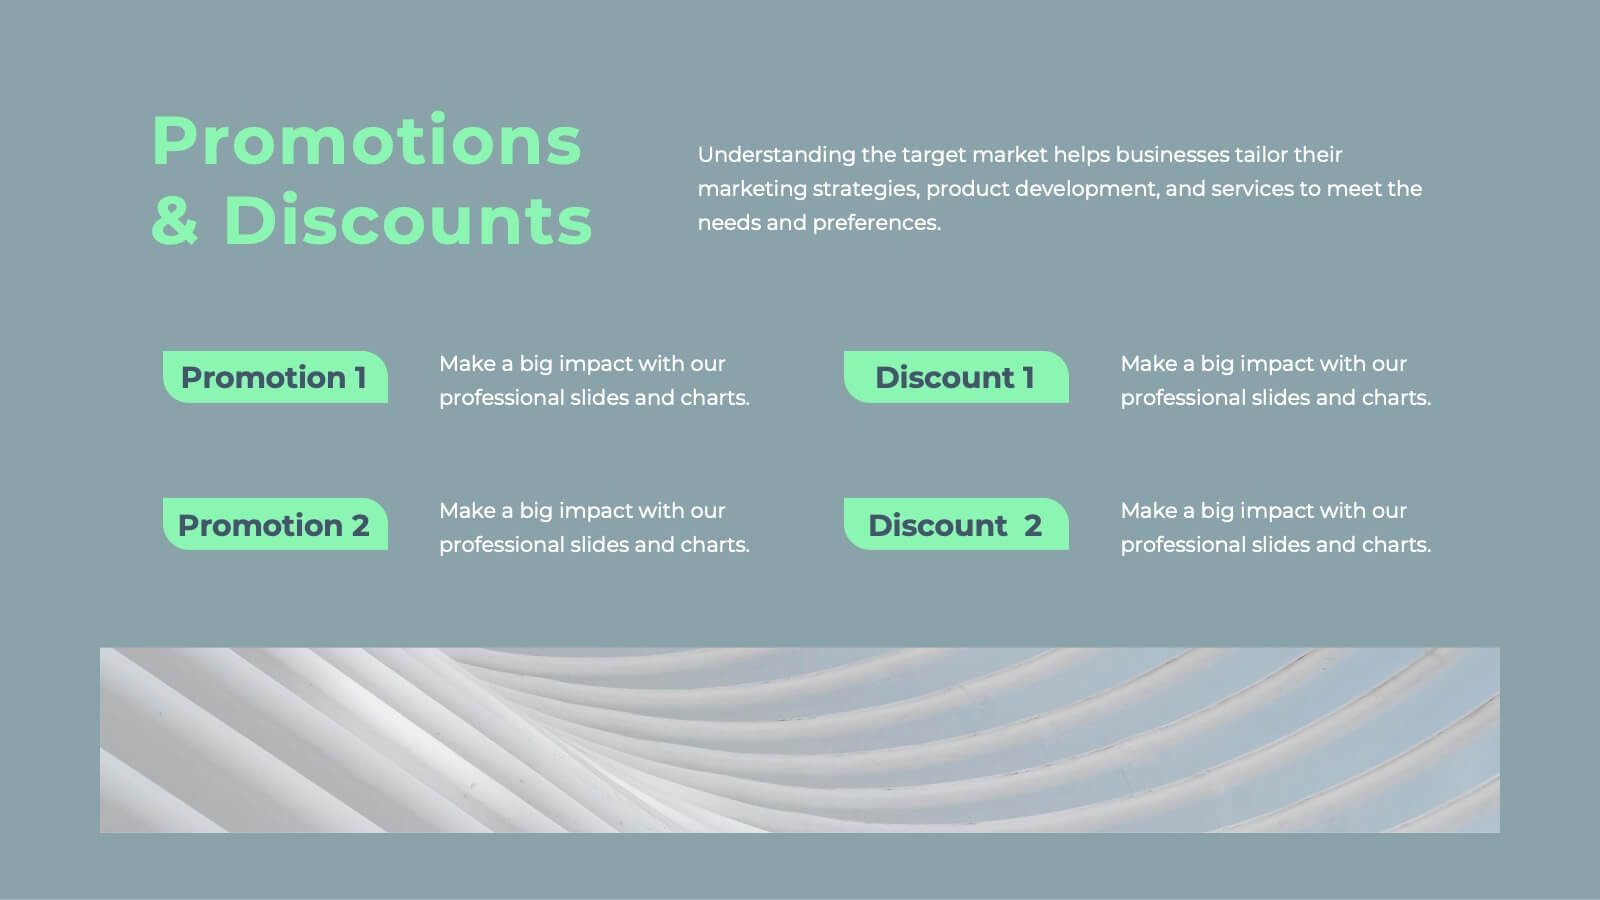
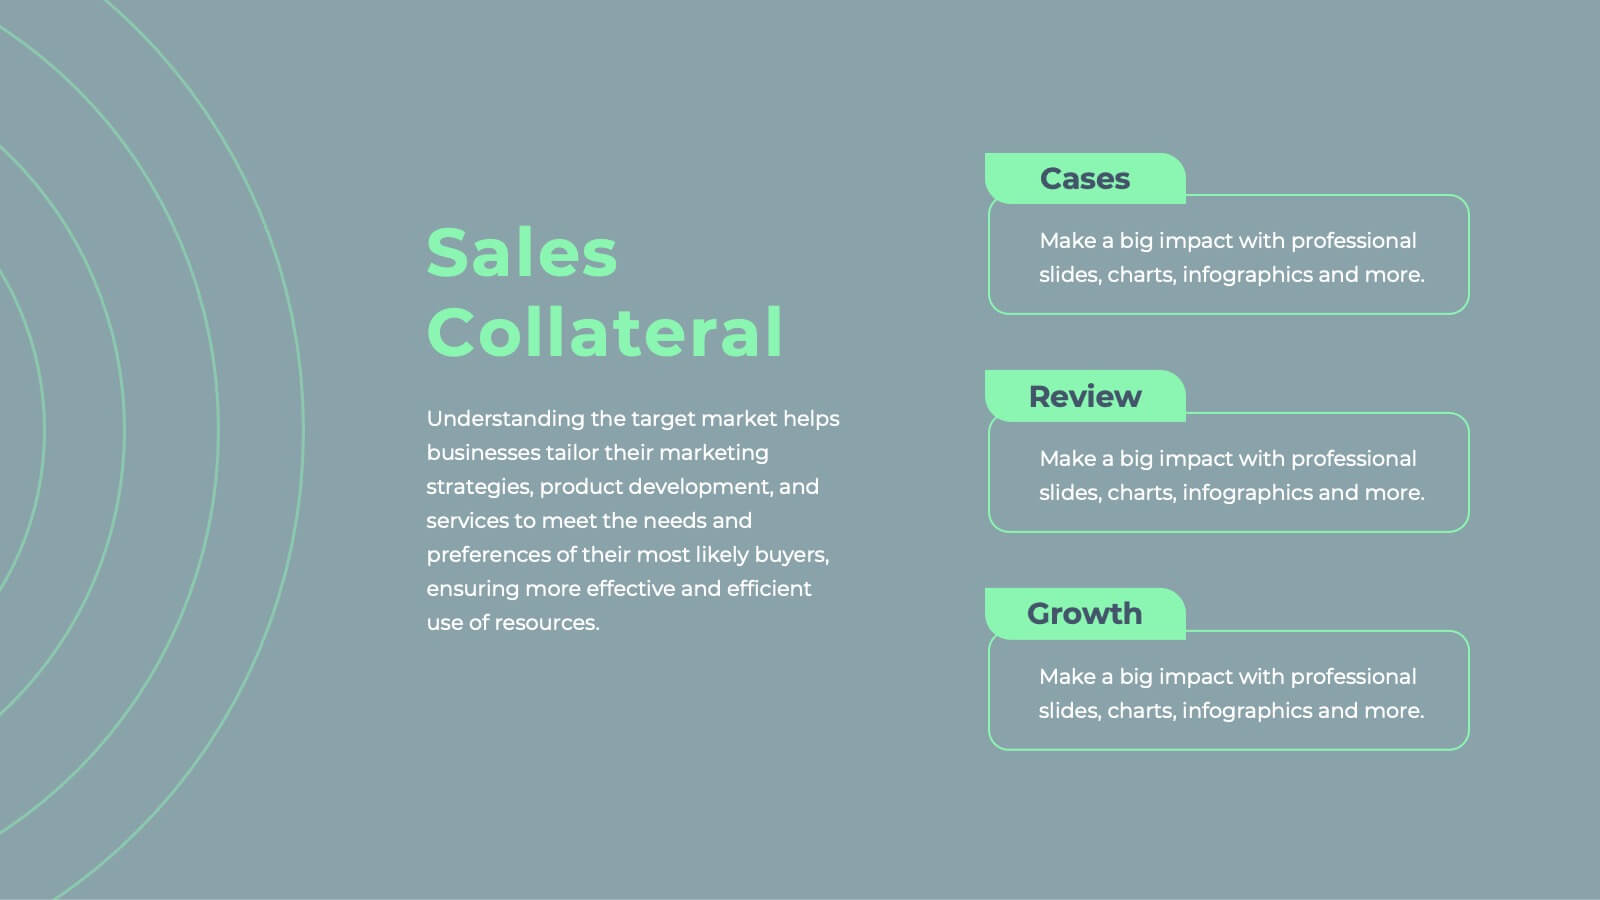
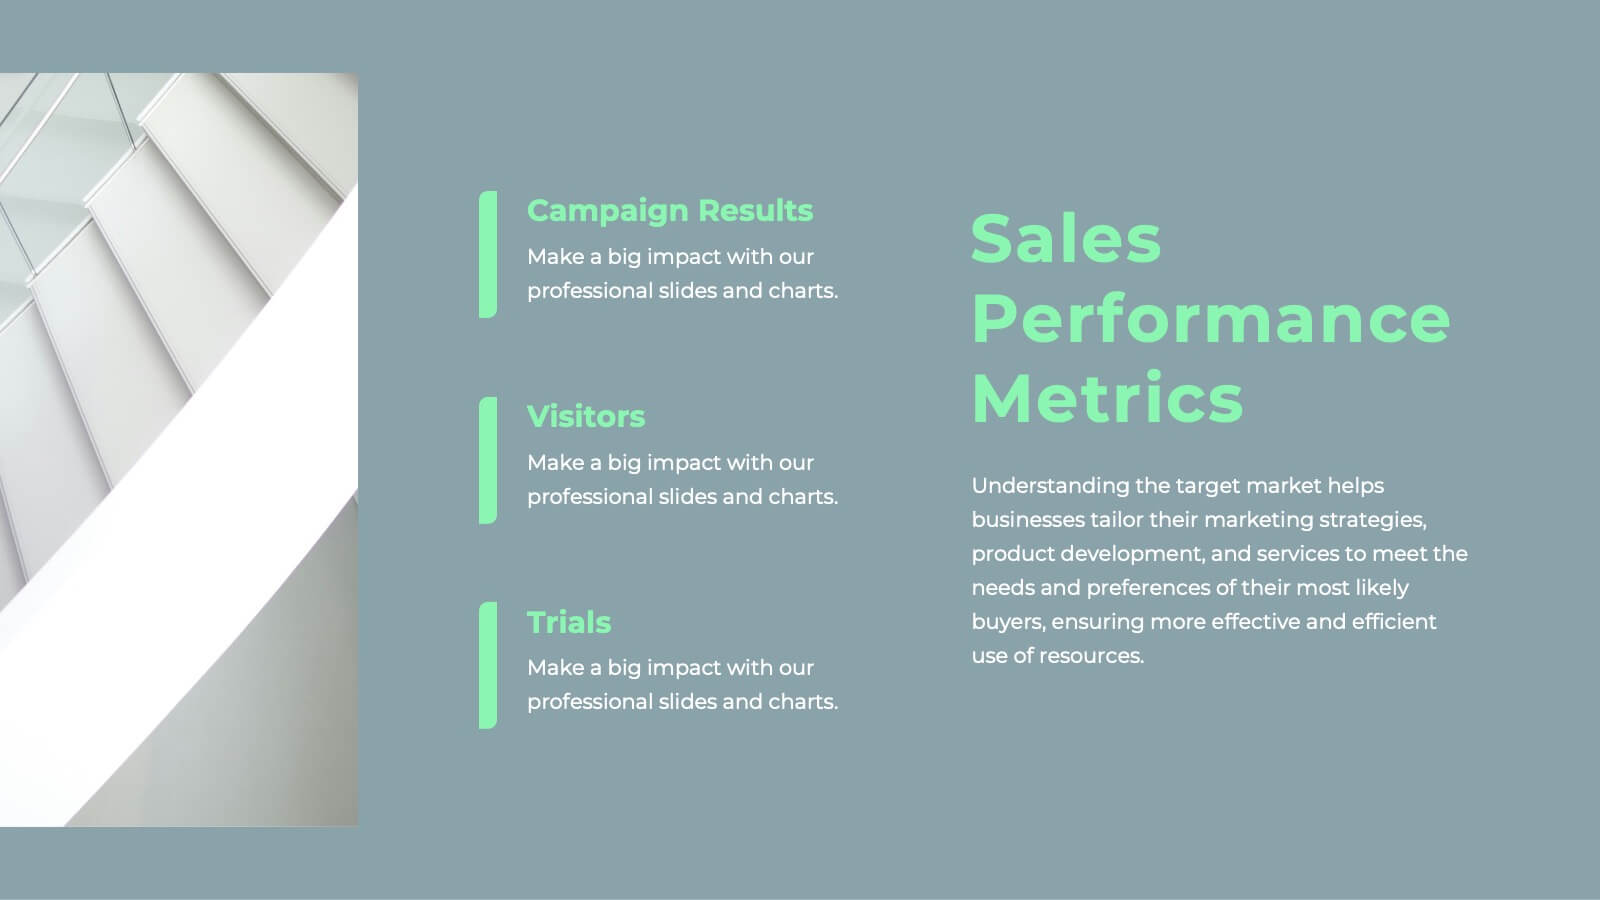
Javelin Sales Strategy Presentation
Boost your sales strategy with this sleek template! Perfect for outlining objectives, processes, performance metrics, and future opportunities. Tailored for impactful presentations to clients and teams. Fully customizable and compatible with PowerPoint, Keynote, and Google Slides.