


Features
- 10 Unique slides
- Fully editable and easy to edit in Microsoft Powerpoint, Keynote and Google Slides
- 16:9 widescreen layout
- Clean and professional designs
- Export to JPG, PDF or send by email


Do you have any questions?
Recommend


7 slides
Benefits vs Features Slide Presentation
Make your message stand out by clearly distinguishing what your product does from why it matters. This clean and structured layout helps you explain features and highlight their real-world benefits, keeping audiences engaged and informed. Fully customizable and compatible with PowerPoint, Keynote, and Google Slides for smooth presentation use.


6 slides
Business People Partner Infographics
Our "Business People Partner" infographic template is a modern and dynamic tool designed for PowerPoint, Keynote, and Google Slides. This template is particularly useful for HR professionals, business consultants, and team leaders who are involved in fostering effective business partnerships. The template highlights essential elements such as organizational roles, partnership strategies, and communication channels. Its layout is thoughtfully designed to help users articulate the intricacies of business partnerships and the roles of various stakeholders in a clear and concise manner. This makes it an invaluable resource for presentations focusing on collaborative efforts and strategic alliances in the business world. Featuring a bright and inviting color scheme, the design of this template is both contemporary and engaging. It reflects the dynamic and collaborative nature of business partnerships, making your presentation not just informative but also visually appealing. Whether you're presenting to executives, partners, or team members, this template ensures your message is delivered with clarity and impact.


20 slides
Aura Digital Marketing Strategy Plan Presentation
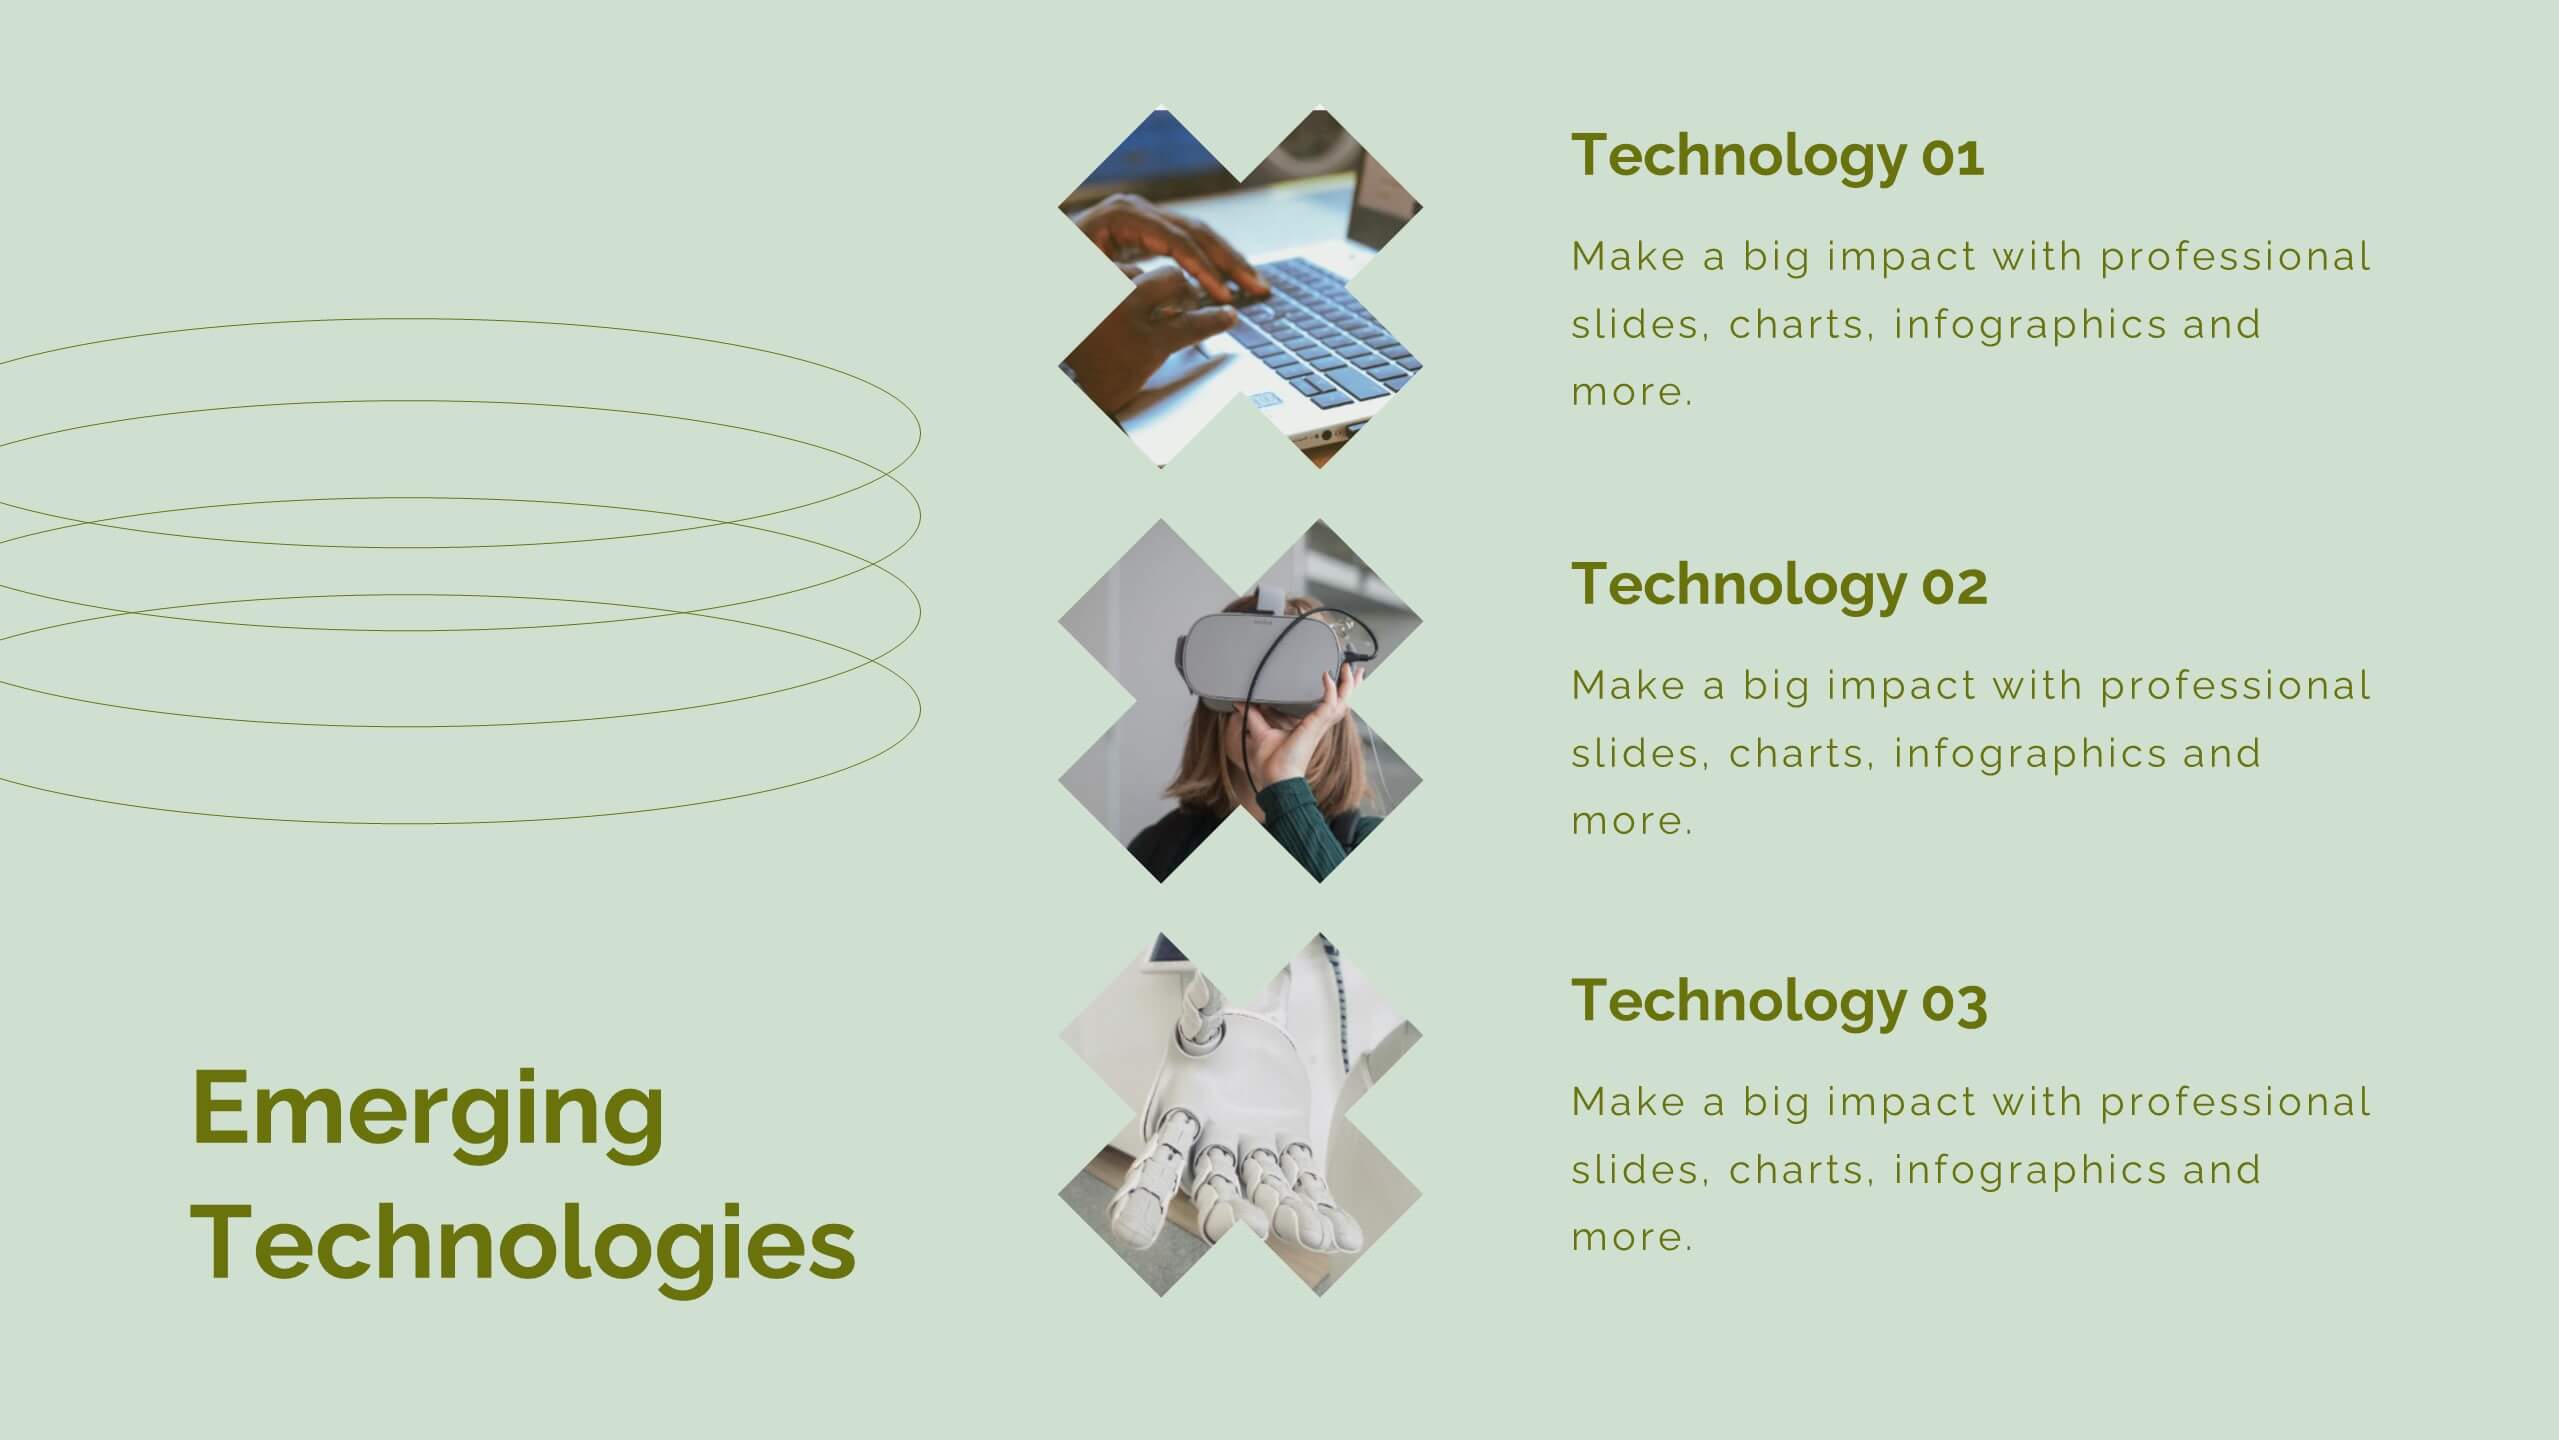
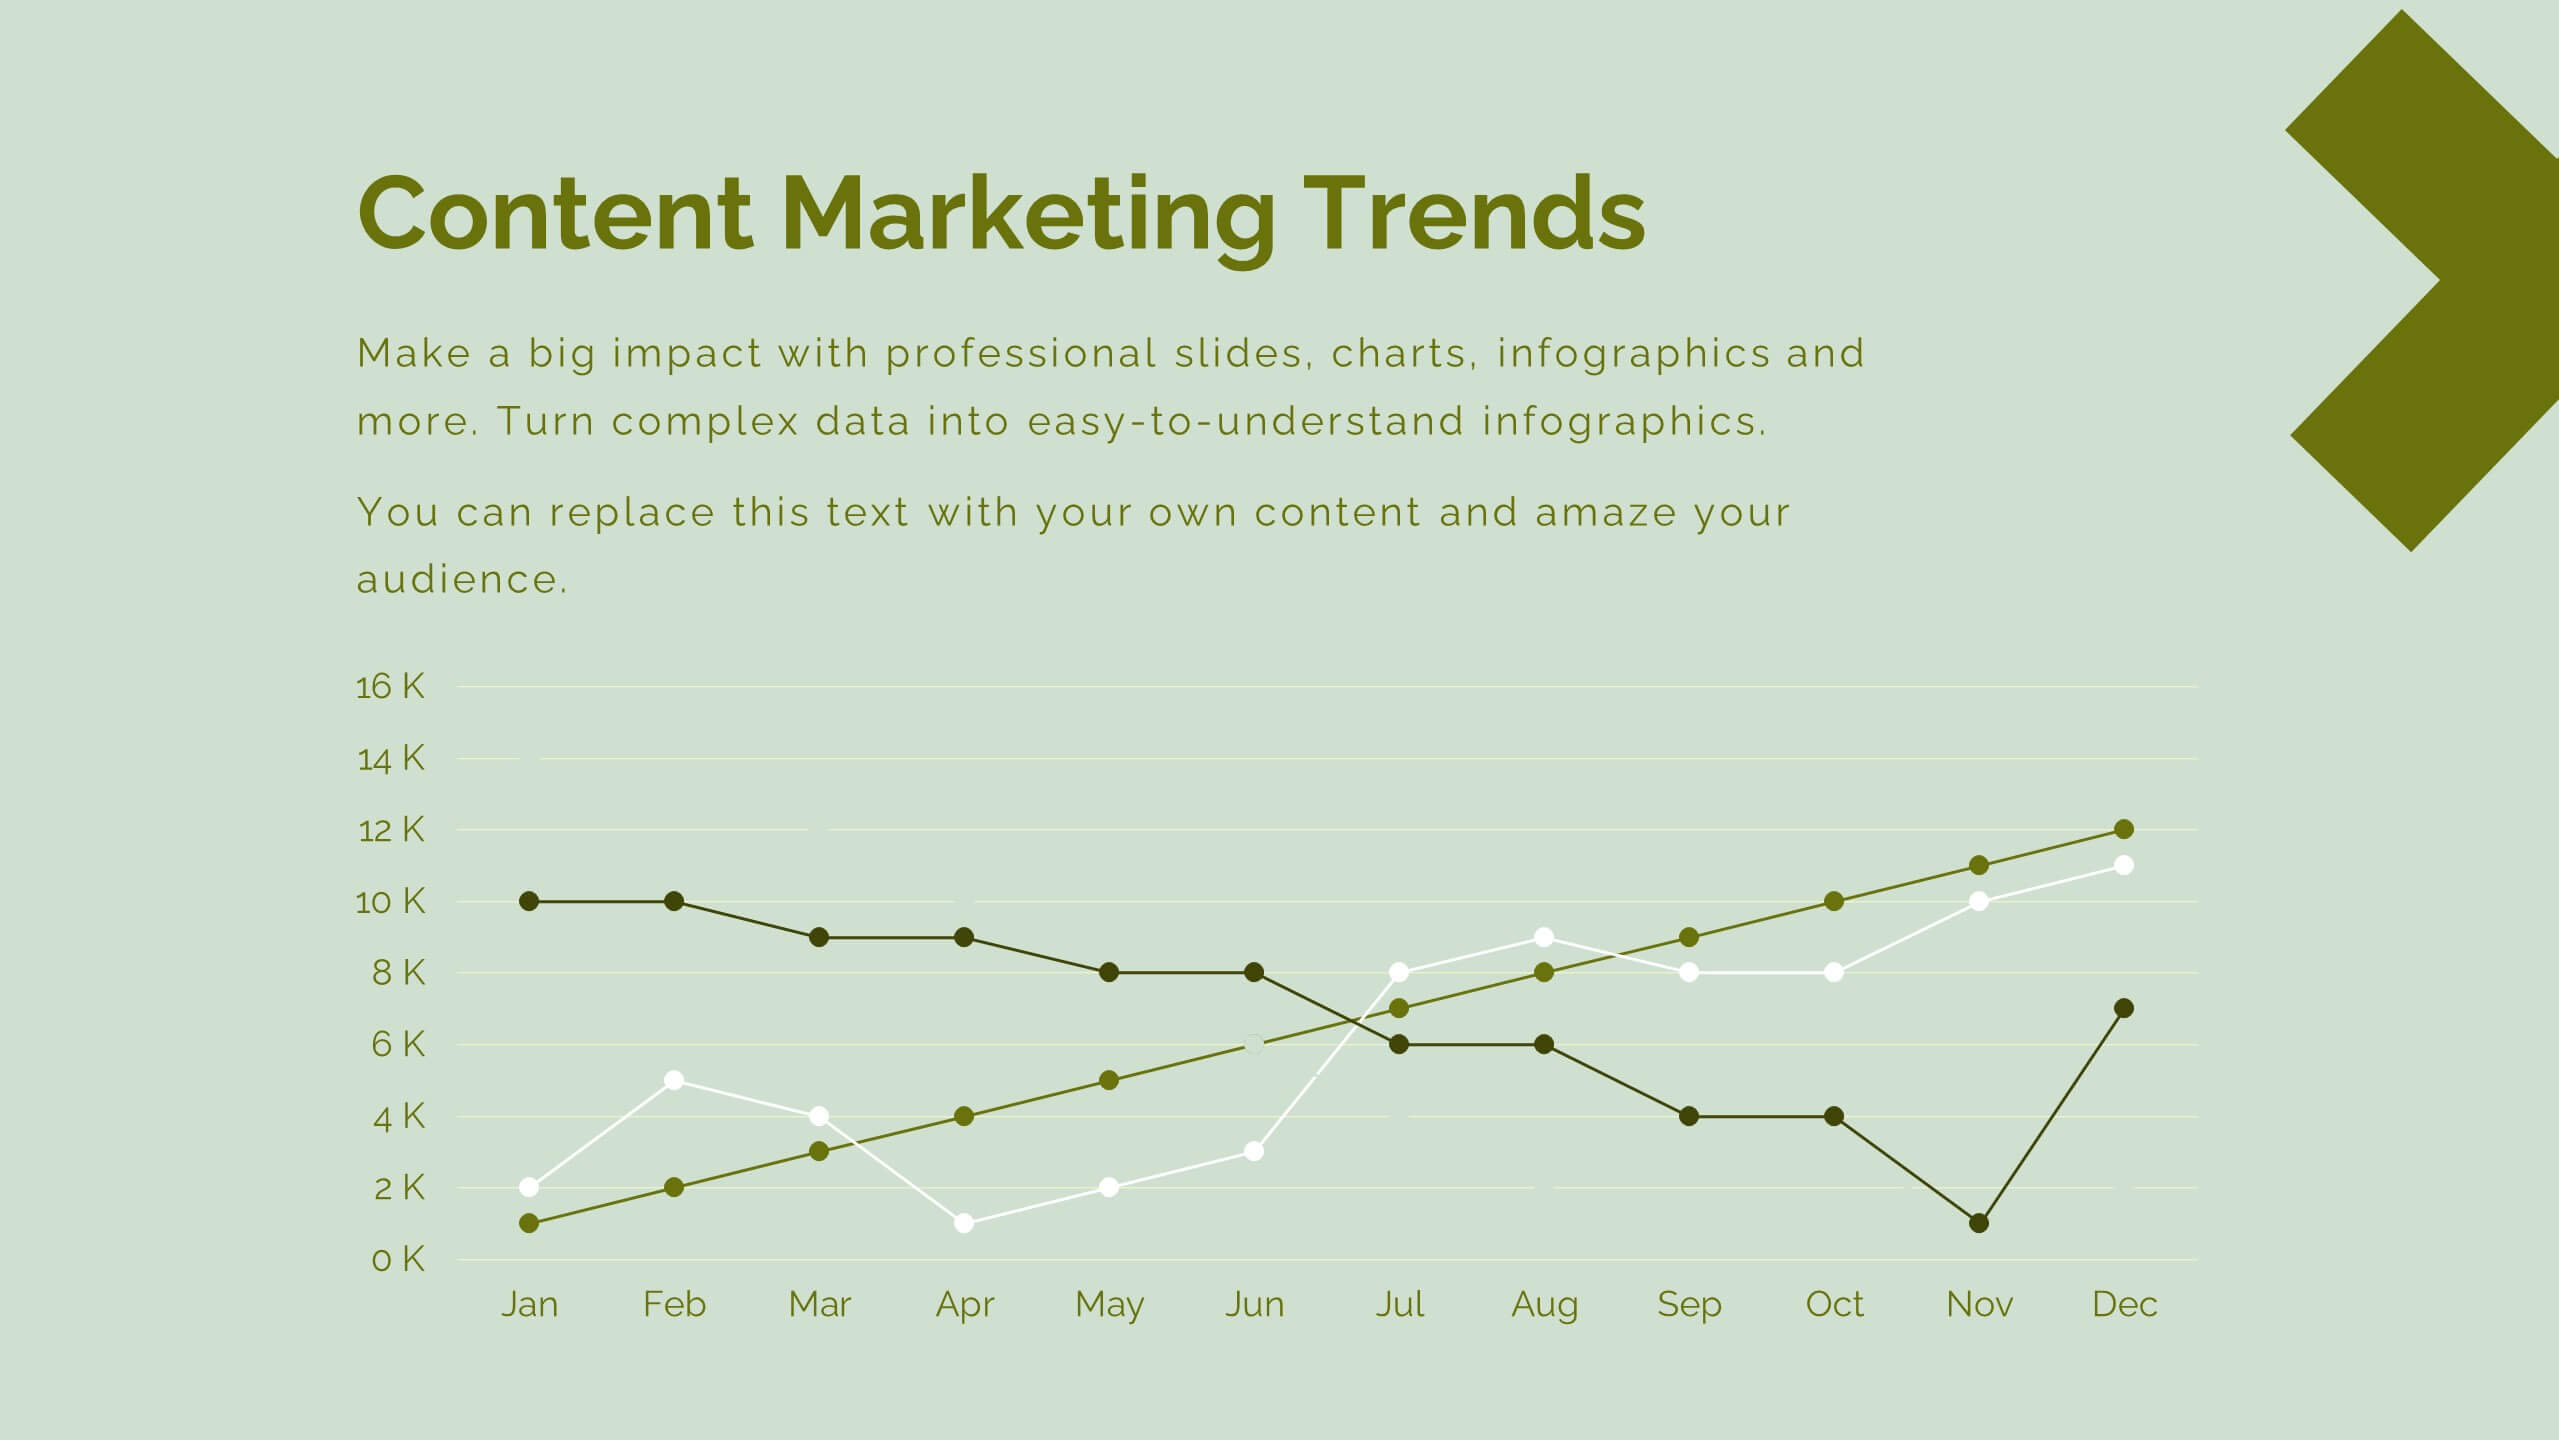
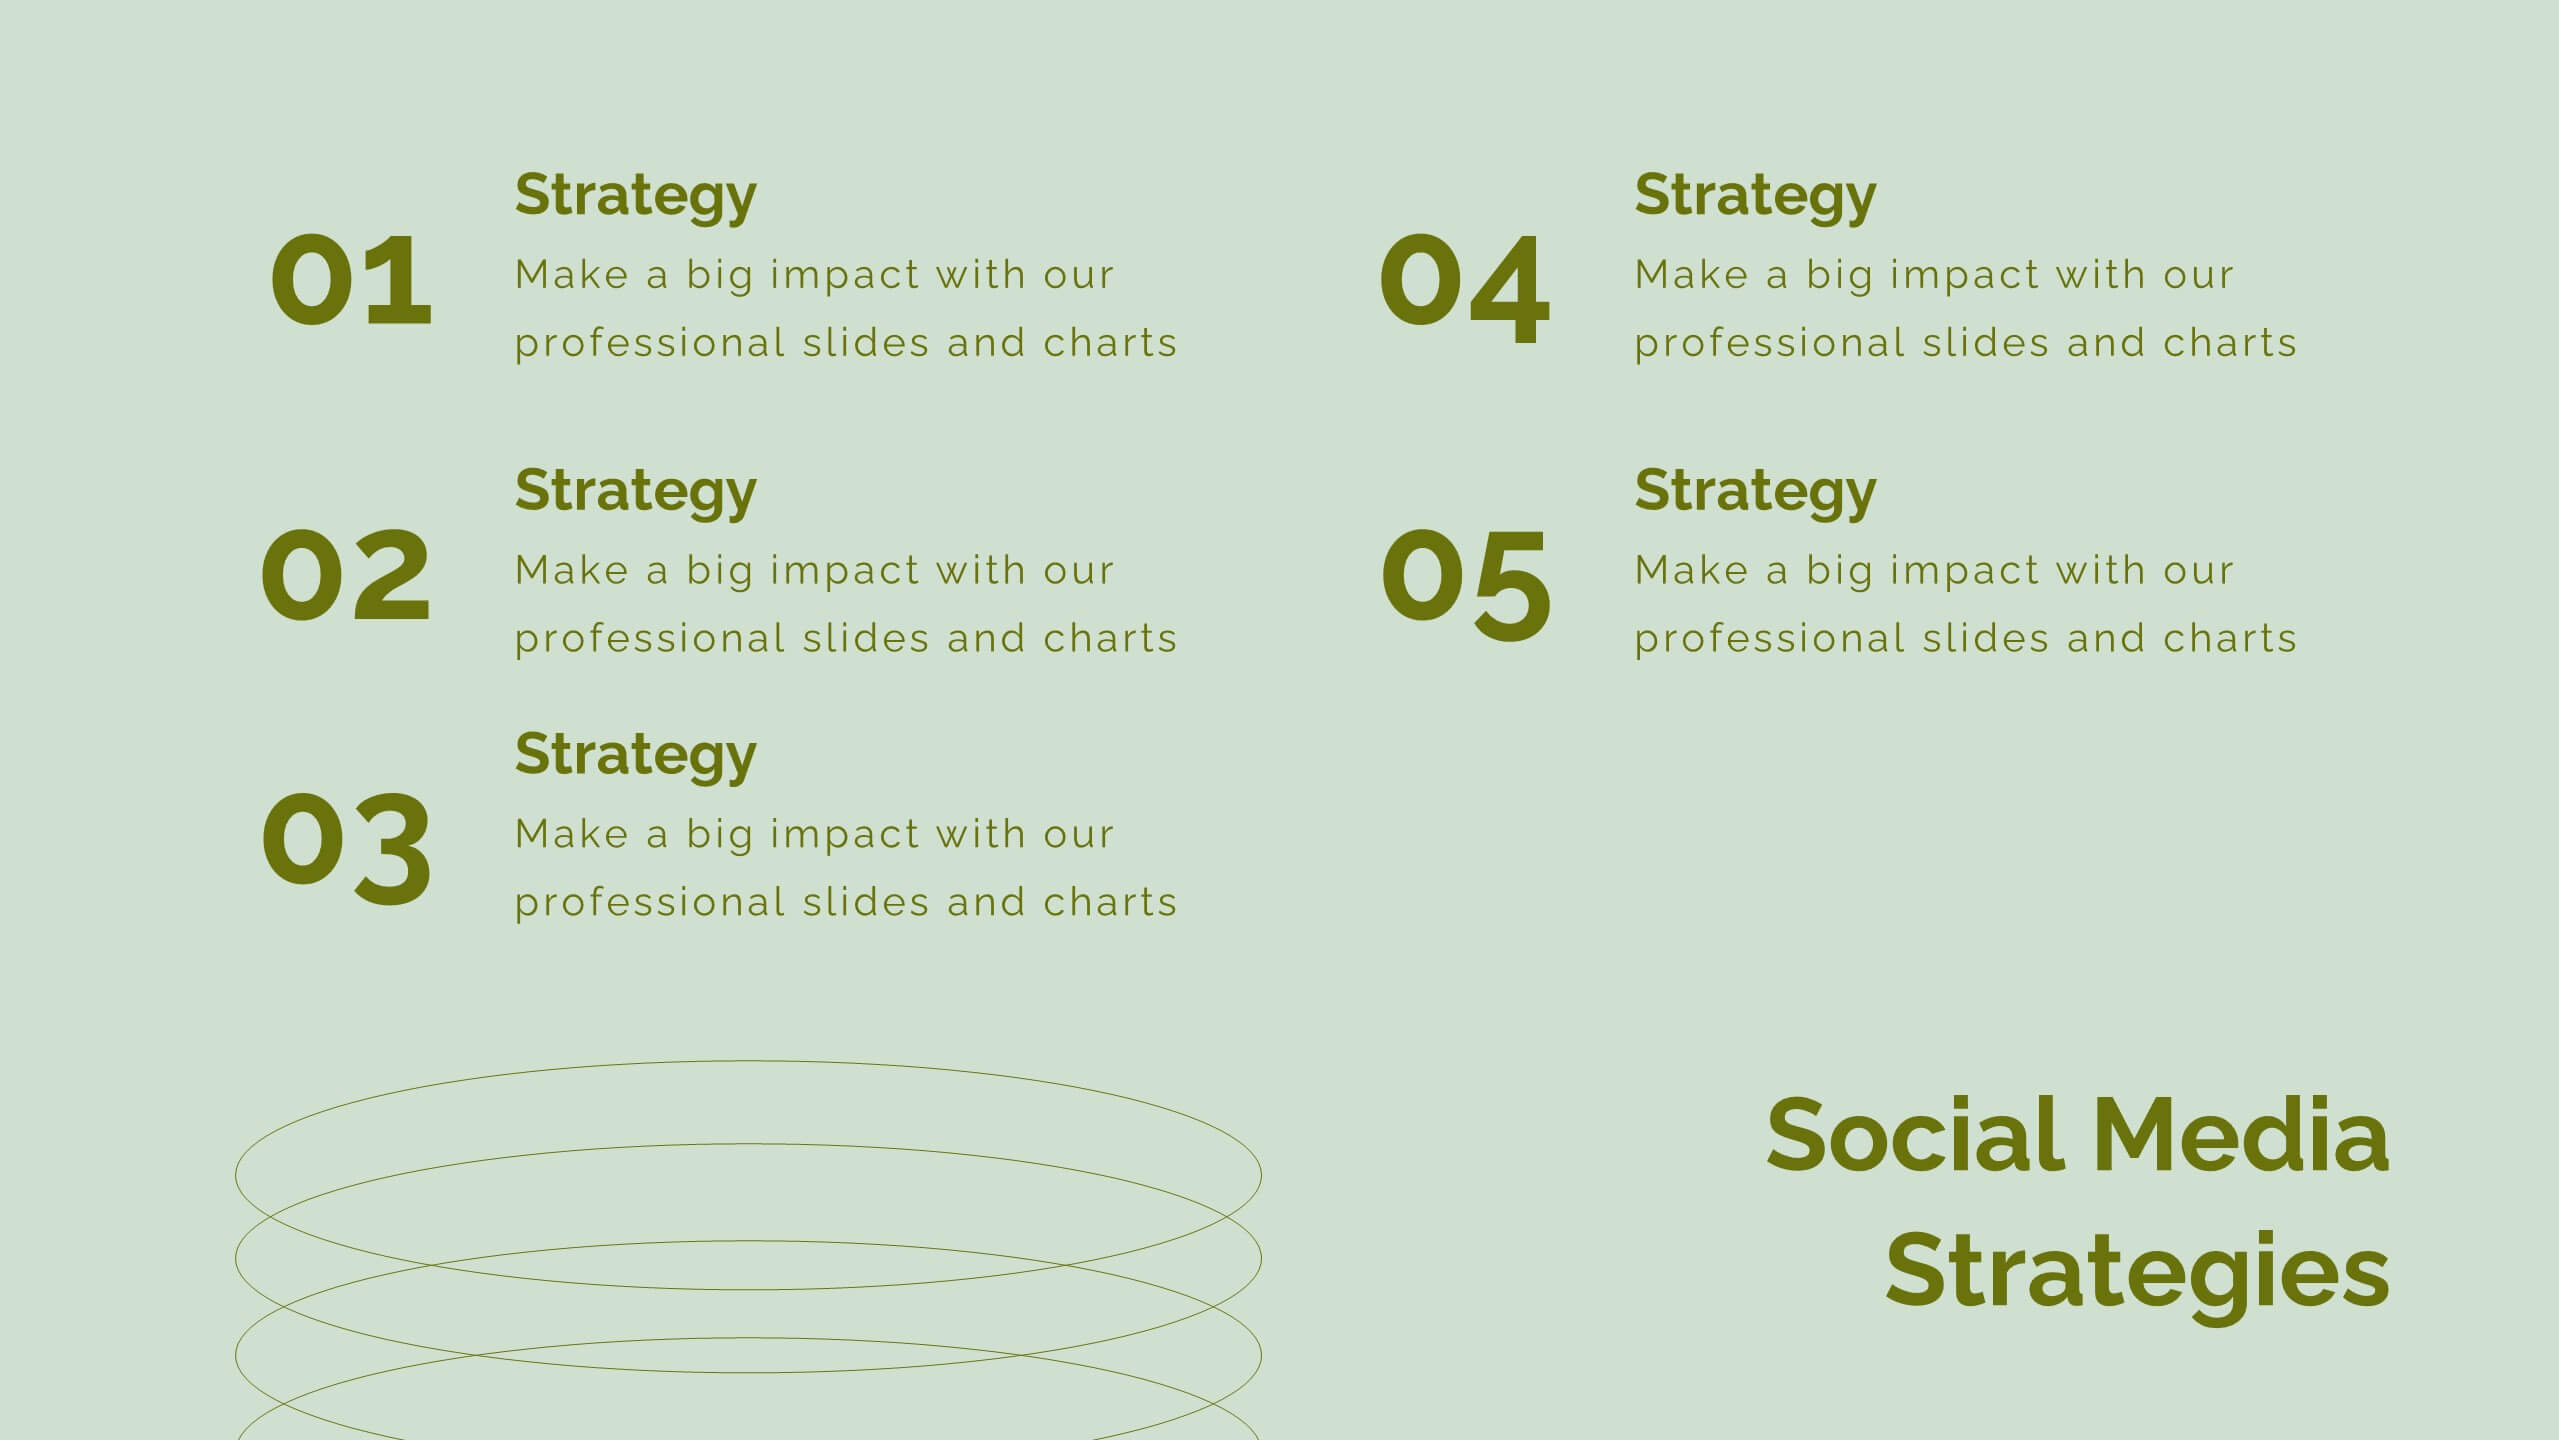
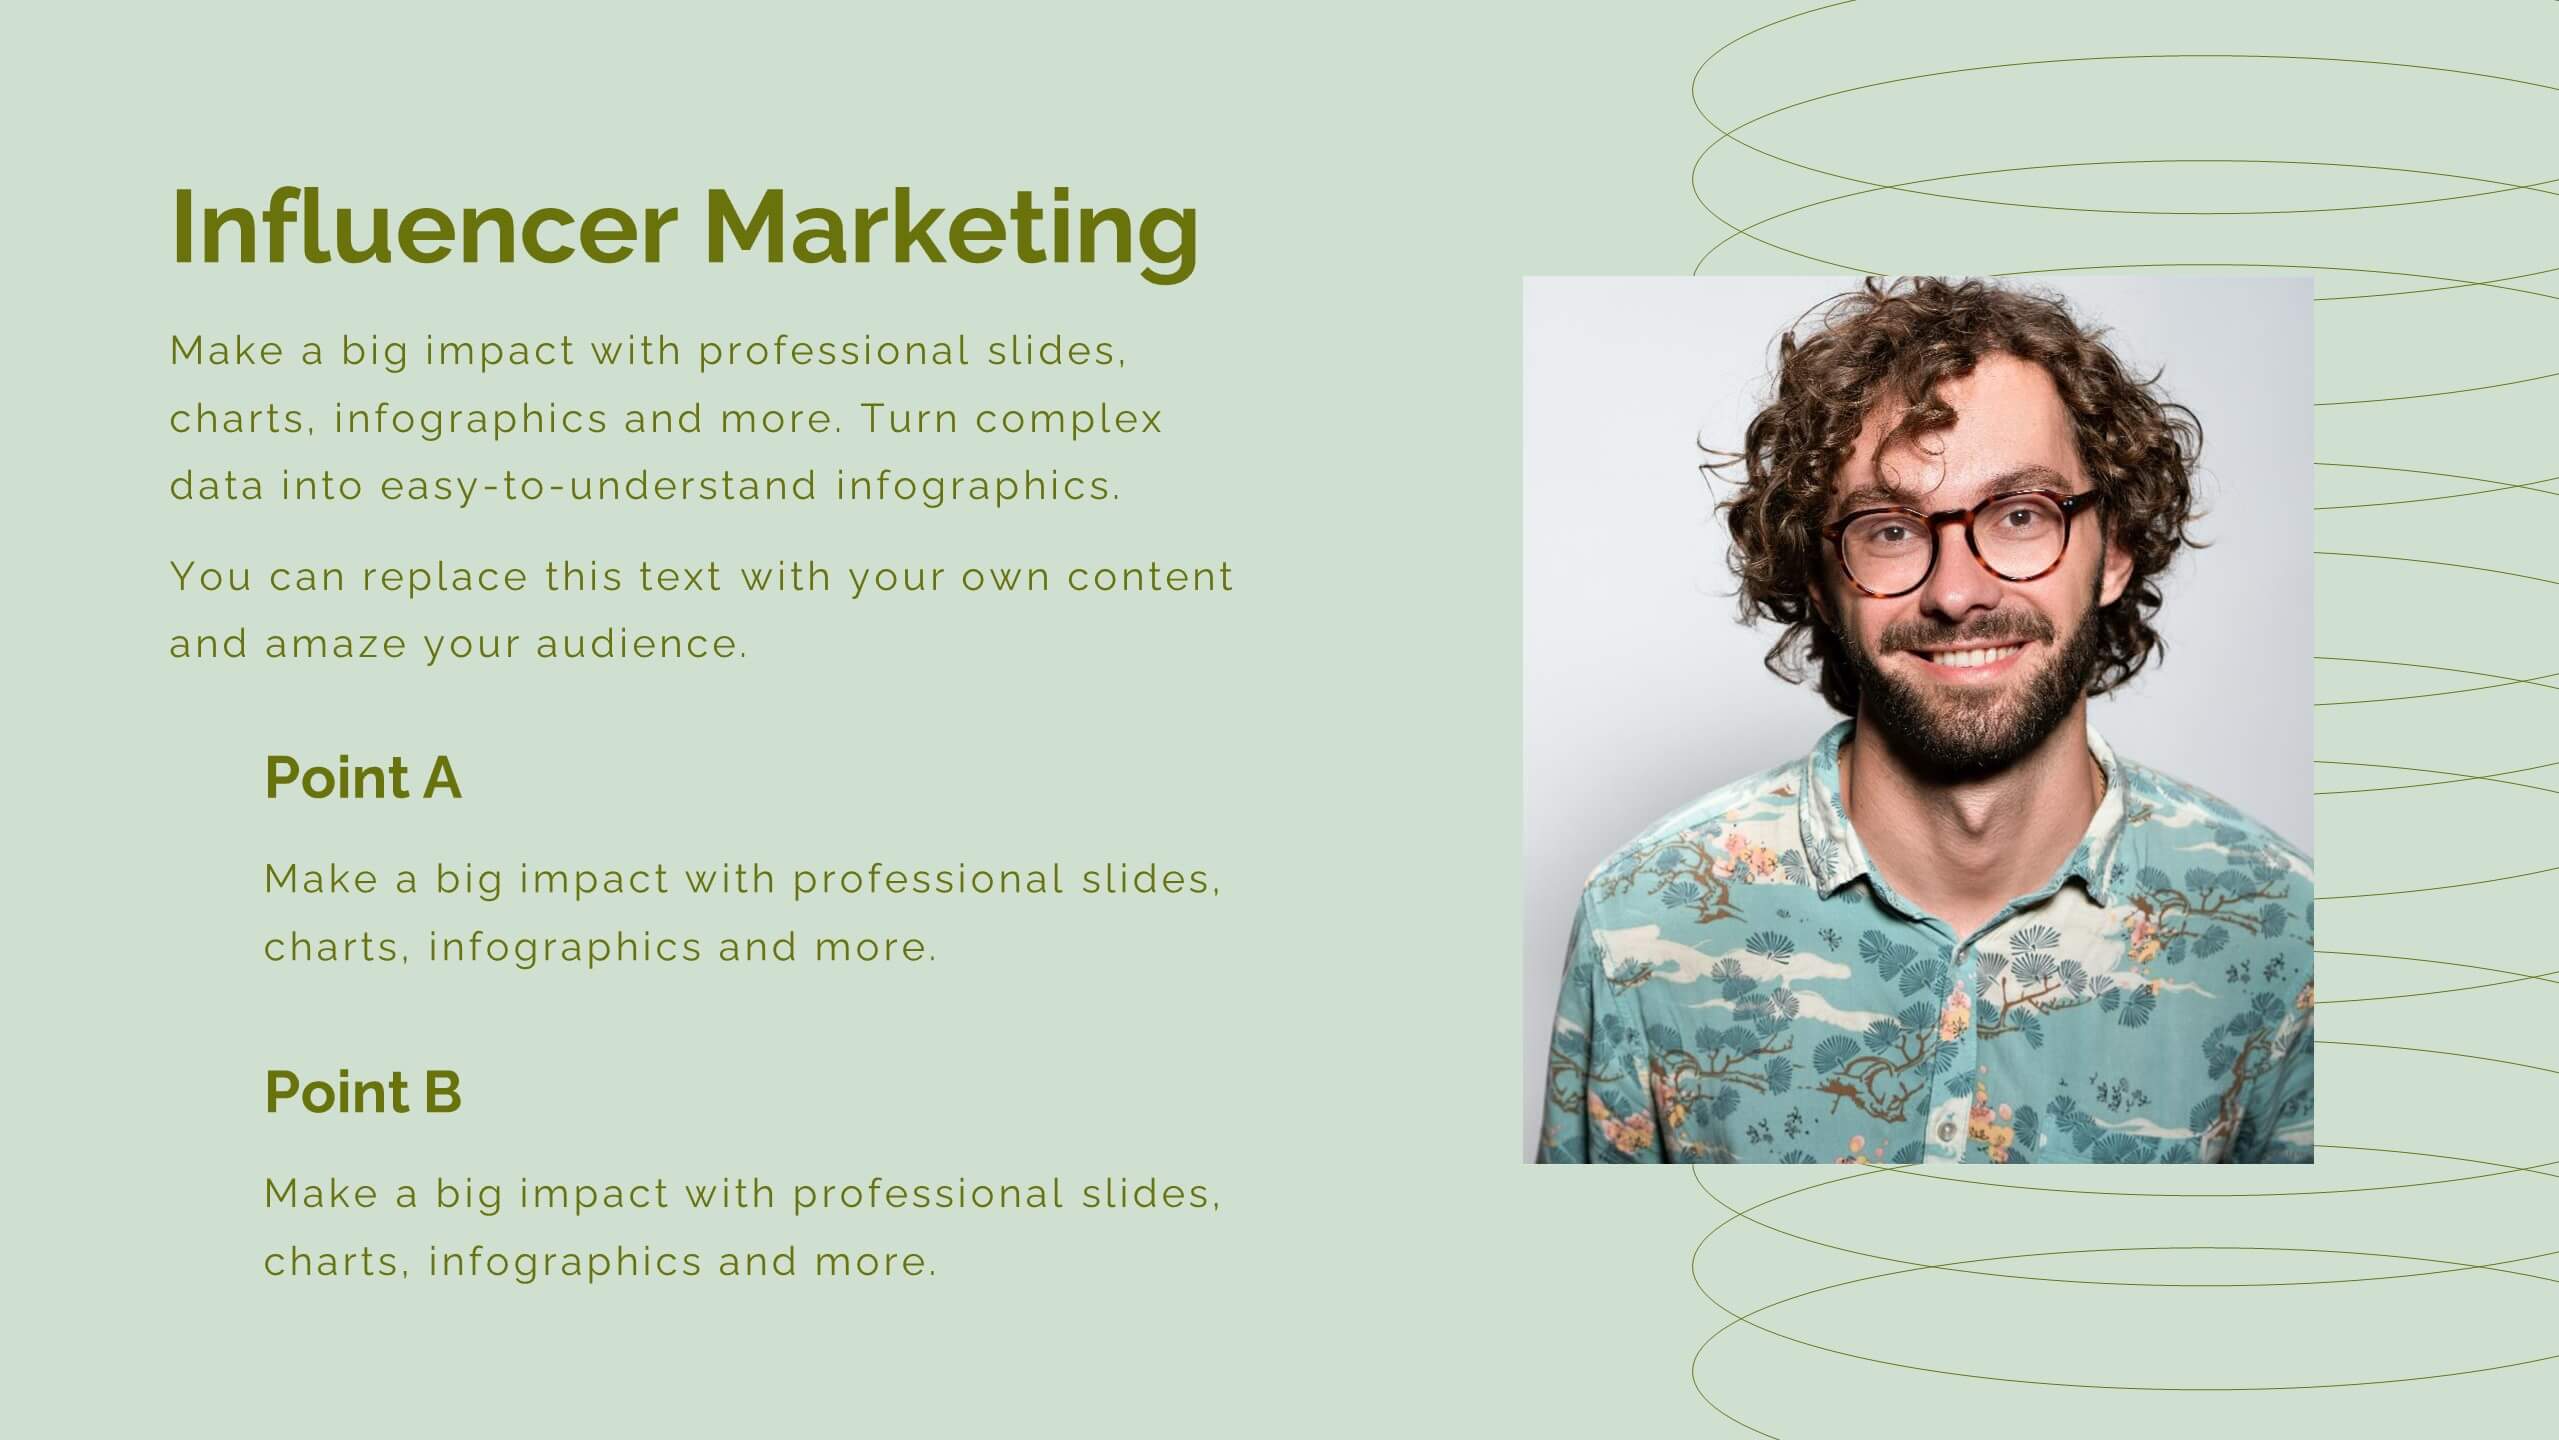
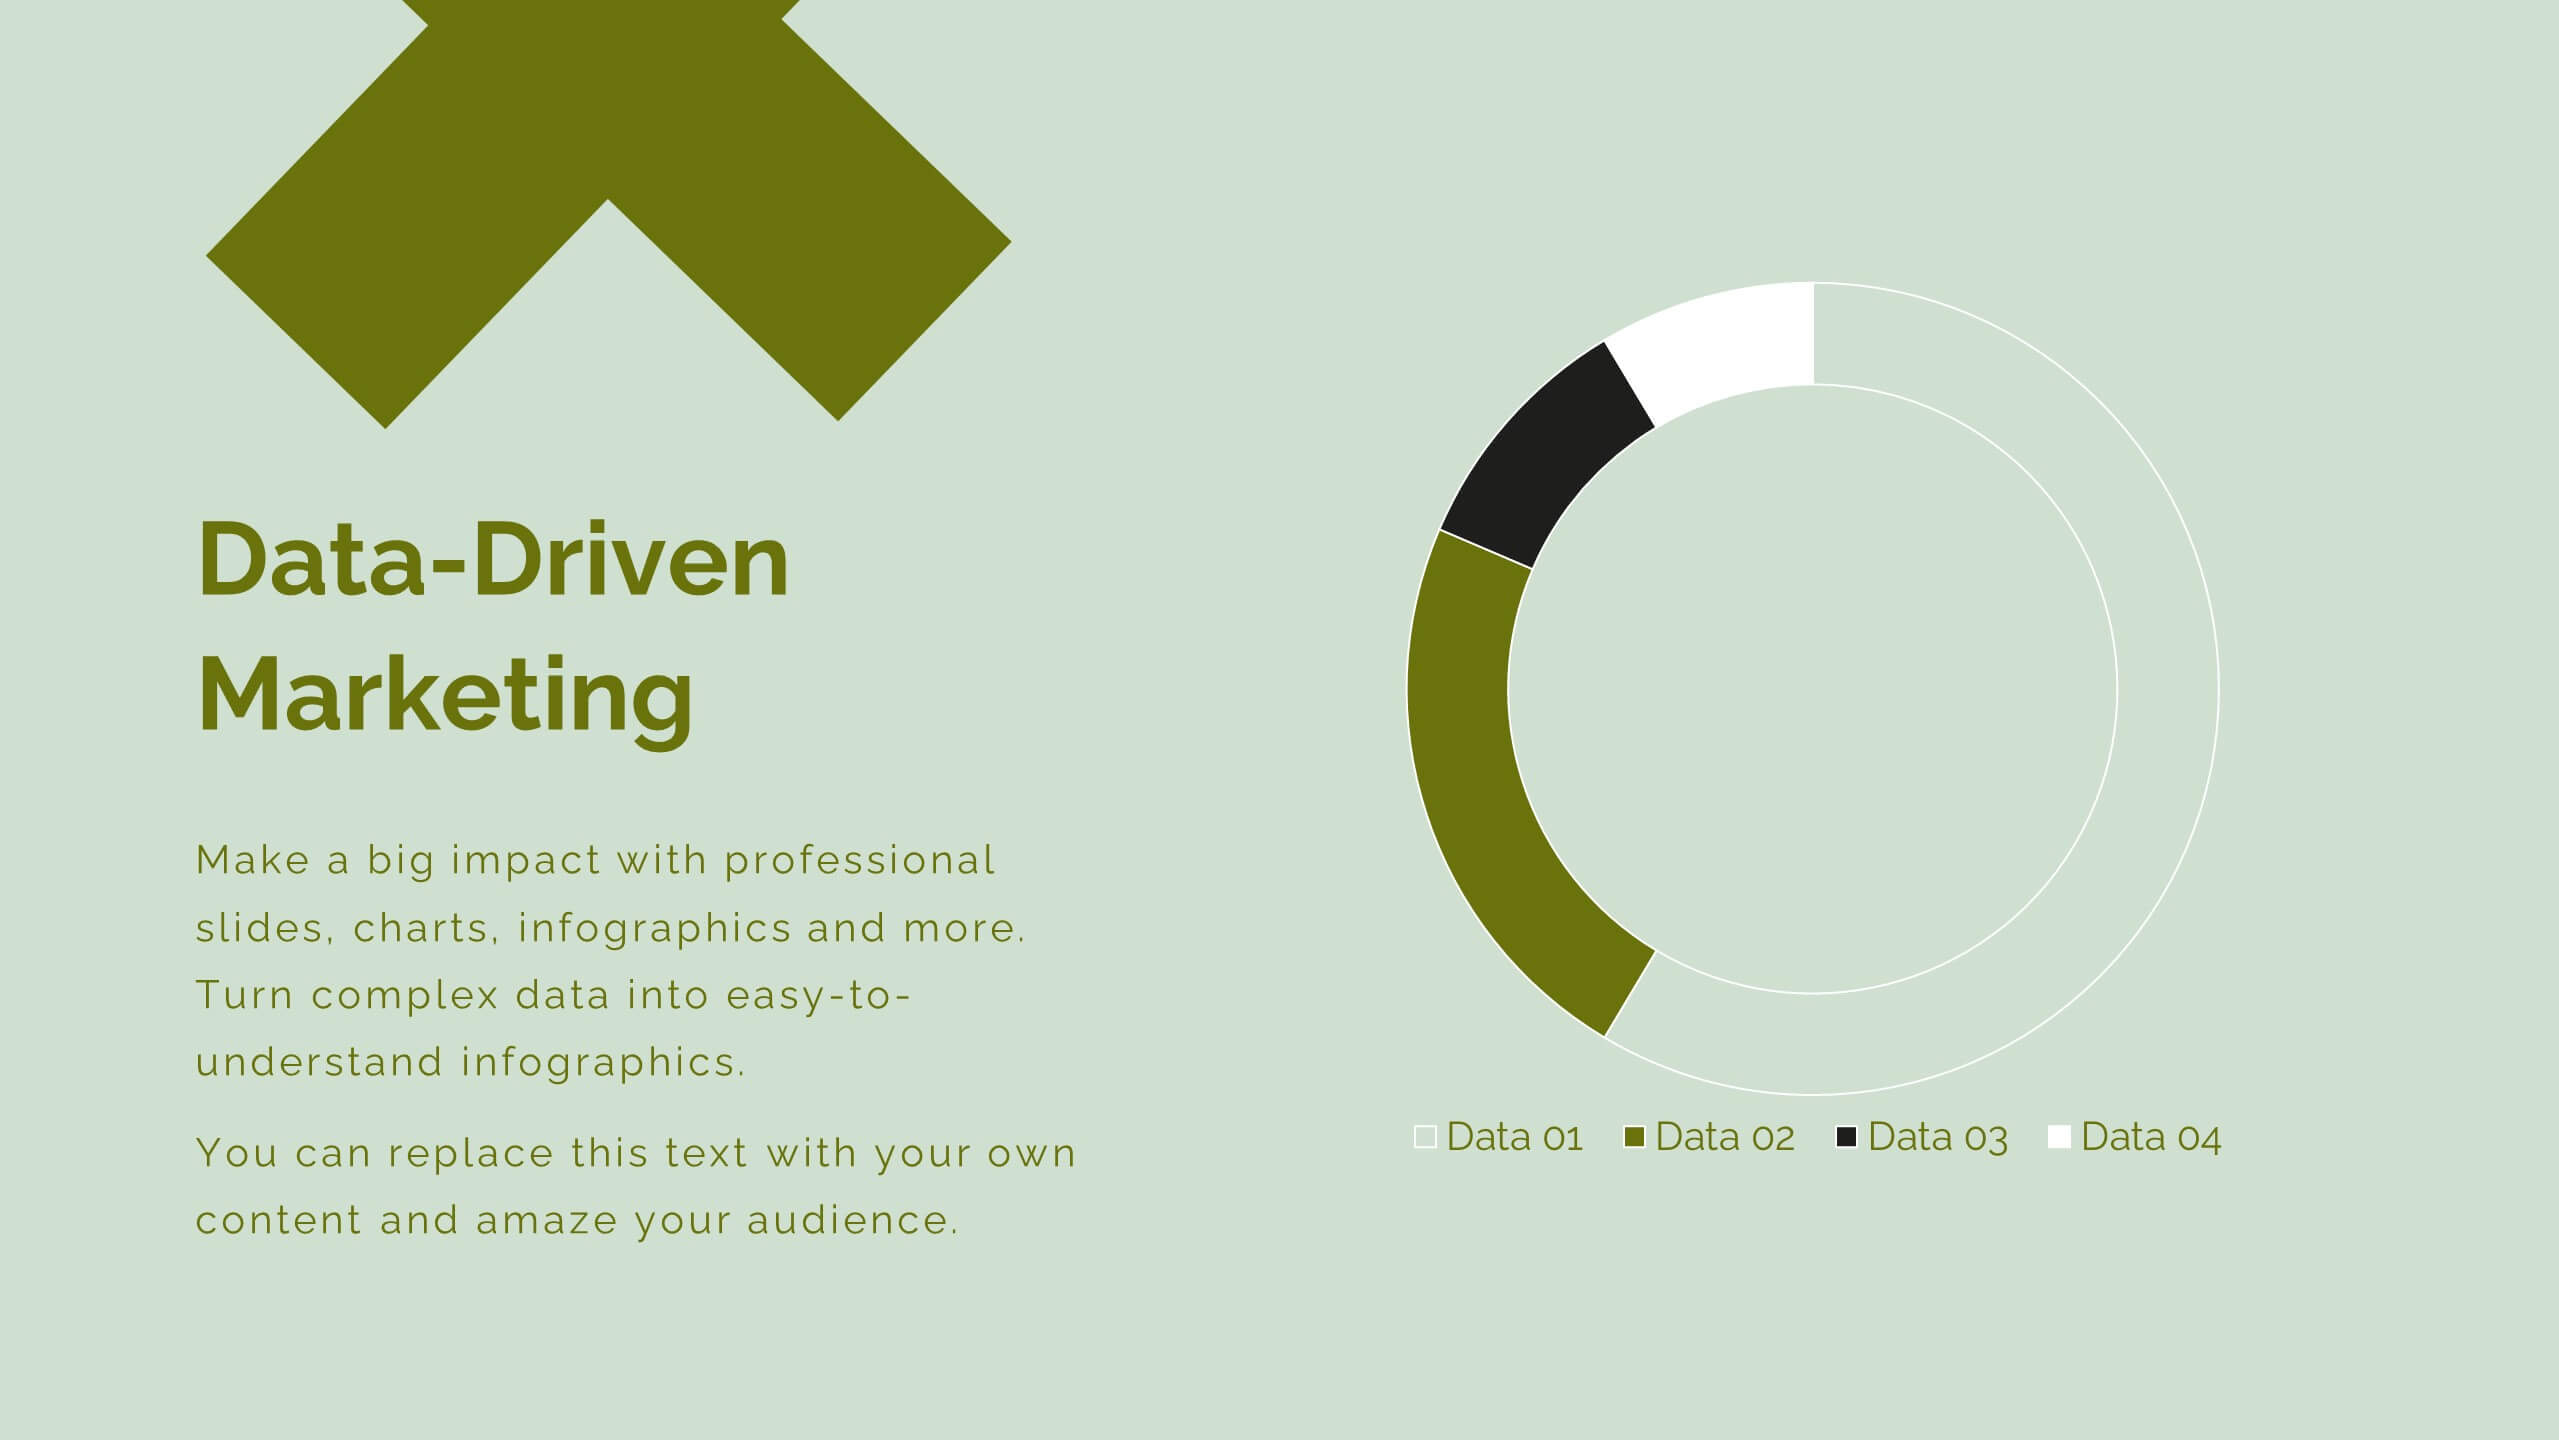
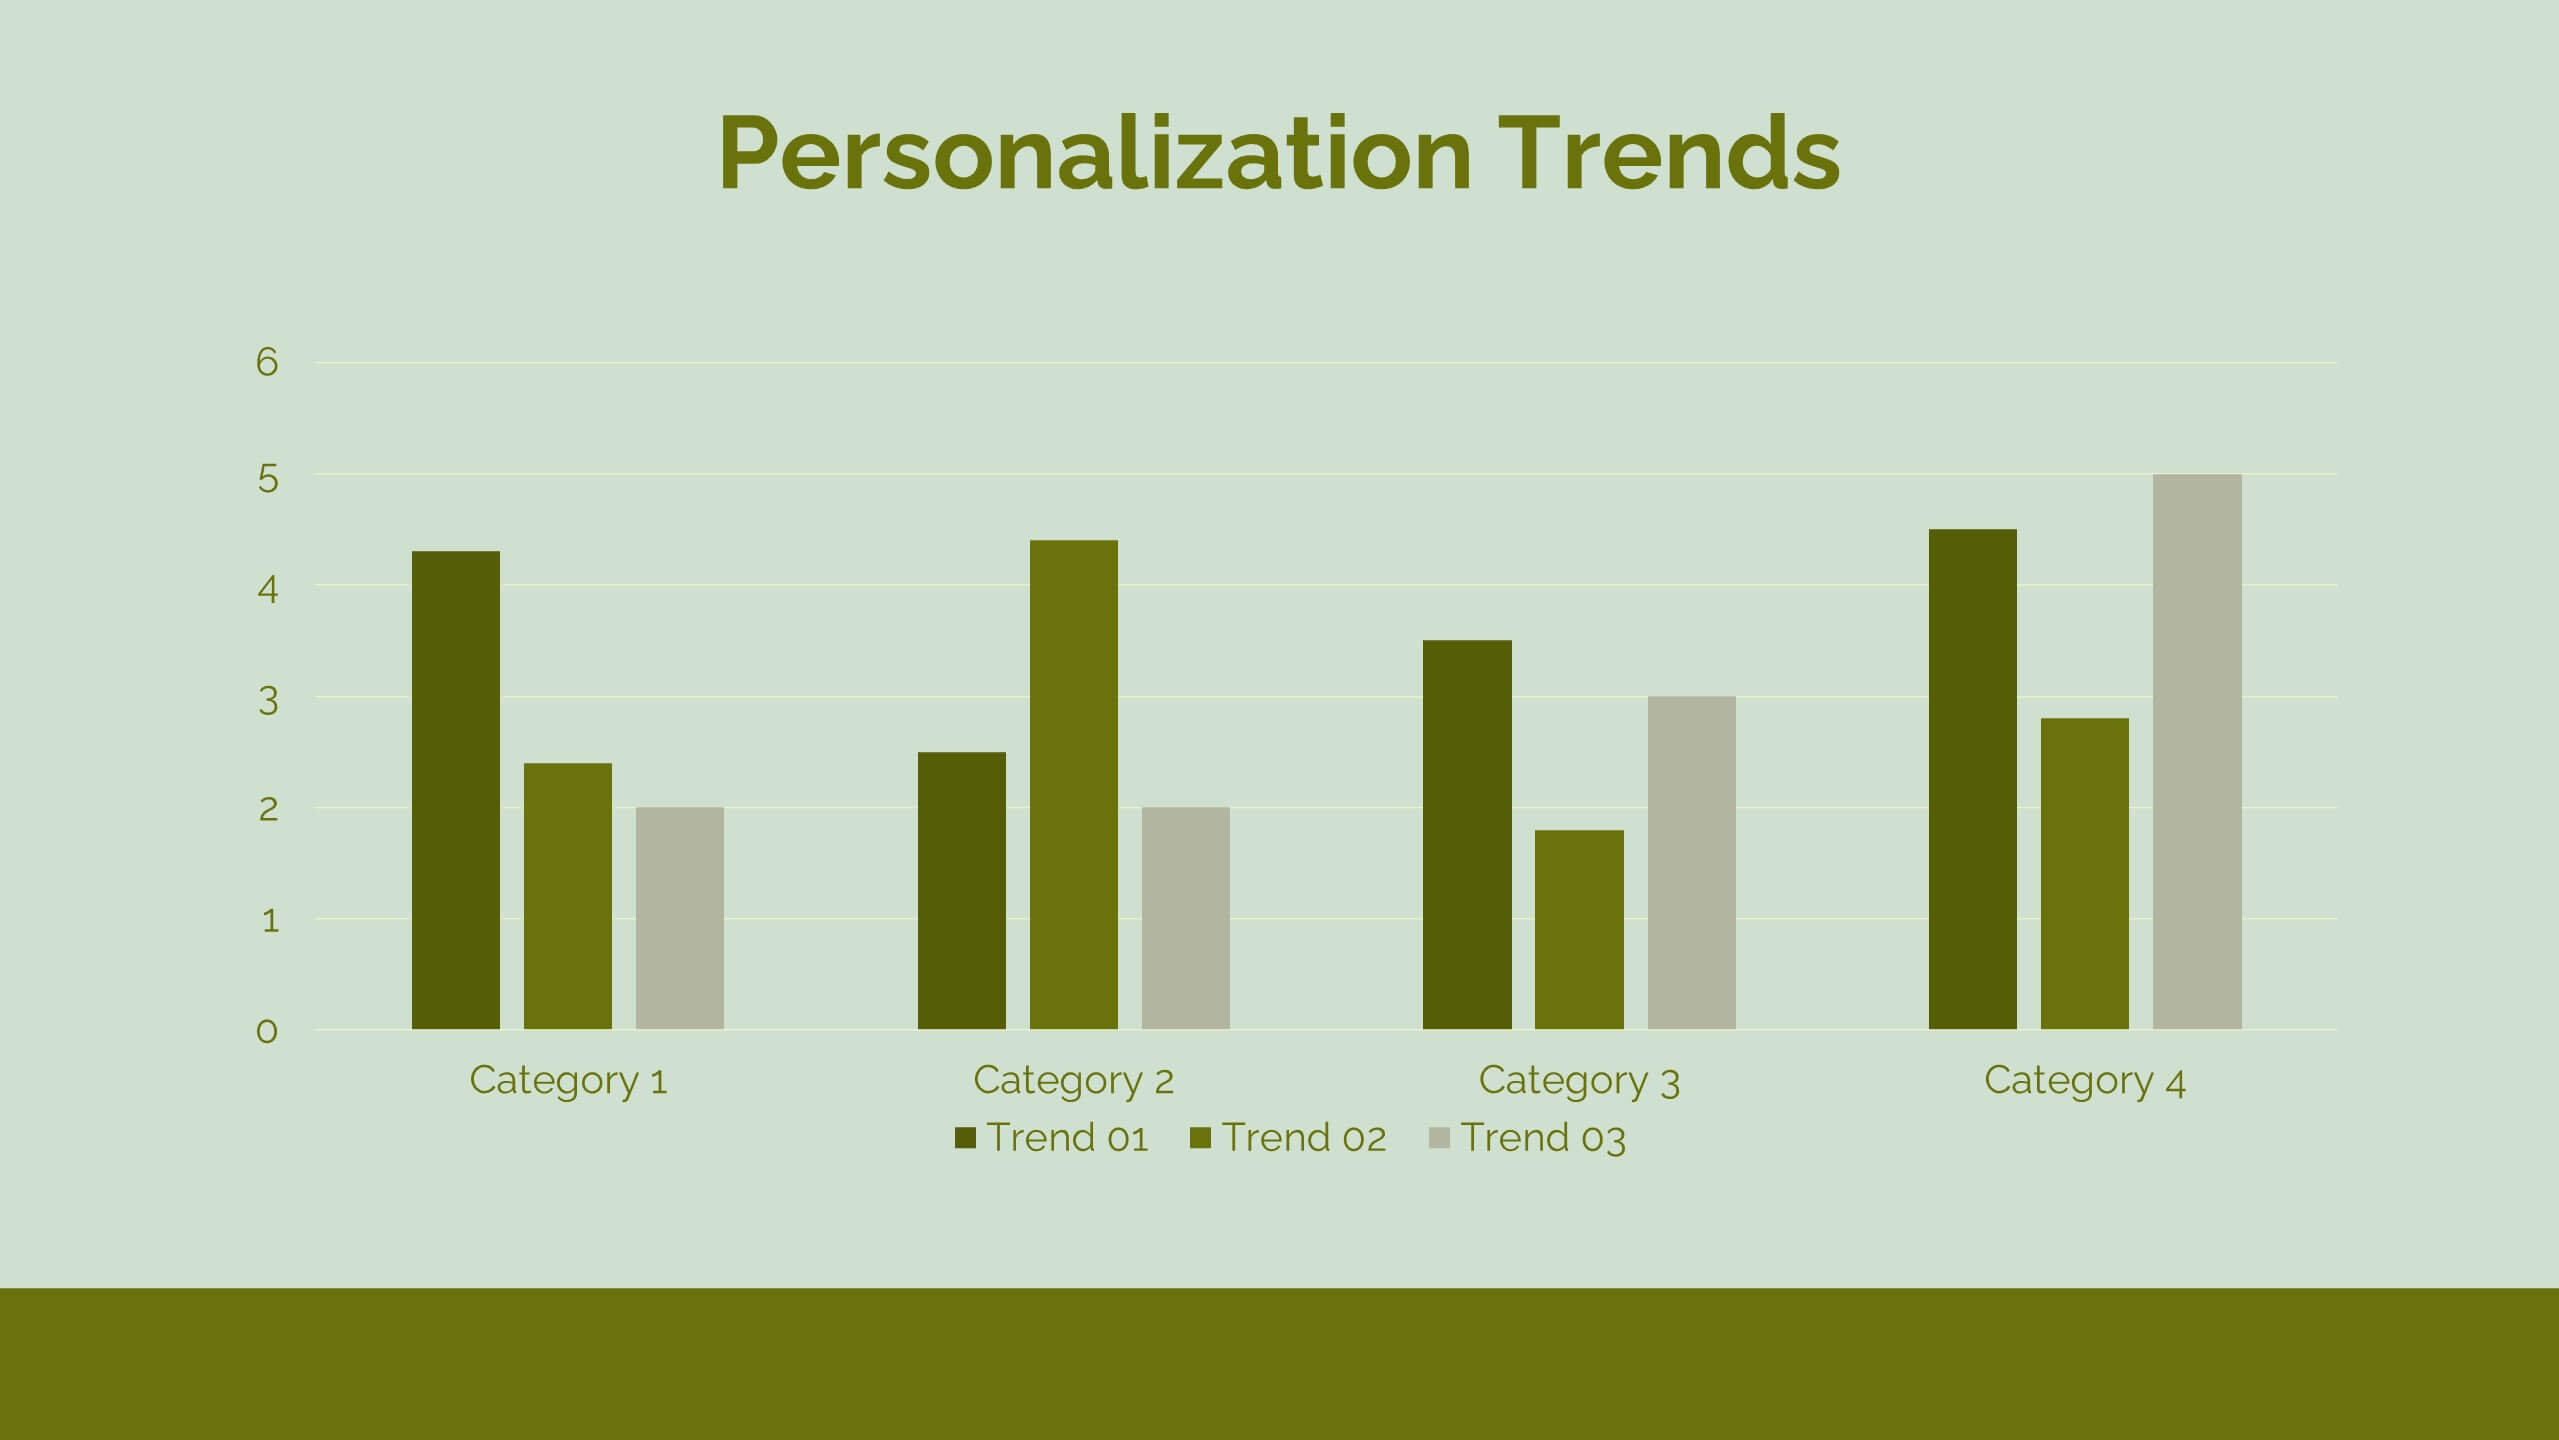
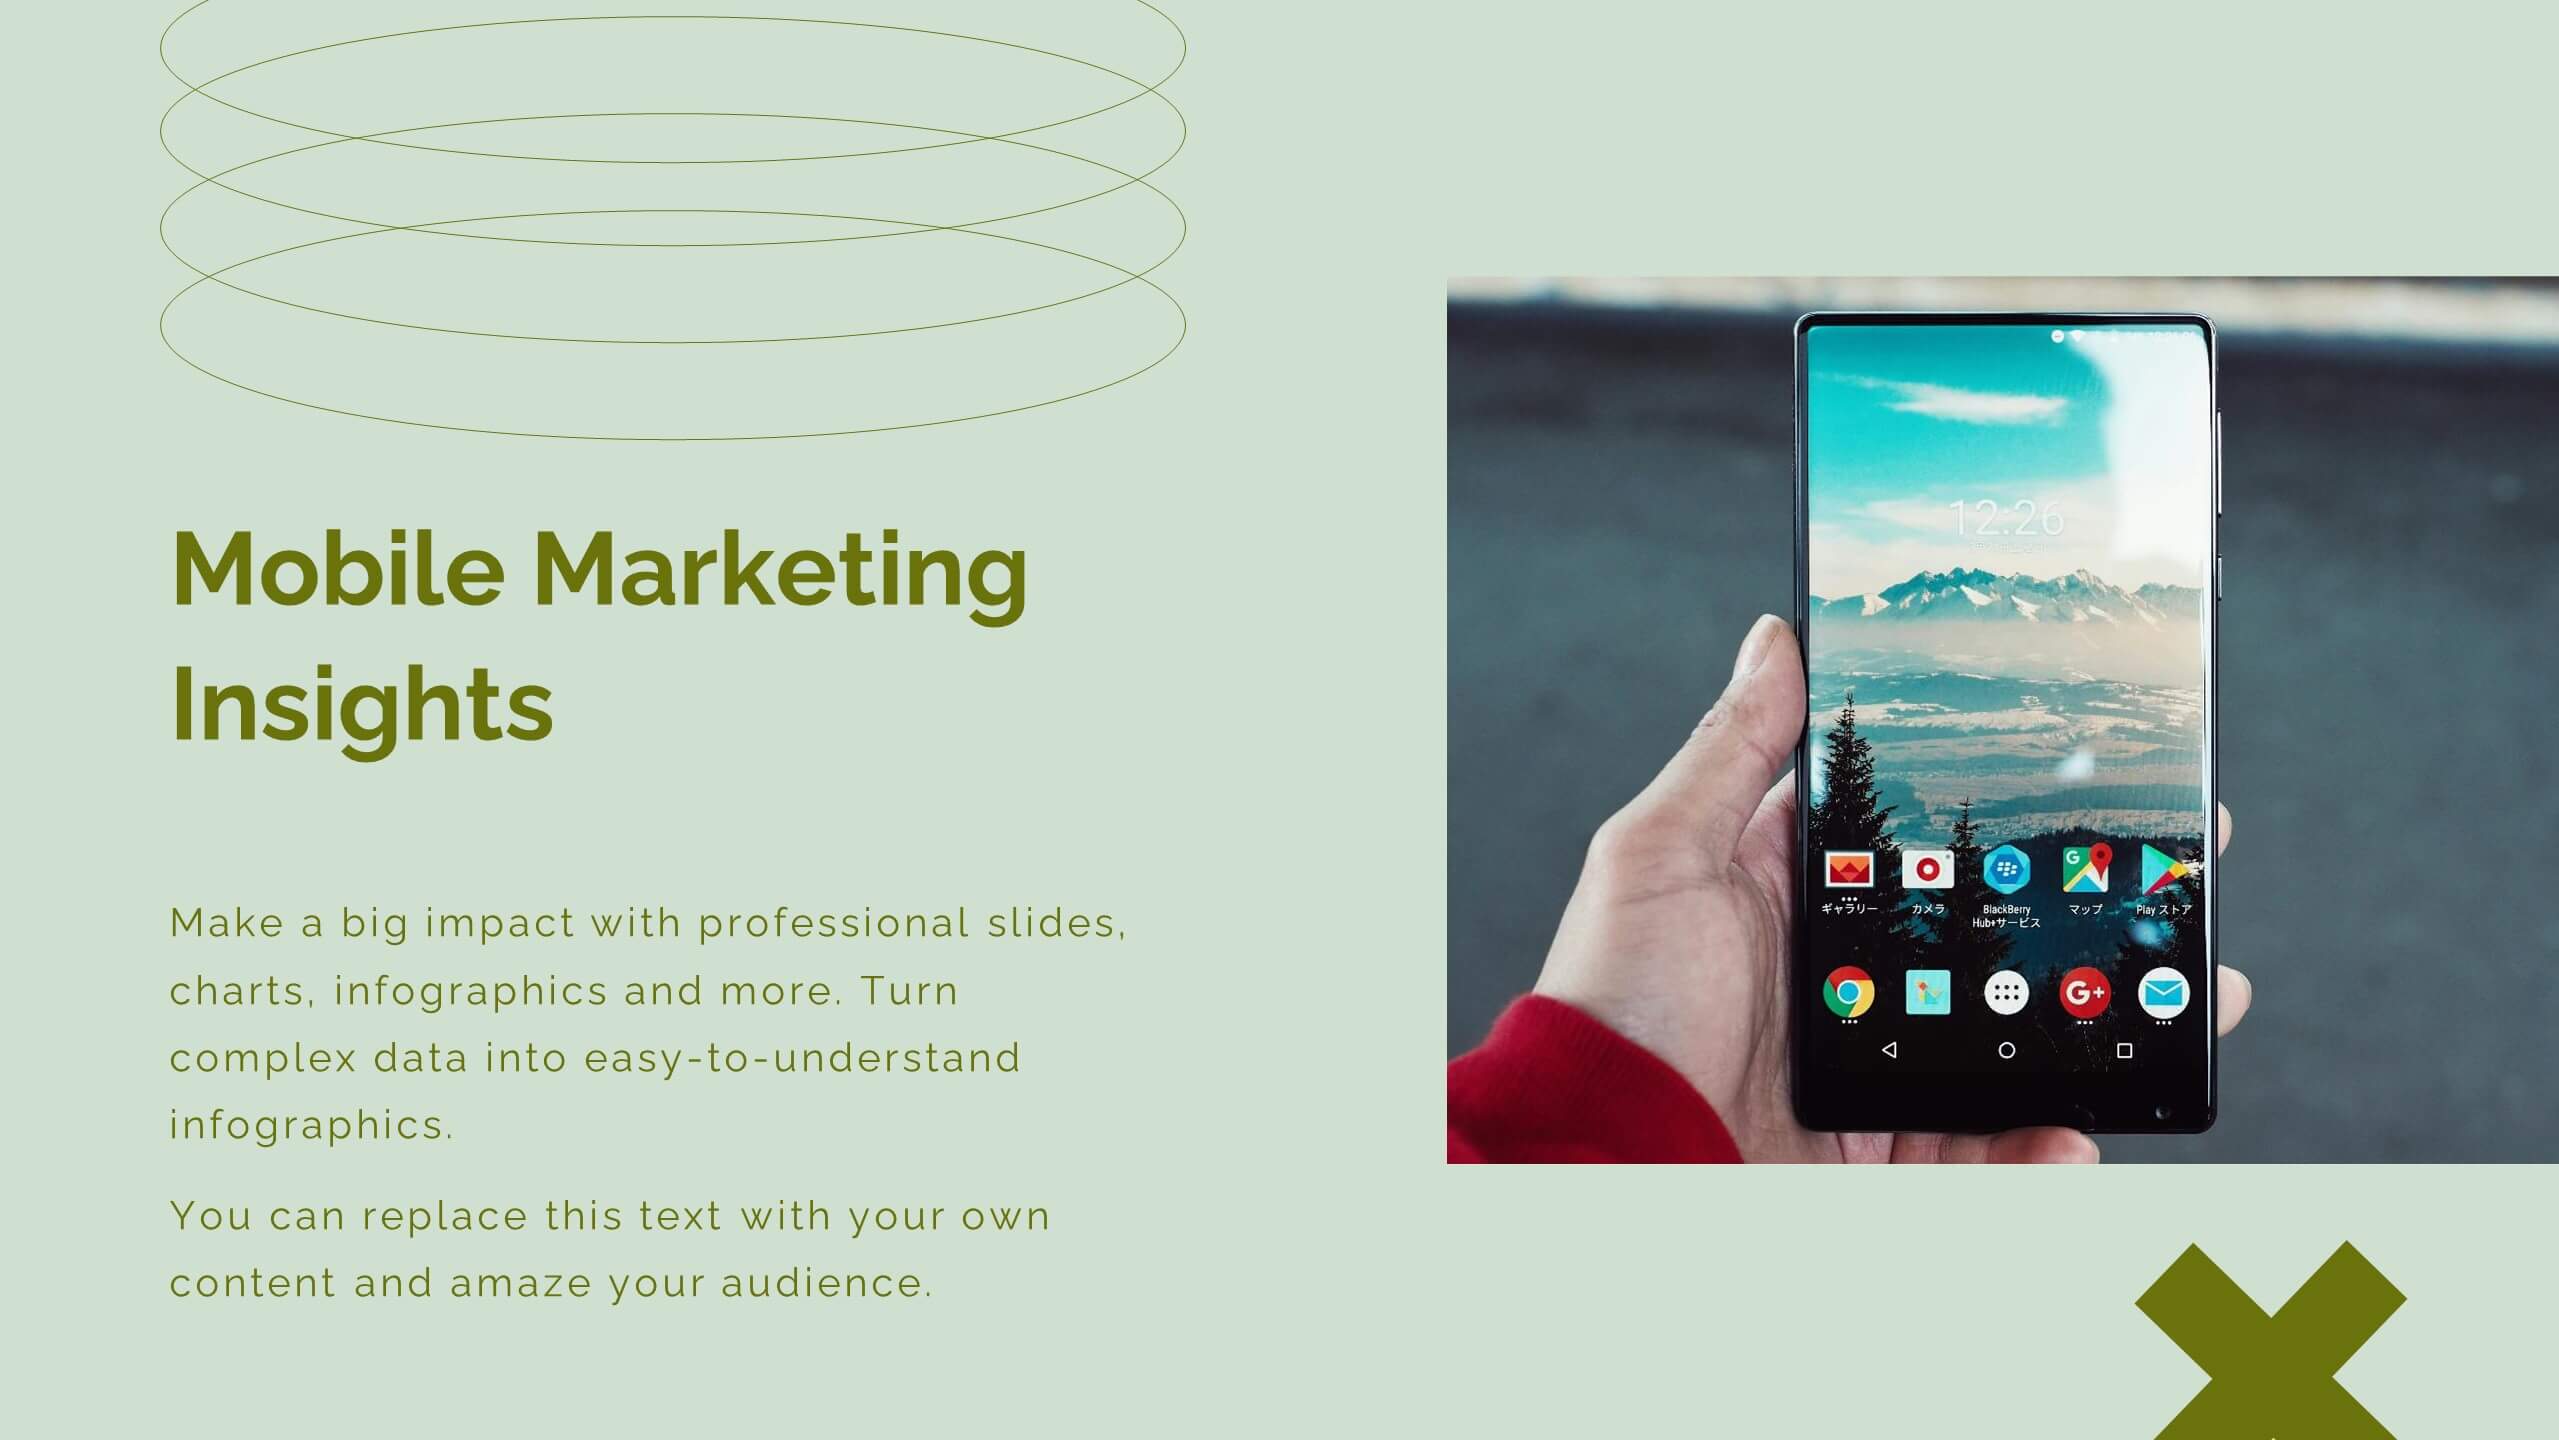
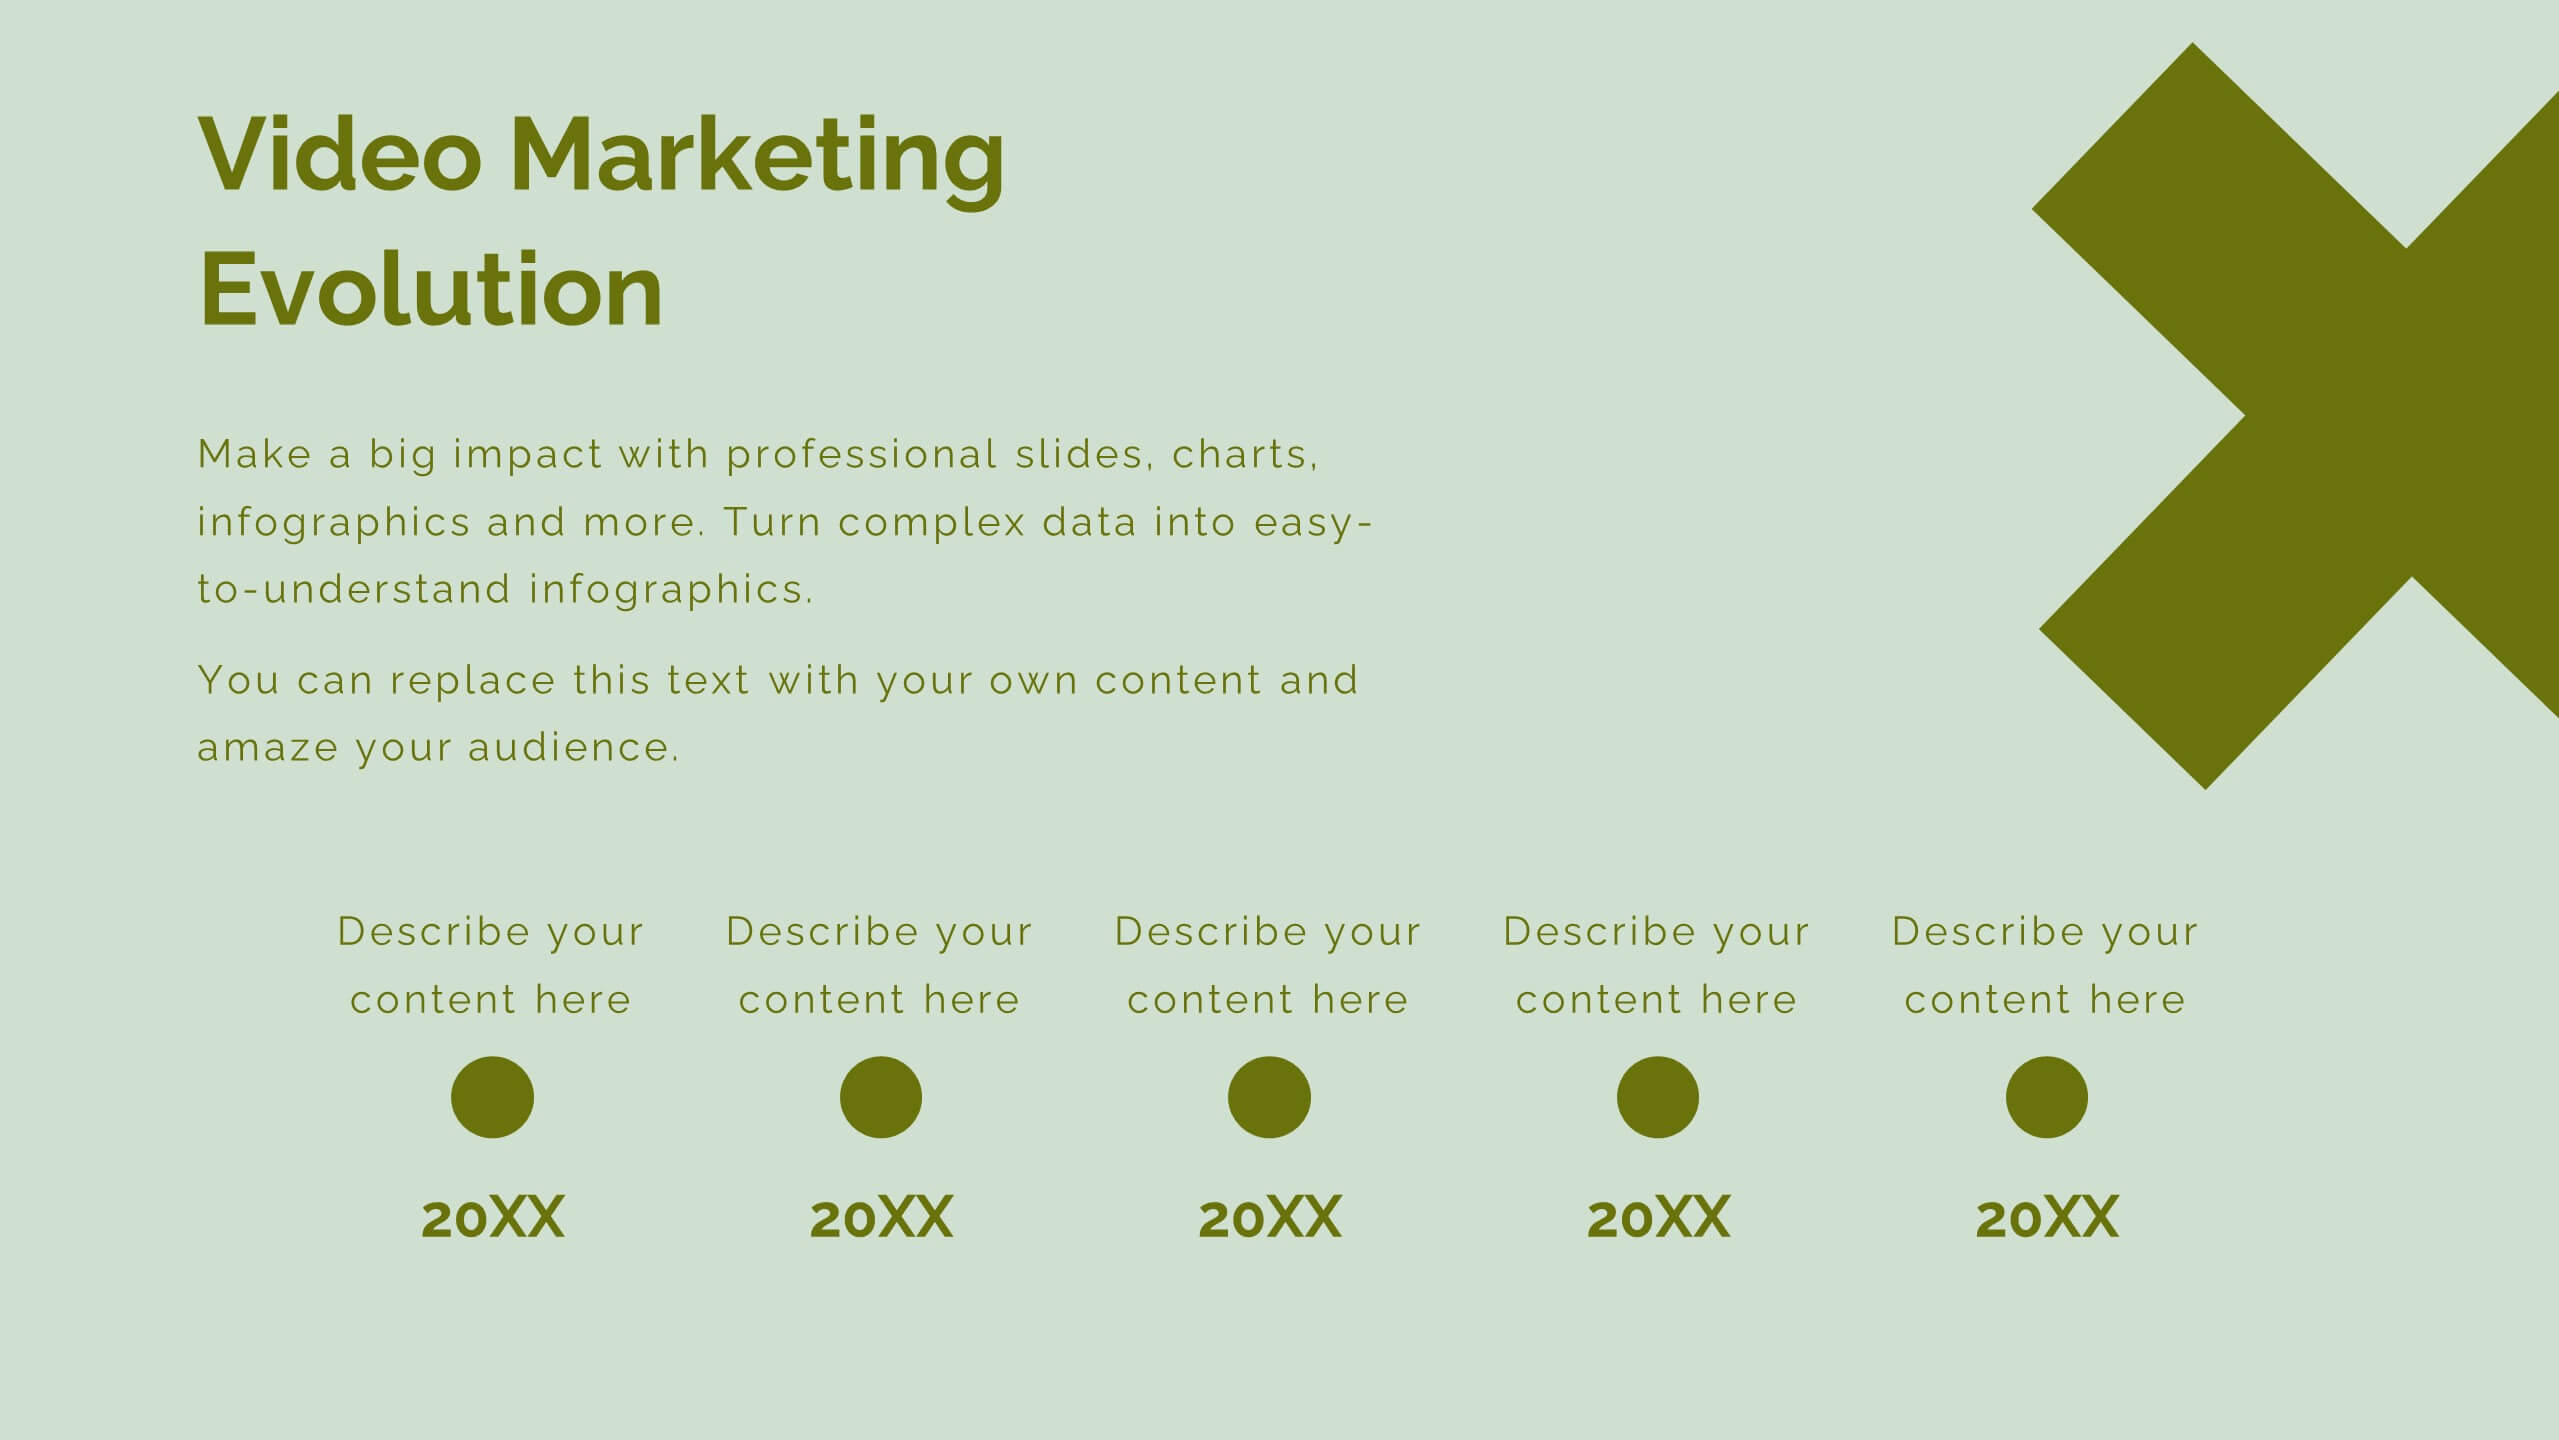
Revamp your digital marketing strategies with this dynamic template! Covering everything from industry overviews and consumer behavior analysis to emerging technologies and social media strategies, this template has it all. Perfect for creating compelling presentations that highlight data-driven marketing and brand storytelling. Compatible with PowerPoint, Keynote, and Google Slides.


7 slides
Porter's Five Forces Infographics Presentation Template
Porter's Five Forces model is a framework for analyzing the competitive environment of an industry. The five forces are: threat of new entrants, bargaining power of suppliers, bargaining power of buyers, threat of substitute products or services, and rivalry among existing competitors. By using this template to analyze these five forces, you can gain a better understanding of the industry's environment and make more strategic decisions. Use this template to help your business analyze. This will help you make a great presentation evaluating the potential profitability of entering a new market.


3 slides
Hierarchy of Needs Pyramid Visual Presentation
Simplify complex priorities with this Hierarchy of Needs Pyramid Visual presentation. Designed to illustrate layered structures or business priorities, this editable 3D-style pyramid highlights three distinct tiers with customizable text and bold letter labels. Perfect for strategy slides or organizational models in Canva, PowerPoint, or Google Slides.


6 slides
Six Sigma Certification Infographics
Explore the world of Six Sigma Certification with our customizable infographic template. This template is fully compatible with popular presentation software like PowerPoint, Keynote, and Google Slides, allowing you to easily customize it to illustrate and communicate various aspects of Six Sigma certification and its benefits. The Six Sigma Certification infographic template offers a visually engaging platform to outline the different levels of certification, the DMAIC methodology, and the impact of Six Sigma on quality improvement within organizations. Whether you're a quality professional, project manager, or someone looking to enhance your process improvement skills, this template provides a user-friendly canvas to create informative presentations and educational materials. Deepen your knowledge of Six Sigma Certification with this SEO-optimized infographic template, thoughtfully designed for clarity and ease of use. Customize it to showcase the certification requirements, training options, project success stories, and the potential for career advancement, ensuring that your audience gains valuable insights into the world of Six Sigma. Start crafting your personalized infographic today to explore the realm of Six Sigma Certification.


6 slides
Personal Goals Infographics
The "Personal Goals" infographic template is a highly motivational and visually engaging resource, crafted specifically for PowerPoint, Keynote, and Google Slides. This template is perfect for life coaches, educators, and individuals looking to visually articulate their personal objectives and action plans. This template adeptly encapsulates key facets of personal goal setting, including short-term and long-term objectives, milestones, and strategies for achievement. The design promotes a clear depiction of each goal, along with the steps and timelines necessary for success. This makes it an invaluable tool for personal development workshops, coaching sessions, or even individual self-reflection and planning. The aesthetic of the template is uplifting and focused, with a color scheme that inspires positivity and determination. This not only makes the presentation visually appealing but also resonates with the theme of personal growth and ambition. Whether used for motivational seminars, educational purposes, or personal planning, this template ensures that the journey towards personal goals is laid out in a visually stimulating, organized, and inspiring manner.


7 slides
Modern Food Menu Presentation
Bring your ideas to the table with a clean and modern layout that turns any food-related content into an easy, visually appealing story. This presentation helps you showcase dishes, categories, or menu insights with clarity and style, making information simple to follow. Fully compatible with PowerPoint, Keynote, and Google Slides.


5 slides
Product Roadmap Presentation
The "Product Roadmap Infographic" template is ideal for presenting the strategic vision and progressive steps for product development. This template outlines the roadmap through a creative and visually engaging route-style layout, designed to highlight key milestones and stages in the product lifecycle, from conception to launch. Each point on the roadmap is clearly marked for specific goals or achievements, encouraging clarity and understanding among stakeholders about the direction and progress of the product. This layout is perfect for product managers and teams to communicate timelines, prioritize tasks, and align goals during presentations in corporate settings.


3 slides
Governance and Compliance Framework Presentation
Strengthen your organization's structure with our Governance and Compliance Framework template. This visually compelling template is crafted to effectively communicate the integration of governance, compliance, and risk management. It is ideal for demonstrating how these elements collaborate to uphold regulatory standards and manage business risks. Fully compatible with PowerPoint, Keynote, and Google Slides, it's an essential tool for any corporate governance presentation aimed at promoting effective, compliant business practices.


5 slides
Cyber Security Management Infographics
Cyber Security Management is important because it helps to protect organizations from cyber threats and attacks. These Infographics are visual representations of information related to the management of cyber security. This template can be used to provide summaries on the various aspects of cyber security management such as risk assessment, security policies, threat detection and response, and data protection. These infographics are designed to help individuals and organizations understand the importance of cyber security management and the steps that need to be taken to ensure the security of their systems and data.


8 slides
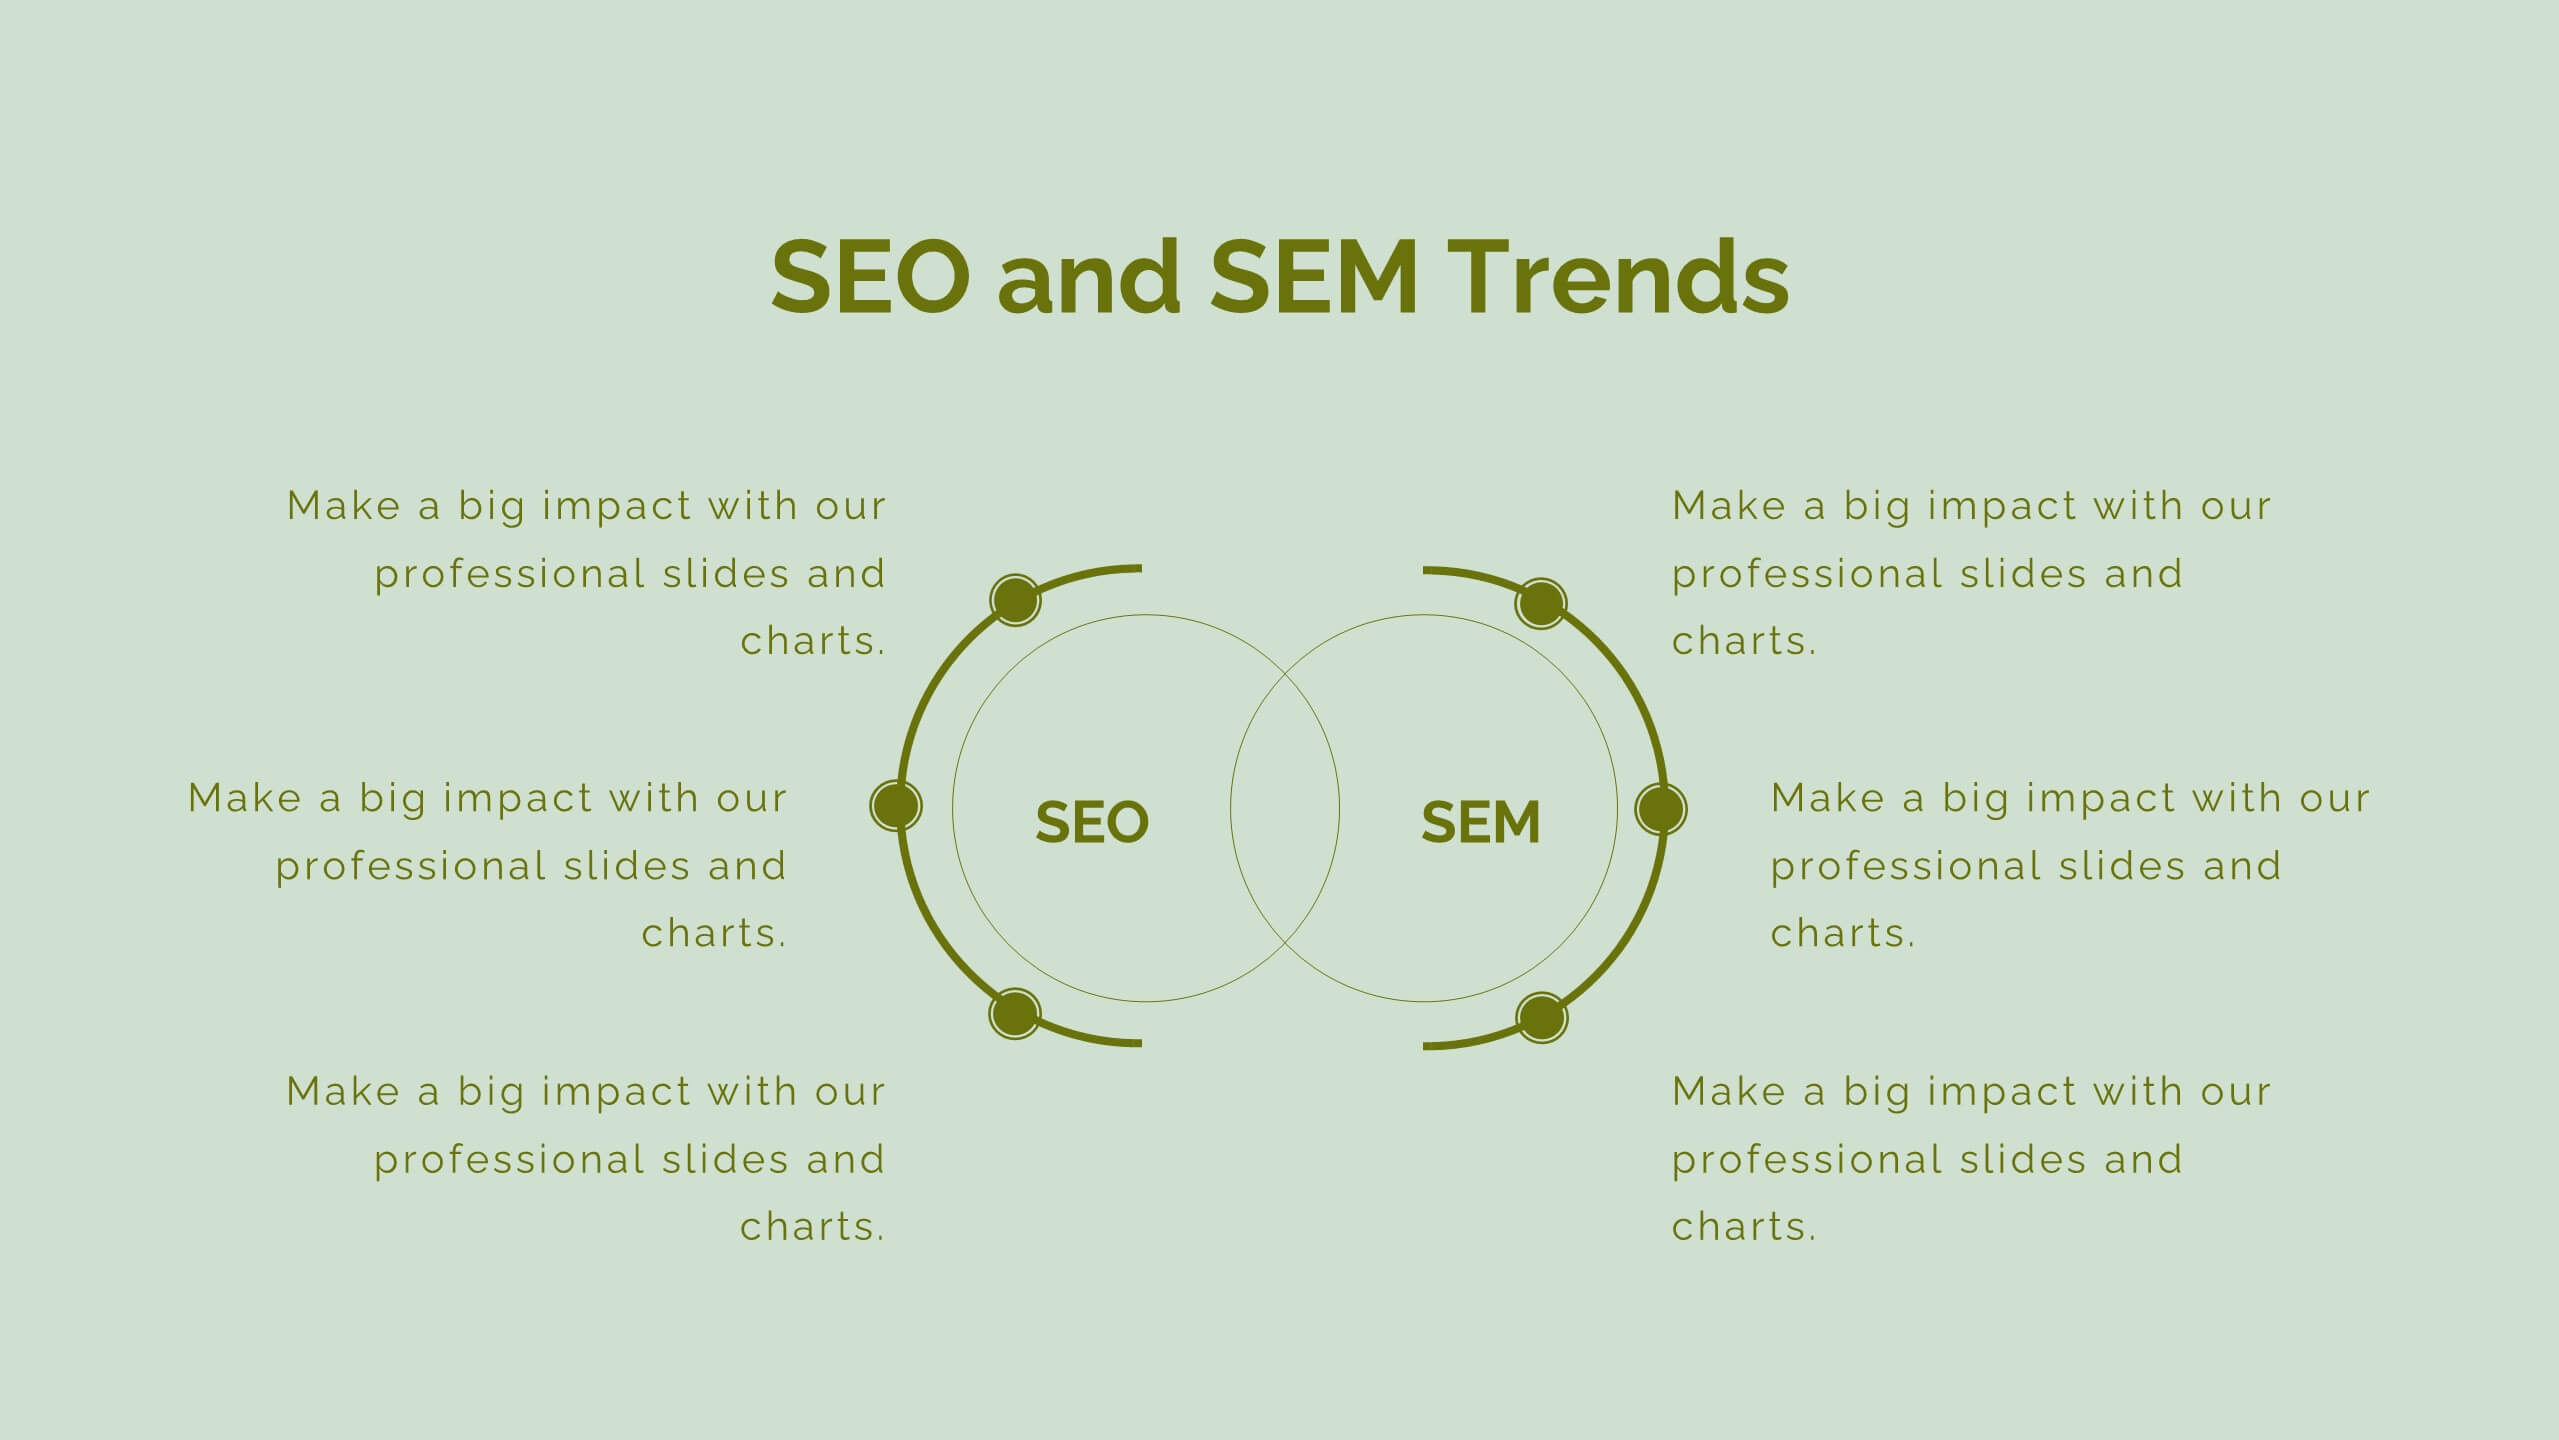
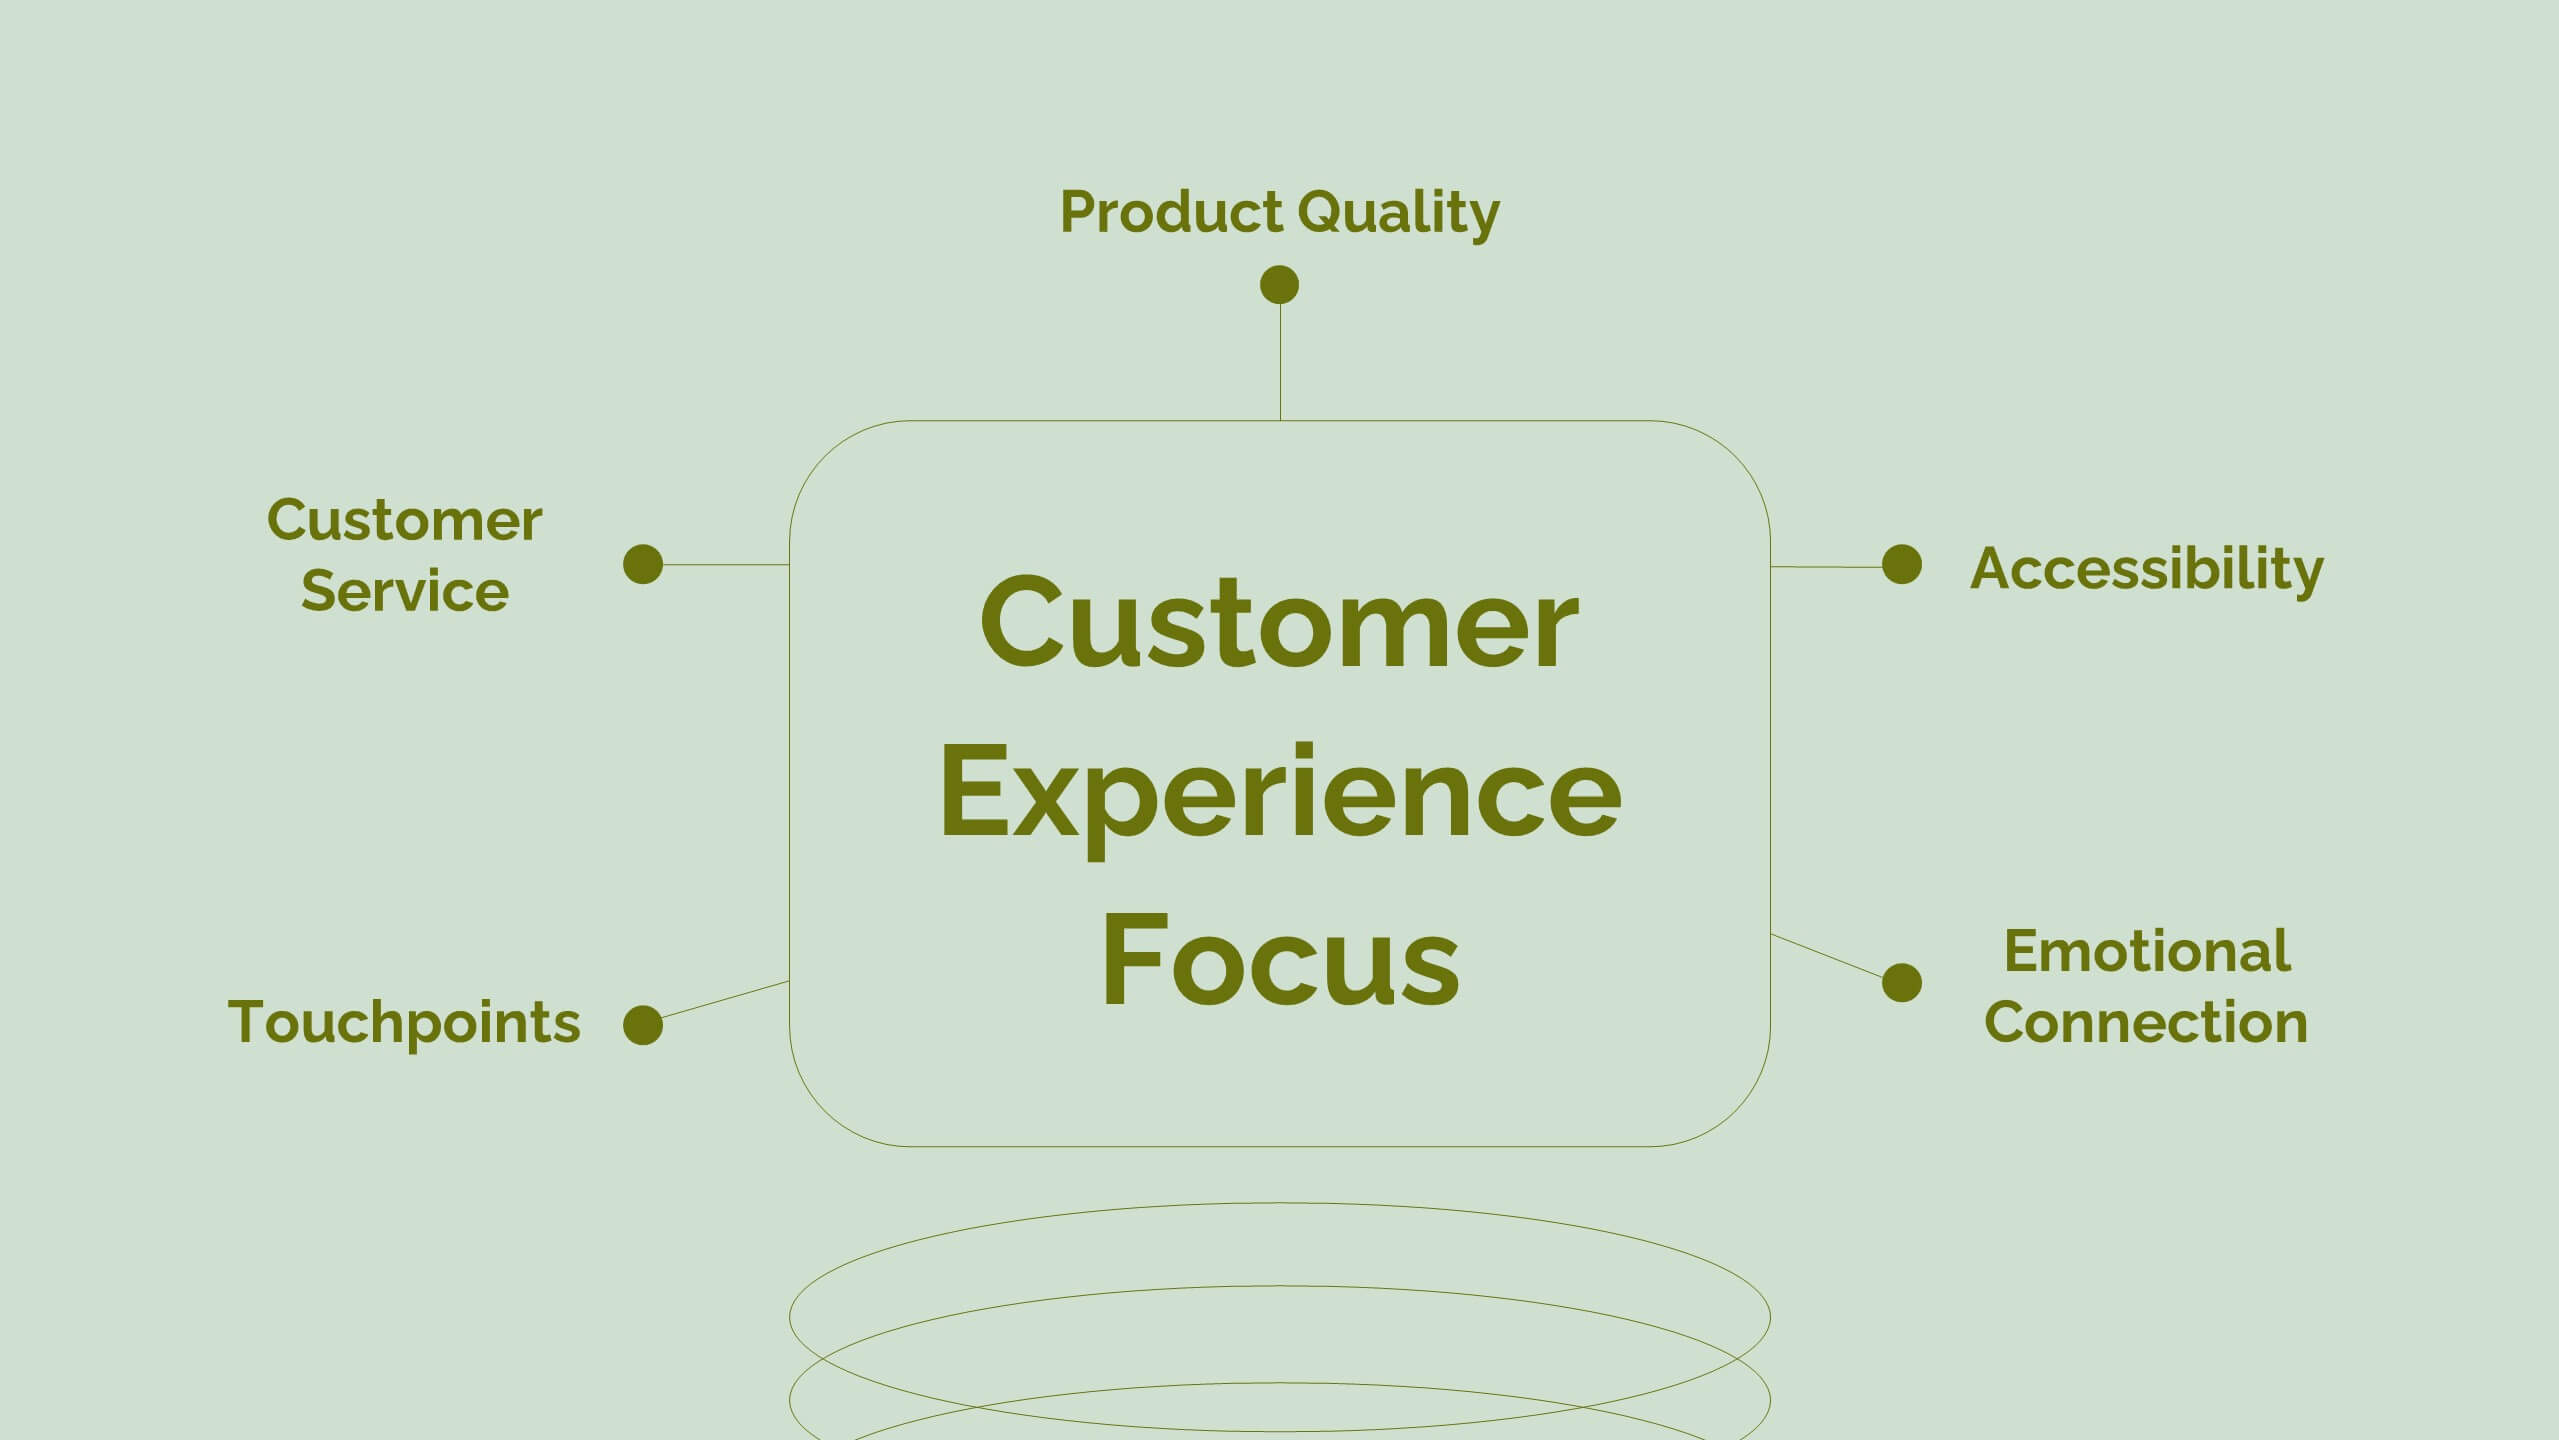
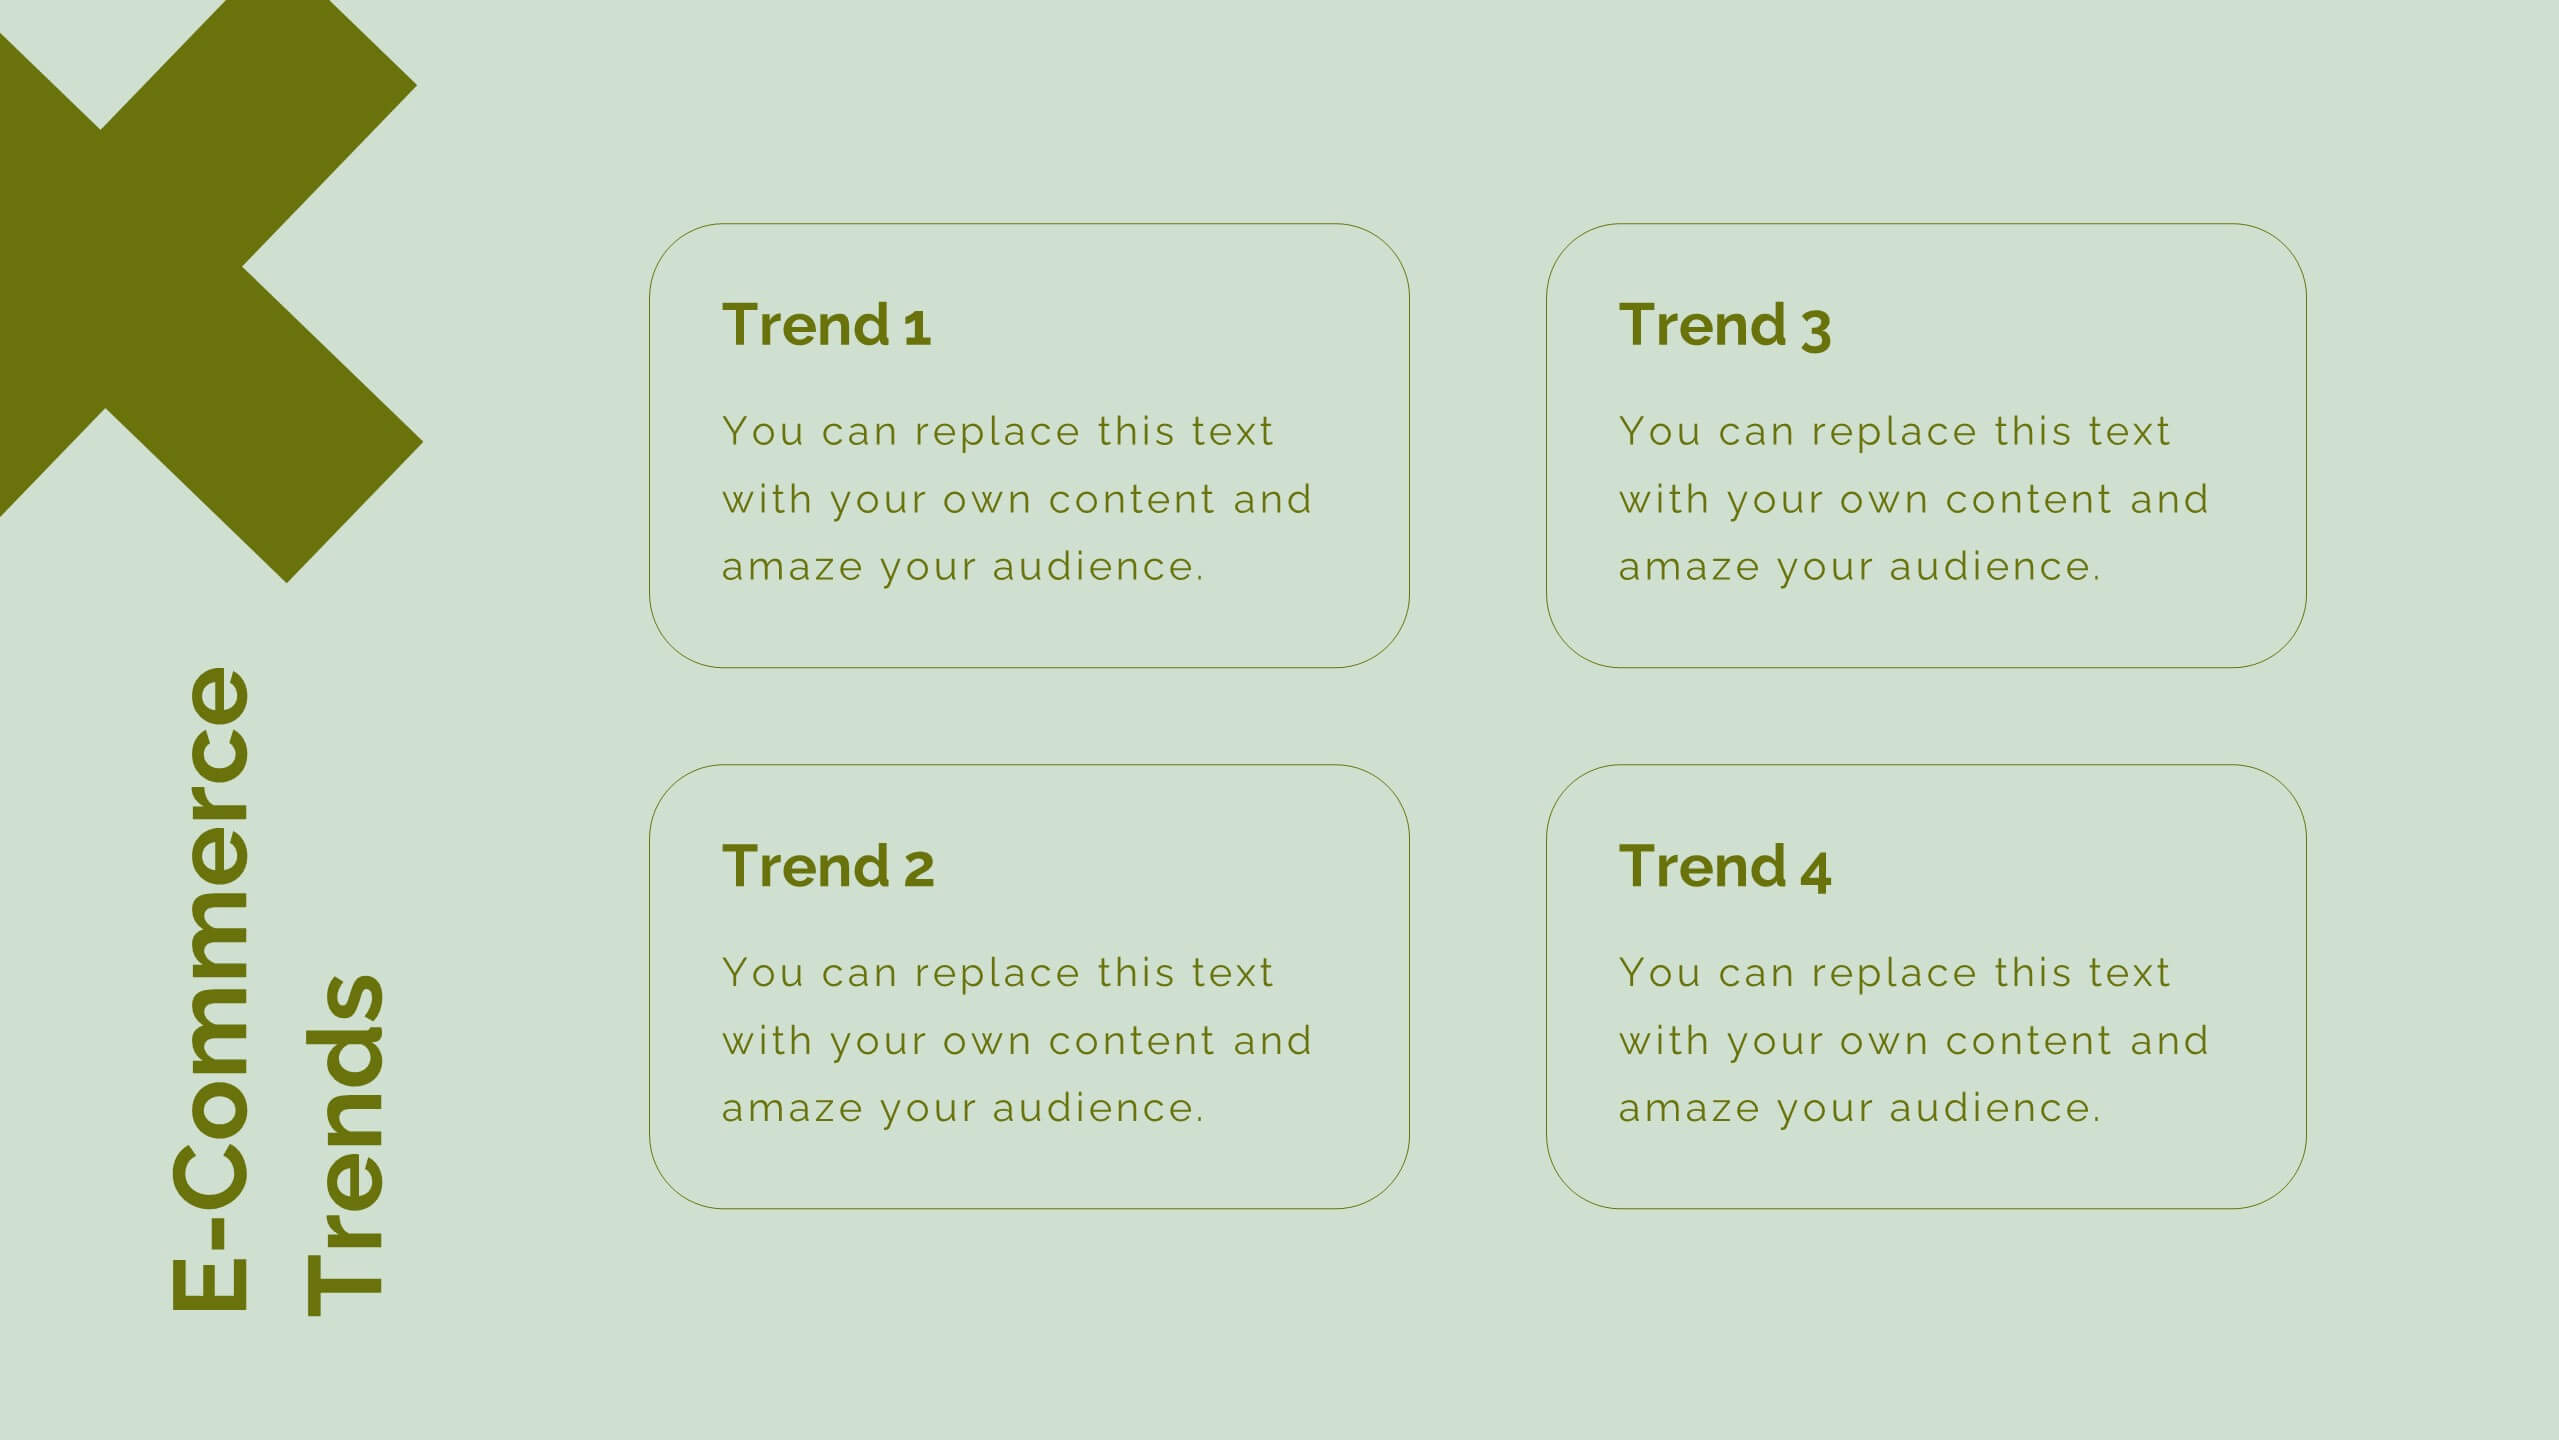
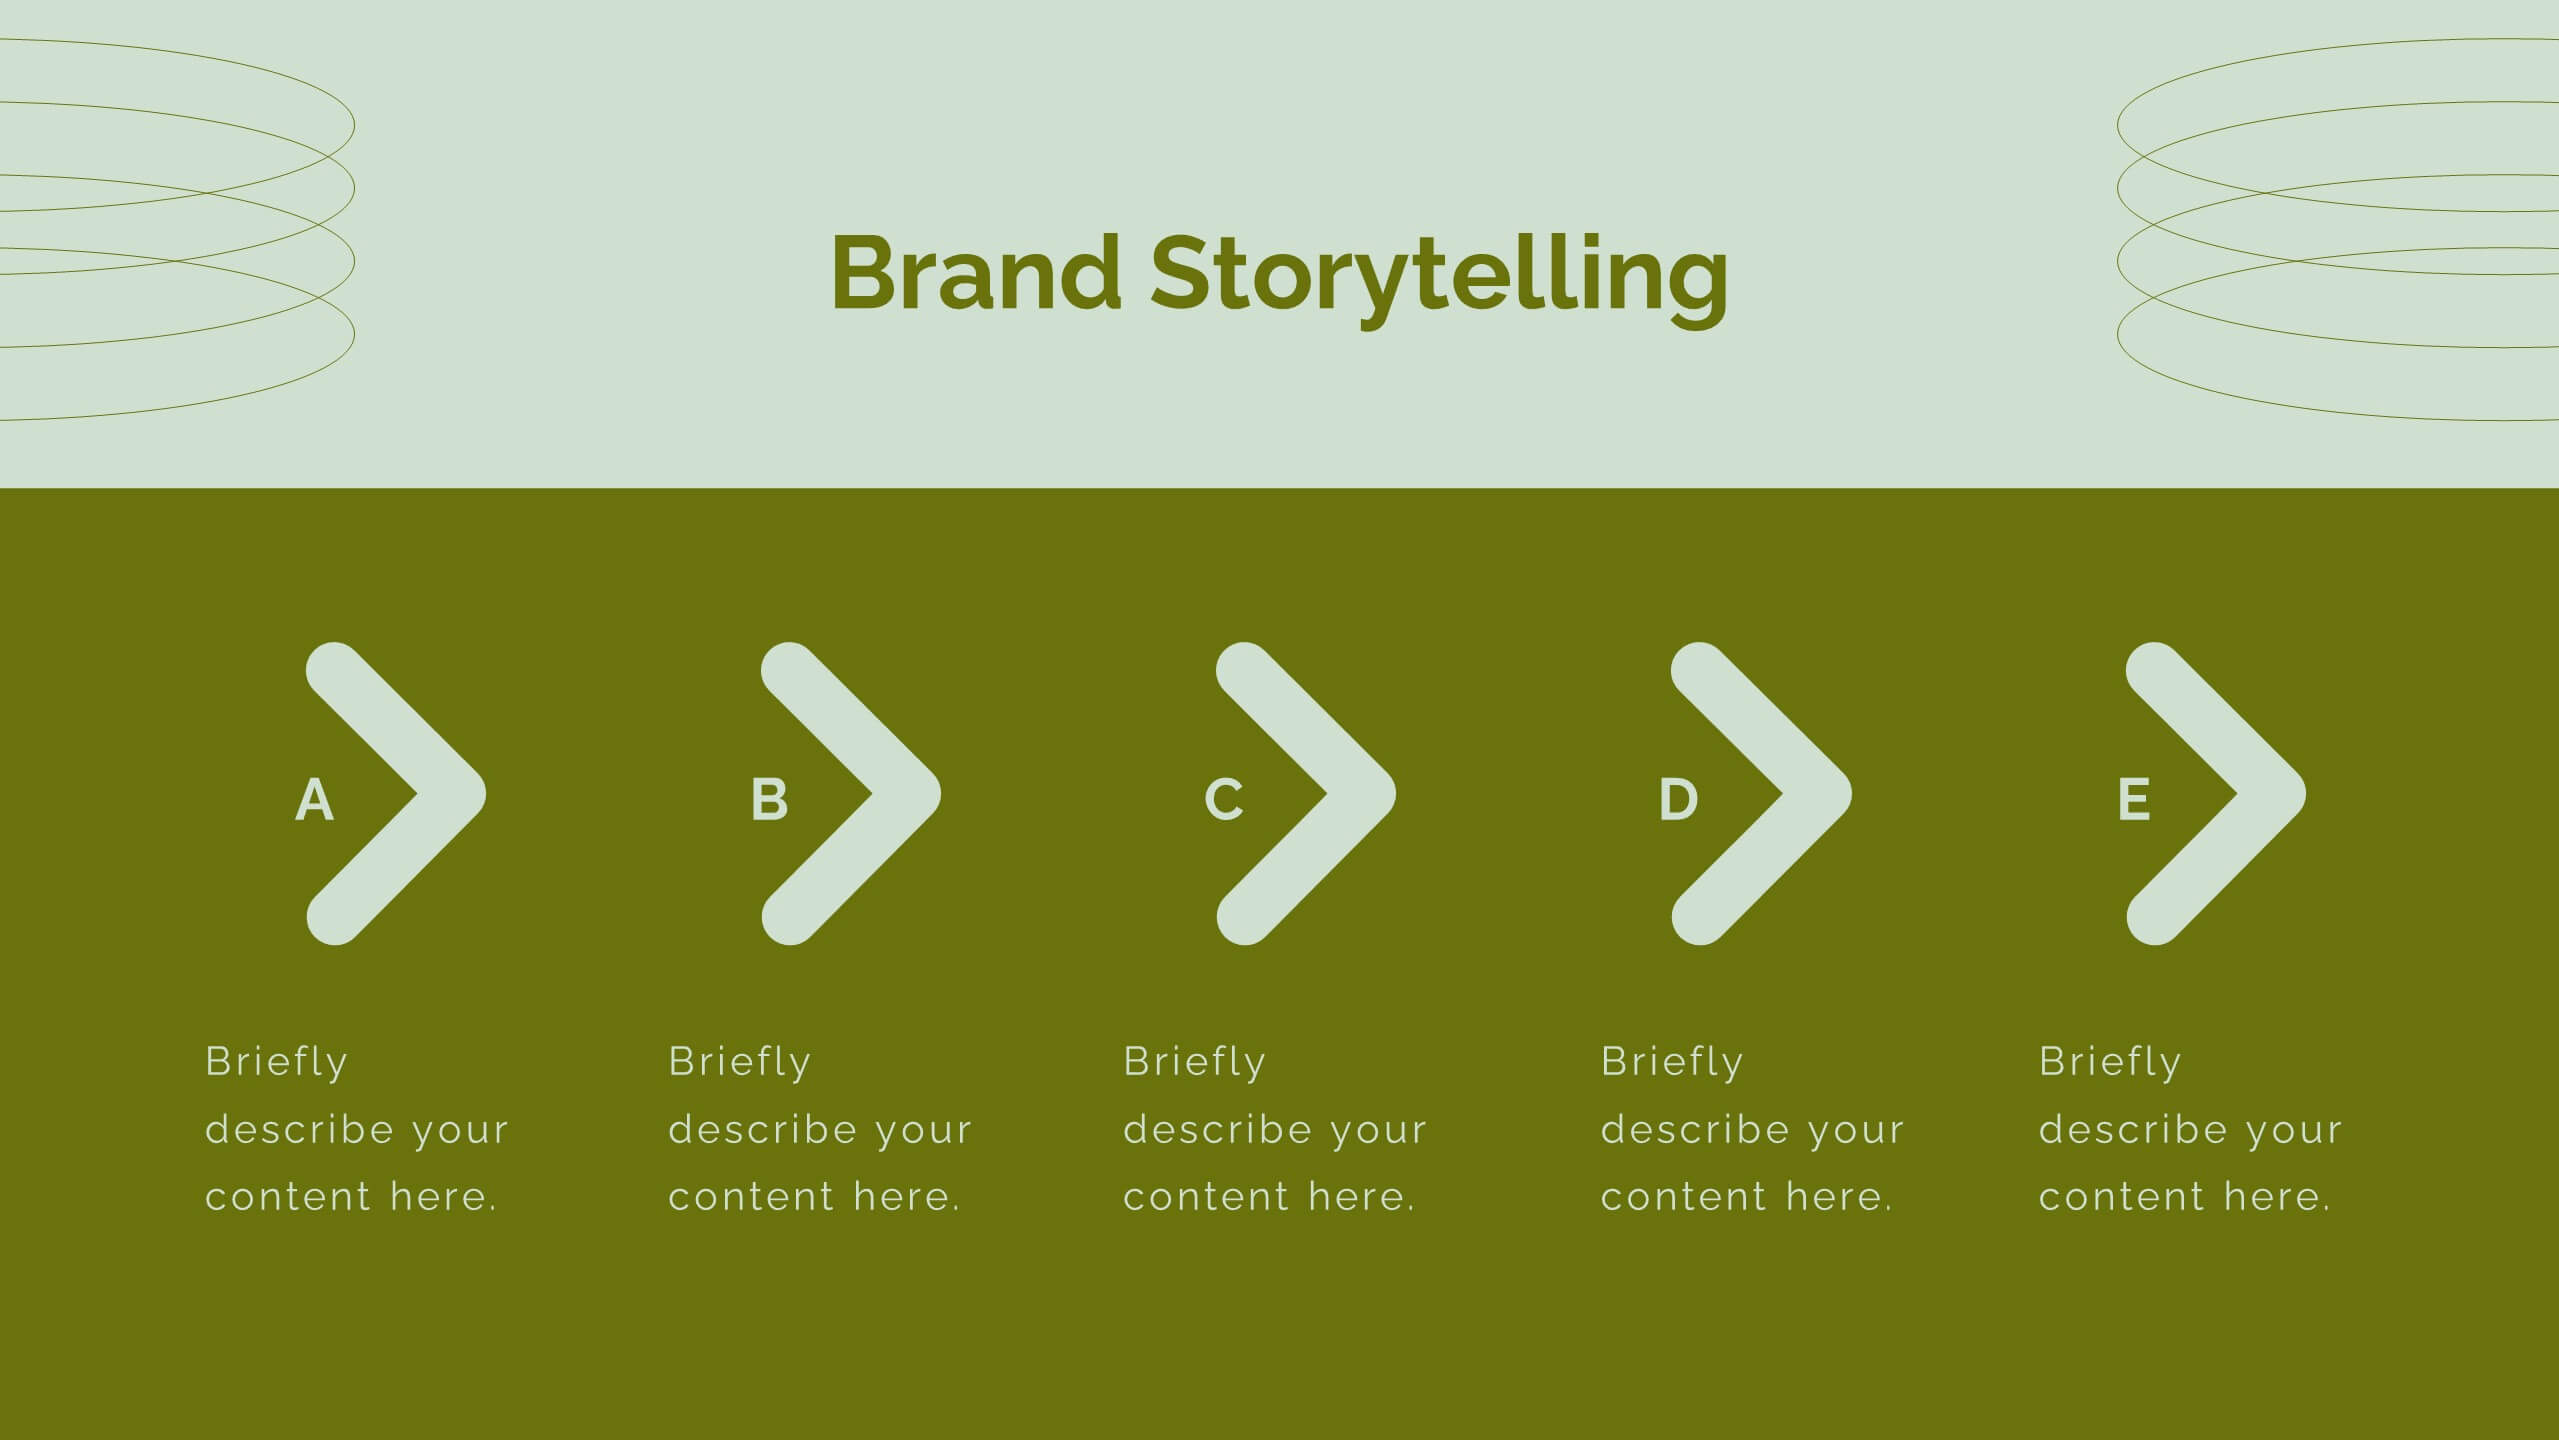
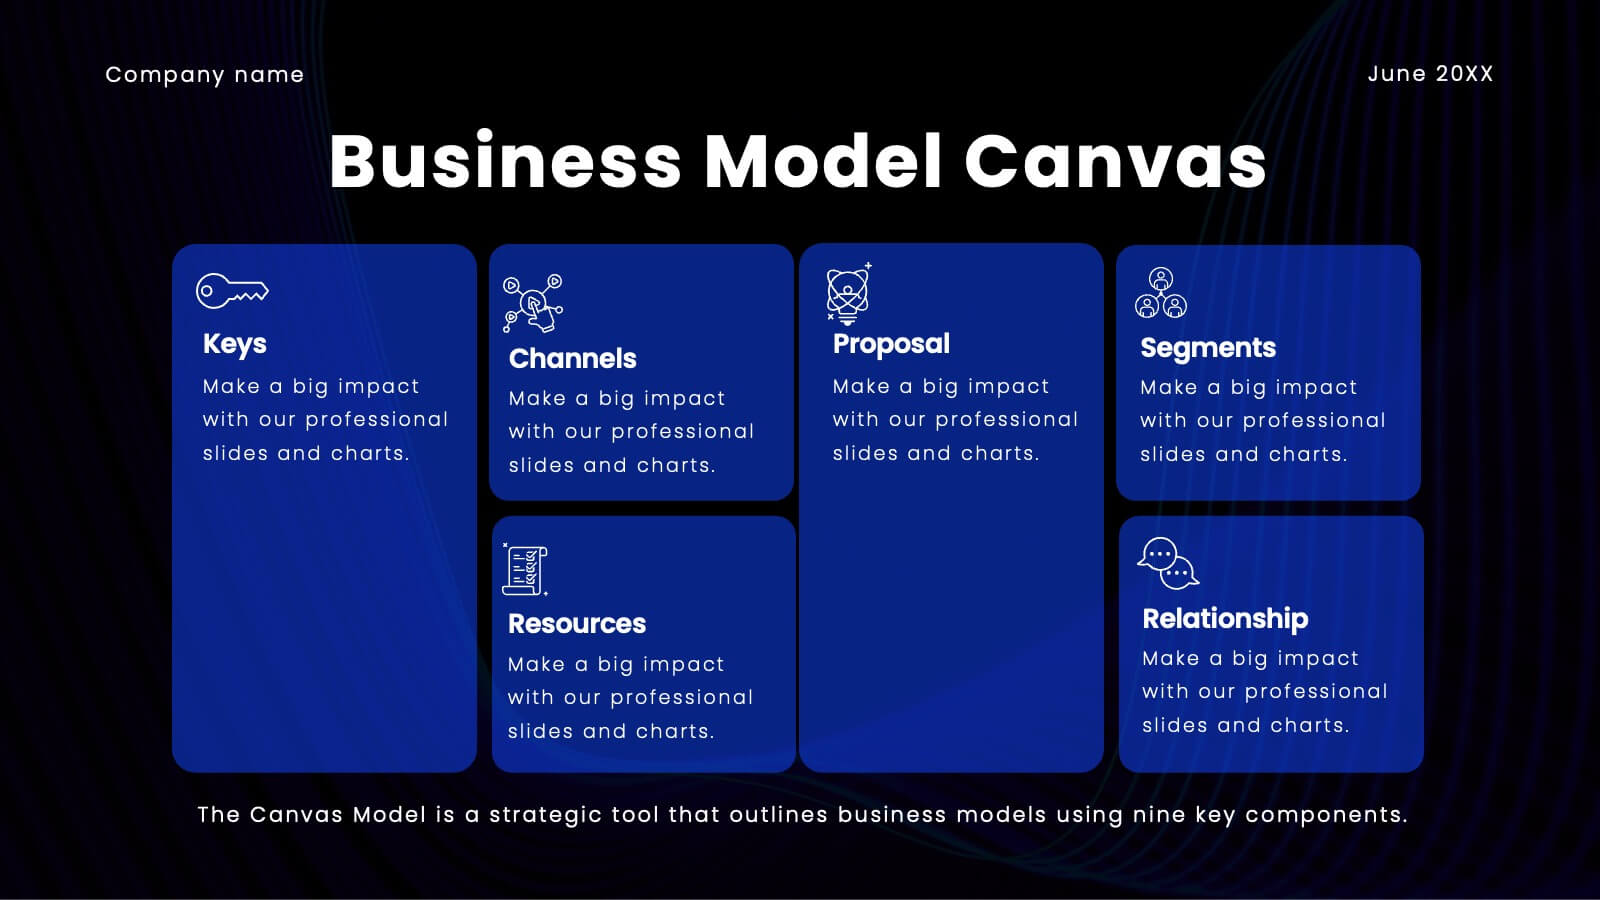
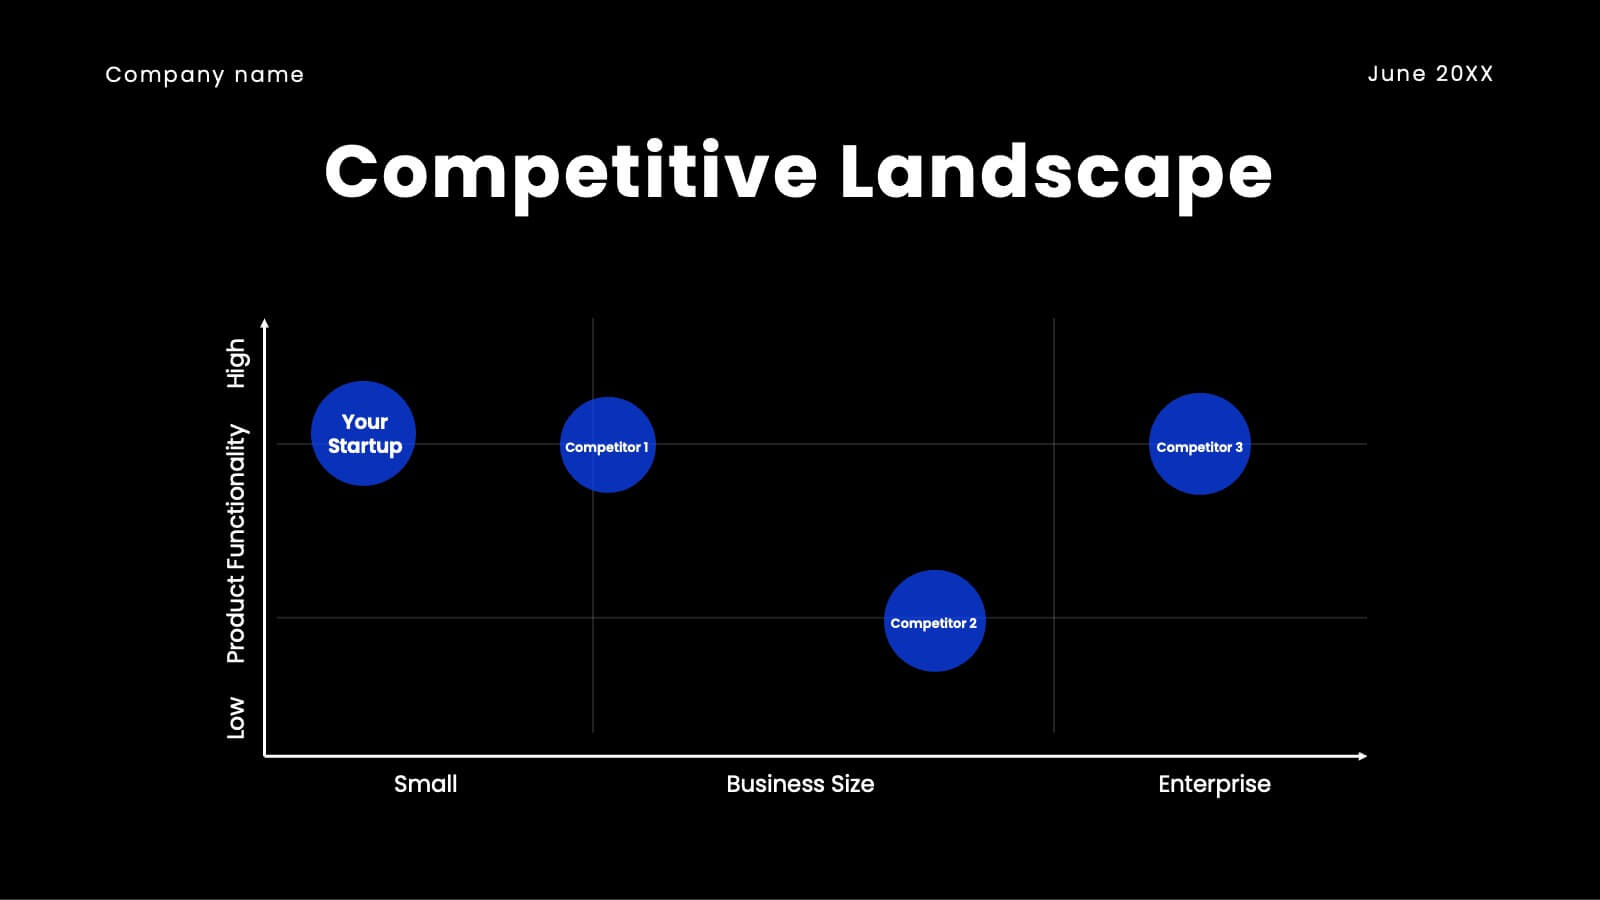
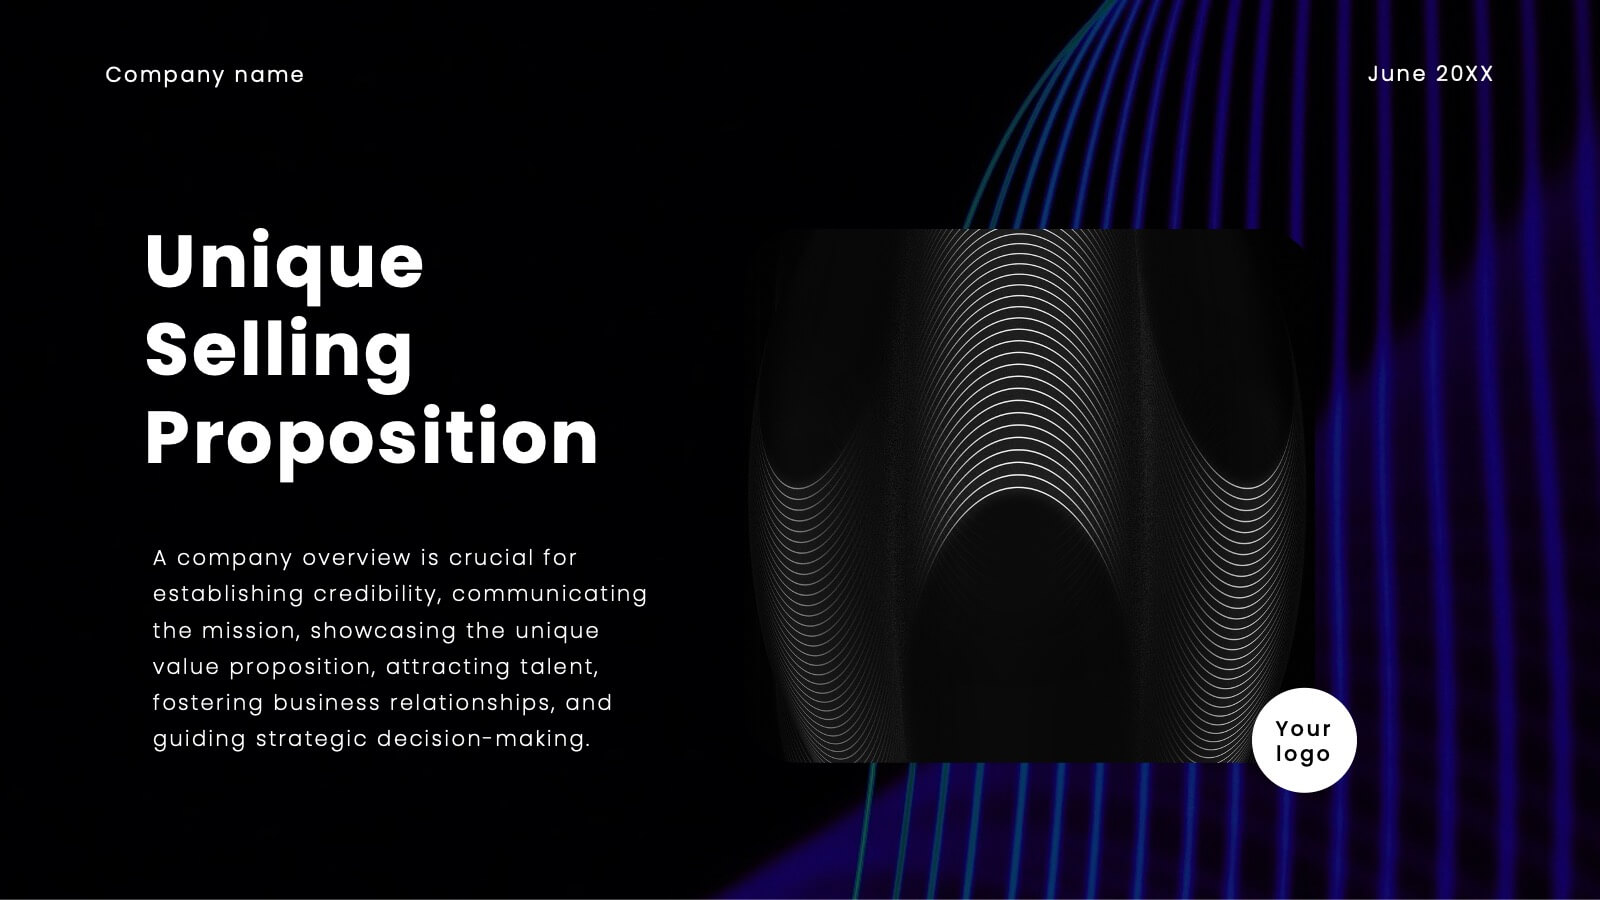
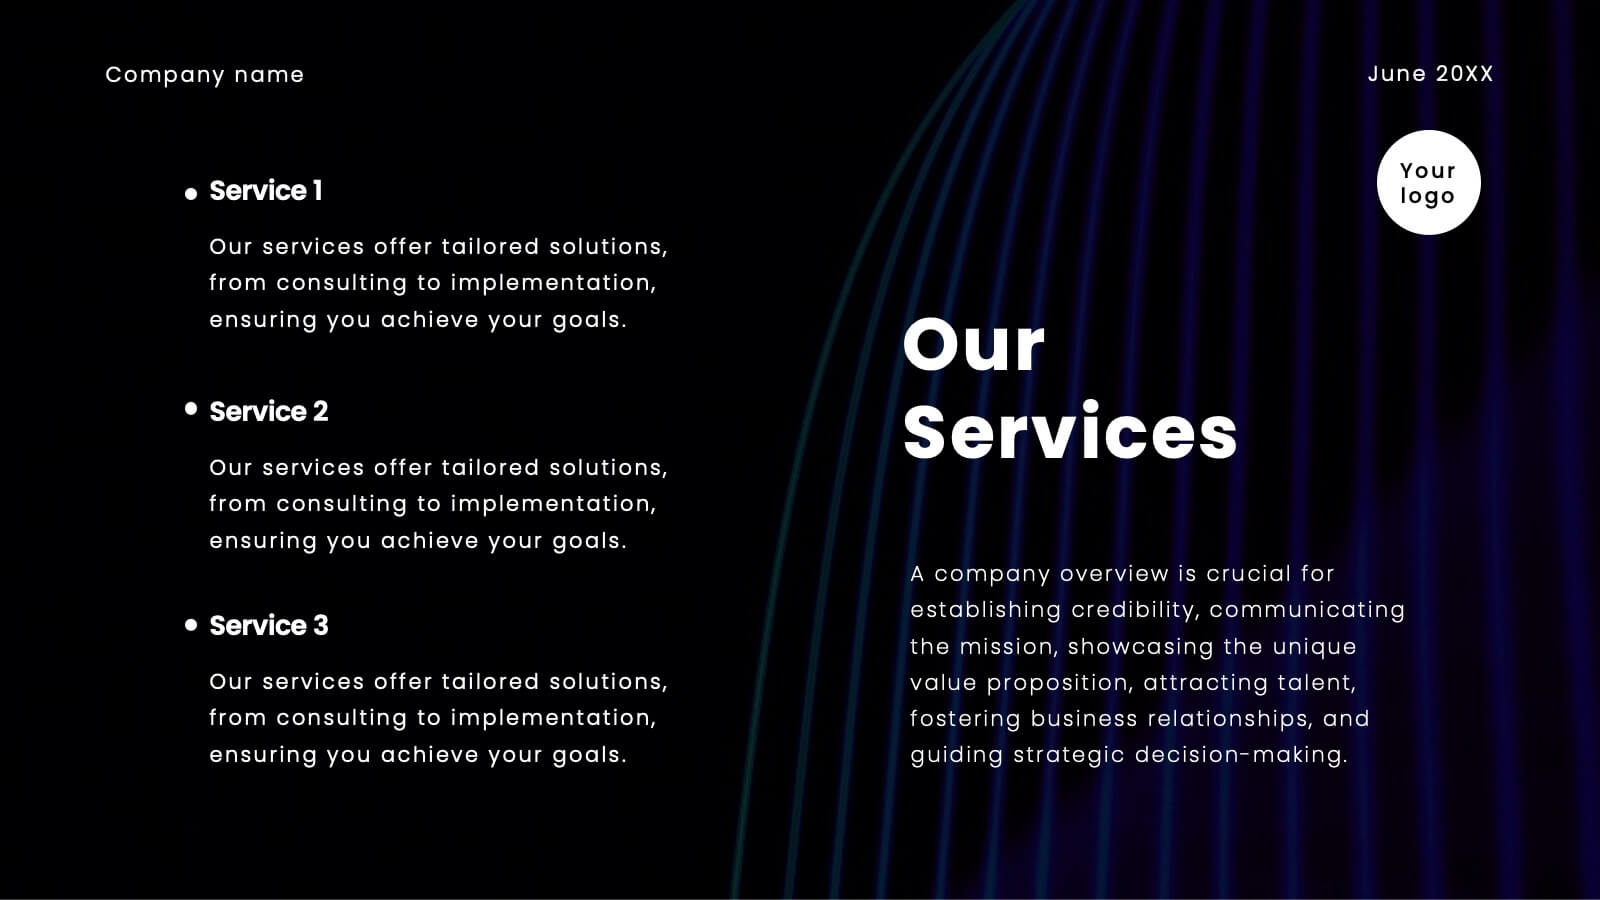
Geometric Design Elements Presentation
The "Geometric Design Elements" presentation template features a modern layout utilizing geometric shapes to organize and present data effectively. Each slide provides a unique configuration of circles or connected shapes, facilitating clear visualization of interconnected topics or categories. These design elements are ideal for displaying business insights, relationships between concepts, or summarizing key points in a visually appealing and easily digestible format. The use of varied colors helps to distinguish between different sections or ideas, enhancing the viewer's ability to follow and absorb the presented information efficiently. This template is suitable for business presentations that require a balance of aesthetic appeal and functional design to communicate complex information clearly.


7 slides
Human Resources Administration Infographic
Human Resources Administration involves managing and overseeing various aspects of an organization's human capital and related processes. Our HR administration Infographic is your compass in the vast realm of HR, guiding you through essential aspects, best practices, and strategies crucial for successful HR management. This template is your guide to navigating the HR terrain. Compatible with Powerpoint, Keynote, and Google Slides. Discover best practices, strategies, and essential aspects of HR, empowering you to lead with expertise, empathy, and efficiency in the exciting world of human resources.


21 slides
Cupid Sales Proposal Presentation
Elevate your next proposal with this sleek and professional presentation template! Ideal for outlining project goals, scope of work, and timelines, this template ensures that every detail is presented with clarity and impact. It includes sections for budget breakdowns, team expertise, and risk management strategies. Compatible with PowerPoint, Keynote, and Google Slides, it’s designed for flexibility and success.


22 slides
Jolt Business Idea Pitch Deck Presentation
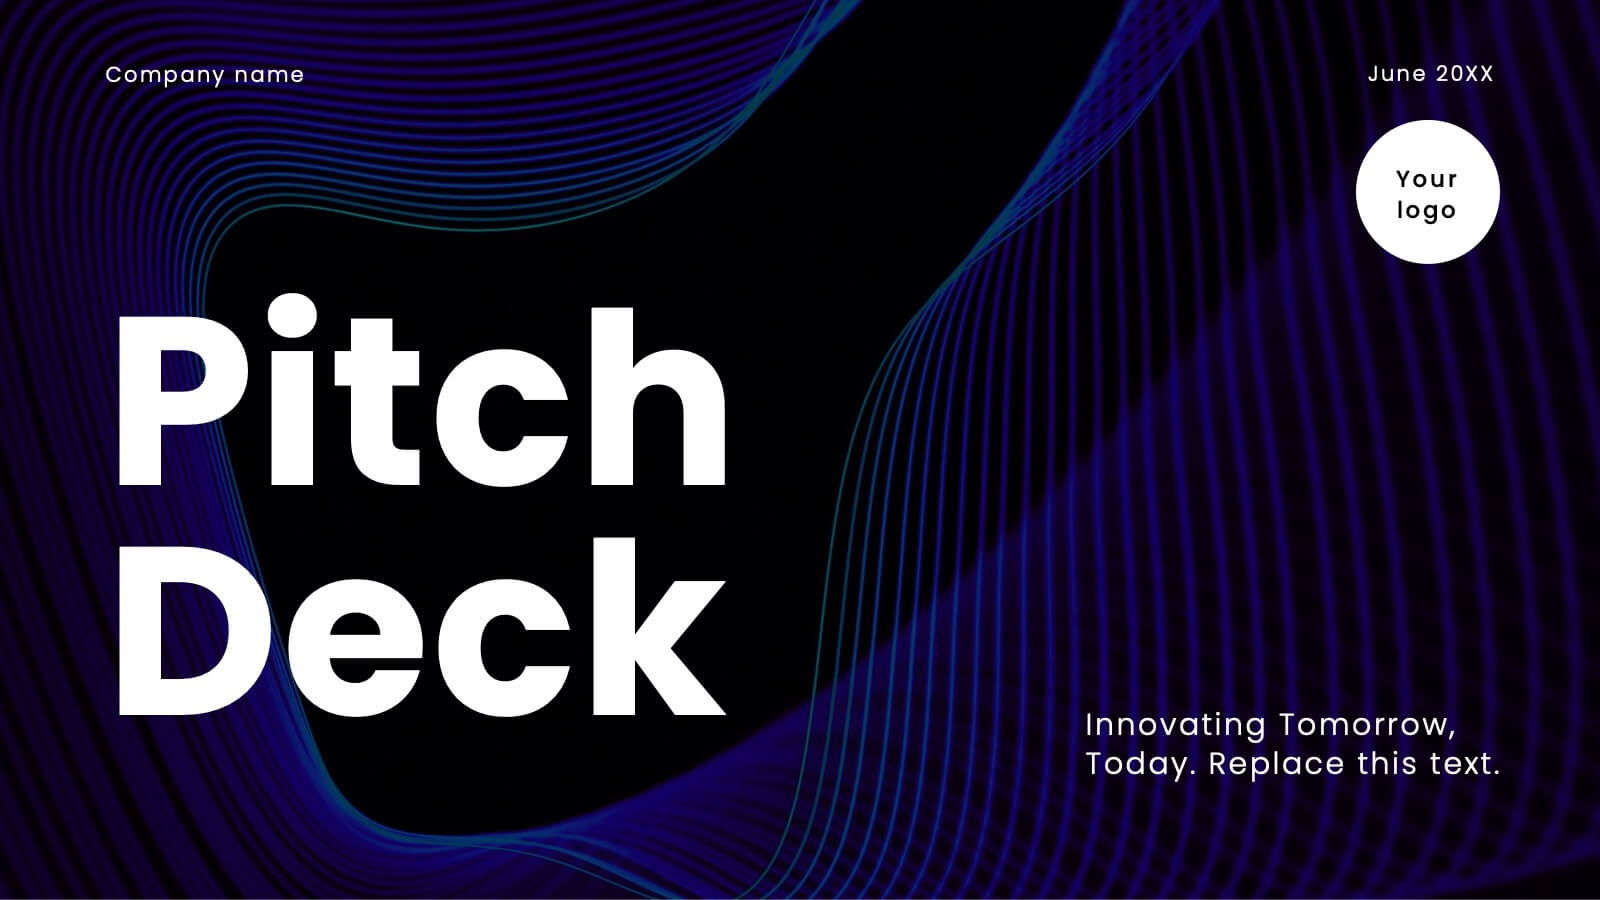
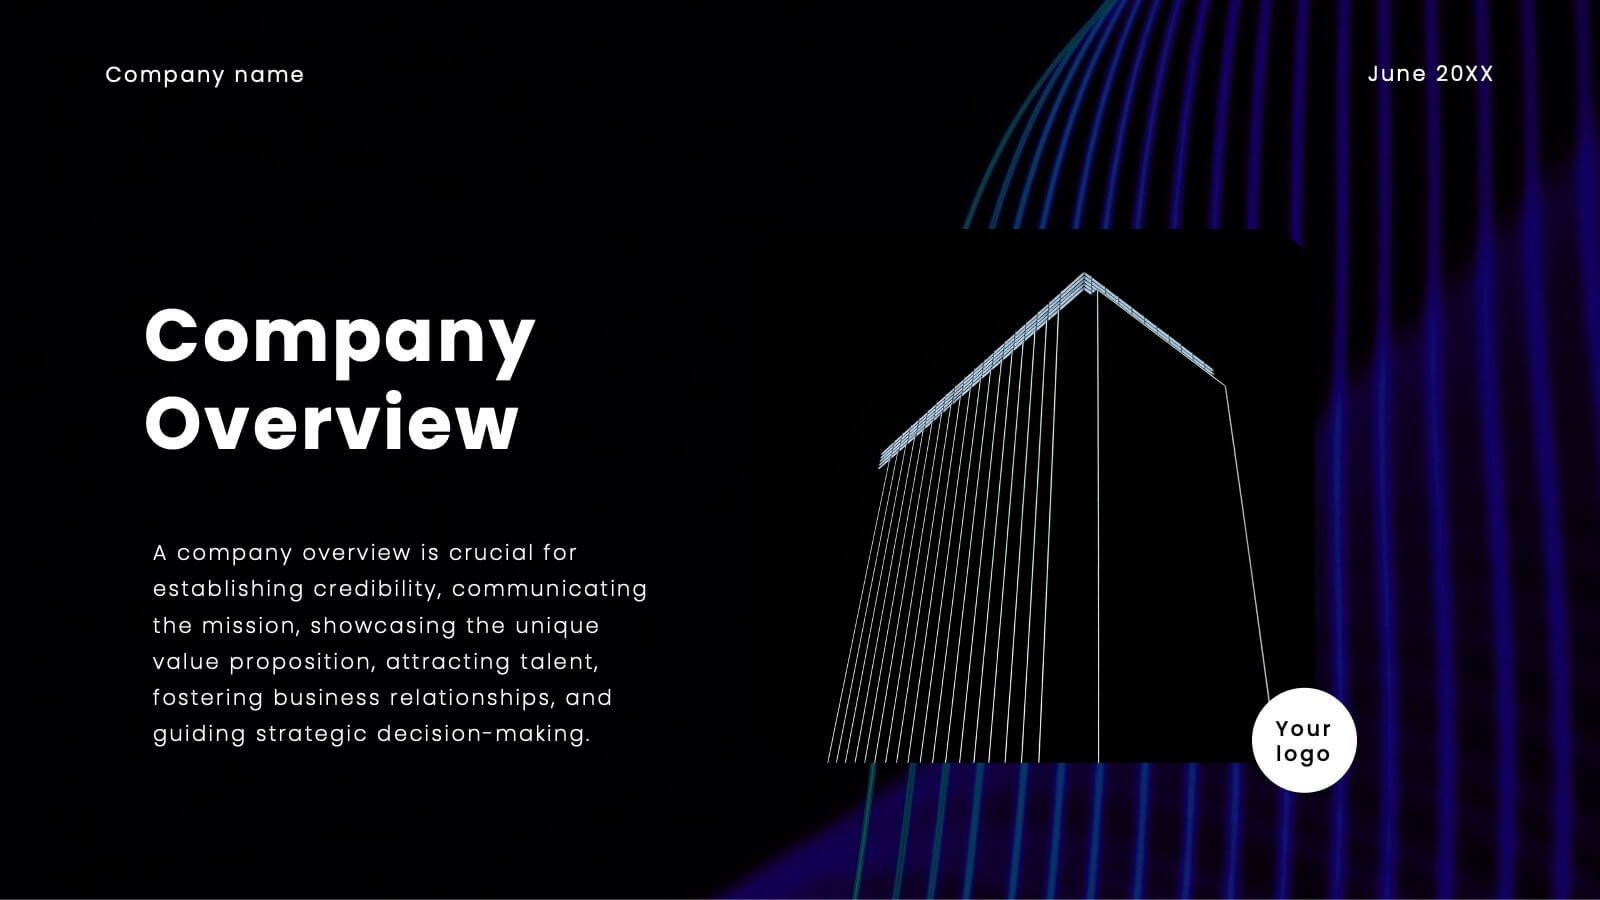
Prepare to electrify your audience with a pitch deck that’s nothing short of spectacular! This high-impact template is designed to captivate, engage, and persuade your stakeholders with every slide. It’s more than just a presentation; it’s your gateway to showcasing your company’s unique value proposition, innovative solutions, and future growth potential in a way that’s visually stunning and incredibly compelling. From the moment you unveil your company overview to the final slide on financials and funding requirements, this template ensures your pitch is memorable, powerful, and impossible to ignore. The sleek, modern design highlights your strategic vision, competitive advantages, and market opportunities, making a bold statement that you’re ready to lead the future. Compatible with PowerPoint, Keynote, and Google Slides, this pitch deck template is your ultimate tool for turning heads and securing buy-in from investors, partners, and clients alike!


5 slides
Four-Step Marketing Funnel Plan Presentation
Streamline your messaging with the Four-Step Marketing Funnel Plan Presentation. This clean, vertical funnel layout highlights each stage of your strategy—ideal for visualizing lead nurturing, sales processes, or campaign progression. Each level is clearly marked and editable, helping you deliver focused insights with ease. Fully compatible with PowerPoint, Canva, Keynote, and Google Slides.


6 slides
Social Science Infographics
The "Social Science" infographic template is an intellectually stimulating and visually engaging tool, thoughtfully designed for PowerPoint, Keynote, and Google Slides. This template is a brilliant resource for educators, researchers, and students who seek to present the multifaceted aspects of social sciences in a clear and compelling manner. This template skillfully encompasses various disciplines within social science, such as anthropology, sociology, psychology, and political science. It presents key theories, methodologies, and findings in an organized and digestible format. This makes it an invaluable aid for academic presentations, research proposals, or educational discussions, facilitating a deeper understanding of human society and social relationships. The design is as thought-provoking as the subject it represents, with a color scheme that stimulates intellectual curiosity while maintaining clarity and focus. This not only enhances the visual appeal of the presentation but also complements the analytical and reflective nature of social science. Whether used in a lecture hall, a conference, or a study group, this template ensures that the complex world of "Social Science" is presented in an engaging, informative, and visually captivating manner.