


Features
- 6 Unique slides
- Fully editable and easy to edit in Microsoft Powerpoint, Keynote and Google Slides
- 16:9 widescreen layout
- Clean and professional designs
- Export to JPG, PDF or send by email


Do you have any questions?
Recommend


4 slides
Frequently Asked Questions (FAQ) Presentation
Enhance your FAQ section with this modern and visually structured presentation slide. Featuring a bold question mark icon, this template allows you to clearly organize and present key questions and answers in a professional and engaging format. Perfect for customer service, business proposals, and informational presentations, this slide is fully customizable with editable text, colors, and layouts. Compatible with PowerPoint, Keynote, and Google Slides for easy integration.


8 slides
Business Purpose and Mission Alignment Presentation
Clarify your organization’s direction with this step-by-step alignment slide. Featuring four sequential stages, each with icons, numbers, and customizable text boxes, this layout helps visually communicate how your business goals align with your mission. Perfect for strategic planning, team alignment workshops, and leadership presentations. Fully editable and compatible with PowerPoint, Keynote, and Google Slides.


4 slides
Personal Finance and Money Management Presentation
Effectively present Personal Finance and Money Management insights with this clean and professional slide template. Designed with a minimalist stopwatch infographic, this template helps visualize key financial principles like budgeting, saving, and investing. Fully customizable with editable text, colors, and icons, it’s perfect for business reports, financial workshops, or personal finance presentations. Compatible with PowerPoint, Keynote, and Google Slides for seamless editing.


4 slides
Big Data Analytics Business
Simplify data complexity with this layered stack diagram designed for big data workflows and insights. Ideal for IT professionals, analytics teams, and consultants, it visually represents data input, processing, and output stages. Fully editable in PowerPoint, Keynote, and Google Slides for flexible customization.


21 slides
Tourmaline Project Proposal Presentation
This sleek design proposal template covers all essential sections like project summary, objectives, goals, and deliverables. With a modern and professional layout, it's perfect for presenting solutions and methodologies. Compatible with PowerPoint, Keynote, and Google Slides, it’s designed to impress clients and stakeholders with clear, structured information.


22 slides
Wave Startup Strategy Presentation
Pitch your startup strategy with this modern, vibrant template! It covers essentials like mission, vision, product overview, market analysis, and growth plans. Perfect for highlighting your team, financials, and milestones. Seamlessly compatible with PowerPoint, Keynote, and Google Slides for a smooth, professional presentation every time.


20 slides
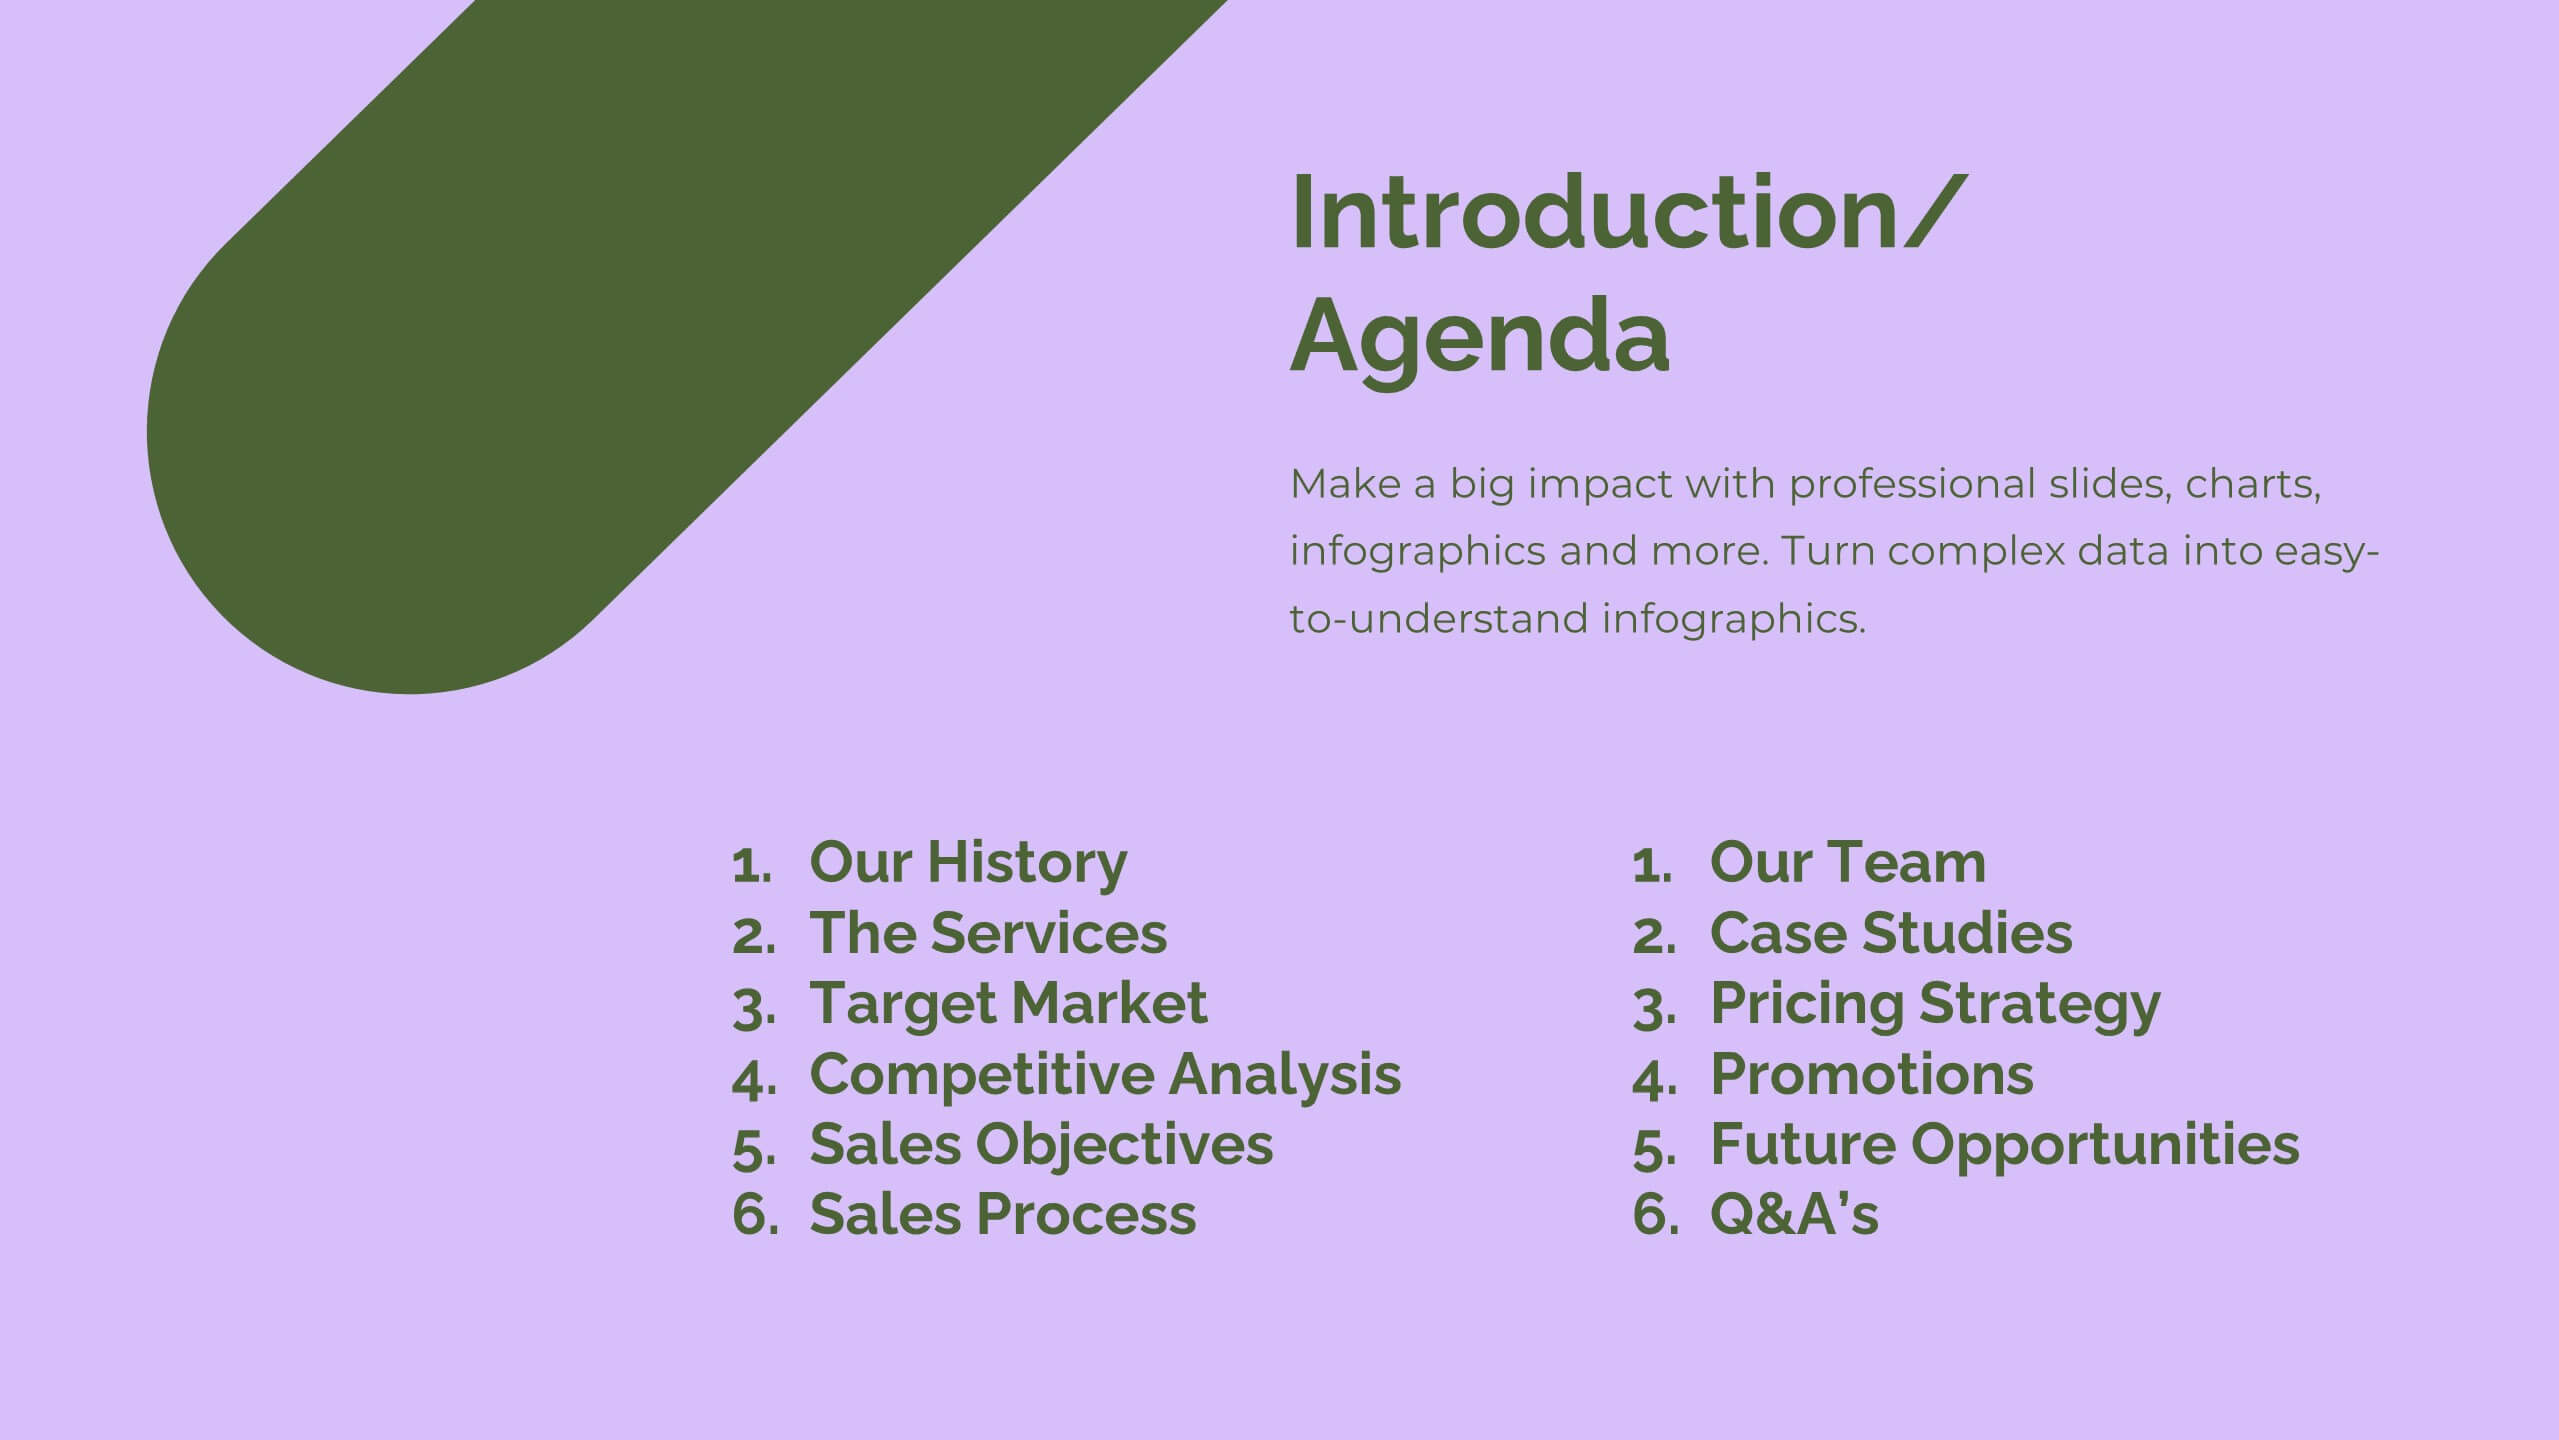
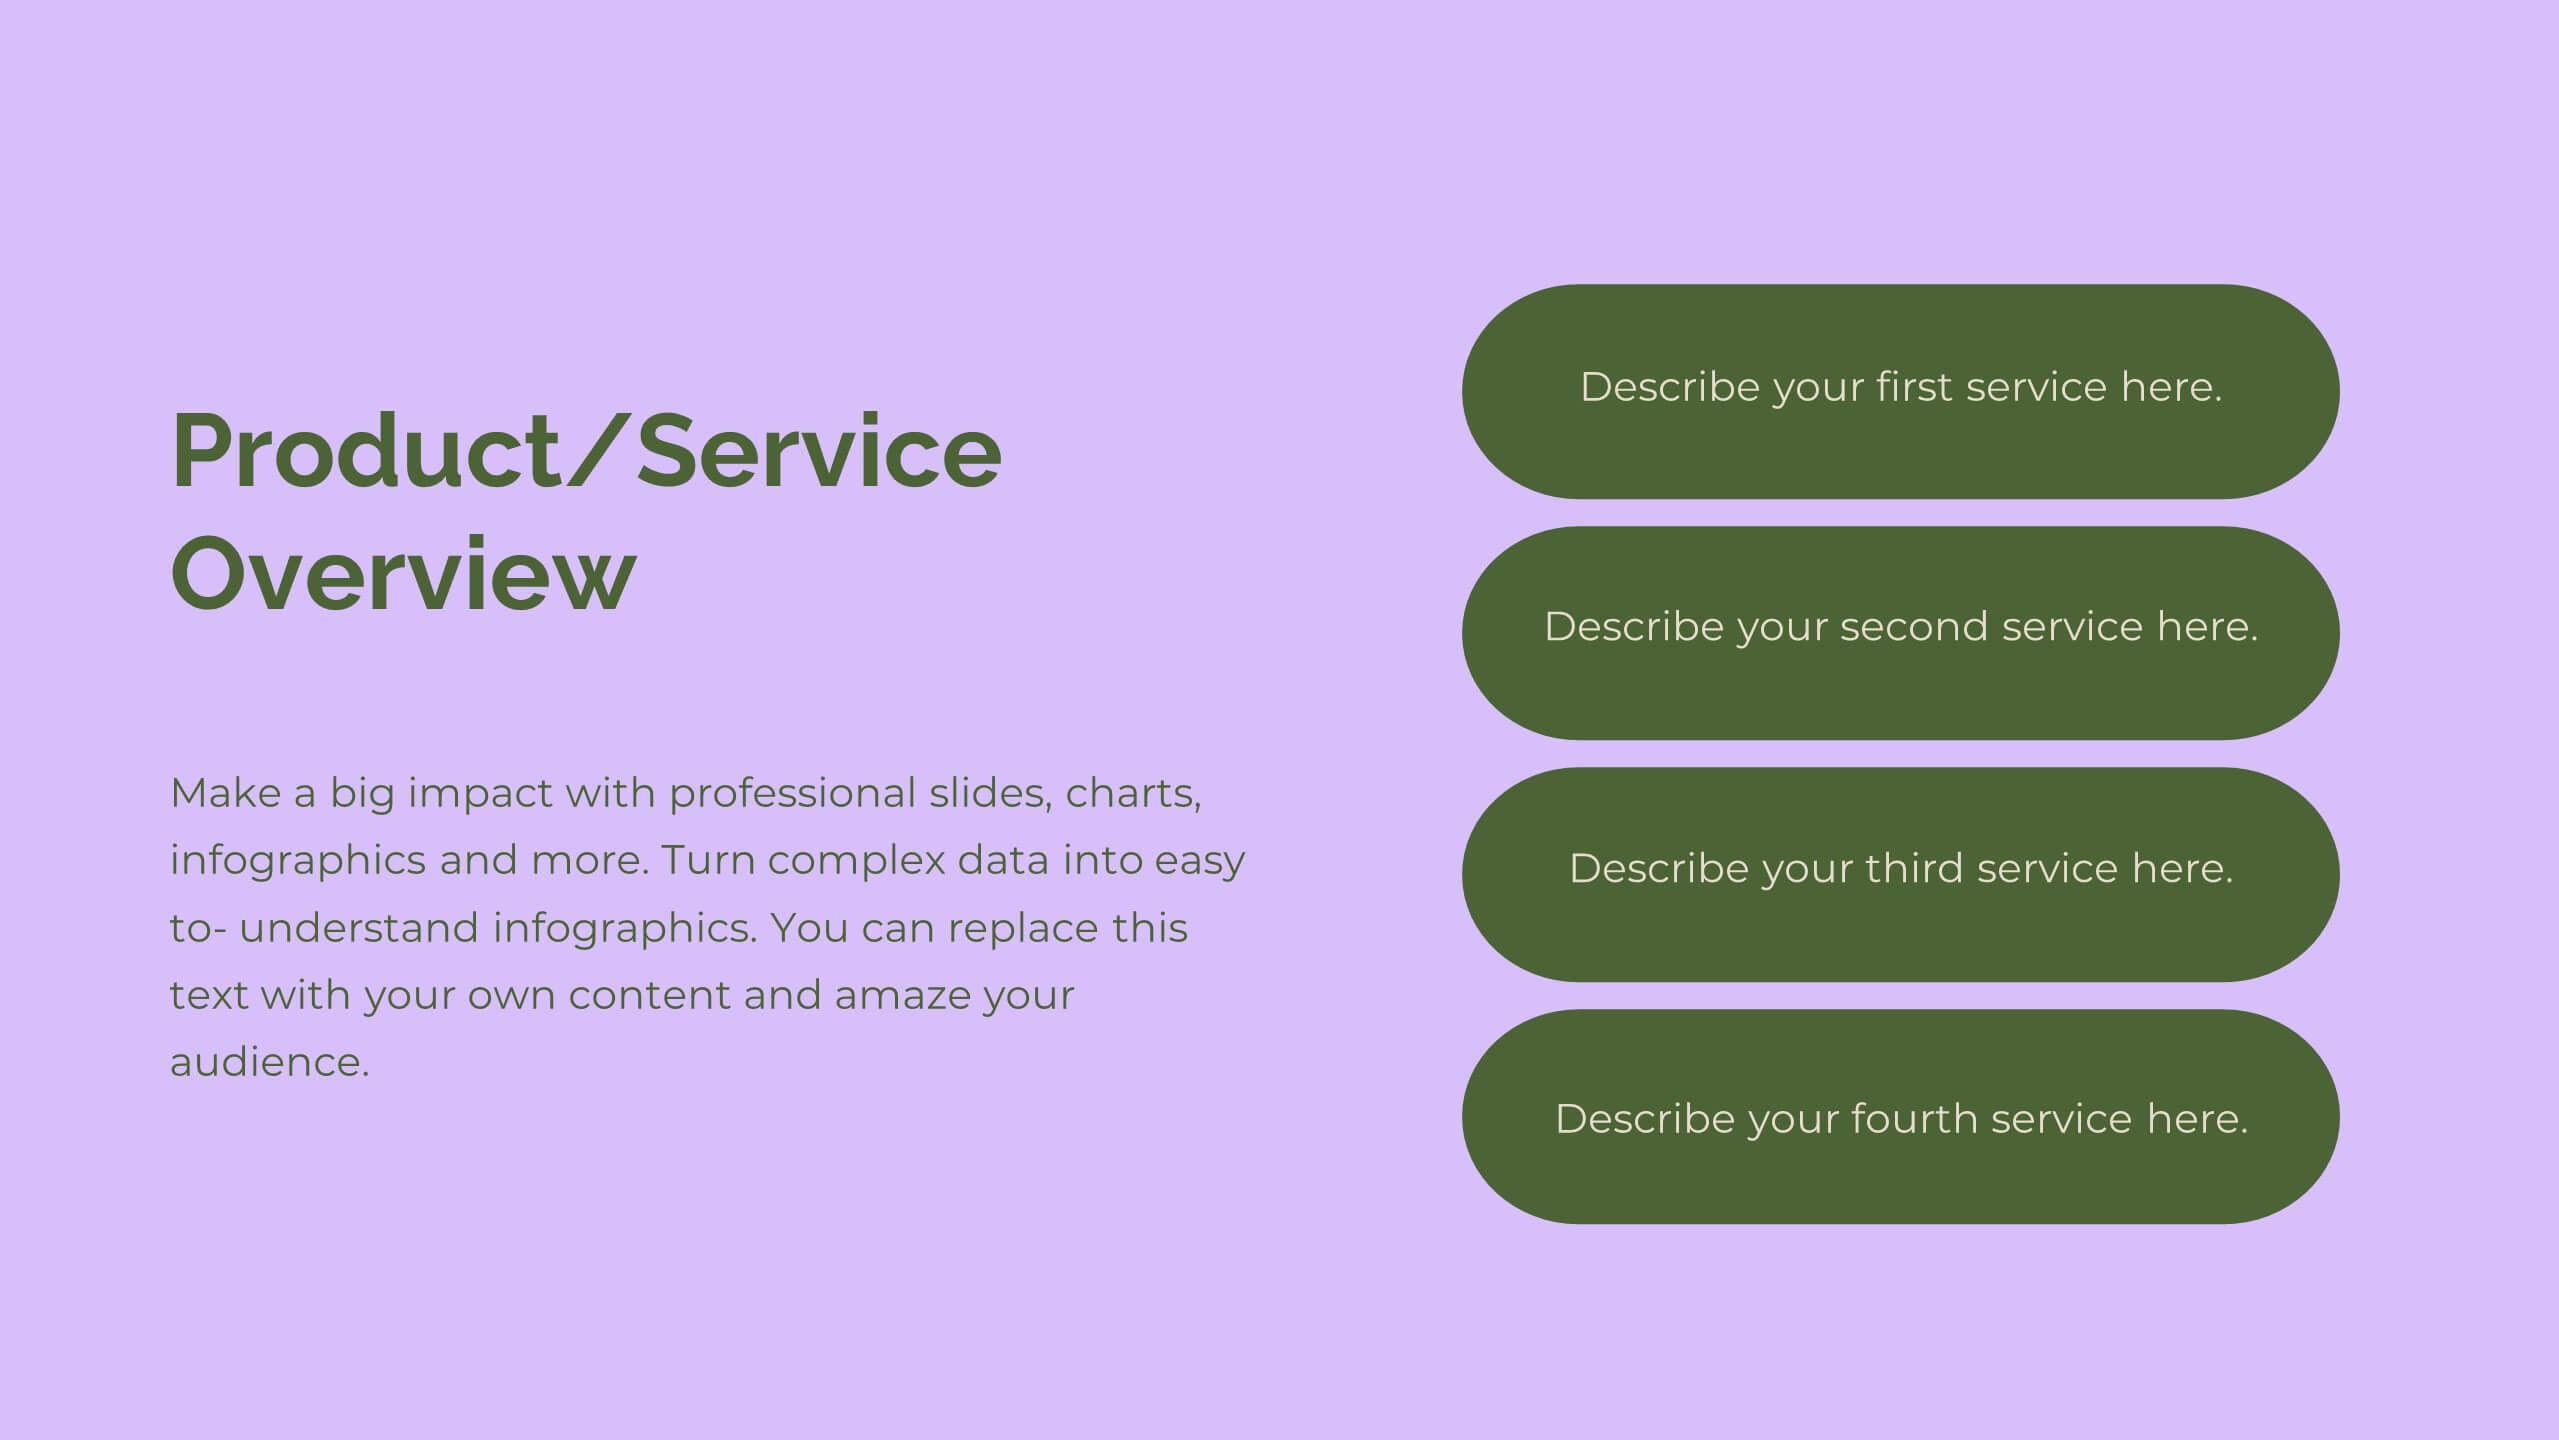
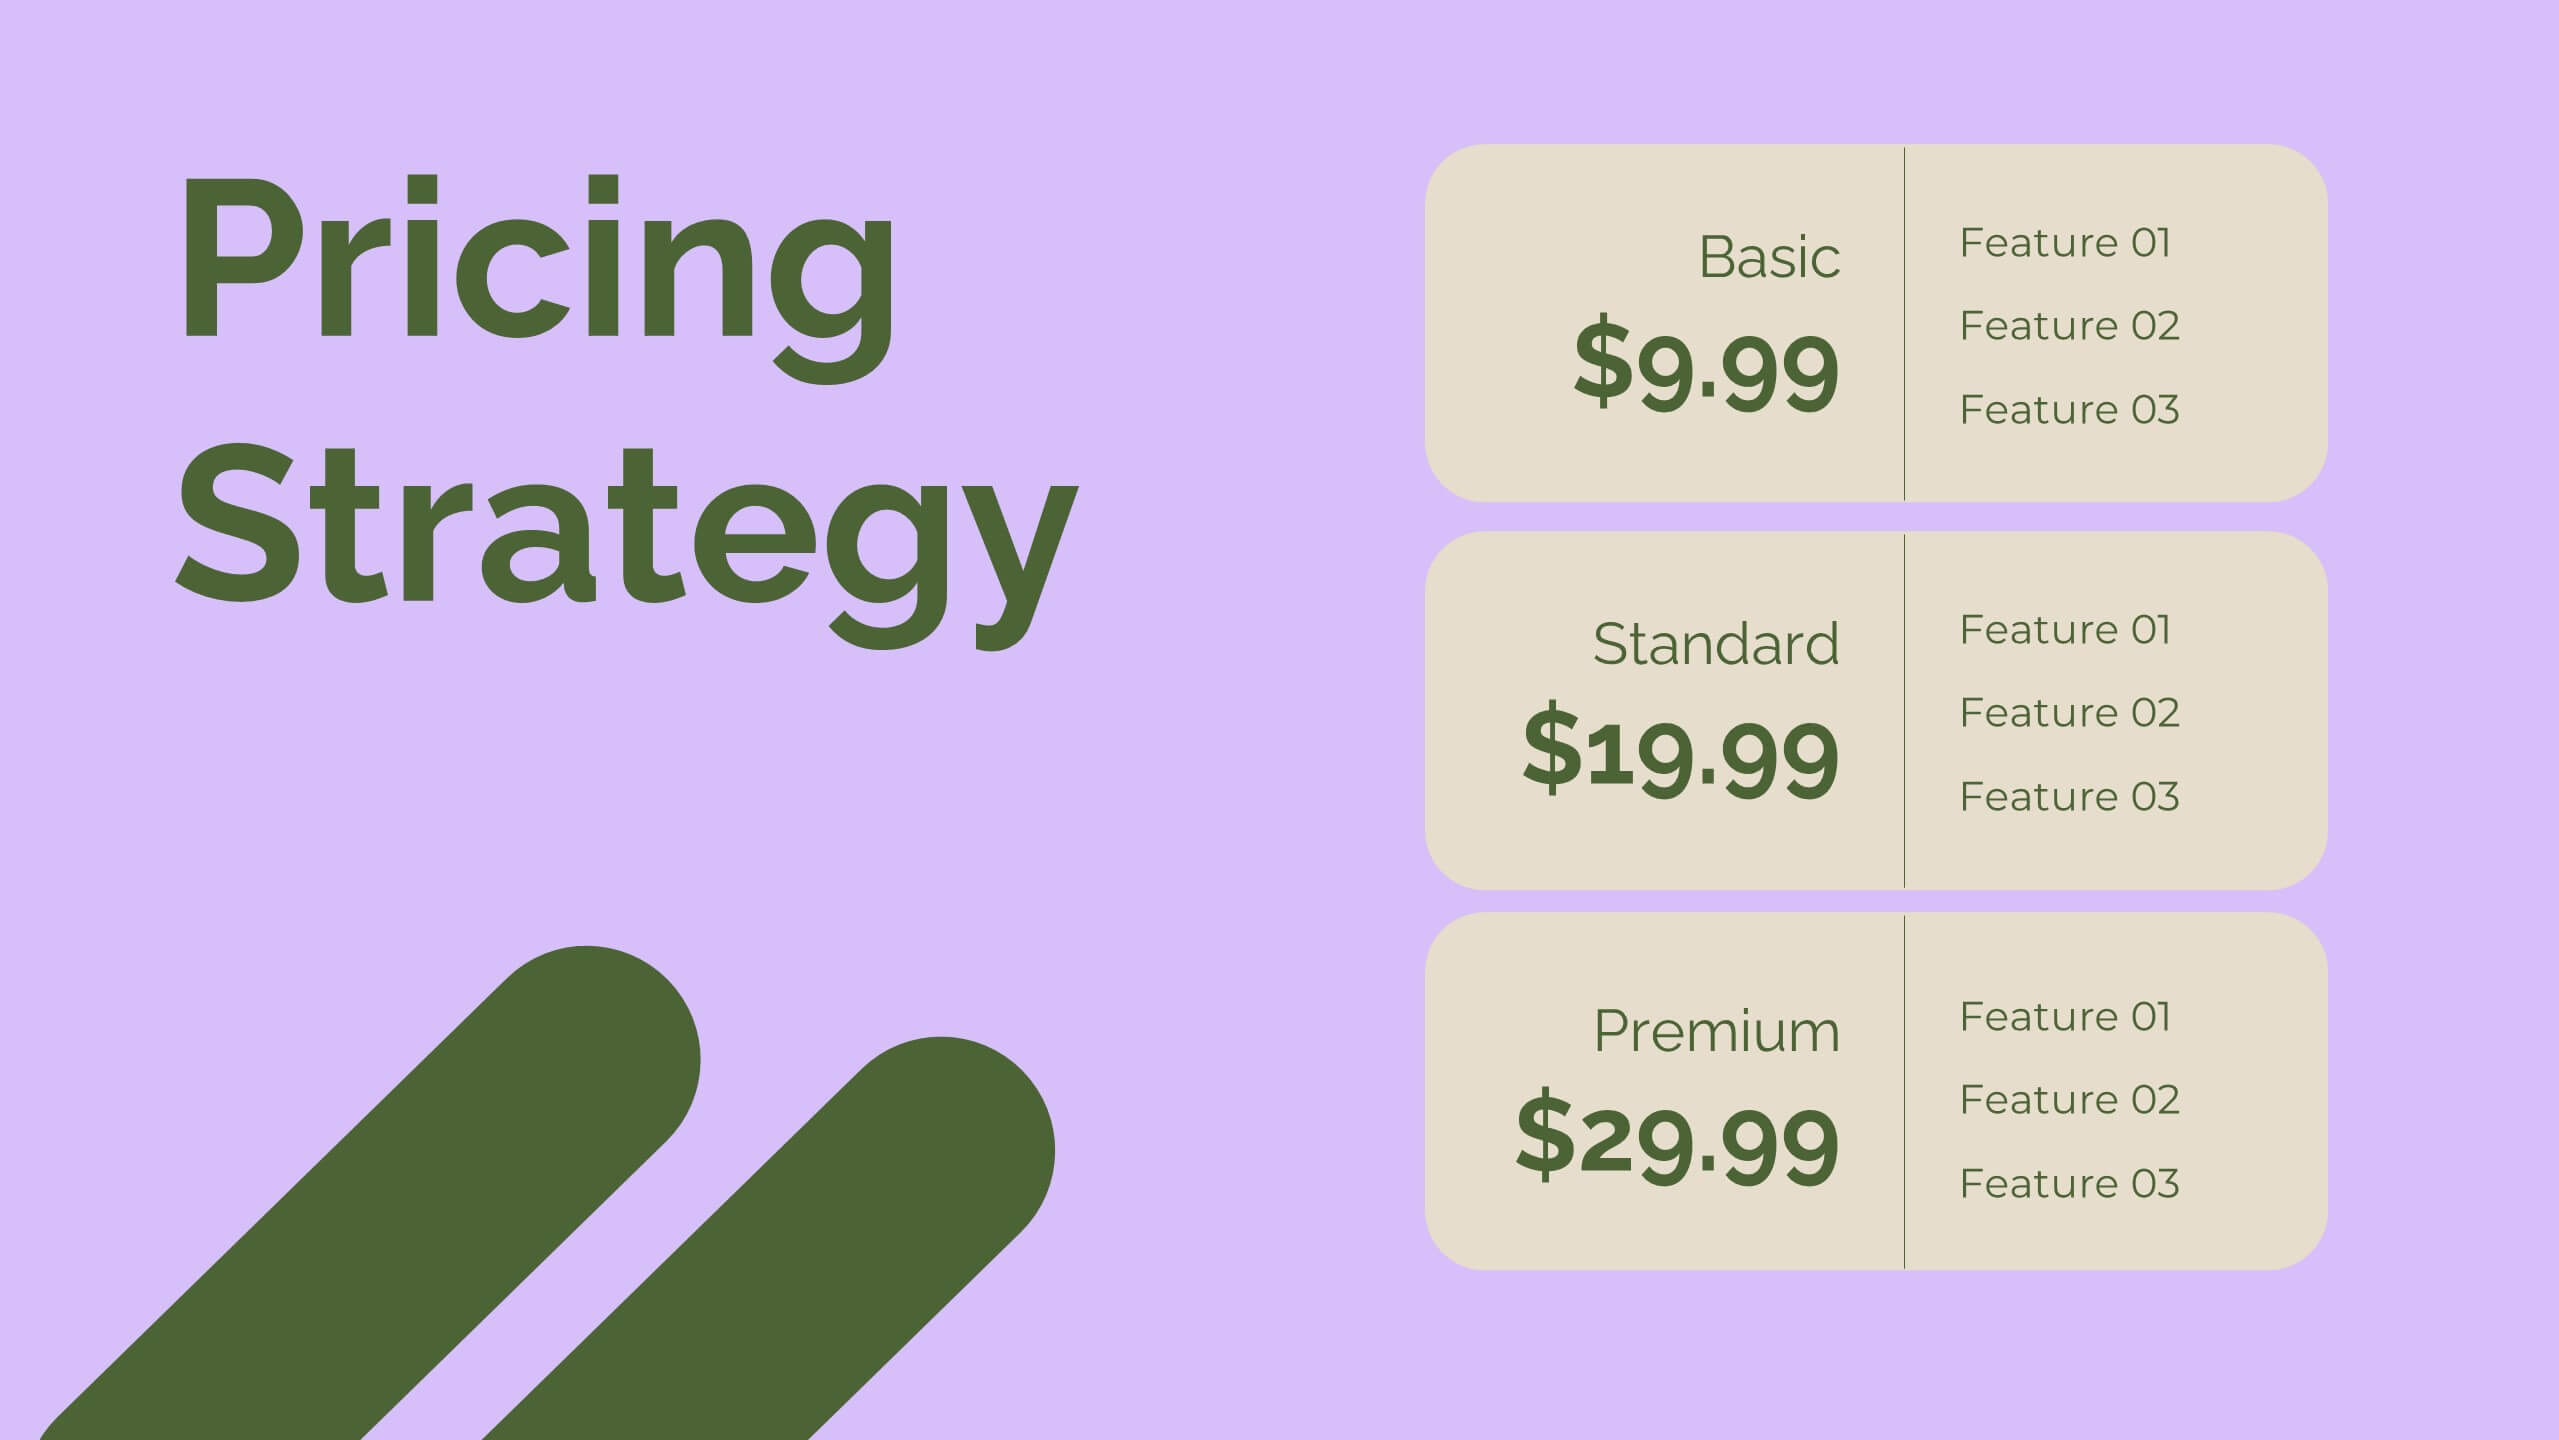
Glint Sales Strategy Presentation
Boost your sales performance with this dynamic sales strategy template! Perfect for presenting your company overview, product details, and competitive analysis, it includes slides for sales objectives, pricing strategy, and performance metrics. Engage your team with vibrant visuals and clear, structured content. Compatible with PowerPoint, Keynote, and Google Slides for seamless presentations on any platform.


5 slides
Business Strategy Briefcase Presentation
Unlock the potential of strategic planning with our "Business Strategy Infographic" template! This design cleverly uses suitcase icons to represent different aspects of your strategy, making it perfect for executives and teams who aim to present their business insights and objectives clearly and engagingly. Each segment of the suitcase aligns key data points with your strategic goals, offering a visual roadmap to success. Compatible with PowerPoint, Keynote, and Google Slides, this template is a powerful tool for conveying complex business strategies in a straightforward, visually appealing manner.


21 slides
Kinetic Startup Funding Proposal Presentation
Get ready to impress potential investors with the Kinetic Startup Funding Proposal template! This dynamic and modern template is designed to help you present your startup's vision, mission, and growth potential in the most compelling way possible. From introducing your team and services to highlighting your unique value proposition and business model, every slide is crafted to showcase your startup's strengths. The template includes sections for market analysis, customer needs, and pain points, ensuring your presentation is data-driven and focused on solving real problems. With slides dedicated to your marketing strategy, sales channels, and financial overview, you can provide a comprehensive plan for success. The sleek design, combined with easy-to-edit slides, allows you to customize the presentation to reflect your startup's brand identity. Whether you're pitching to angel investors or venture capitalists, the Kinetic Startup Funding Proposal template will help you stand out and secure the funding you need. Compatible with PowerPoint, Keynote, and Google Slides, this template is your key to delivering a winning pitch.


26 slides
Efficient Time Management Presentation
Optimize your time management skills with a presentation designed to streamline your productivity. The template offers a professional and calming color palette, encouraging focus and clarity. It's structured to address the key principles of time management, from prioritizing tasks to strategic planning. Within the slides, you’ll find tools to introduce time management concepts, team profiles to assign roles efficiently, and charts to monitor progress. Engaging graphics and infographics are used to outline processes and time allocation, making it easier to visualize effective time management strategies. This template is a perfect match for workshops, personal organization sessions, or corporate training programs, compatible with popular platforms like PowerPoint, Keynote, and Google Slides. It’s designed to aid professionals and teams in harnessing their time effectively, ensuring every second counts towards achieving their goals.


25 slides
Draco Photography Portfolio Template Presentation
Showcase your photography portfolio with this dynamic template! Highlight your projects, style, client testimonials, and awards. Includes sections for pricing, services offered, and social media links. Ideal for photographers to create impactful presentations. Compatible with PowerPoint, Keynote, and Google Slides.


7 slides
Roadmap Infographic Presentation Template
A Roadmap Infographic is a visual representation of a plan or strategy for achieving a specific goal or set of goals. It includes a timeline and a series of steps or milestones that need to be accomplished in order to reach the final destination. This template is perfect for showing your plan or strategy in a fun and interactive way. This template includes lots of photo layouts and different types of charts that you can customize with your own information. Use this roadmap infographic template to show the progress of a project, the steps in a process, or the timeline for a product launch.


7 slides
Strategy Wheel Options Infographic Presentation
A Strategy Wheel Infographic is a visual tool that helps organizations develop and communicate their strategic plans. This template uses a circular diagram that breaks down the elements of a strategy into categories or segments, with each segment representing a different aspect of the plan. This infographic includes a central circle that represents the organization's overall goal, surrounded by smaller circles or segments that represent specific strategies or tactics. Each segment may include additional information such as goals, objectives, key performance indicators, and action items.


6 slides
Business Marketing Strategy Infographic
Enhance your business presentations with our Business Marketing Strategy Infographic, tailored for PowerPoint, Google Slides, and Keynote. This comprehensive template is designed to help you effectively communicate complex marketing strategies in a visually engaging manner. Each slide offers a unique layout to present your marketing plans, from analysis to execution. Highlight key components like market research, goals, target audiences, and planned actions. With its customizable features, it's perfect for marketers aiming to outline strategies, set objectives, and convey tactics in a clear, concise way to team members and stakeholders alike.


22 slides
Chromatic Academic Research Report Presentation
A structured template for academic research proposals, covering objectives, methodology, findings, and implications. Ideal for detailed presentations of data, analysis, and future research directions. Compatible with PowerPoint, Keynote, and Google Slides, it offers a professional layout for academic, scientific, or market research presentations.


4 slides
Effective Team Management Presentation
Present your management insights with clarity using this puzzle-style Effective Team Management template. Ideal for breaking down leadership functions, collaboration elements, or role responsibilities across four segments. The modular puzzle format adds a creative visual touch while staying professional. Fully editable in PowerPoint, Keynote, and Google Slides.


5 slides
Workplace Productivity Moments Presentation
Track progress and boost team performance with this clear and colorful productivity grid. Ideal for visualizing routines, task cycles, or time management strategies across a workweek or project phases. Each column and row is fully editable, making it easy to tailor the layout to your goals. Compatible with PowerPoint, Keynote, and Google Slides.