


Features
- 6 Unique slides
- Fully editable and easy to edit in Microsoft Powerpoint, Keynote and Google Slides
- 16:9 widescreen layout
- Clean and professional designs
- Export to JPG, PDF or send by email


Do you have any questions?
Recommend


4 slides
3-Step Supply Chain and Logistics Planning Presentation
Bring your workflow to life with a clean three-stage visual that makes your process feel fast, simple, and smart. This slide helps explain planning steps, logistics timelines, and supply chain actions in a way that’s easy for any audience to follow. Fully compatible with PowerPoint, Keynote, and Google Slides.


24 slides
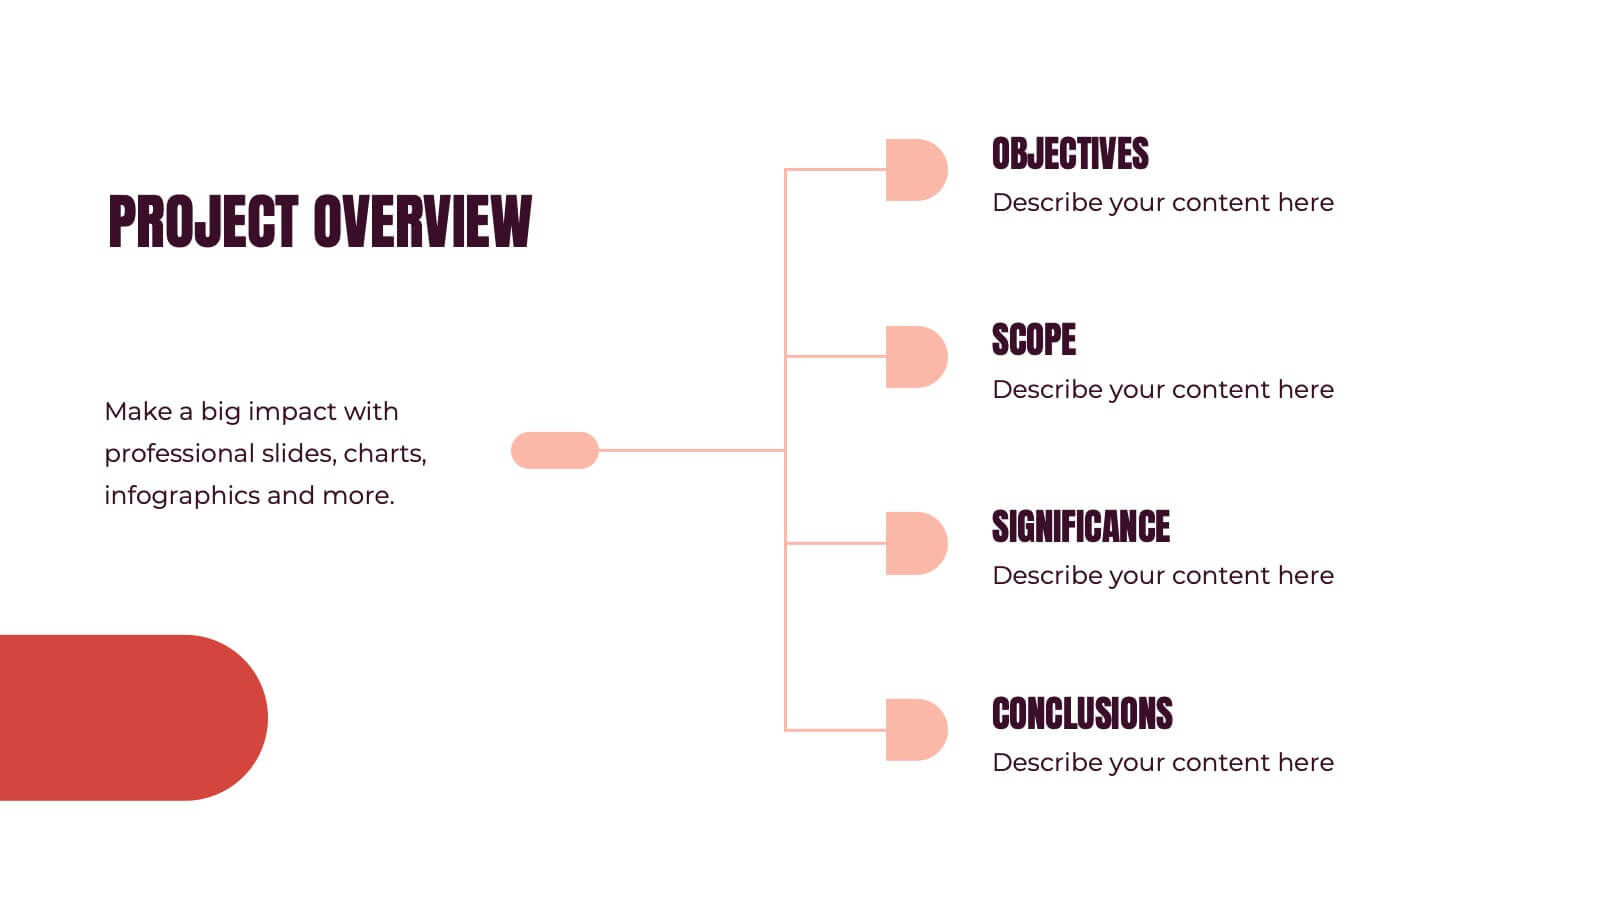
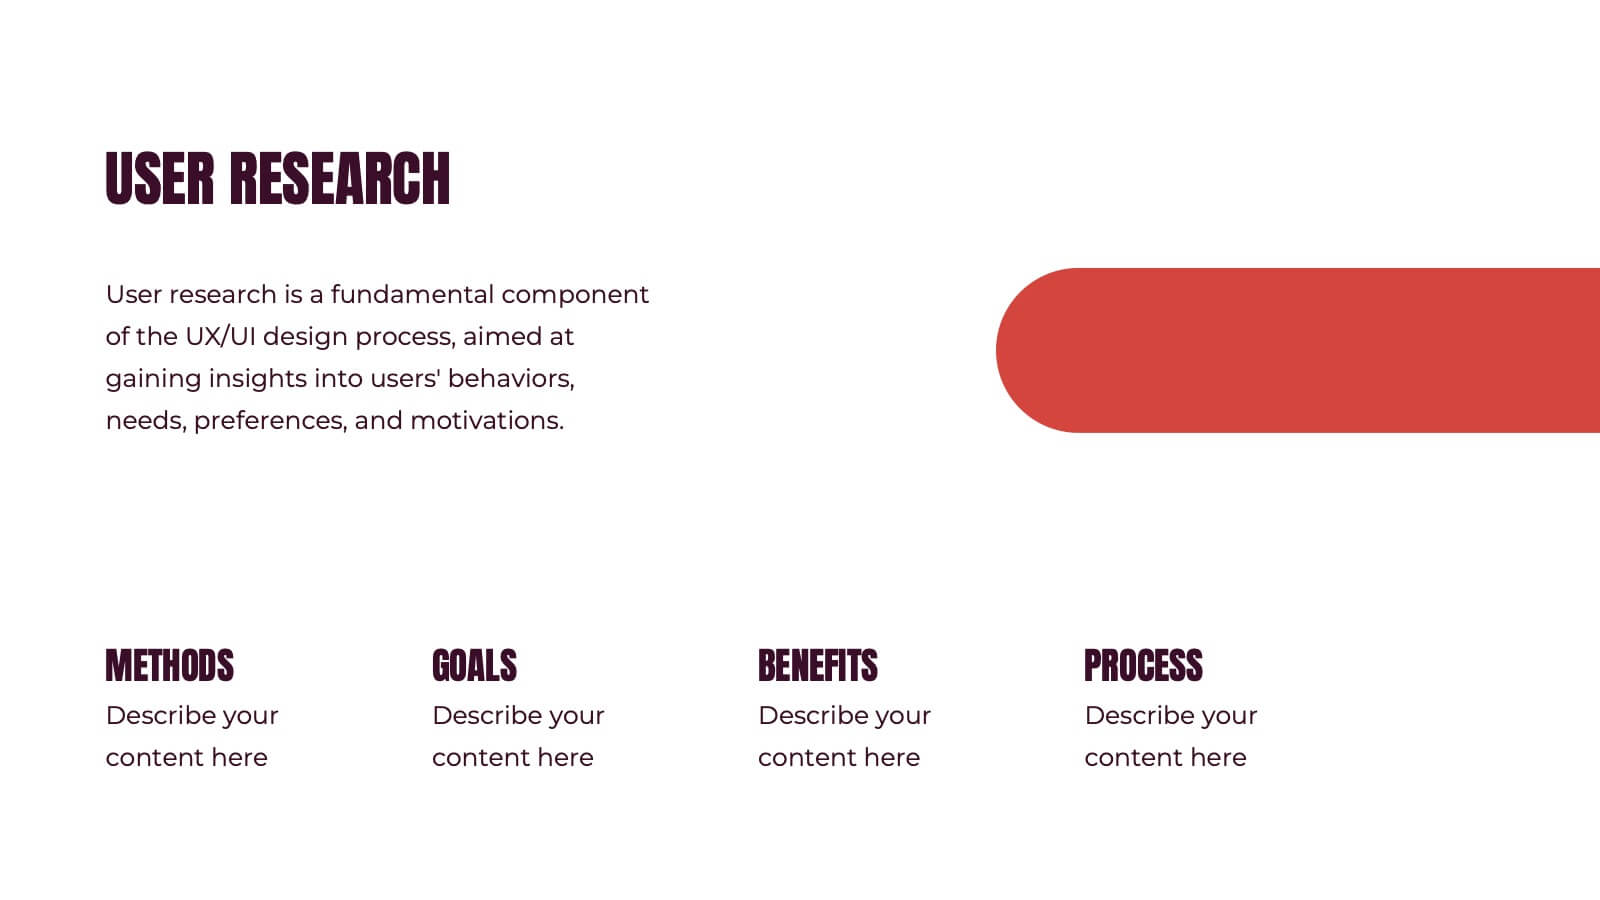
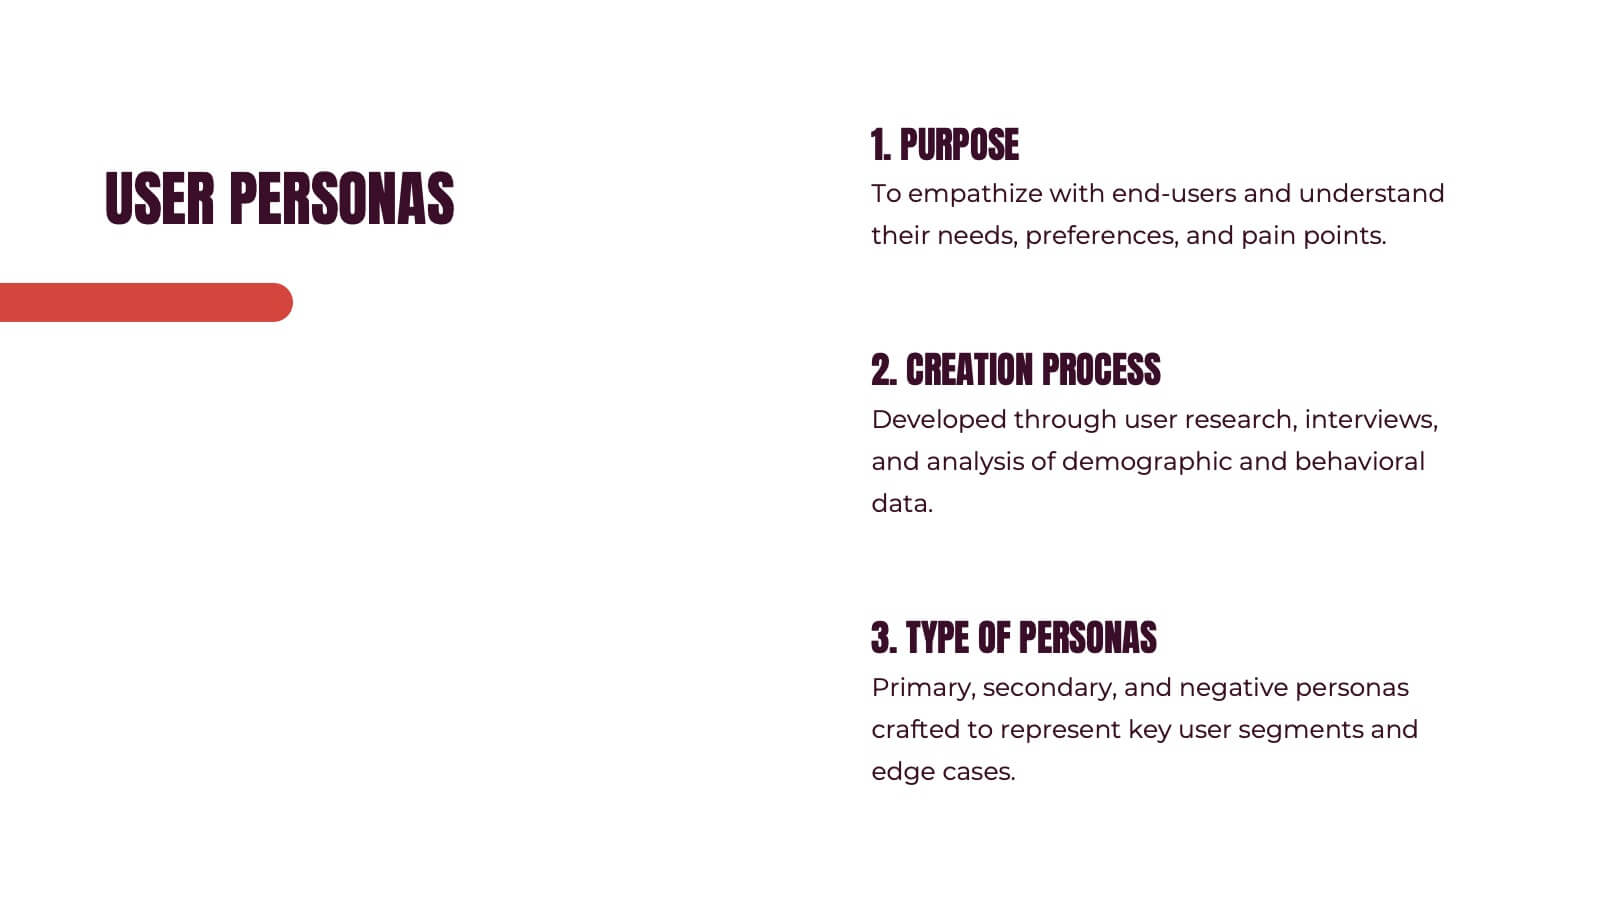
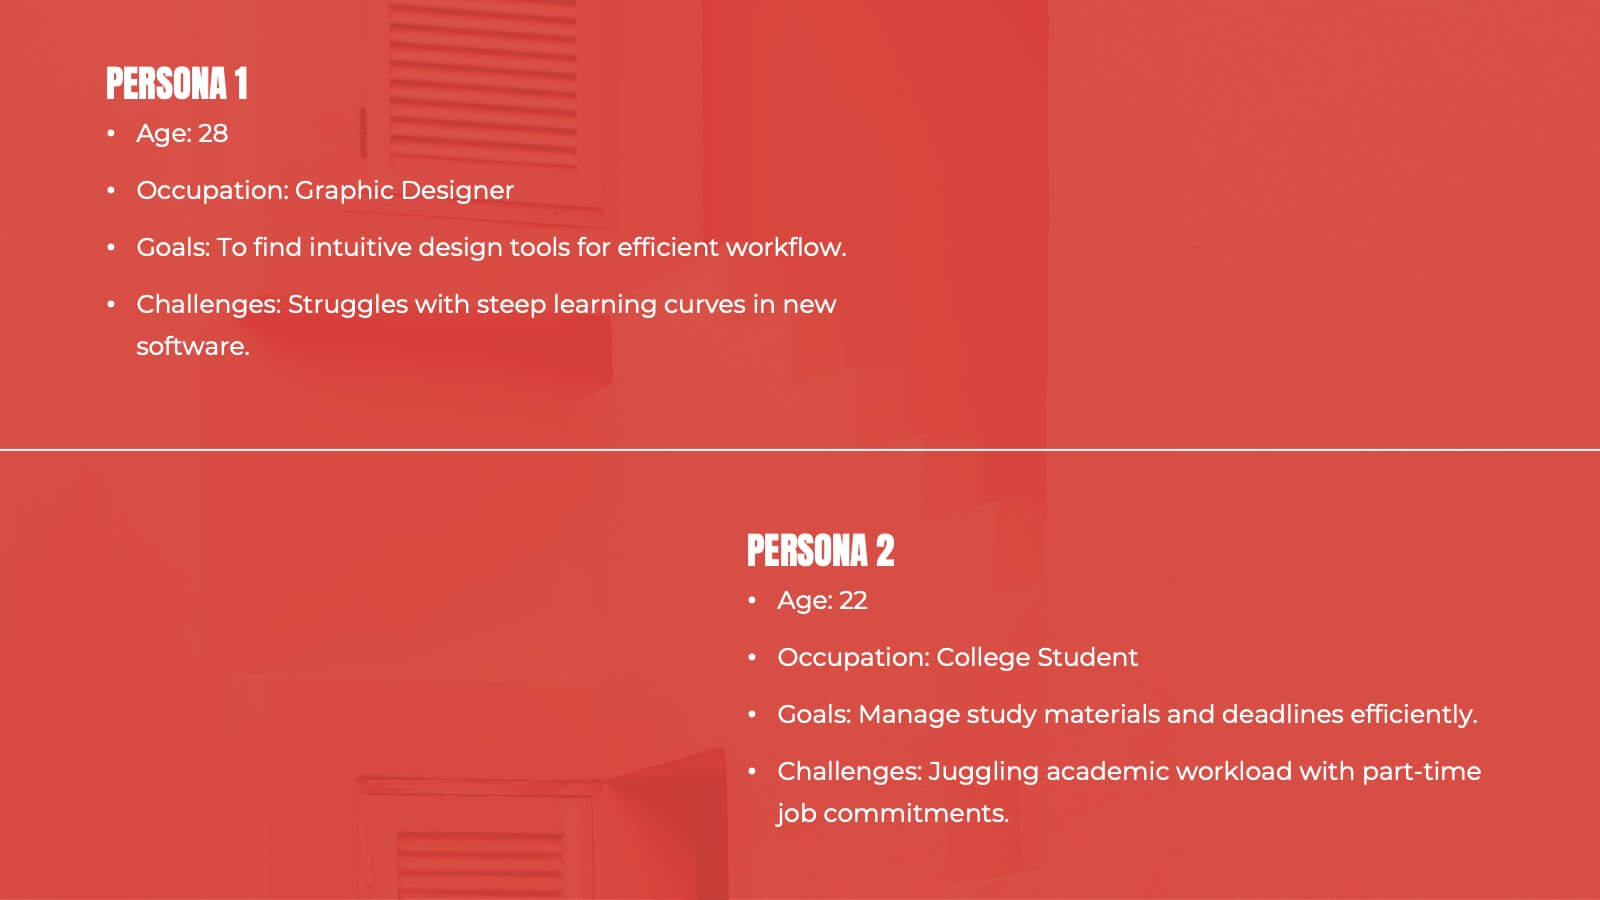
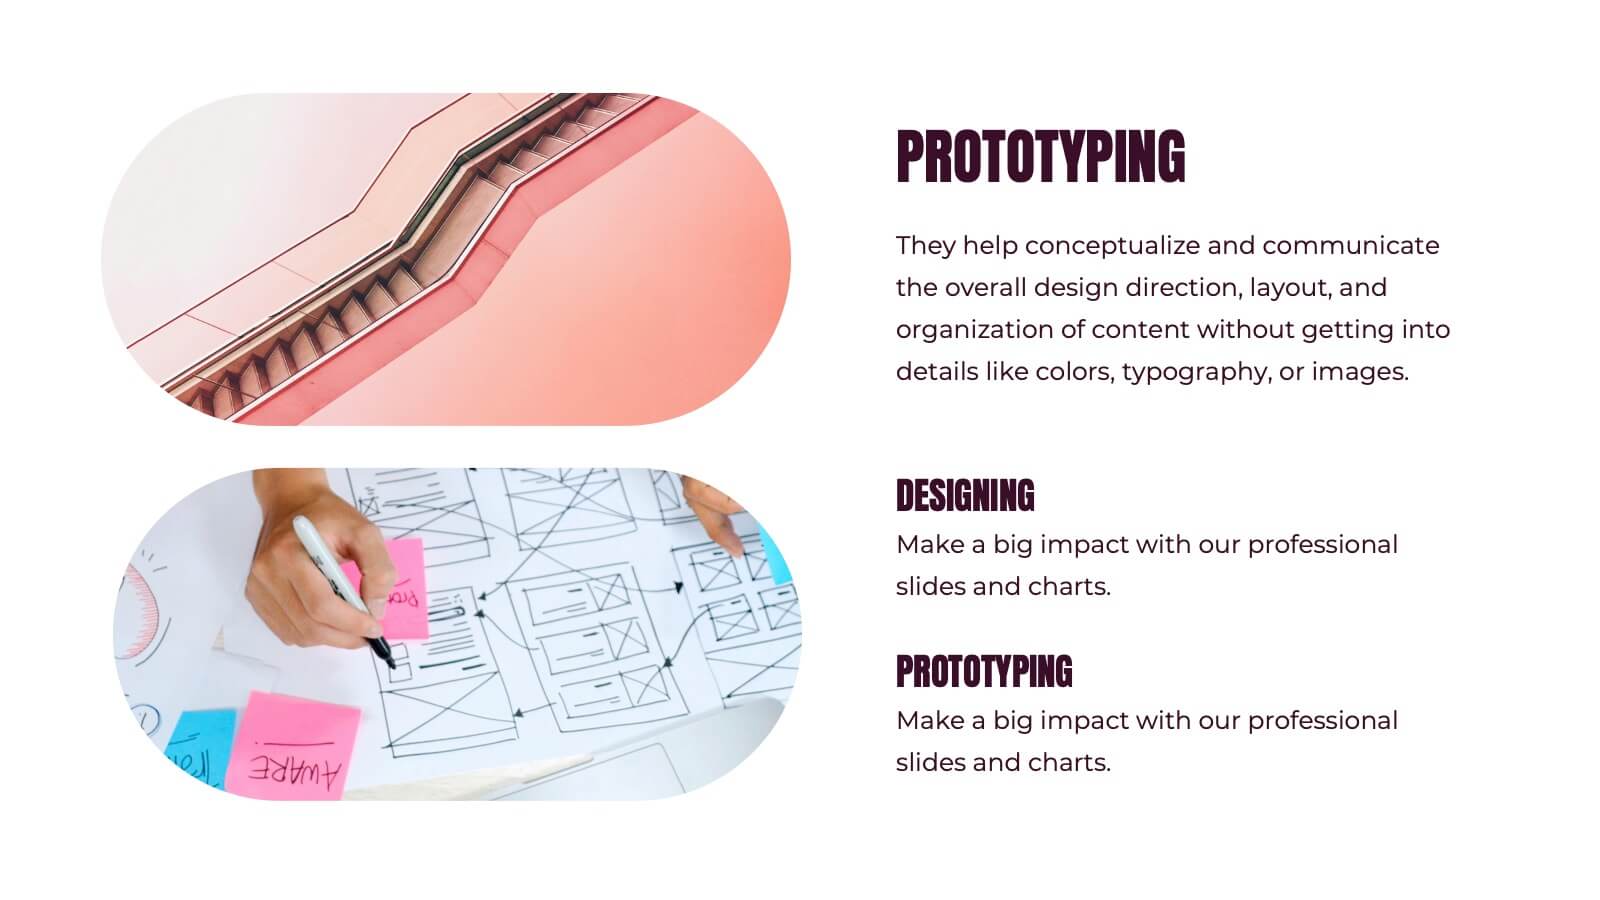
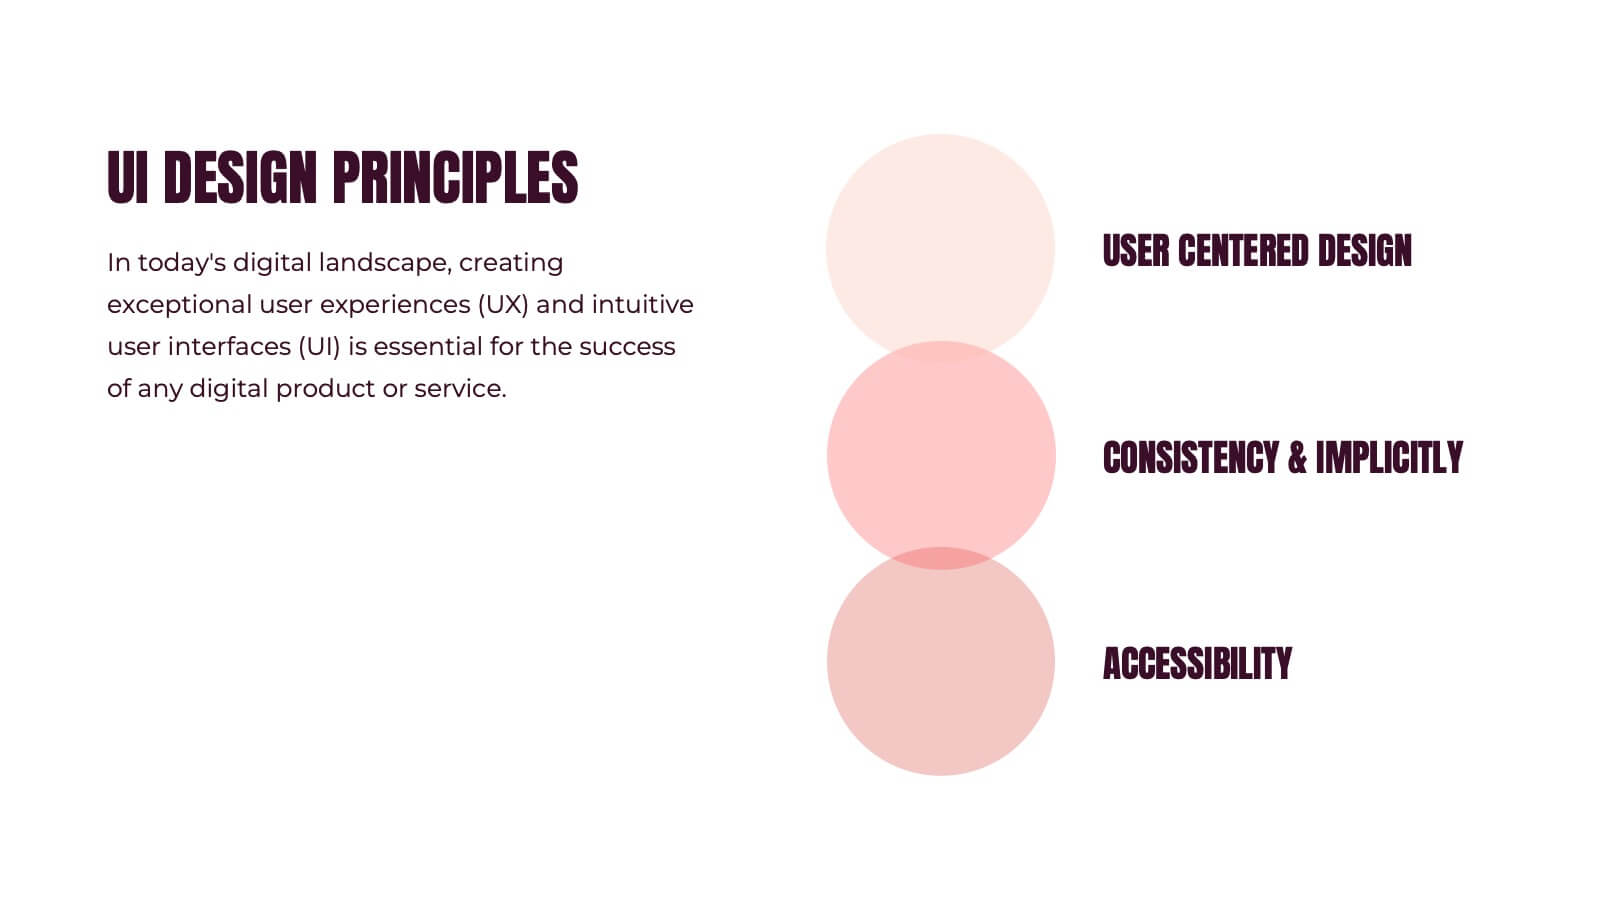
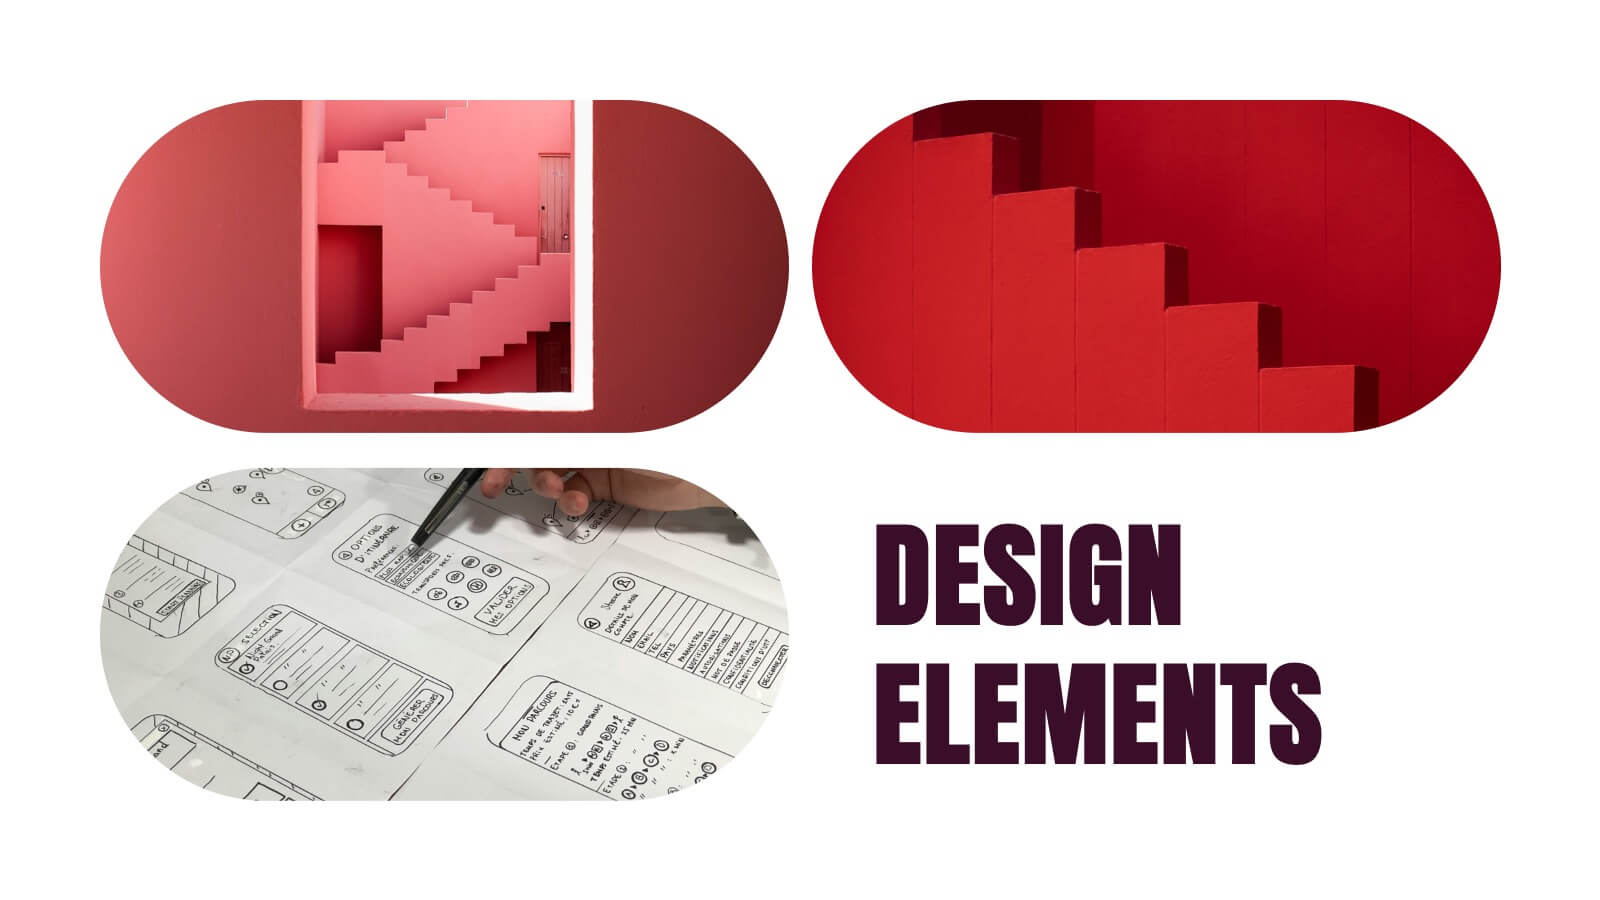
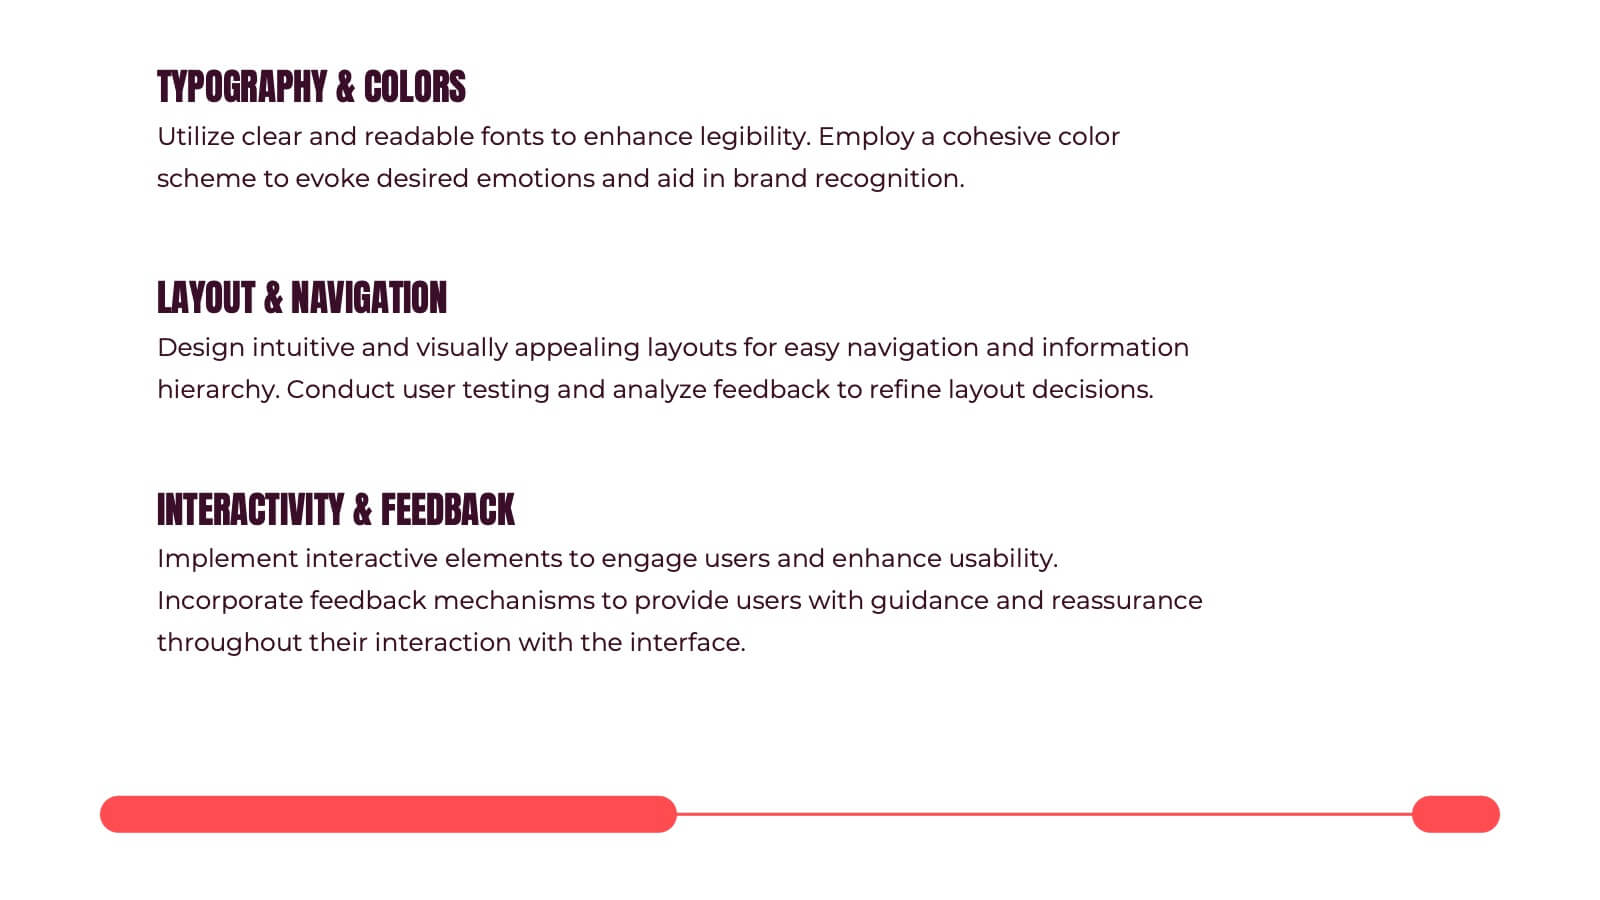
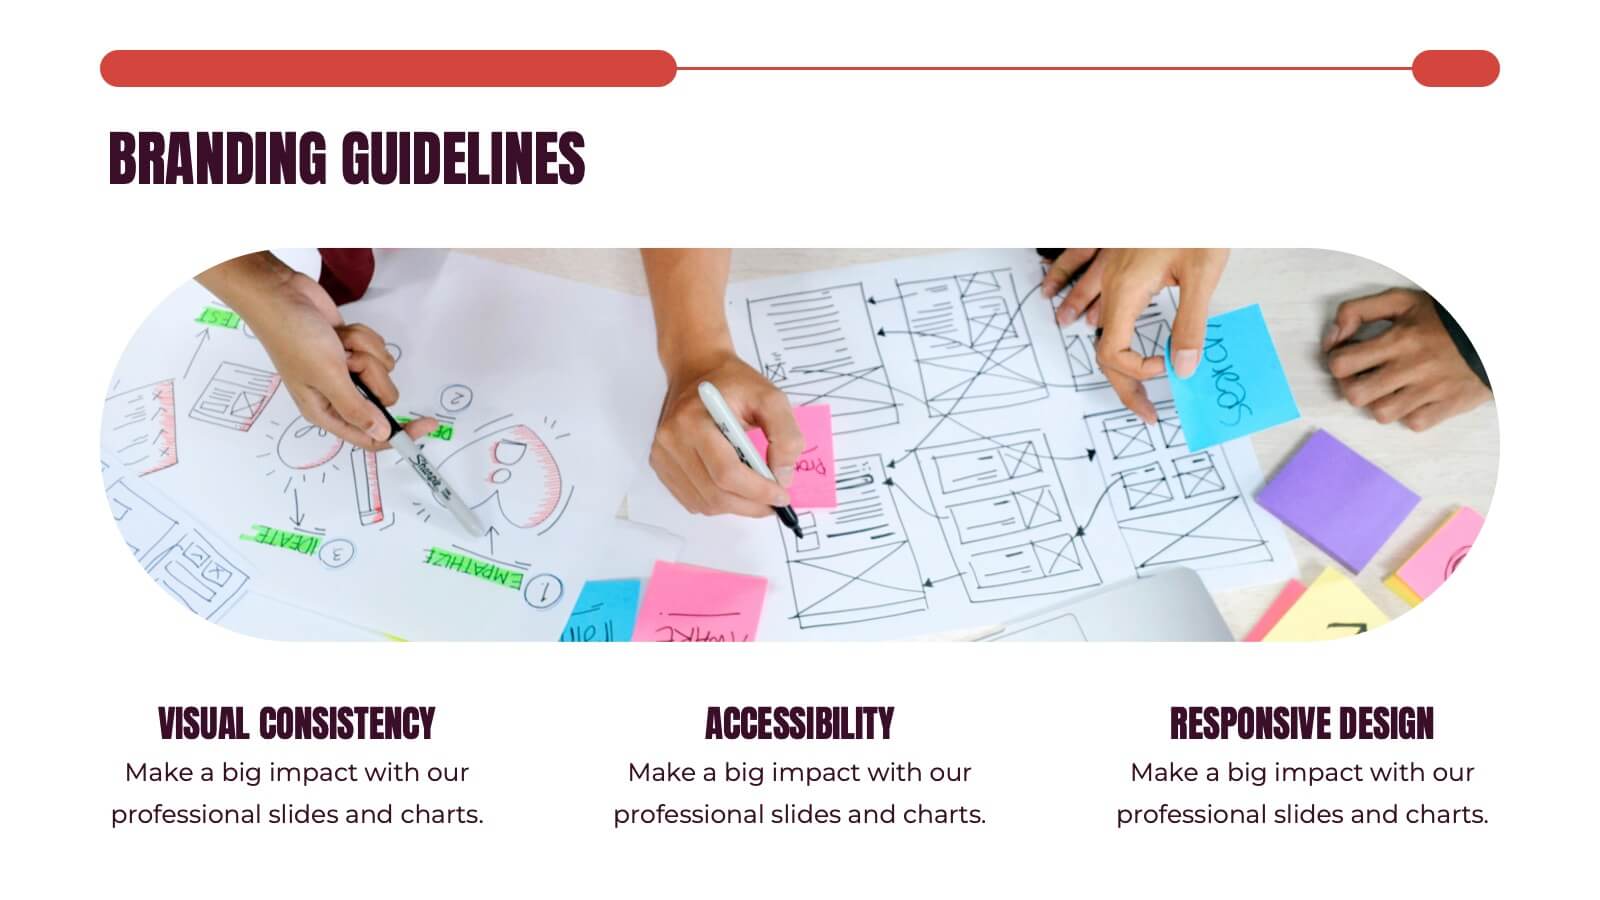
Kismet UX Design Presentation
Dive into the world of design with this stunning presentation template! Perfect for explaining user experience concepts, this template covers everything from wireframes to prototyping. It's designed to captivate your audience with visually engaging slides and clear, concise information. Compatible with PowerPoint, Keynote, and Google Slides for effortless use across platforms.


7 slides
Sales Funnel Infographic Presentation Template
The Sales Funnel is a marketing concept that is a useful tool for marketers to understand how people evaluate and decide their product or service. A sales funnel is a consumer-focused marketing model with the aim of making a sale. There are several steps to a sales funnel, usually known as top, middle, and bottom of the funnel, these vary from one model to another. With this template, you'll learn how to build a sales funnel that works best for your business and generates more leads and sales. This sales funnel template is designed to plan out your marketing strategy and is easy to use.


5 slides
Physical Science Infographics
Immerse in the realm of physical sciences with our physical science infographics template. Set against a deep cosmos of blues and purples, this template serves as a bridge between complex scientific principles and audiences, ideal for educators, students, and science communicators. The design, balancing creativity and informativeness, integrates stunning graphics and icons, turning data and facts into captivating visual stories. This dark-themed, visually engaging layout is not just an educational tool, but a spark that ignites curiosity and exploration in classrooms, scientific presentations, or educational content, making science both profound and accessible.


10 slides
Business Model Hexagon Infographic
Break down your strategy into clear, modular components with the Business Model Hexagon Infographic Presentation. This visually engaging layout features five interlinked hexagons, each labeled and icon-marked for easy segmentation of your business pillars—such as value propositions, customer channels, key partners, and revenue streams. The vertical stack ensures a logical flow while keeping your message structured and professional. Fully editable in PowerPoint, Keynote, and Google Slides, allowing you to tailor icons, text, and colors to match your business theme.


7 slides
Circle Process Infographic
A Circle Process is a method used to involve a group of people in problem-solving and decision-making. The process is based on a circle shape, where everything is in a circle facing each other. The template includes vibrant colors and circle process charts that you can customize to make just right for your project. This template is perfect for any project or presentation school or business related. This circle process template works with Powerpoint, Keynote, and Google Slides, so you can use it on any device. This template is great for teamwork, community building, and conflict resolution.


5 slides
SEO and Funnel Tactics in Marketing Presentation
Showcase your digital strategy step-by-step with the SEO and Funnel Tactics in Marketing Presentation. Designed with a layered visual layout, this template helps you highlight up to five key stages of your marketing funnel—from awareness to conversion. Fully customizable in PowerPoint, Canva, Keynote, and Google Slides.


26 slides
Tempo Brand Identity Presentation
Introduce and elevate your brand with this versatile presentation template designed to reflect your company's vision and values. Perfect for businesses looking to showcase their brand strategy, components, and touchpoints with clarity and professionalism. This presentation features thoughtfully designed slides covering brand identity components, visual guidelines, target audience insights, and future development plans. Use dedicated sections to outline your unique selling proposition, positioning, and strategy. With its clean layout and attention to detail, it's ideal for presenting a cohesive and impactful brand narrative. Compatible with PowerPoint, Google Slides, and Keynote, this template is fully customizable. Edit colors, text, and images to align with your brand aesthetics and messaging. Deliver your presentation with confidence, ensuring your audience is inspired by a polished and professional brand identity.


7 slides
Break Even Point Infographic Presentation
A Break Even Analysis Infographic is a visual tool that helps businesses and organizations understand the point at which they will begin to make a profit. This template uses a graph to show the relationship between fixed costs, revenue, and profits at different levels of production or sales. This Infographic also includes a graph with two lines: one representing fixed costs and the other representing total revenue. The point at which these lines intersect represents the break-even point, which is the level of sales or production at which the business will neither make a profit nor incur a loss.


6 slides
PESTEL Framework Breakdown Presentation
Kickstart your strategic thinking with a bold, colorful layout that makes external business factors easy to understand at a glance. This presentation breaks complex influences into clear, structured sections, helping teams analyze trends and plan with confidence. Fully editable and compatible with PowerPoint, Keynote, and Google Slides.


5 slides
Visual Data Representation Bubble Map
Display complex data in a clean, engaging format with this Visual Data Representation Bubble Map. Ideal for highlighting key points, data clusters, or relationships, each bubble can be customized to match your topic. Perfect for presentations in business, research, or strategy—fully editable in PowerPoint, Keynote, and Google Slides.


5 slides
Customer Inquiry and Response Strategy Presentation
Streamline your communication flow with this step-by-step layout ideal for showcasing inquiry handling processes, customer service touchpoints, or lead response timelines. The linear design includes five fully editable stages with icons and text areas to clarify each phase of your strategy. Perfect for CRM teams, sales ops, and client support leaders. Fully customizable in PowerPoint, Keynote, and Google Slides.


5 slides
Butterfly Chart Data Visualization Presentation
The "Butterfly Chart Data Visualization" presentation template is designed for comparative analysis across multiple options, facilitating easy visualization of data such as performance metrics, survey results, or any other quantifiable comparison. Each option is presented with dual opposing bars extending from a central axis, making it effortless to compare two datasets side by side for each category. This layout helps highlight differences and similarities effectively, ideal for presentations that require detailed analysis and clear visual distinctions between data points.


6 slides
Business RAPID Model Diagram Presentation
Turn decision-making into a visual story with this bold, professional diagram that highlights each stage of responsibility and collaboration. Designed to simplify complex workflows, it’s perfect for outlining business strategies, performance reviews, or team structures. Fully compatible with PowerPoint, Keynote, and Google Slides for easy editing and presentation.


5 slides
Hidden Risks Iceberg Model Diagram Presentation
Spotlight what lies beneath the surface with the Hidden Risks Iceberg Model Diagram Presentation. This slide helps you visually distinguish between visible issues and deeper, less obvious risks—perfect for risk assessments, compliance, safety briefings, and executive strategy discussions. Fully editable in PowerPoint, Keynote, and Google Slides for quick customization.


6 slides
Business Journey Roadmap Planning Presentation
Map out strategic progress with this Business Journey Roadmap Planning presentation. Ideal for outlining key steps, milestones, and achievements, this staircase-style layout visually guides your audience through your business journey. Fully editable in Canva, PowerPoint, and Google Slides—perfect for project planning, goal setting, and executive updates.


6 slides
User Experience Rating System Presentation
Evaluate user satisfaction with this user experience rating system template! Designed to visually represent feedback levels, this structured layout helps businesses analyze customer experiences, identify strengths, and address pain points. Perfect for UX research, surveys, and performance assessments. Fully customizable and compatible with PowerPoint, Keynote, and Google Slides