


Features
- 7 Unique slides
- Fully editable and easy to edit in Microsoft Powerpoint, Keynote and Google Slides
- 16:9 widescreen layout
- Clean and professional designs
- Export to JPG, PDF or send by email


Do you have any questions?
Recommend


5 slides
Business Innovation Strategy Presentation
Present a compelling Business Innovation Strategy with this modern infographic. Designed to highlight key insights, innovative solutions, and strategic approaches, this template is perfect for business professionals, consultants, and startups. Fully editable and compatible with PowerPoint, Keynote, and Google Slides.


10 slides
Key Information Recap Summary
Conclude your presentation with clarity using this Key Information Recap Summary slide. Featuring a modern key-shaped design with four customizable sections, it’s perfect for summarizing essential insights. Fully compatible with PowerPoint, Keynote, and Google Slides.


6 slides
30 60 90 Manager Infographic
A 30-60-90 day plan outlines an individual's goals and tasks for the first three months of a new job, project, or role. This infographic template outlines the goals and tasks a manager plans to achieve during the first 30, 60, and 90 days of their role. This is a helpful tool to communicate objectives and strategy to your team. Design the infographic so that it's easy to share. The 30-60-90 Manager Infographic serves as a roadmap for the manager's initial months and provides transparency to their team about their goals and priorities. Use a consistent color scheme that aligns with your company's branding.


12 slides
Cloud-Based Digital Transformation Presentation
Illustrate your path to digital evolution with this multi-cloud infographic layout. Perfect for visualizing service integrations, SaaS environments, or migration strategies, this slide highlights five key areas of transformation using cloud-shaped icons and a central connectivity hub. Fully customizable in PowerPoint, Keynote, and Google Slides.


7 slides
App Mockup Infographic
Elevate your app demonstrations with this vibrant collection of app mockup templates, specifically designed to showcase the functionality and design of mobile applications across various devices. Each template emphasizes the user experience, presenting your app in a clear and engaging manner that highlights its most compelling features. The templates are crafted with a clean, modern aesthetic, incorporating bright colors and clear typography to draw attention to key functionalities and user interfaces. Perfect for developers and designers looking to present their apps to clients, stakeholders, or potential users, these mockups provide a professional framework for displaying apps in context. Customizable to fit your specific needs, this collection allows you to seamlessly integrate your own app designs and screenshots, making it easier than ever to convey the look and feel of your app in a realistic setting. Whether for pitches, presentations, or promotional materials, these mockups are an invaluable tool for communicating the value and operation of your application.


6 slides
Visual Resource Allocation Gantt
Easily map out team workload over time with the Visual Resource Allocation Gantt Presentation. This slide helps you assign tasks across monthly intervals, track resource distribution, and identify scheduling conflicts. Perfect for project managers, department heads, and HR planners aiming to balance capacity and timelines. Fully editable in PowerPoint, Keynote, and Google Slides.


7 slides
Feedback Infographics Presentation Template
The goal of feedback is to recognize strengths and improve weaknesses. Feedback, both positive and negative, helps us see what we can improve on in order to better our results. This template is perfect for understanding how essential feedback is, and learning how to deliver feedback in a productive way. It provides positive criticism, showing what you can improve to achieve better results and success. Feedback provides the opportunity to learn, and is the most effective way to improve your skills. This template makes it simple to create an informed and well-rounded presentation to share.


7 slides
Finance Dashboard Infographic
A finance dashboard is a visual representation of financial data and key performance indicators (KPIs) that provides an overview of an organization's financial health and performance. This infographic template is a tool that allows users to monitor and analyze financial data in a clear and concise manner. This offers a comprehensive overview of financial performance, budgeting, and forecasting for individuals or businesses. The template features a clean and modern design with a professional color scheme, easy-to-read fonts, and intuitive layout. The visuals are thoughtfully organized to convey financial information effectively and engage the audience.


4 slides
Report Recap and Summary Section Presentation
Summarize key takeaways clearly with this Report Recap and Summary Section slide. Featuring a step-by-step horizontal layout with bold numbering, icons, and text boxes, this design helps emphasize three main points or stages in your report. Ideal for executive briefs or performance reviews. Fully editable in Canva, PowerPoint, or Google Slides.


4 slides
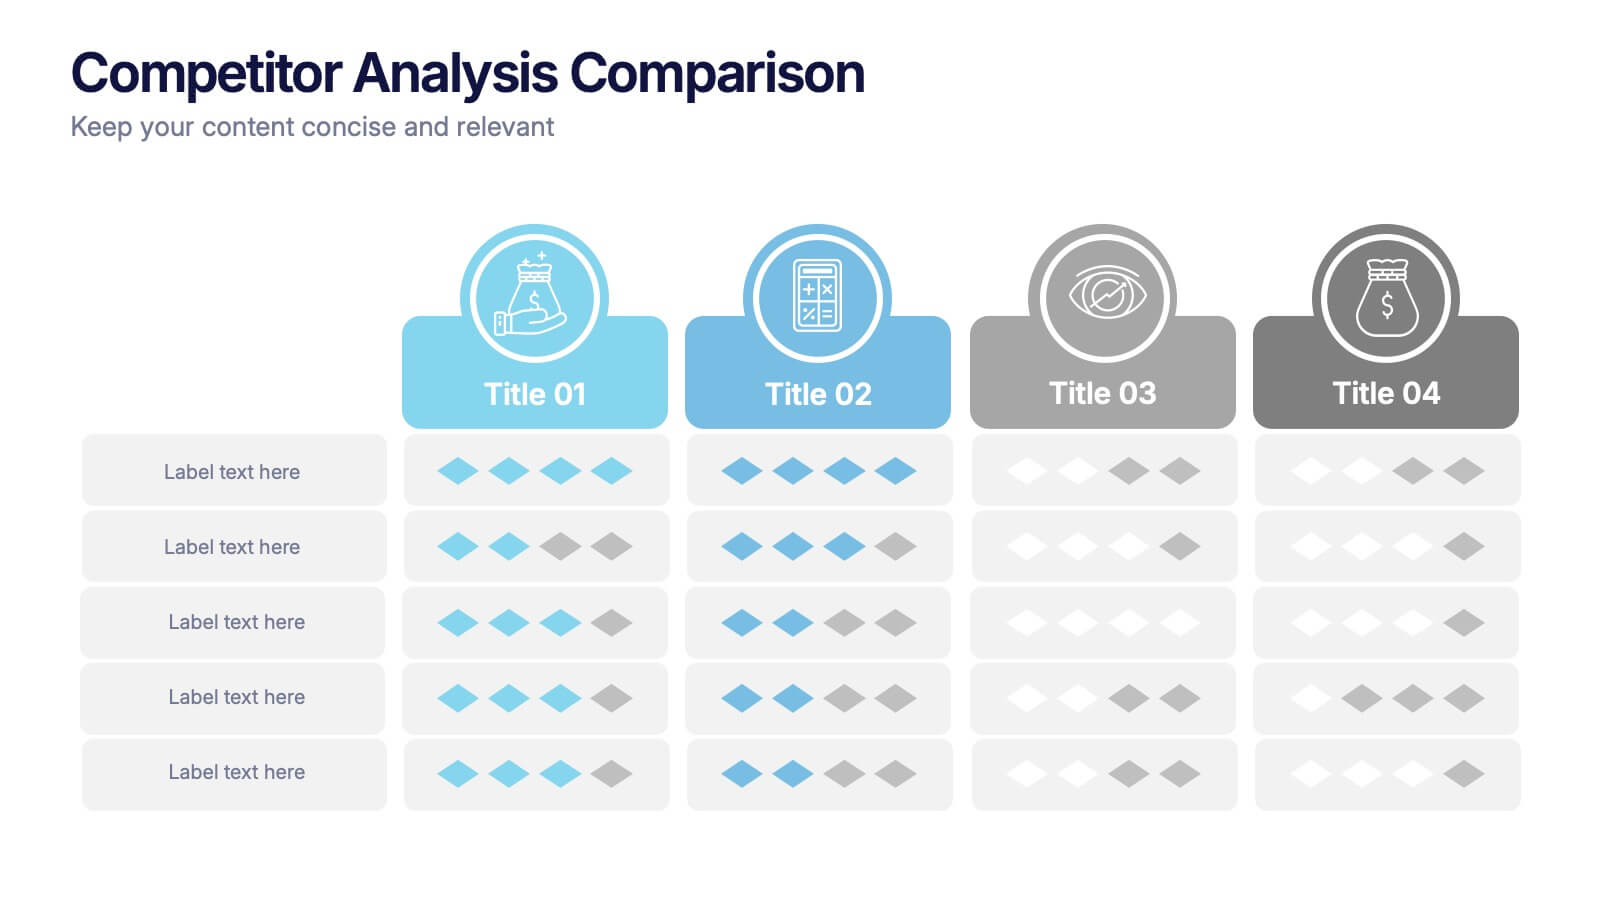
Competitor Analysis Comparison Presentation
Quickly evaluate strengths and weaknesses across your market landscape with this Competitor Analysis Comparison Presentation. Featuring clean tables, icons, and rating visuals, it's ideal for highlighting where your brand stands out. Fully editable in PowerPoint, Keynote, and Google Slides.


7 slides
Urban Ecology Illustrated Infographics
Ecology is the scientific study of the interactions between organisms and their environment. This ecology template will help you explain the science behind our world. This is great for anyone who is presenting information about ecology, environment, or sustainability. You can use this infographic as is or customize it by changing the colors and fonts of each slide. You can also add your own images, and text by downloading in Powerpoint, Keynote, or Google Slides. This Template comes with a wealth of key facts and figures on eco-friendly living and presents them in an infographic style.


5 slides
Company Success Story Timeline Presentation
Highlight your journey with the Company Success Story Timeline Presentation. This modern, mountain-style layout helps you break down your company’s key milestones, phases, or achievements step by step. With five customizable stages and icons, it’s ideal for visual storytelling, growth metrics, or project retrospectives. Fully editable in Canva, PowerPoint, Keynote, and Google Slides.


10 slides
National Distribution Network in the US Presentation
Present your logistics strategy with clarity using the National Distribution Network in the US Presentation. This slide visually maps out your key distribution hubs across the country, pairing each location with a numbered label and space for insights or logistics data. Ideal for supply chain overviews, retail operations, or partner briefings. Fully editable in Canva, PowerPoint, and Google Slides.


6 slides
Strategic Business Objective Mapping Presentation
Clearly define your strategic focus with this Strategic Business Objective Mapping slide. Designed to display six core objectives around a central theme, it’s ideal for visualizing business goals, departmental priorities, or key initiatives. Fully customizable in PowerPoint, Canva, and Google Slides for seamless team collaboration.


6 slides
Executive Summary Marketing Infographic
An executive summary is a concise overview of a longer document, report, or proposal, designed to provide readers with a quick understanding of the main points and key takeaways. This infographic template provides a concise and visually appealing overview of a marketing plan, campaign, or strategy. This condenses key information into a format that is easy to understand and presents the most important highlights for decision-makers. This template is a valuable tool to quickly convey the main points and benefits of a document, allowing readers to make informed decisions about whether to delve deeper into the details.


6 slides
Business Funding Pitch Deck Presentation
Secure funding with confidence using this Business Funding Pitch Deck template. Designed to communicate your business model, growth potential, and financial strategy, it helps you make a strong case to investors. Engage your audience with a clear, structured layout. Fully compatible with PowerPoint, Keynote, and Google Slides for effortless customization.


7 slides
Agile Methodology Infographic Presentation Template
Agile methodology is a project management approach that emphasizes flexibility, collaboration, and customer satisfaction. It is often used in software development and IT projects, but can also be applied to other fields. This template is perfect for showing how to get things done quickly and efficiently. This template includes many different cool diagrams and charts that you can customize to show how Agile Methodology works. This Agile methodology template will break down your project into smaller chunks and deliver them in stages, allowing for adjustments and improvement along the way.