


Features
- 6 Unique slides
- Fully editable and easy to edit in Microsoft Powerpoint, Keynote and Google Slides
- 16:9 widescreen layout
- Clean and professional designs
- Export to JPG, PDF or send by email


Do you have any questions?
Recommend

22 slides
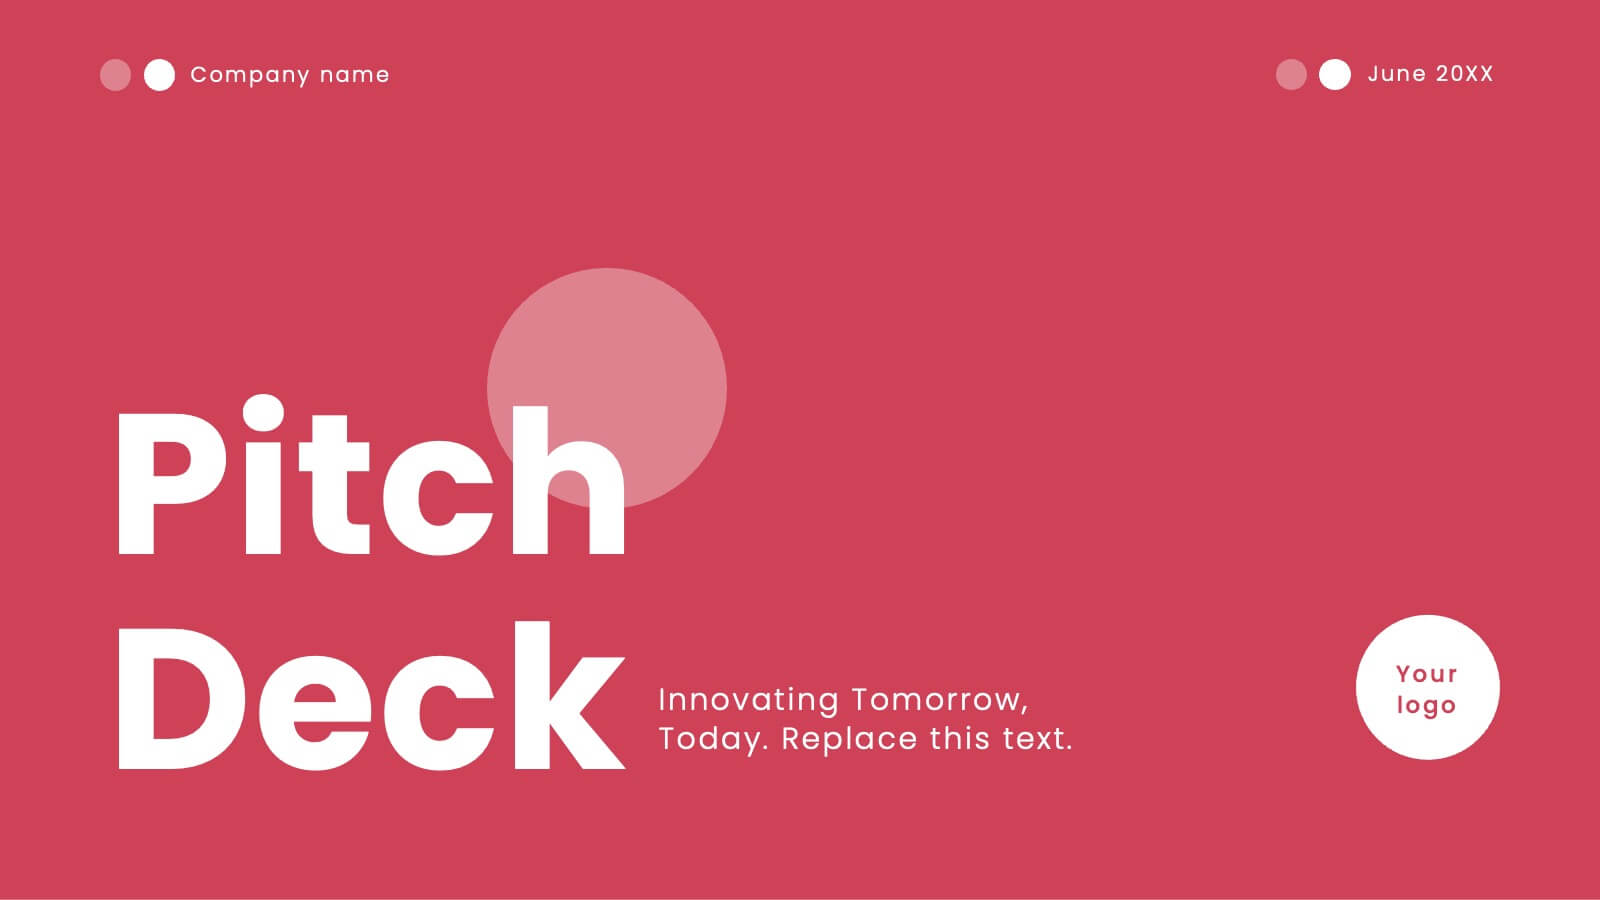
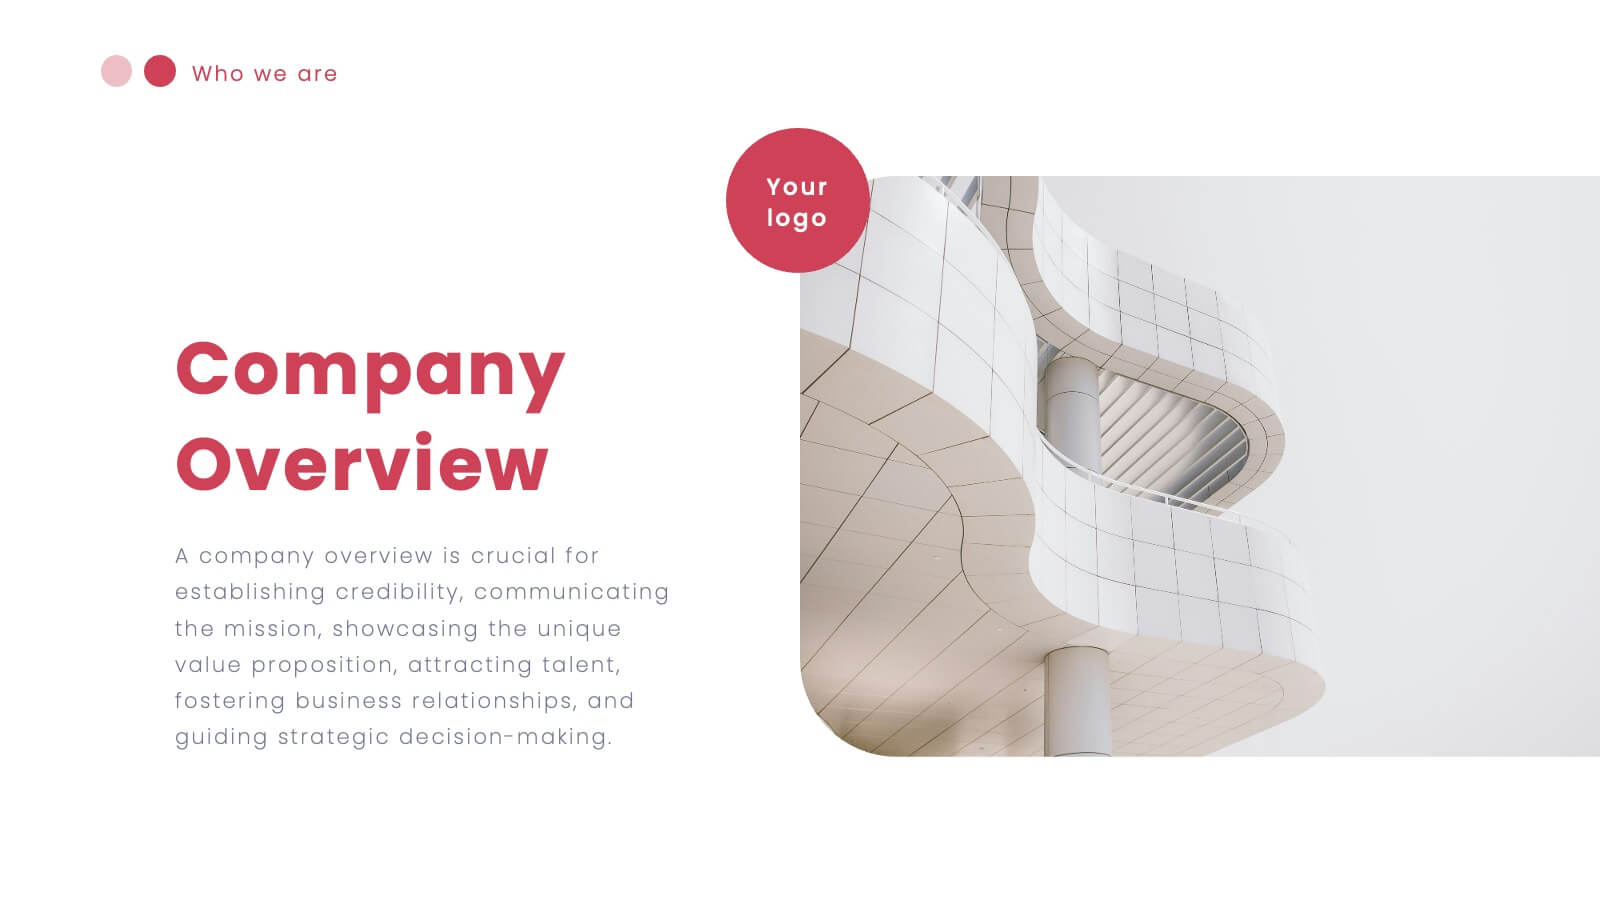
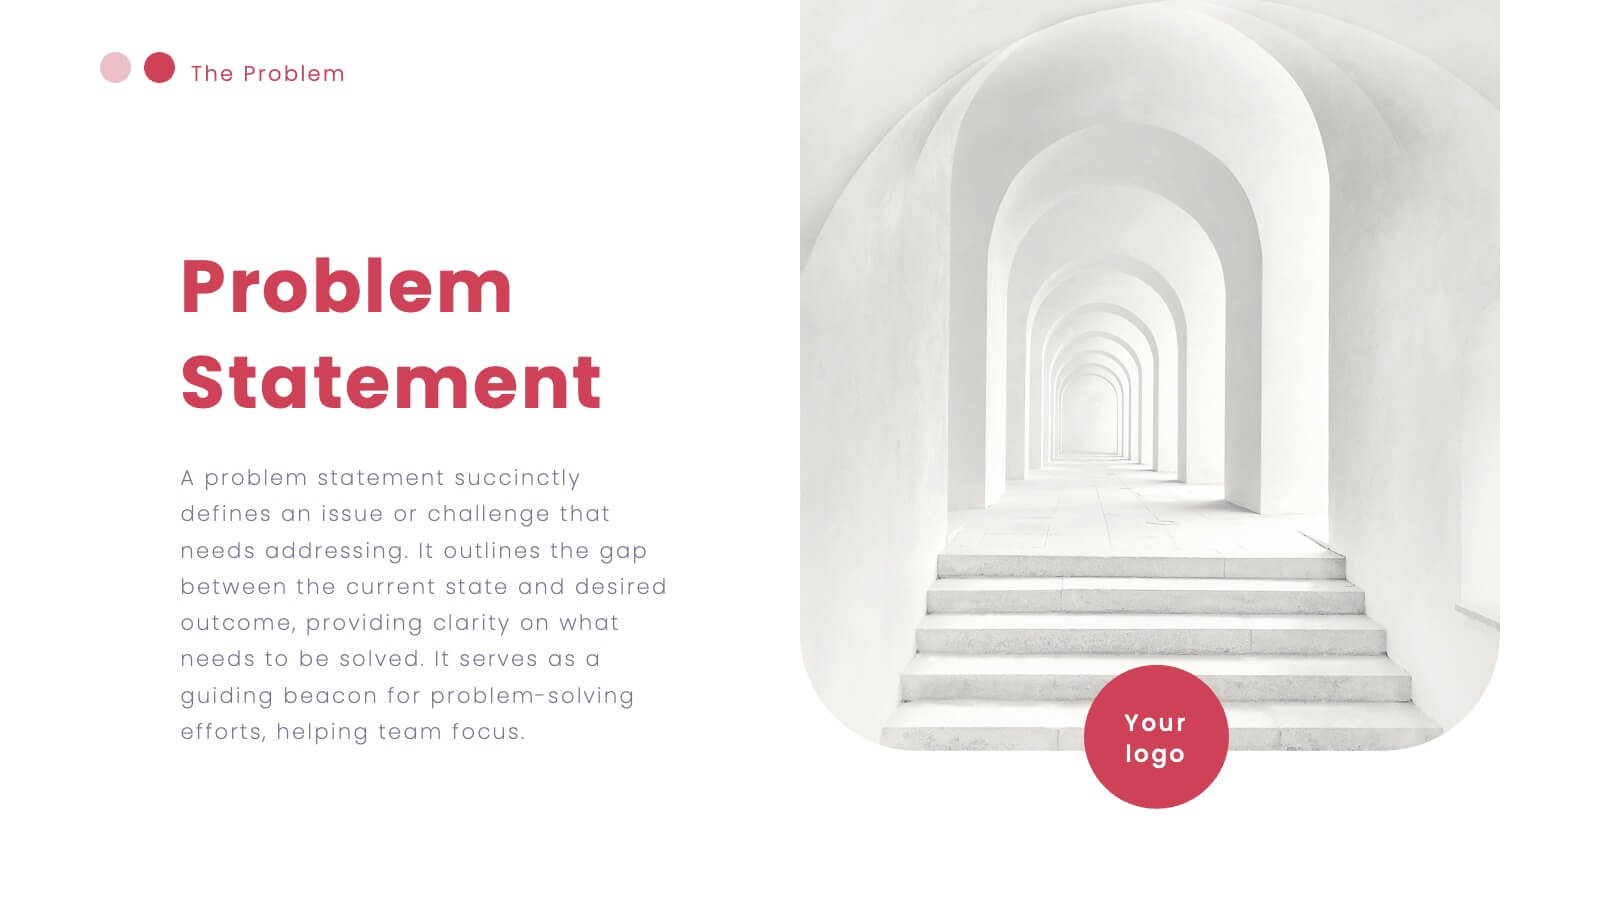
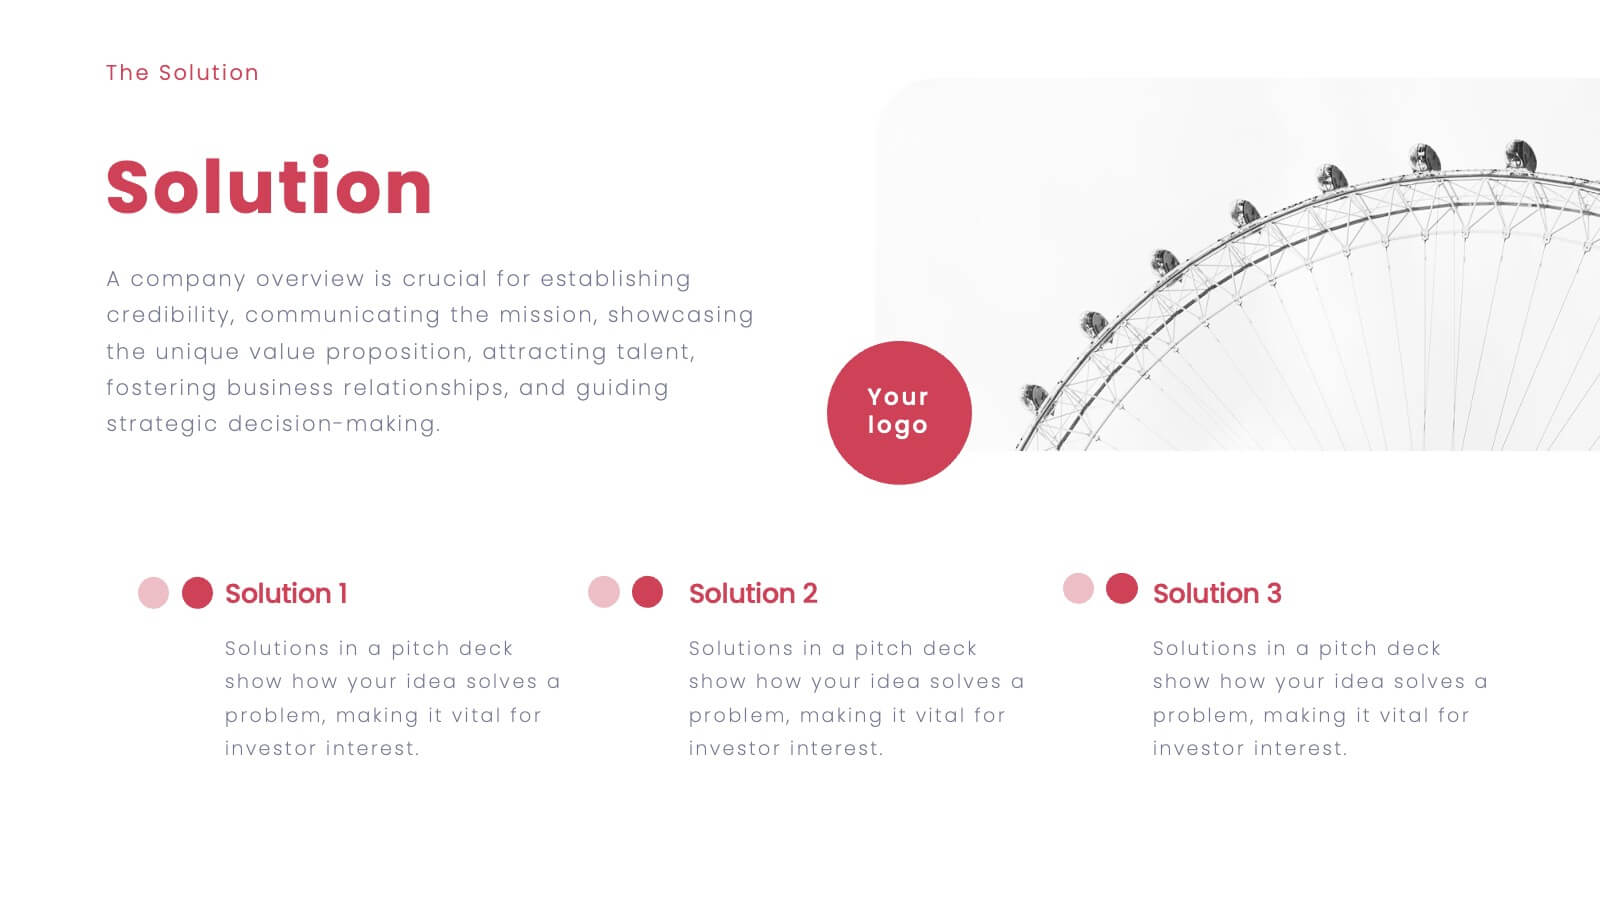
Vortex Startup Pitch Deck Presentation
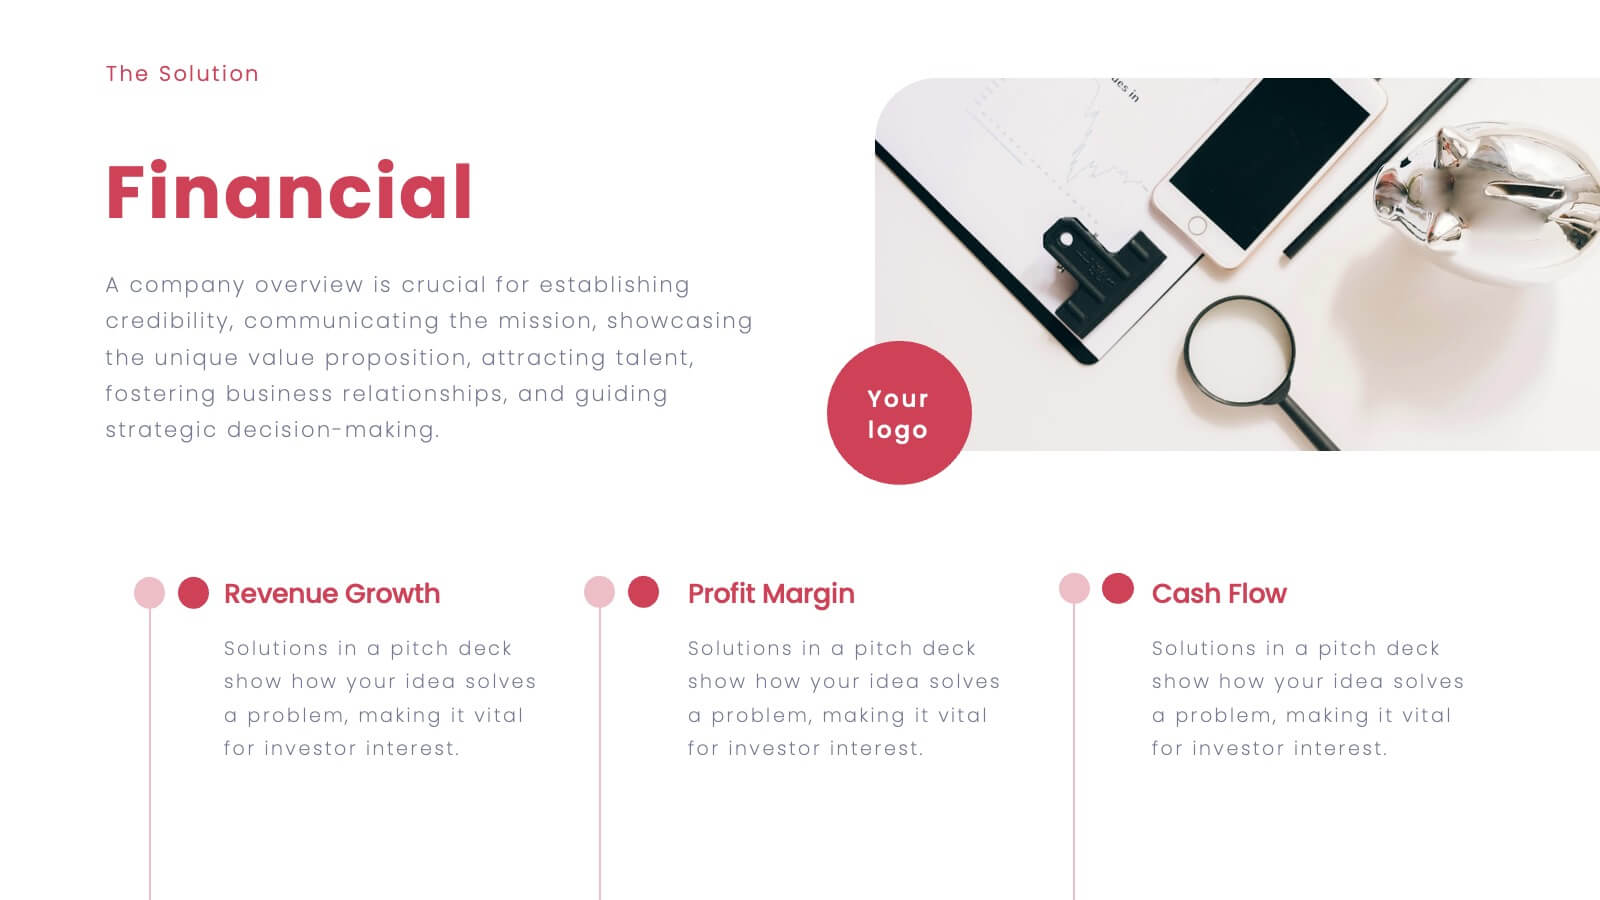
Launch your ideas into action with this vibrant red pitch deck template, designed to captivate and inform potential investors. It covers everything from company overview to financials and market strategy, ensuring your vision is communicated effectively. Compatible with PowerPoint, Google Slides, and Keynote, this template is perfect for startups seeking to impress and engage.


5 slides
Signs of Diabetes Infographics
There are several common signs and symptoms of diabetes that may indicate the presence of the condition. It's important to note that the symptoms can vary depending on the type of diabetes (Type 1 or Type 2) and individual differences. These infographic templates are informative tools made to help educate individuals about the signs and symptoms of diabetes. These are designed to raise awareness about diabetes, its early warning signs, and the importance of early detection and management. These infographic templates can be effective tools for health professionals, educators, and individuals seeking to understand the signs and symptoms of diabetes.


7 slides
Market Research Data Insights
Present insights with impact using this Market Research Data Insights slide. Featuring six circular data points with icons and space for strategic commentary, it's ideal for showcasing key findings, trends, or survey results. Fully editable in PowerPoint, Keynote, and Google Slides for versatile use.


2 slides
Business Briefing Executive Summary Presentation
Summarize your strategy with impact using this Business Briefing Executive Summary Presentation. Featuring modern layout options, photo placeholders, and bold typography, this cover slide is ideal for team updates, pitch decks, or project reports. Fully editable in PowerPoint, Google Slides, Keynote, and Canva.


21 slides
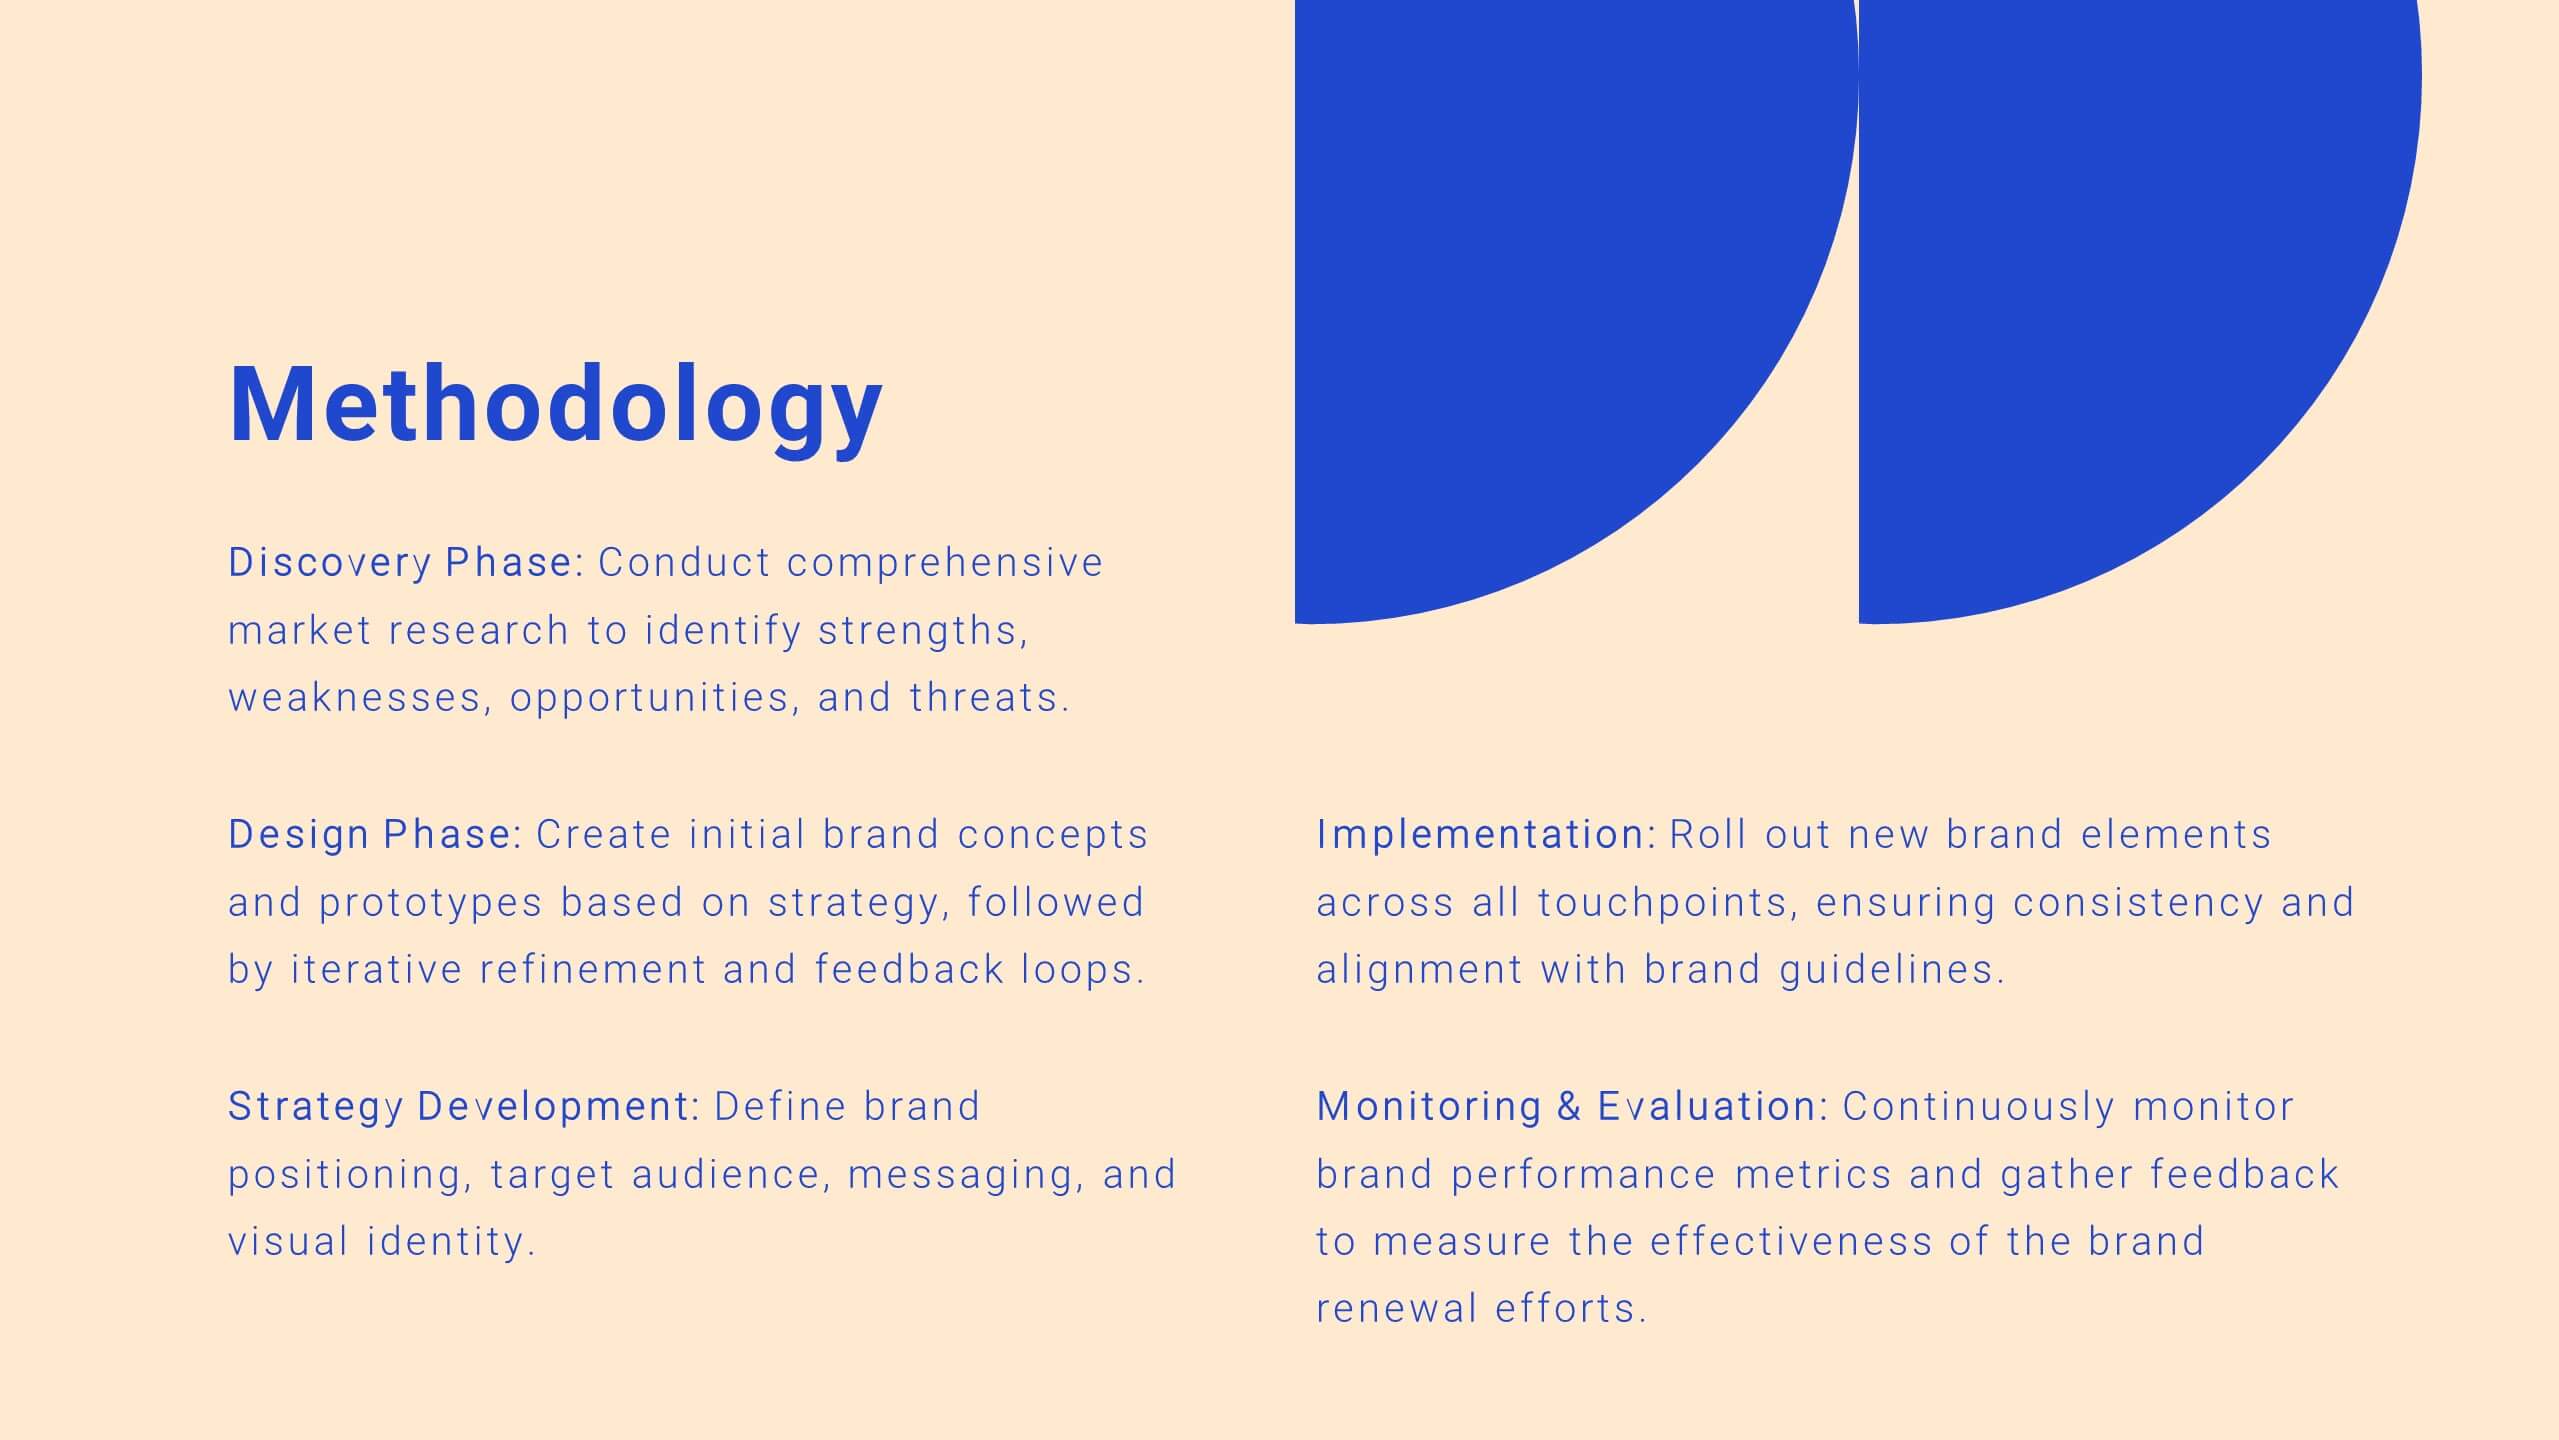
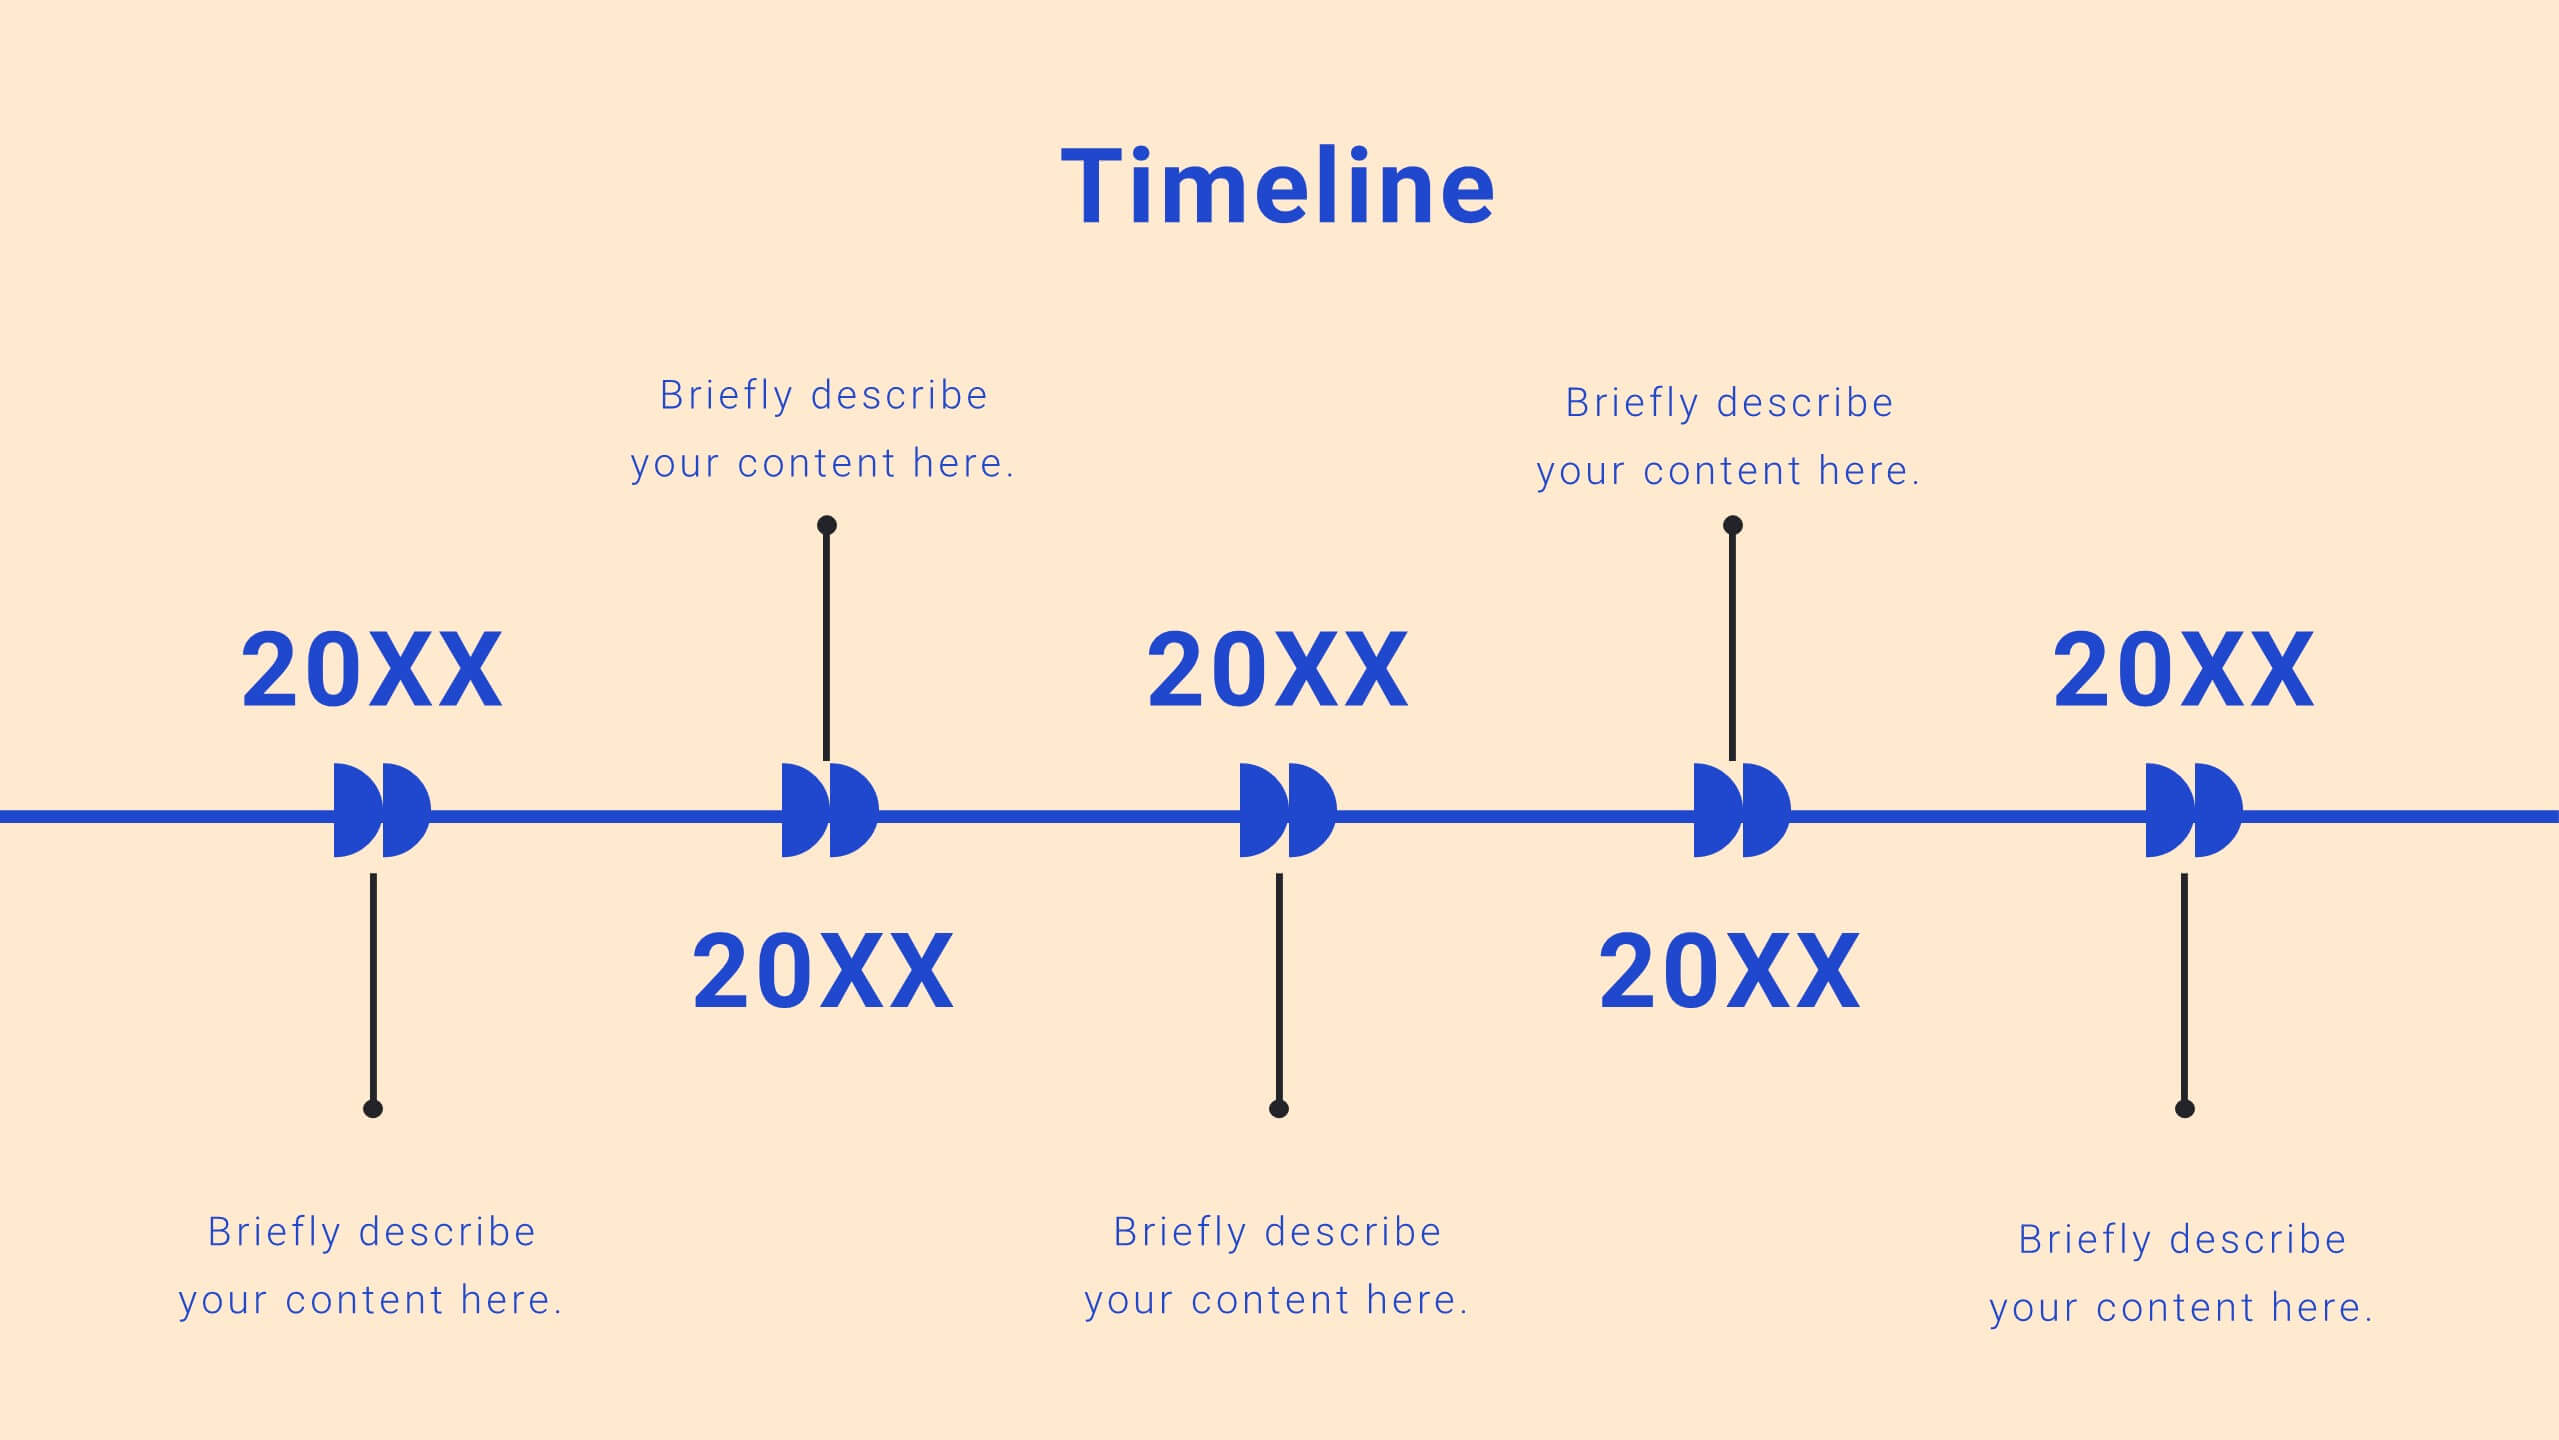
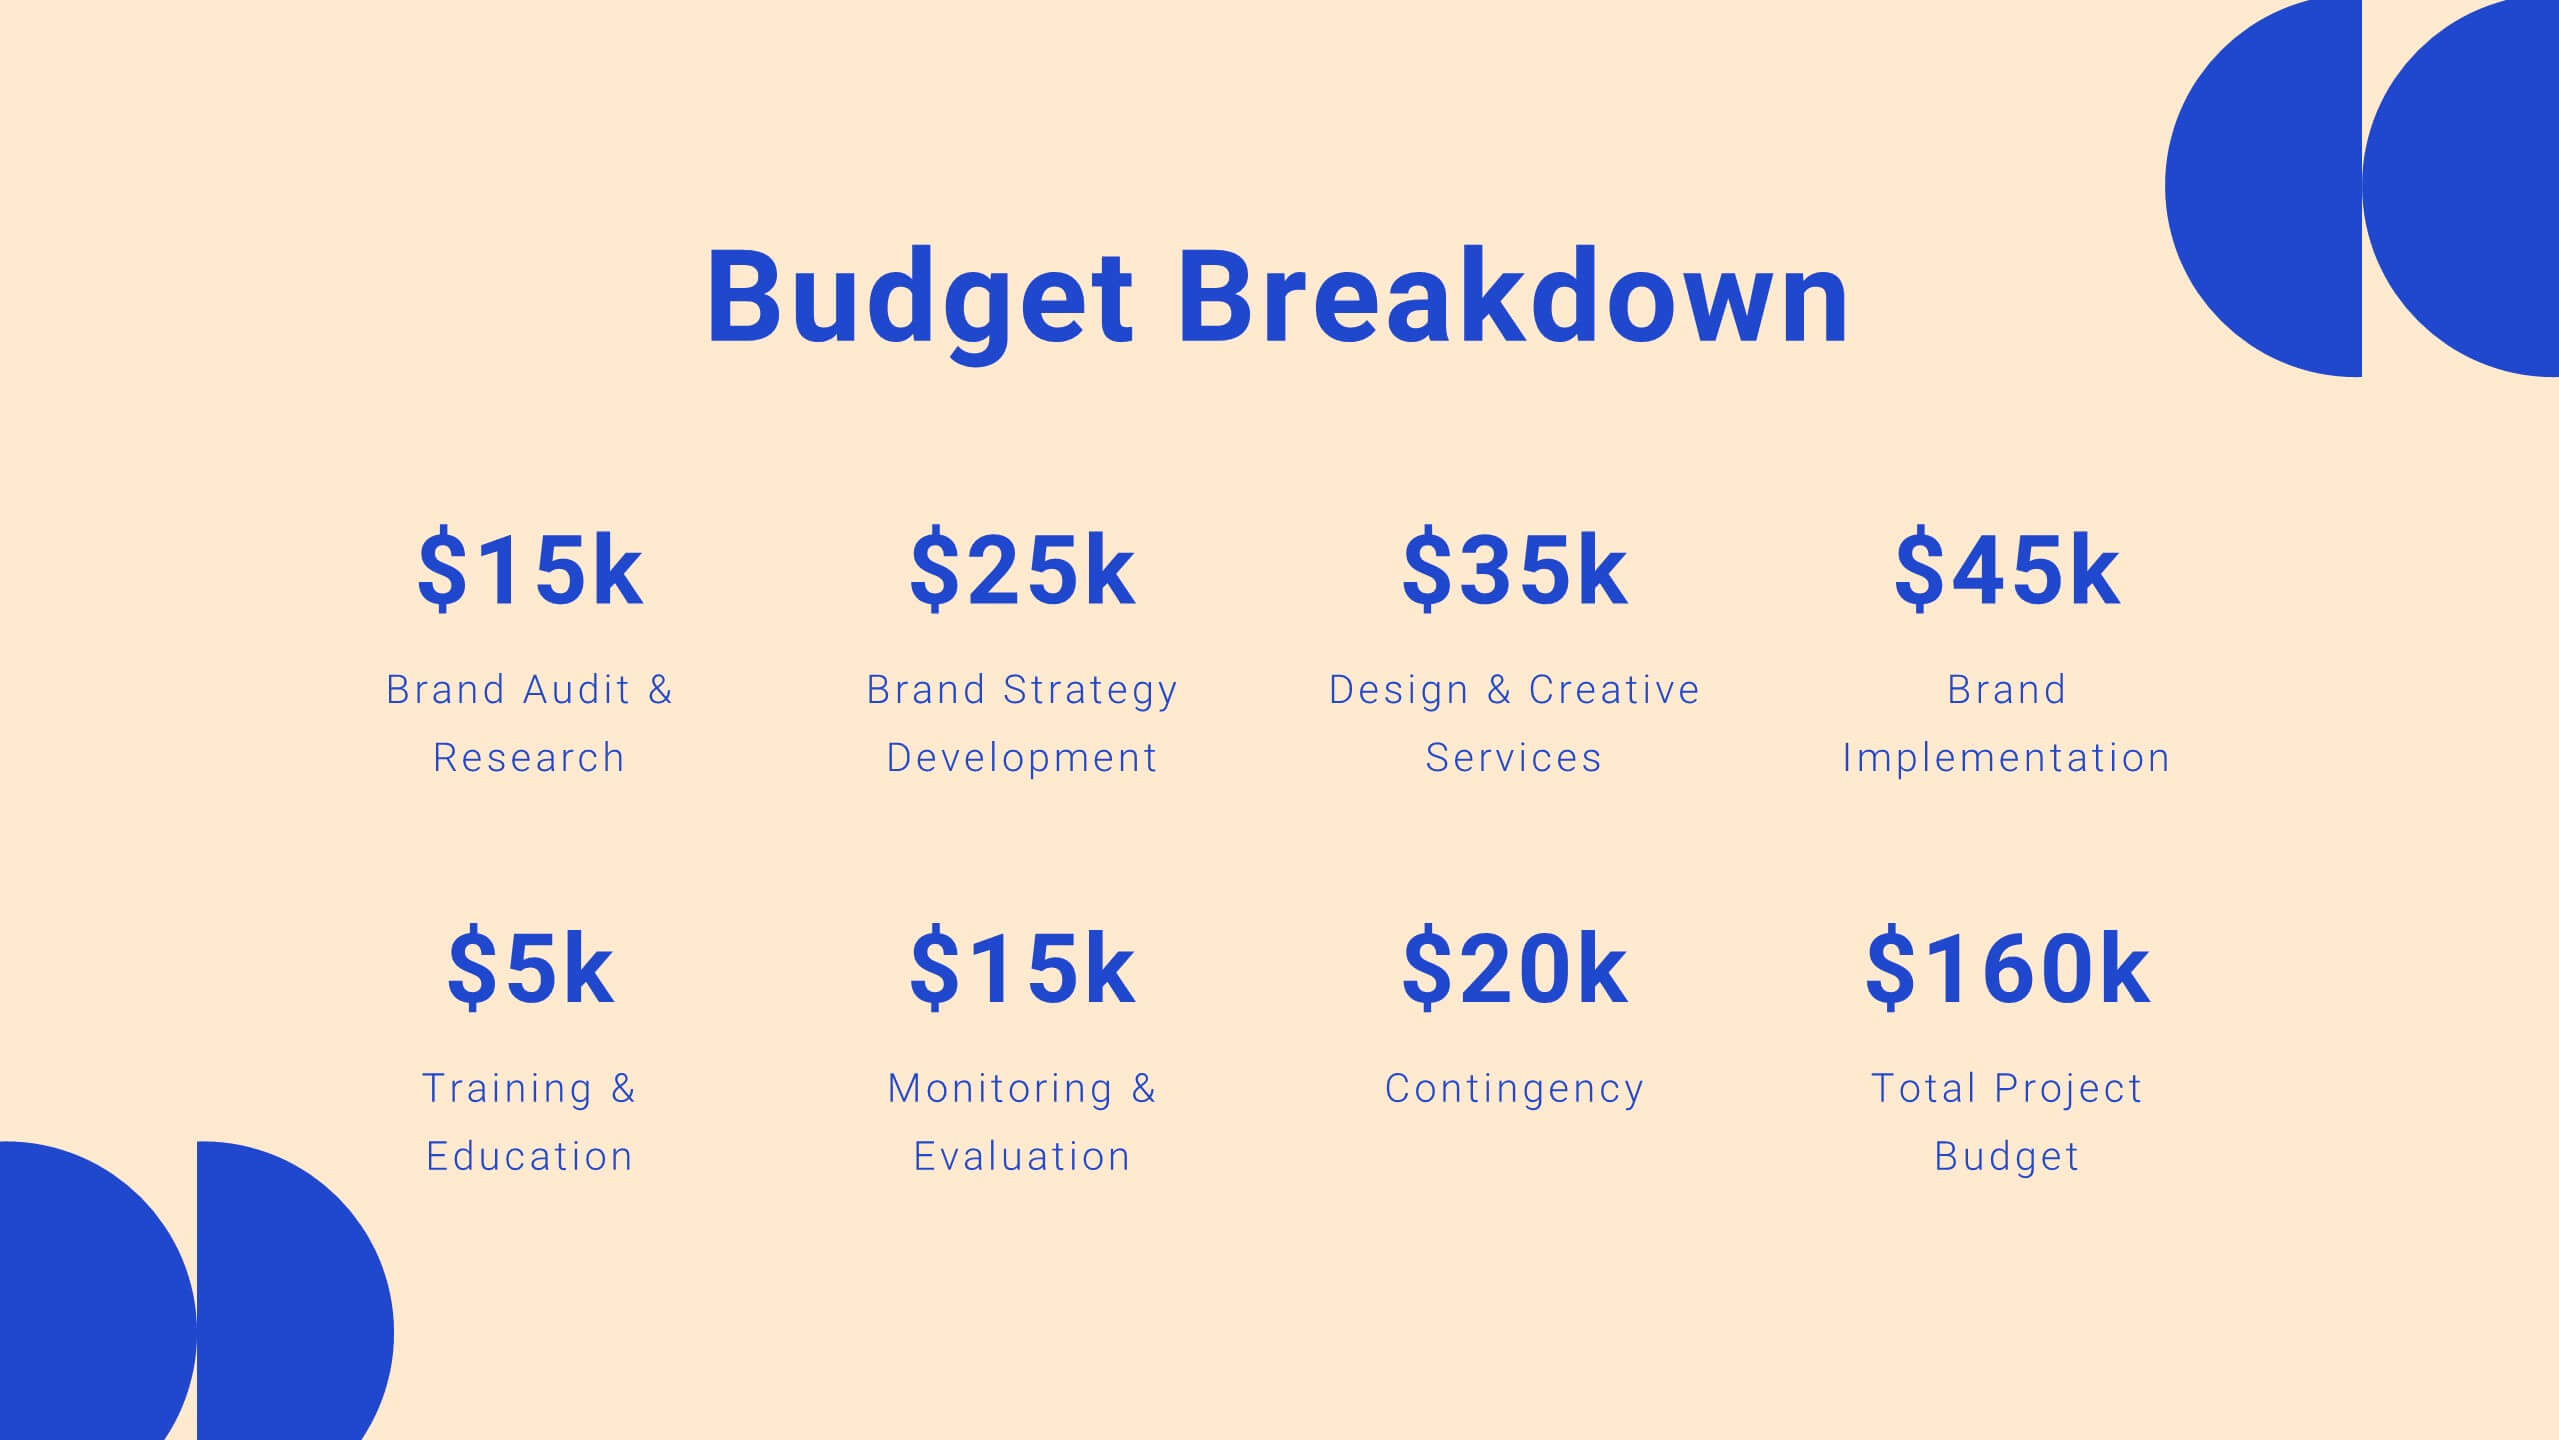
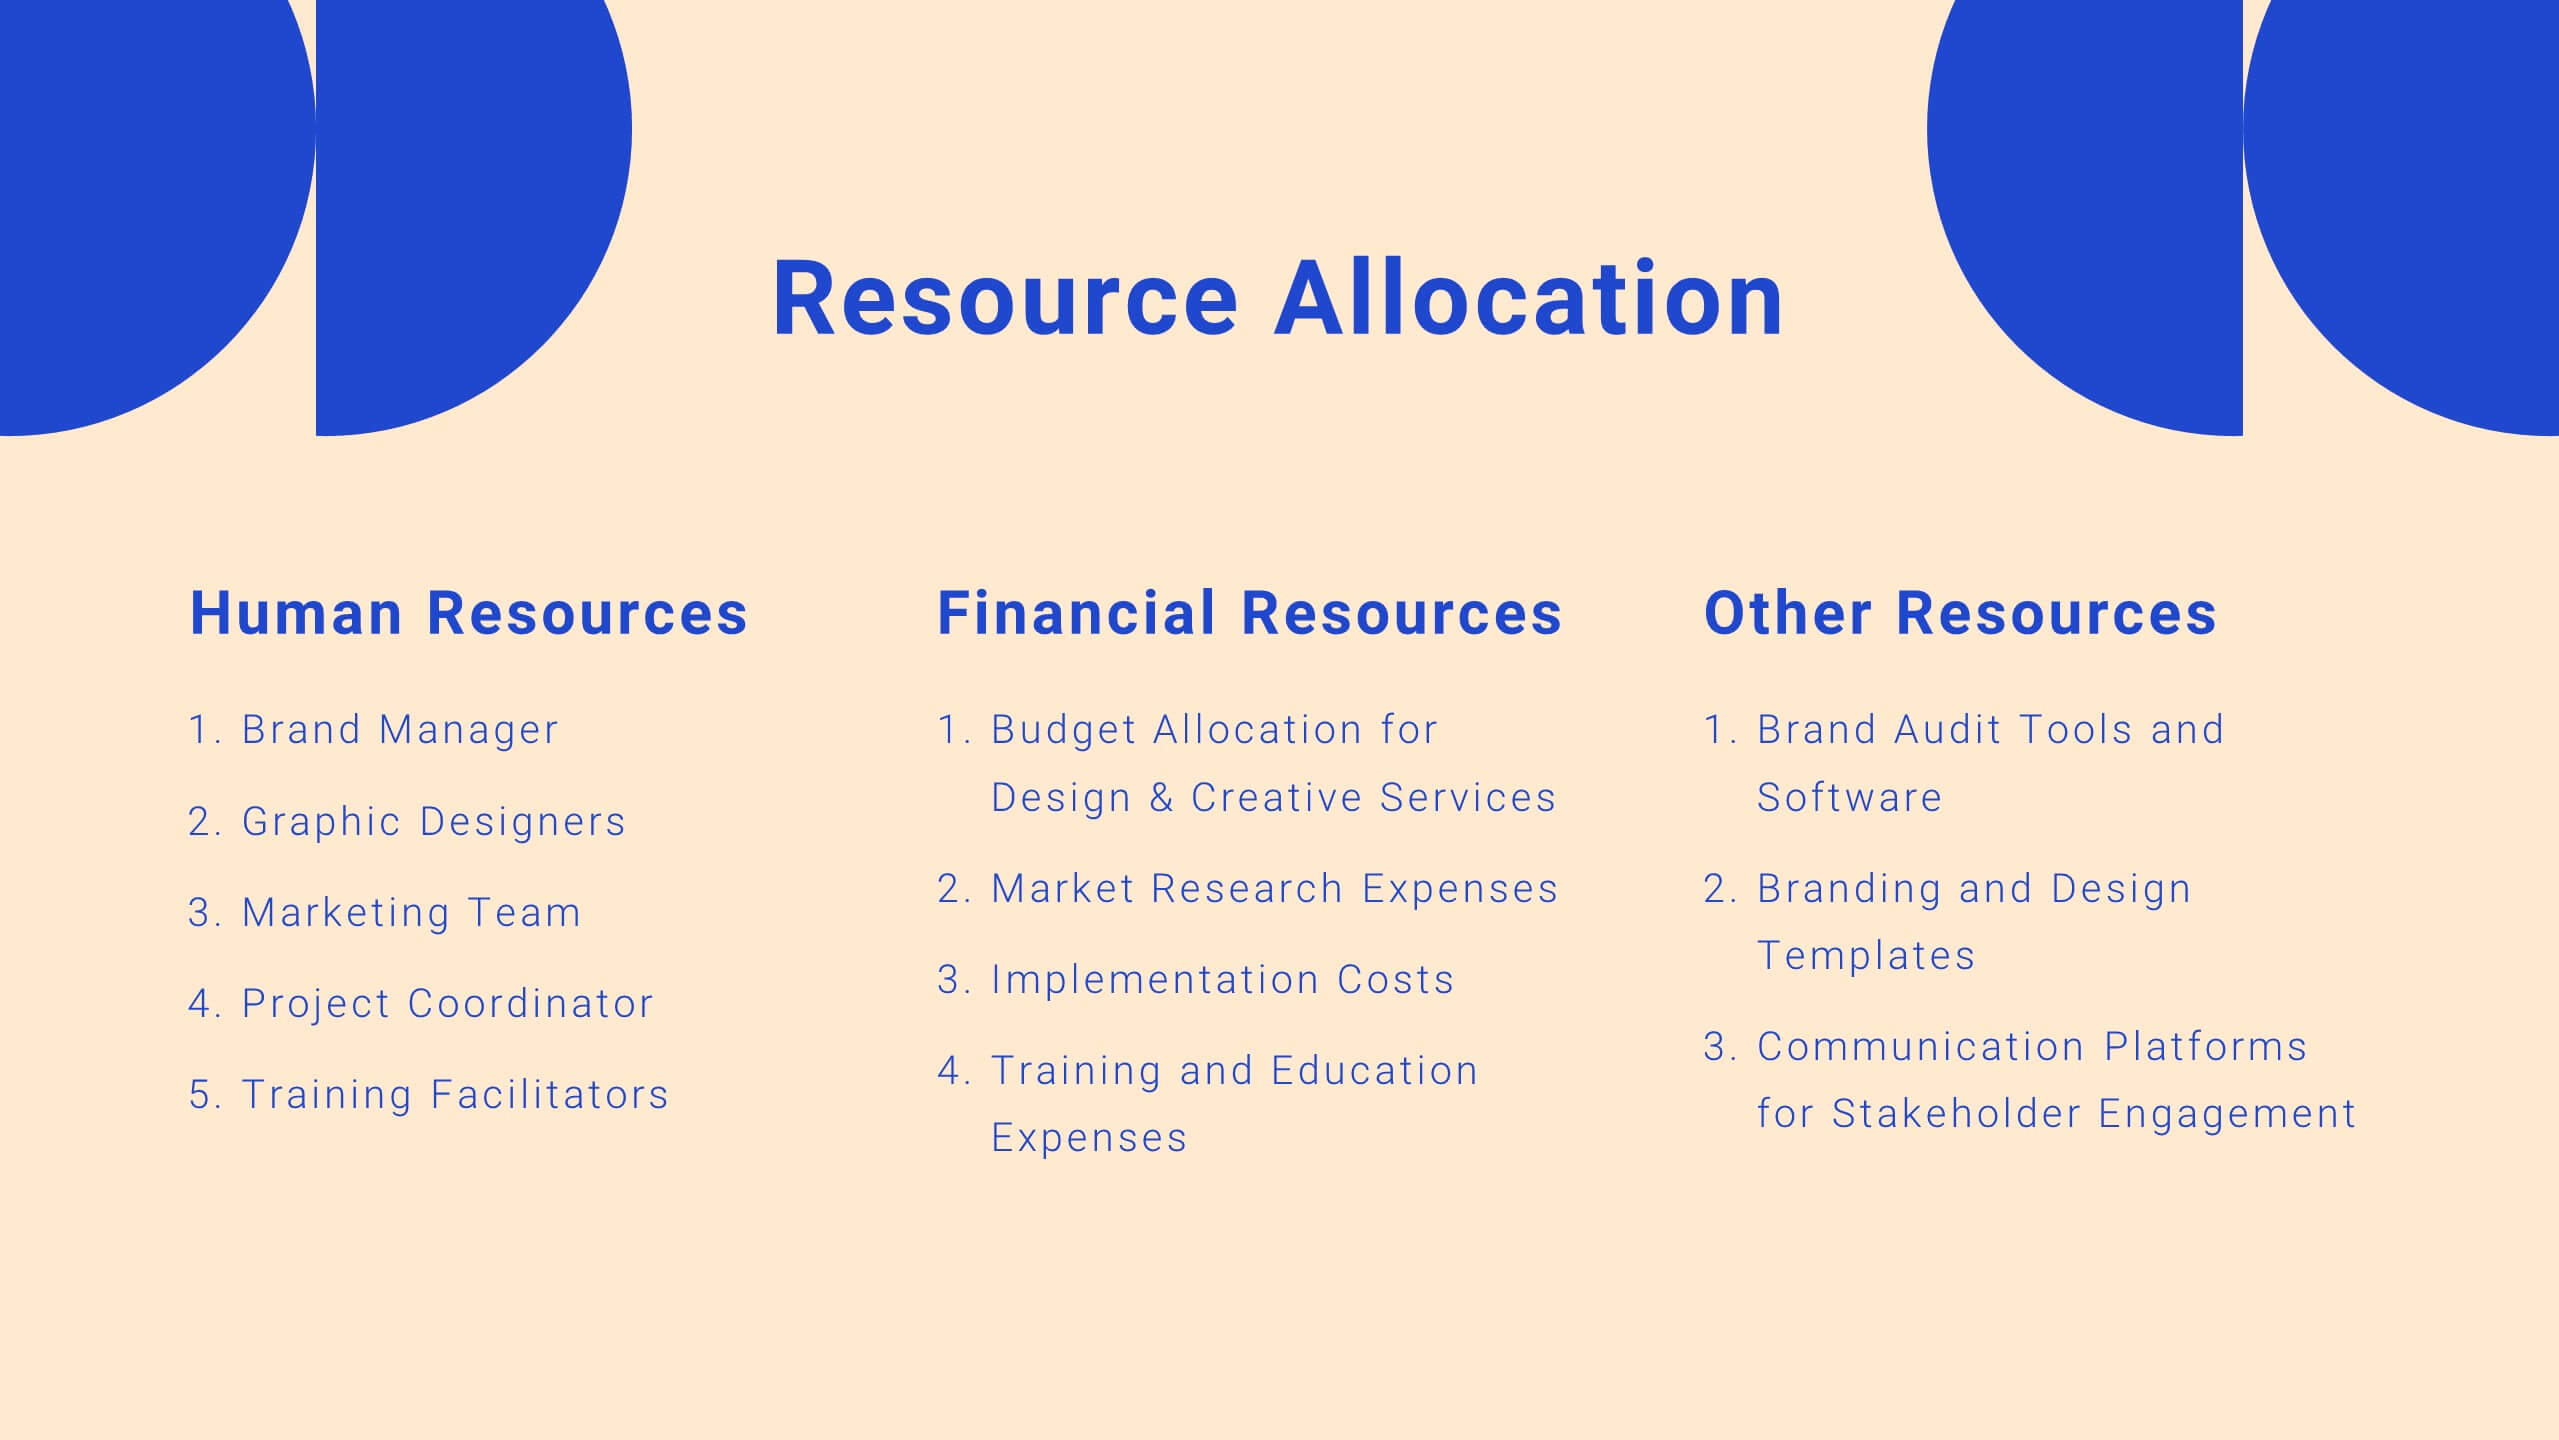
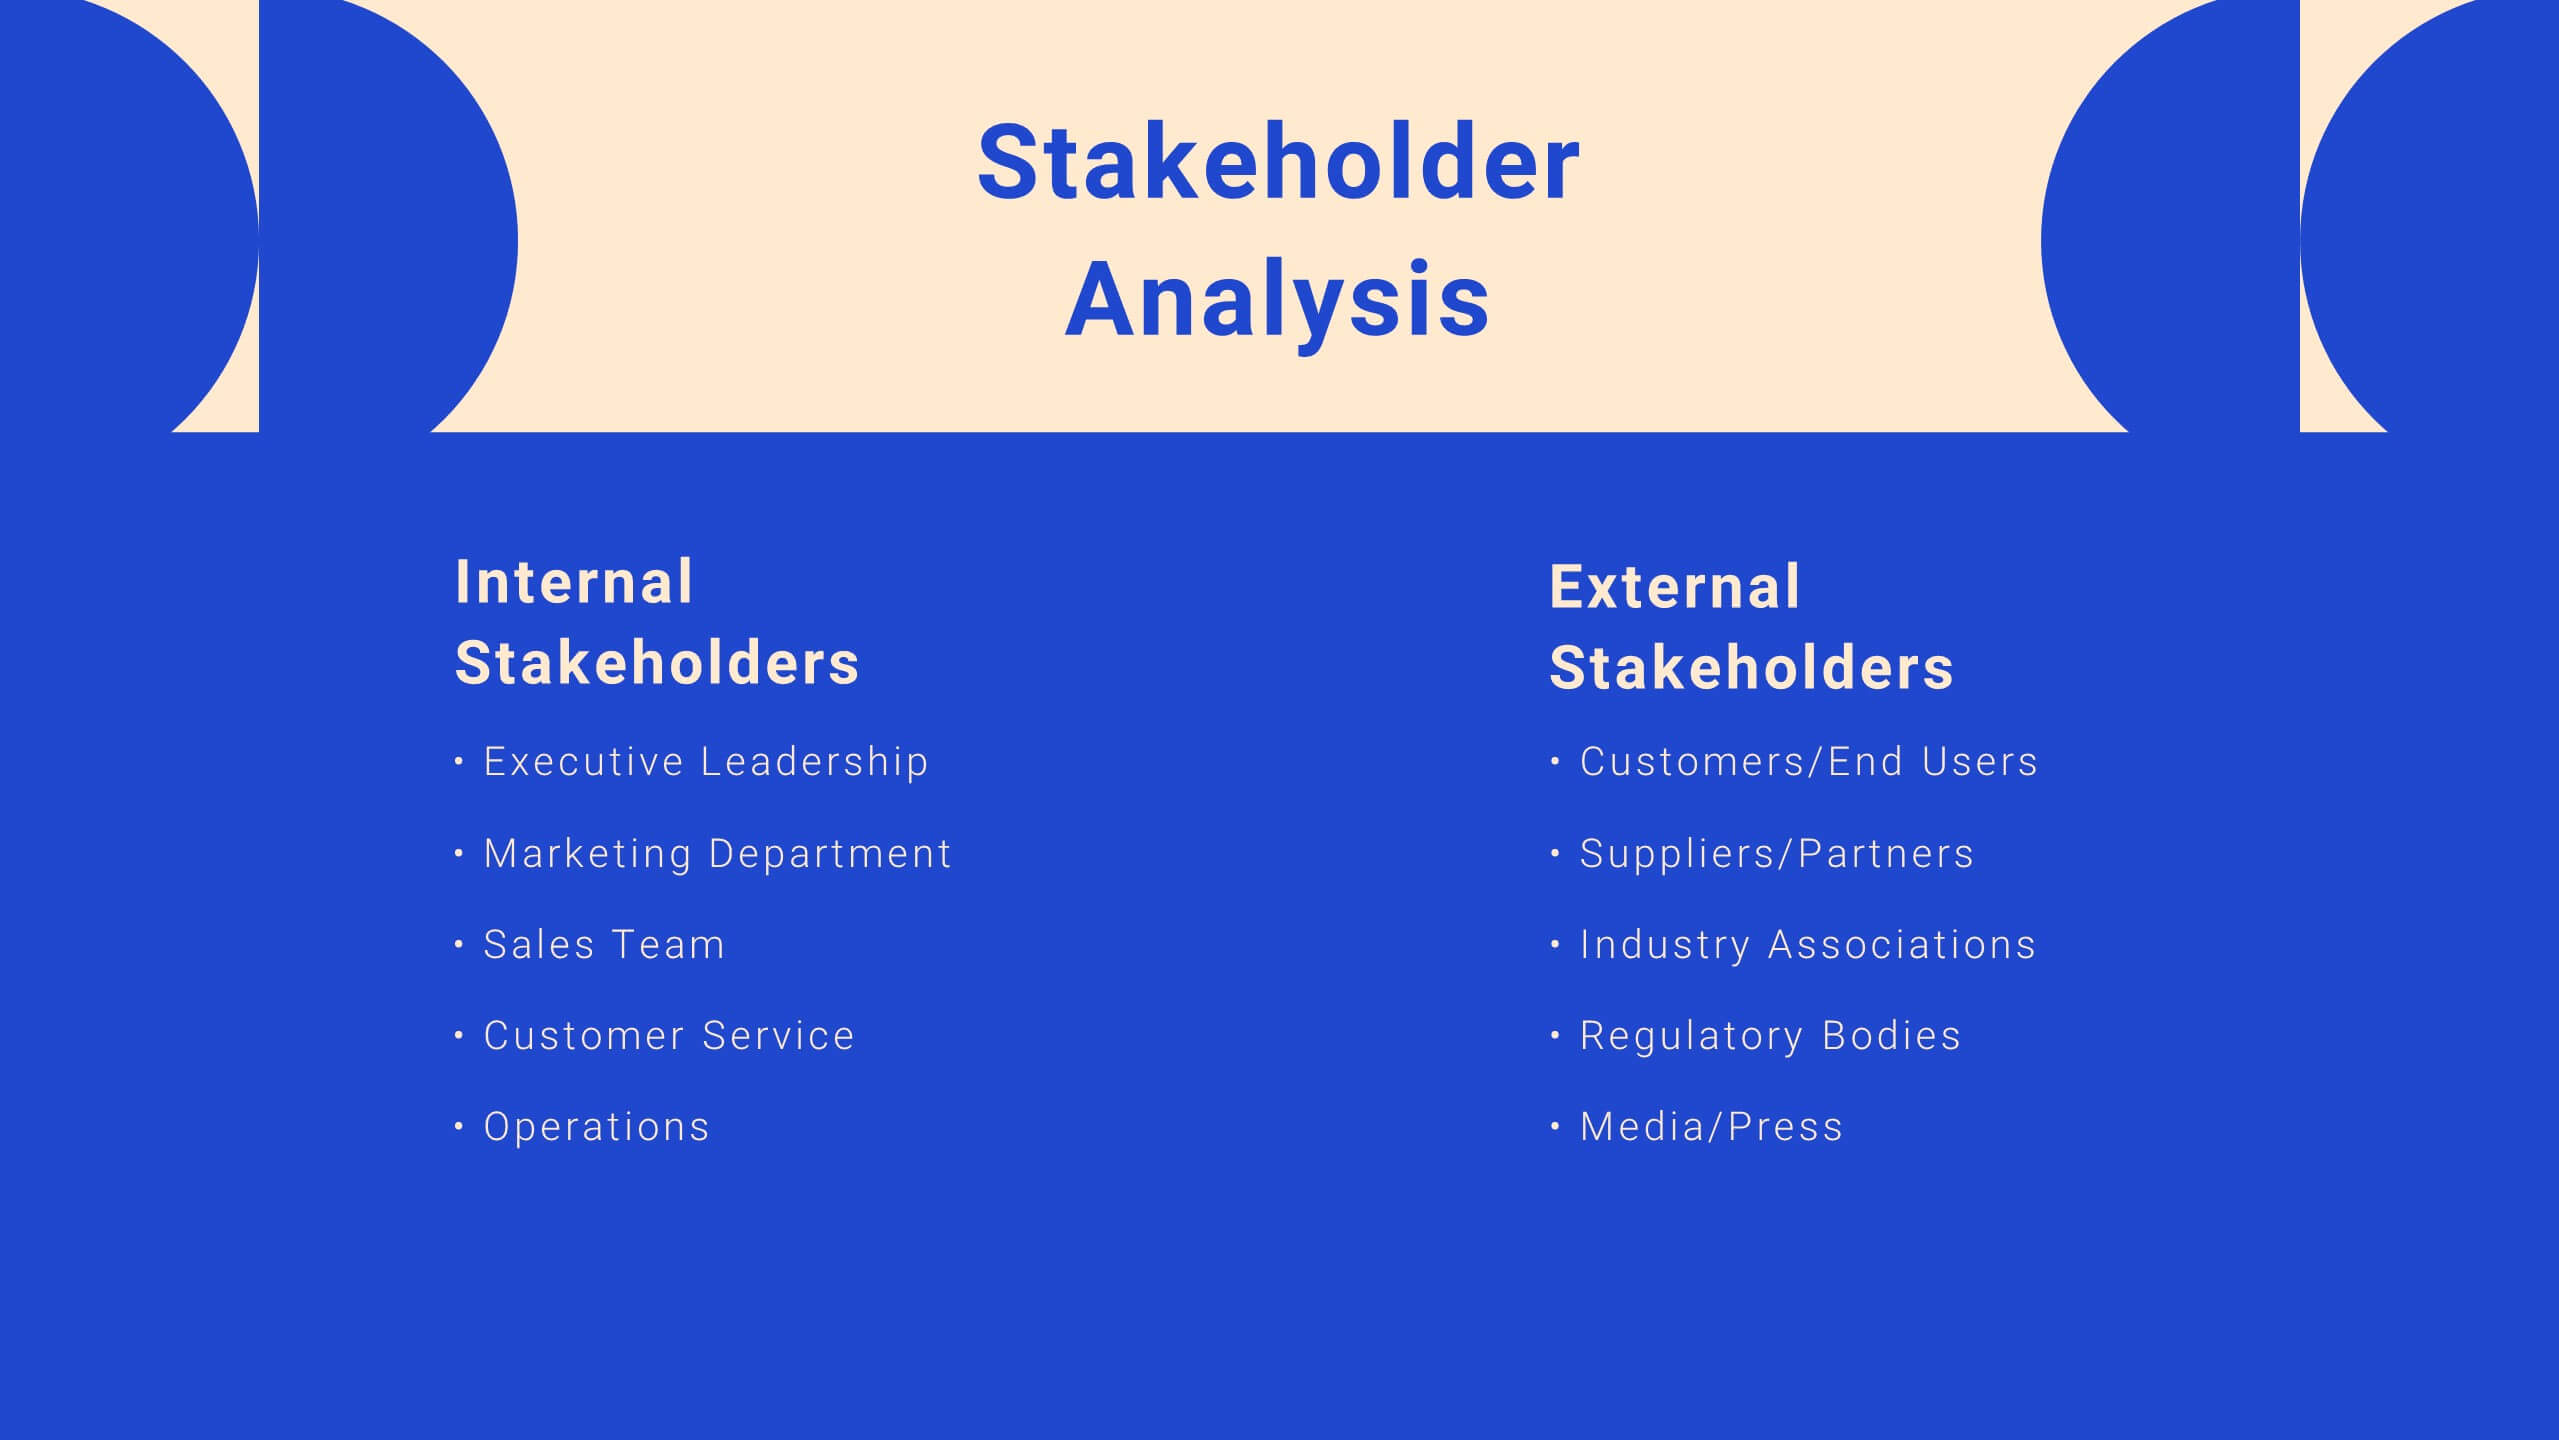
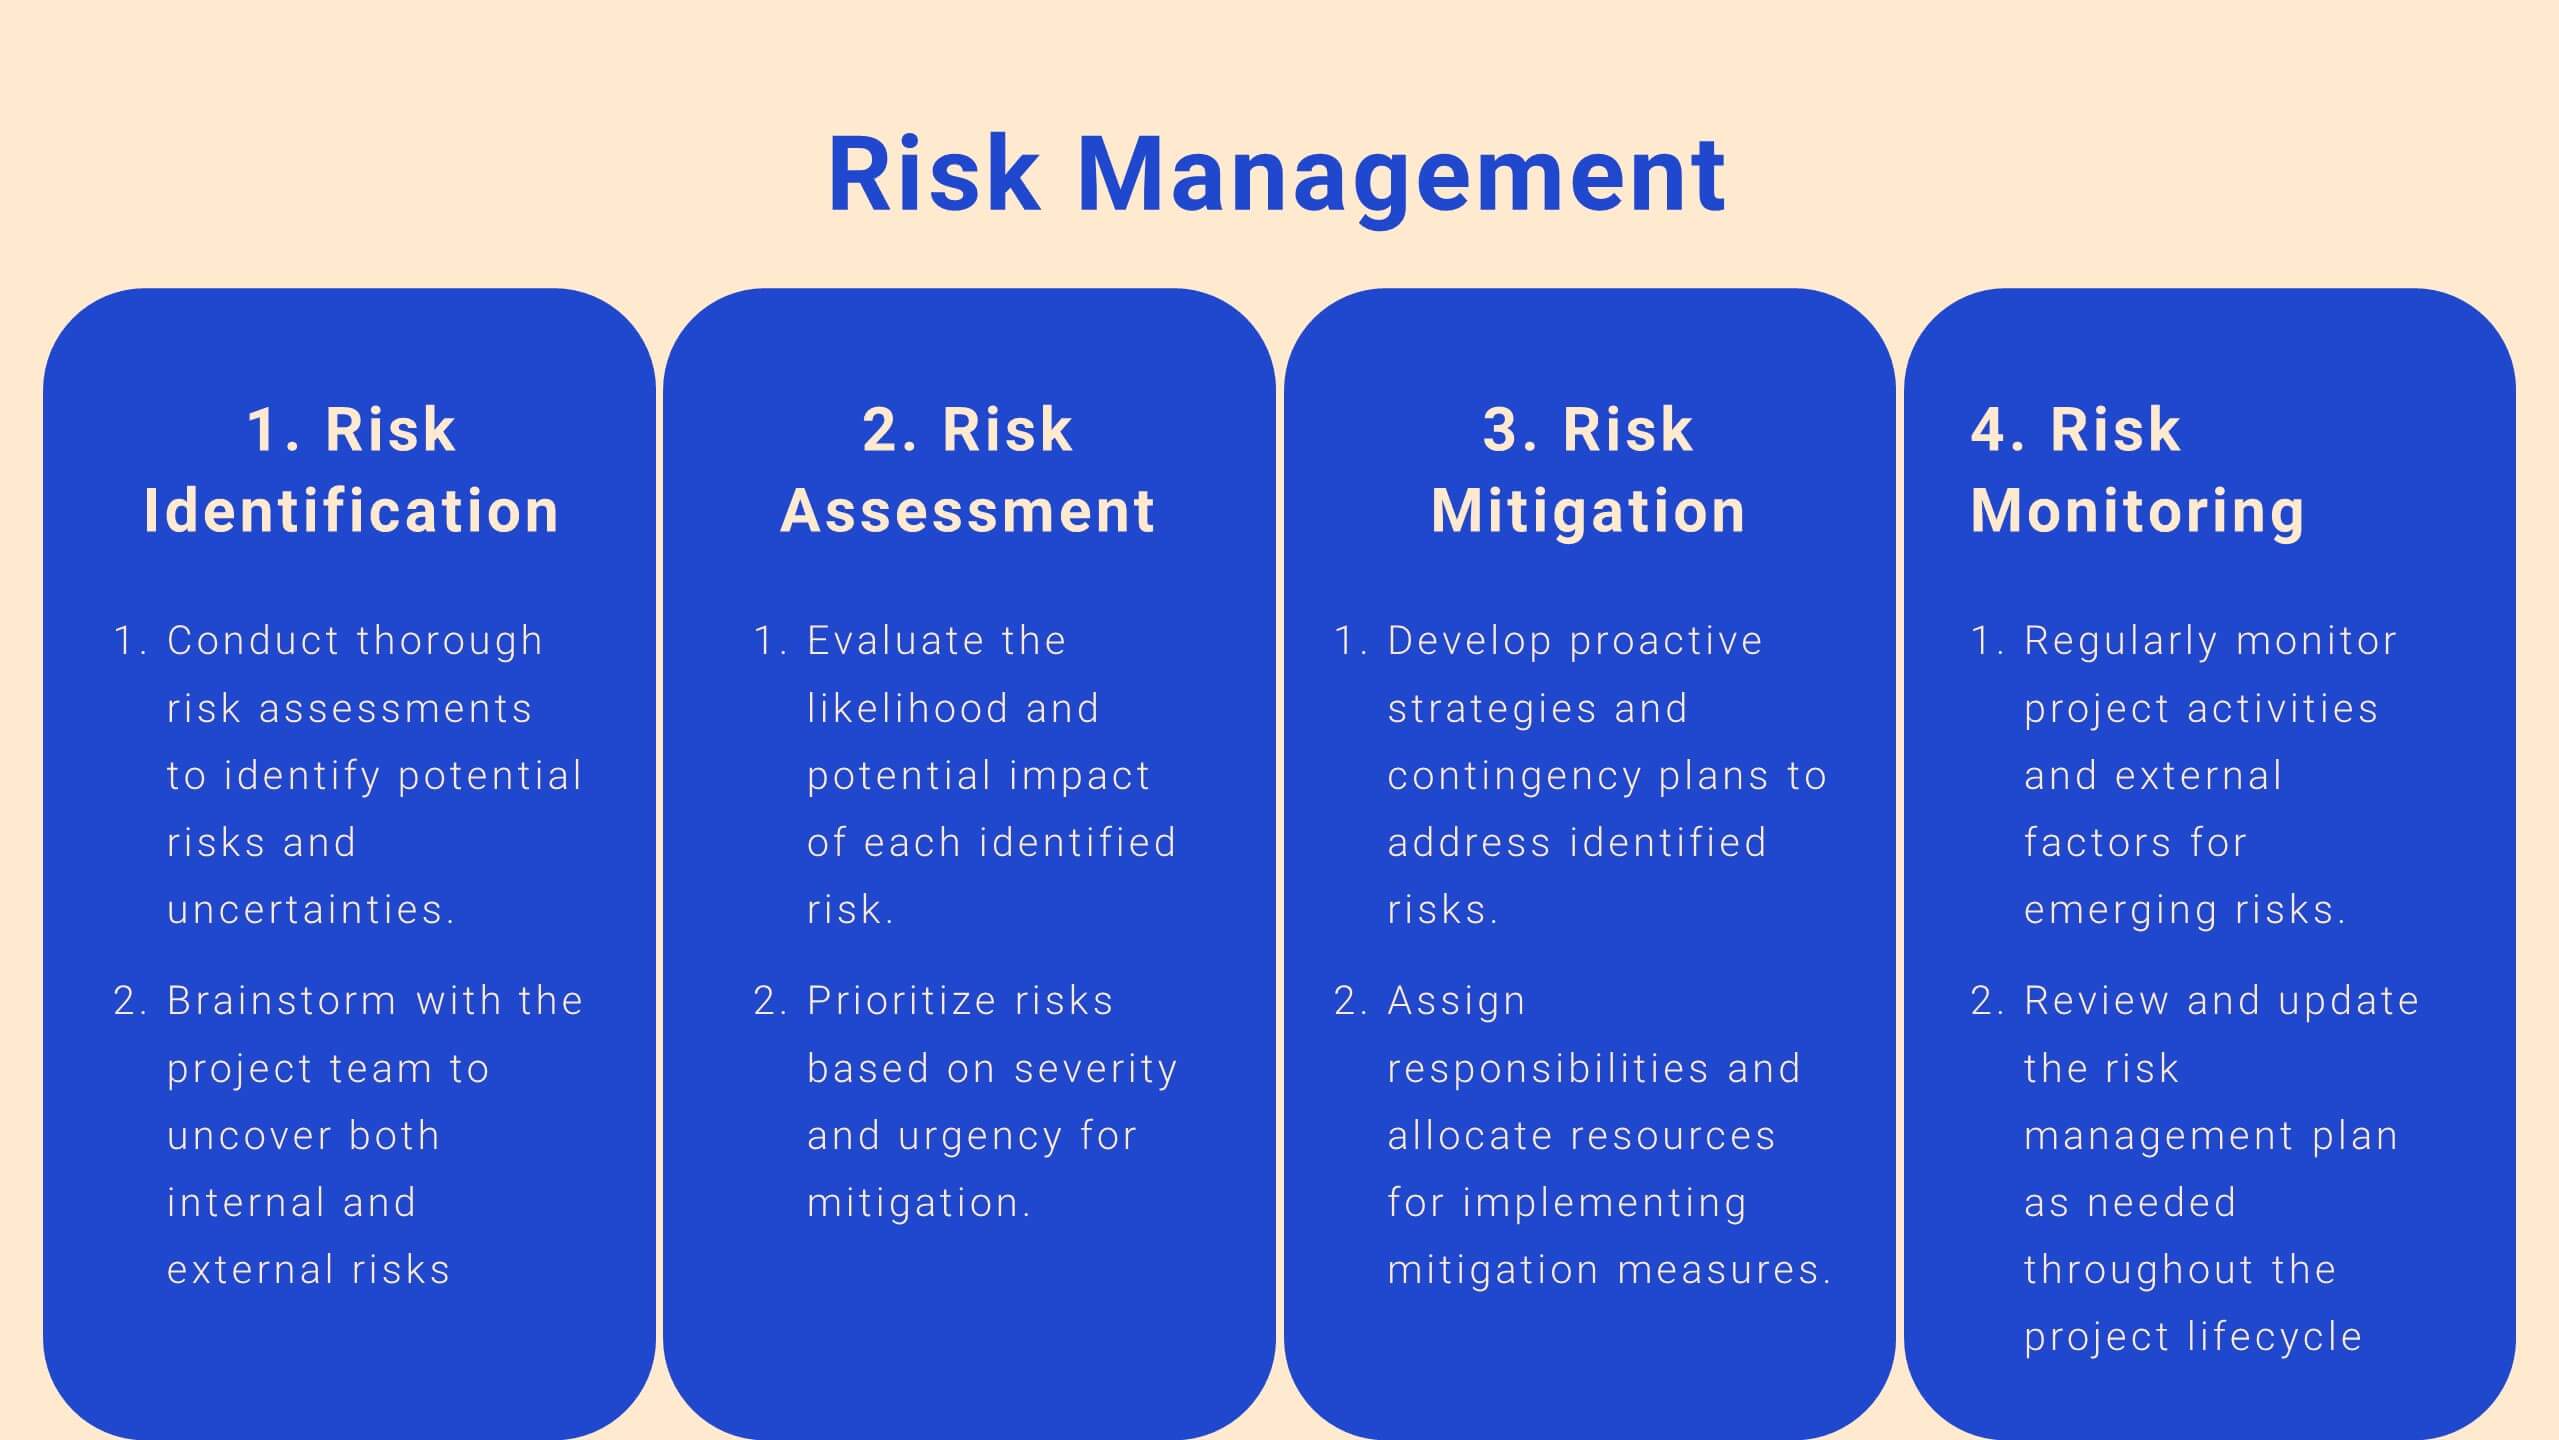
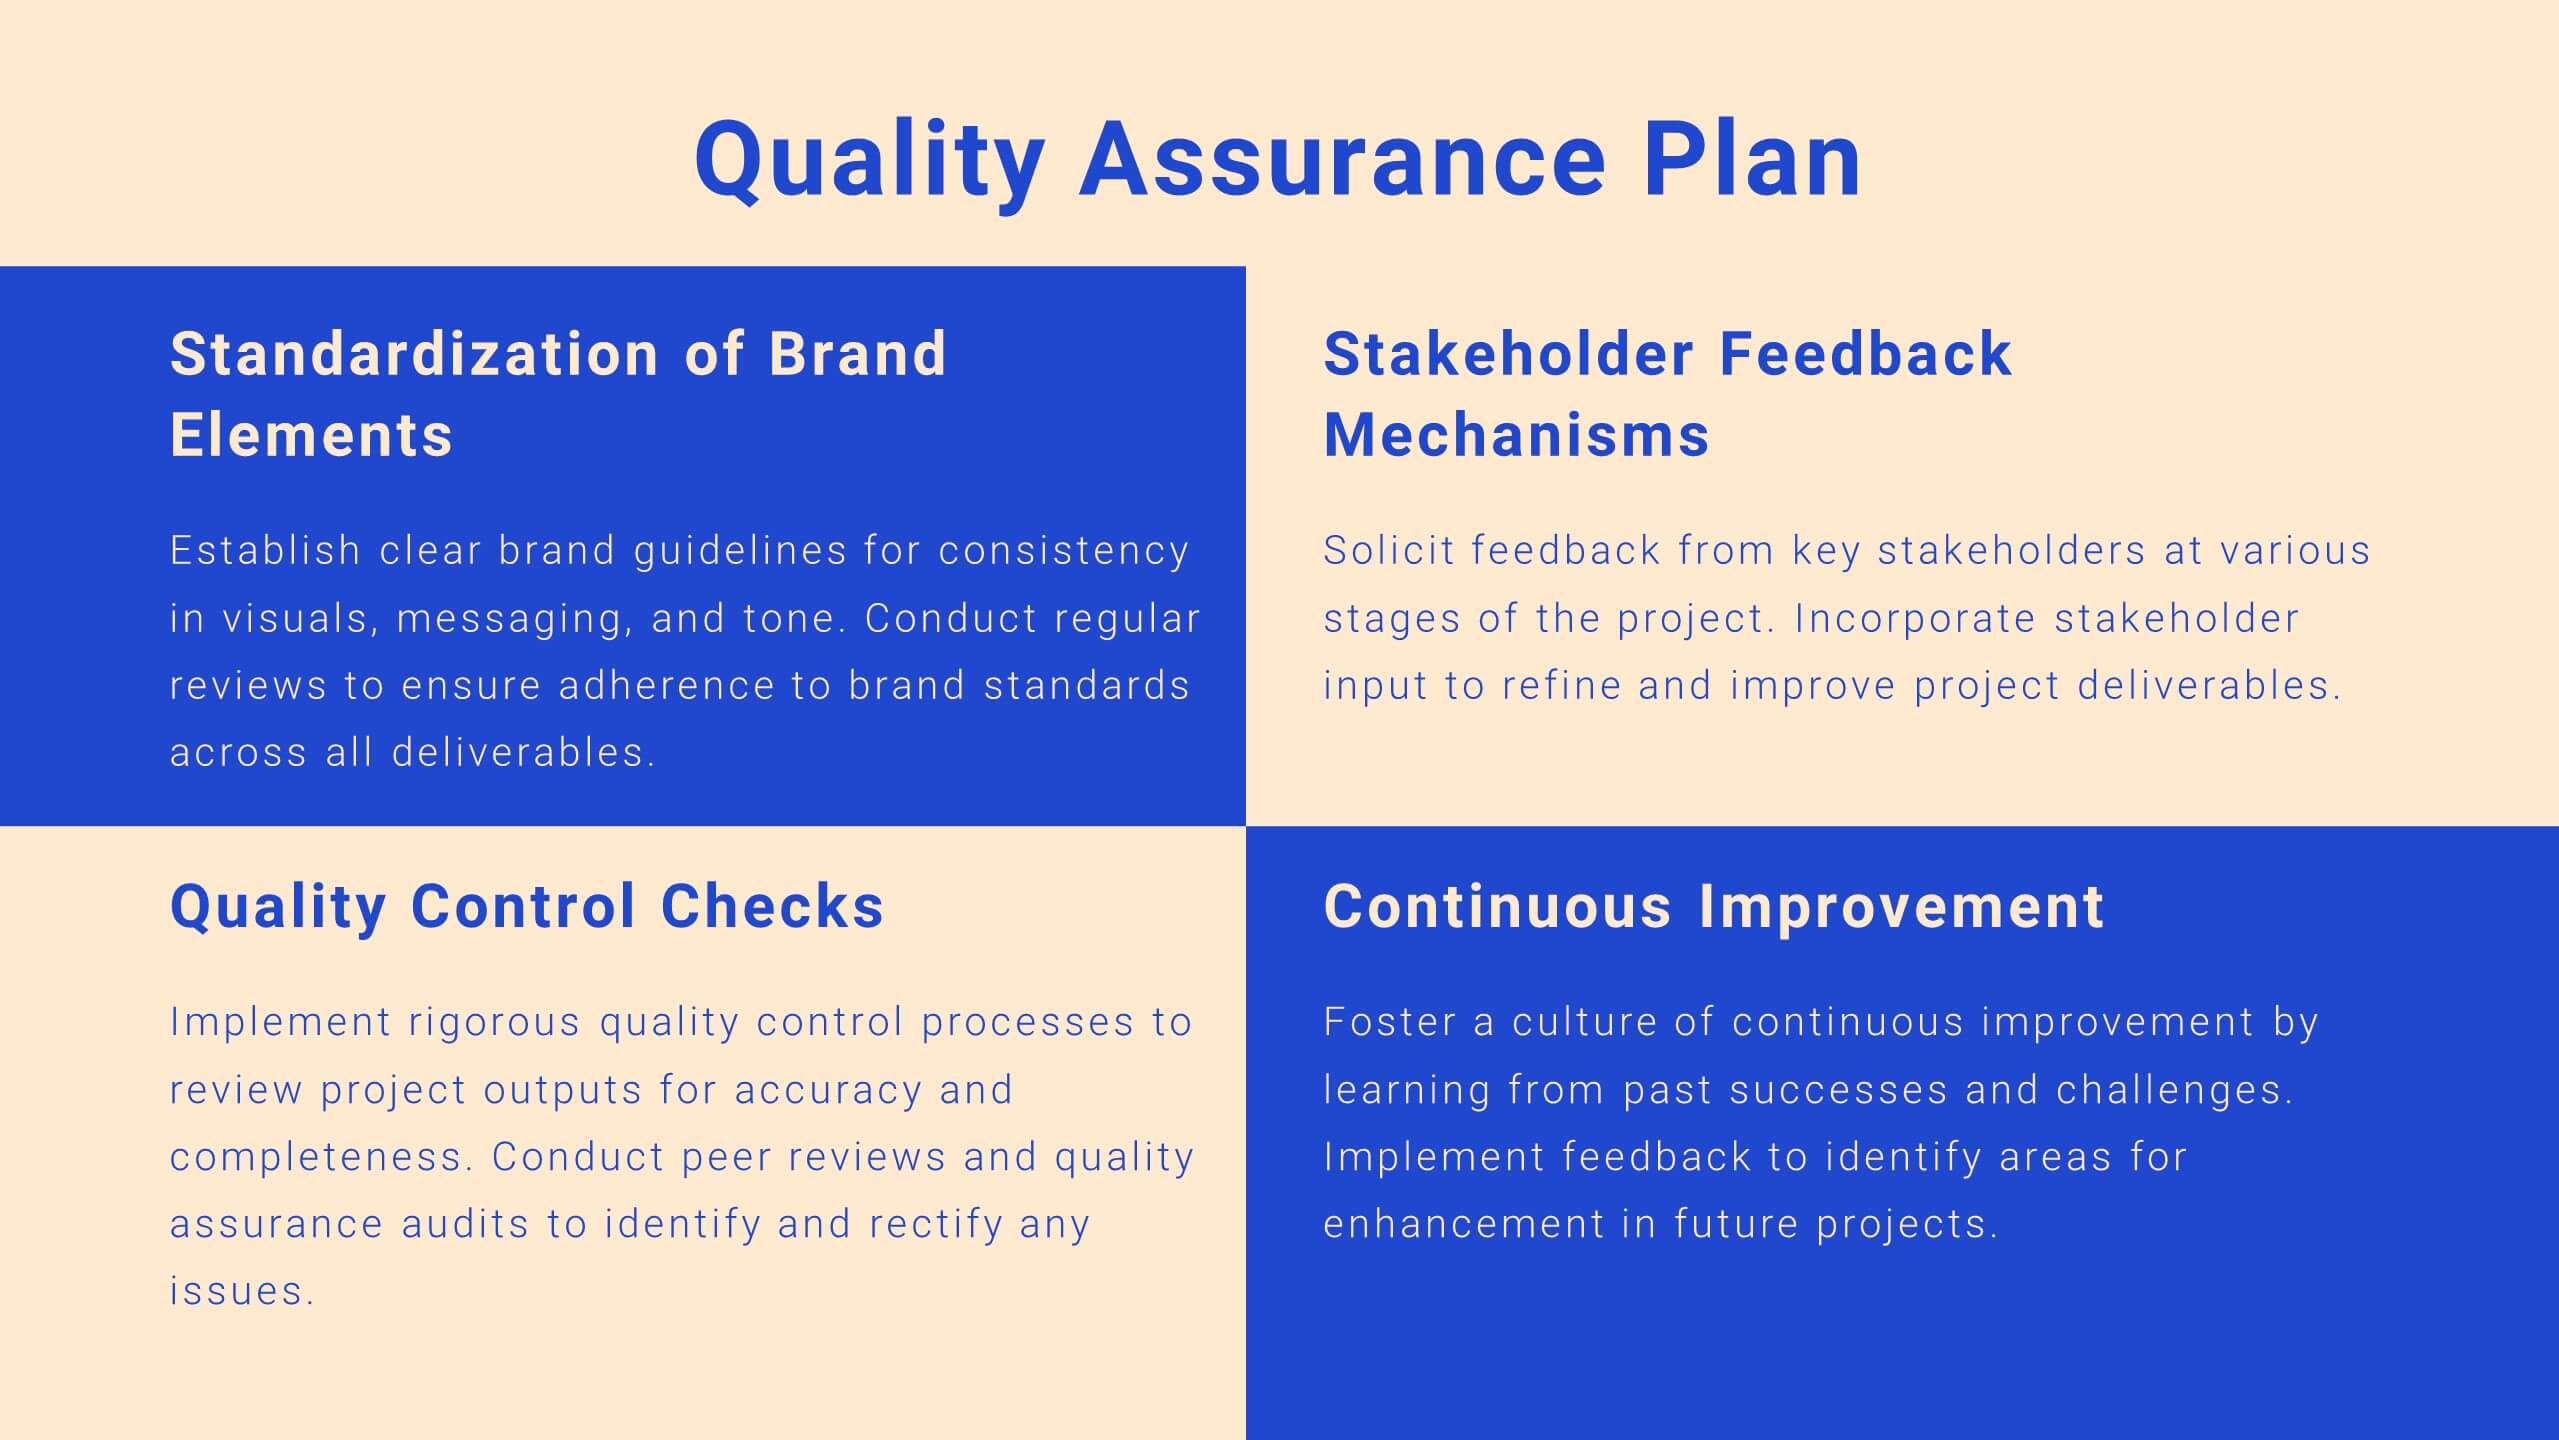
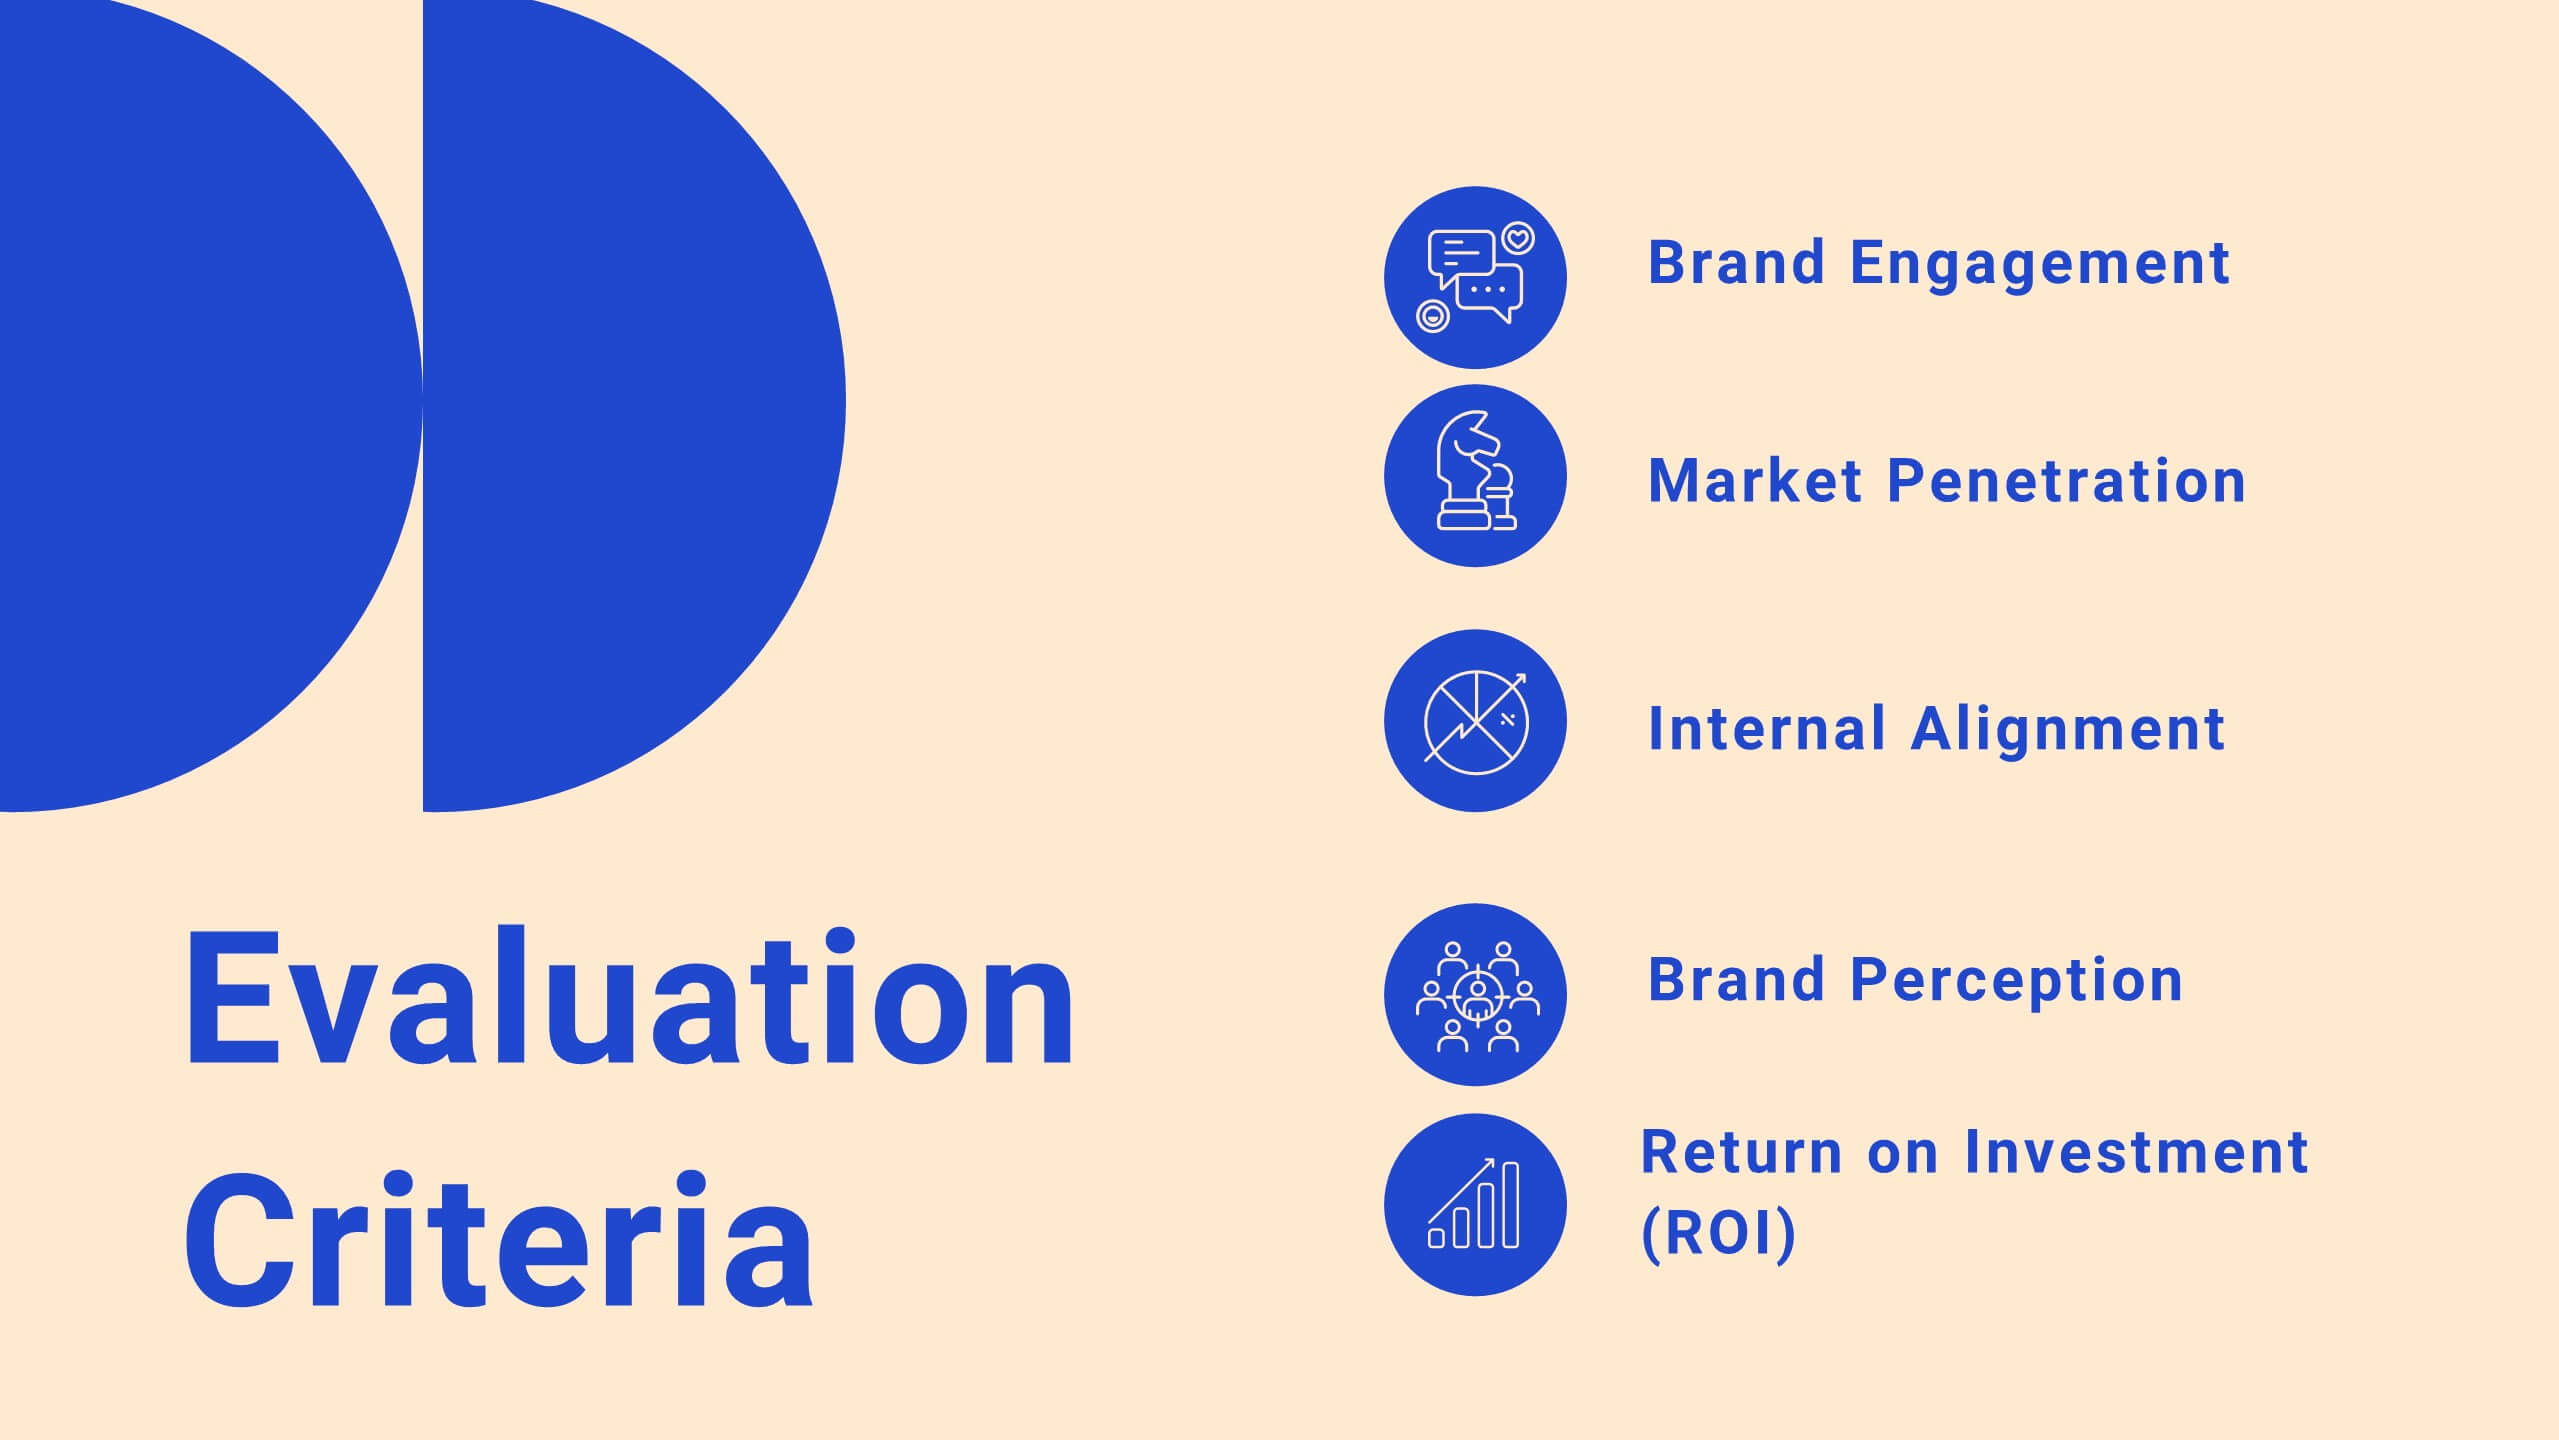
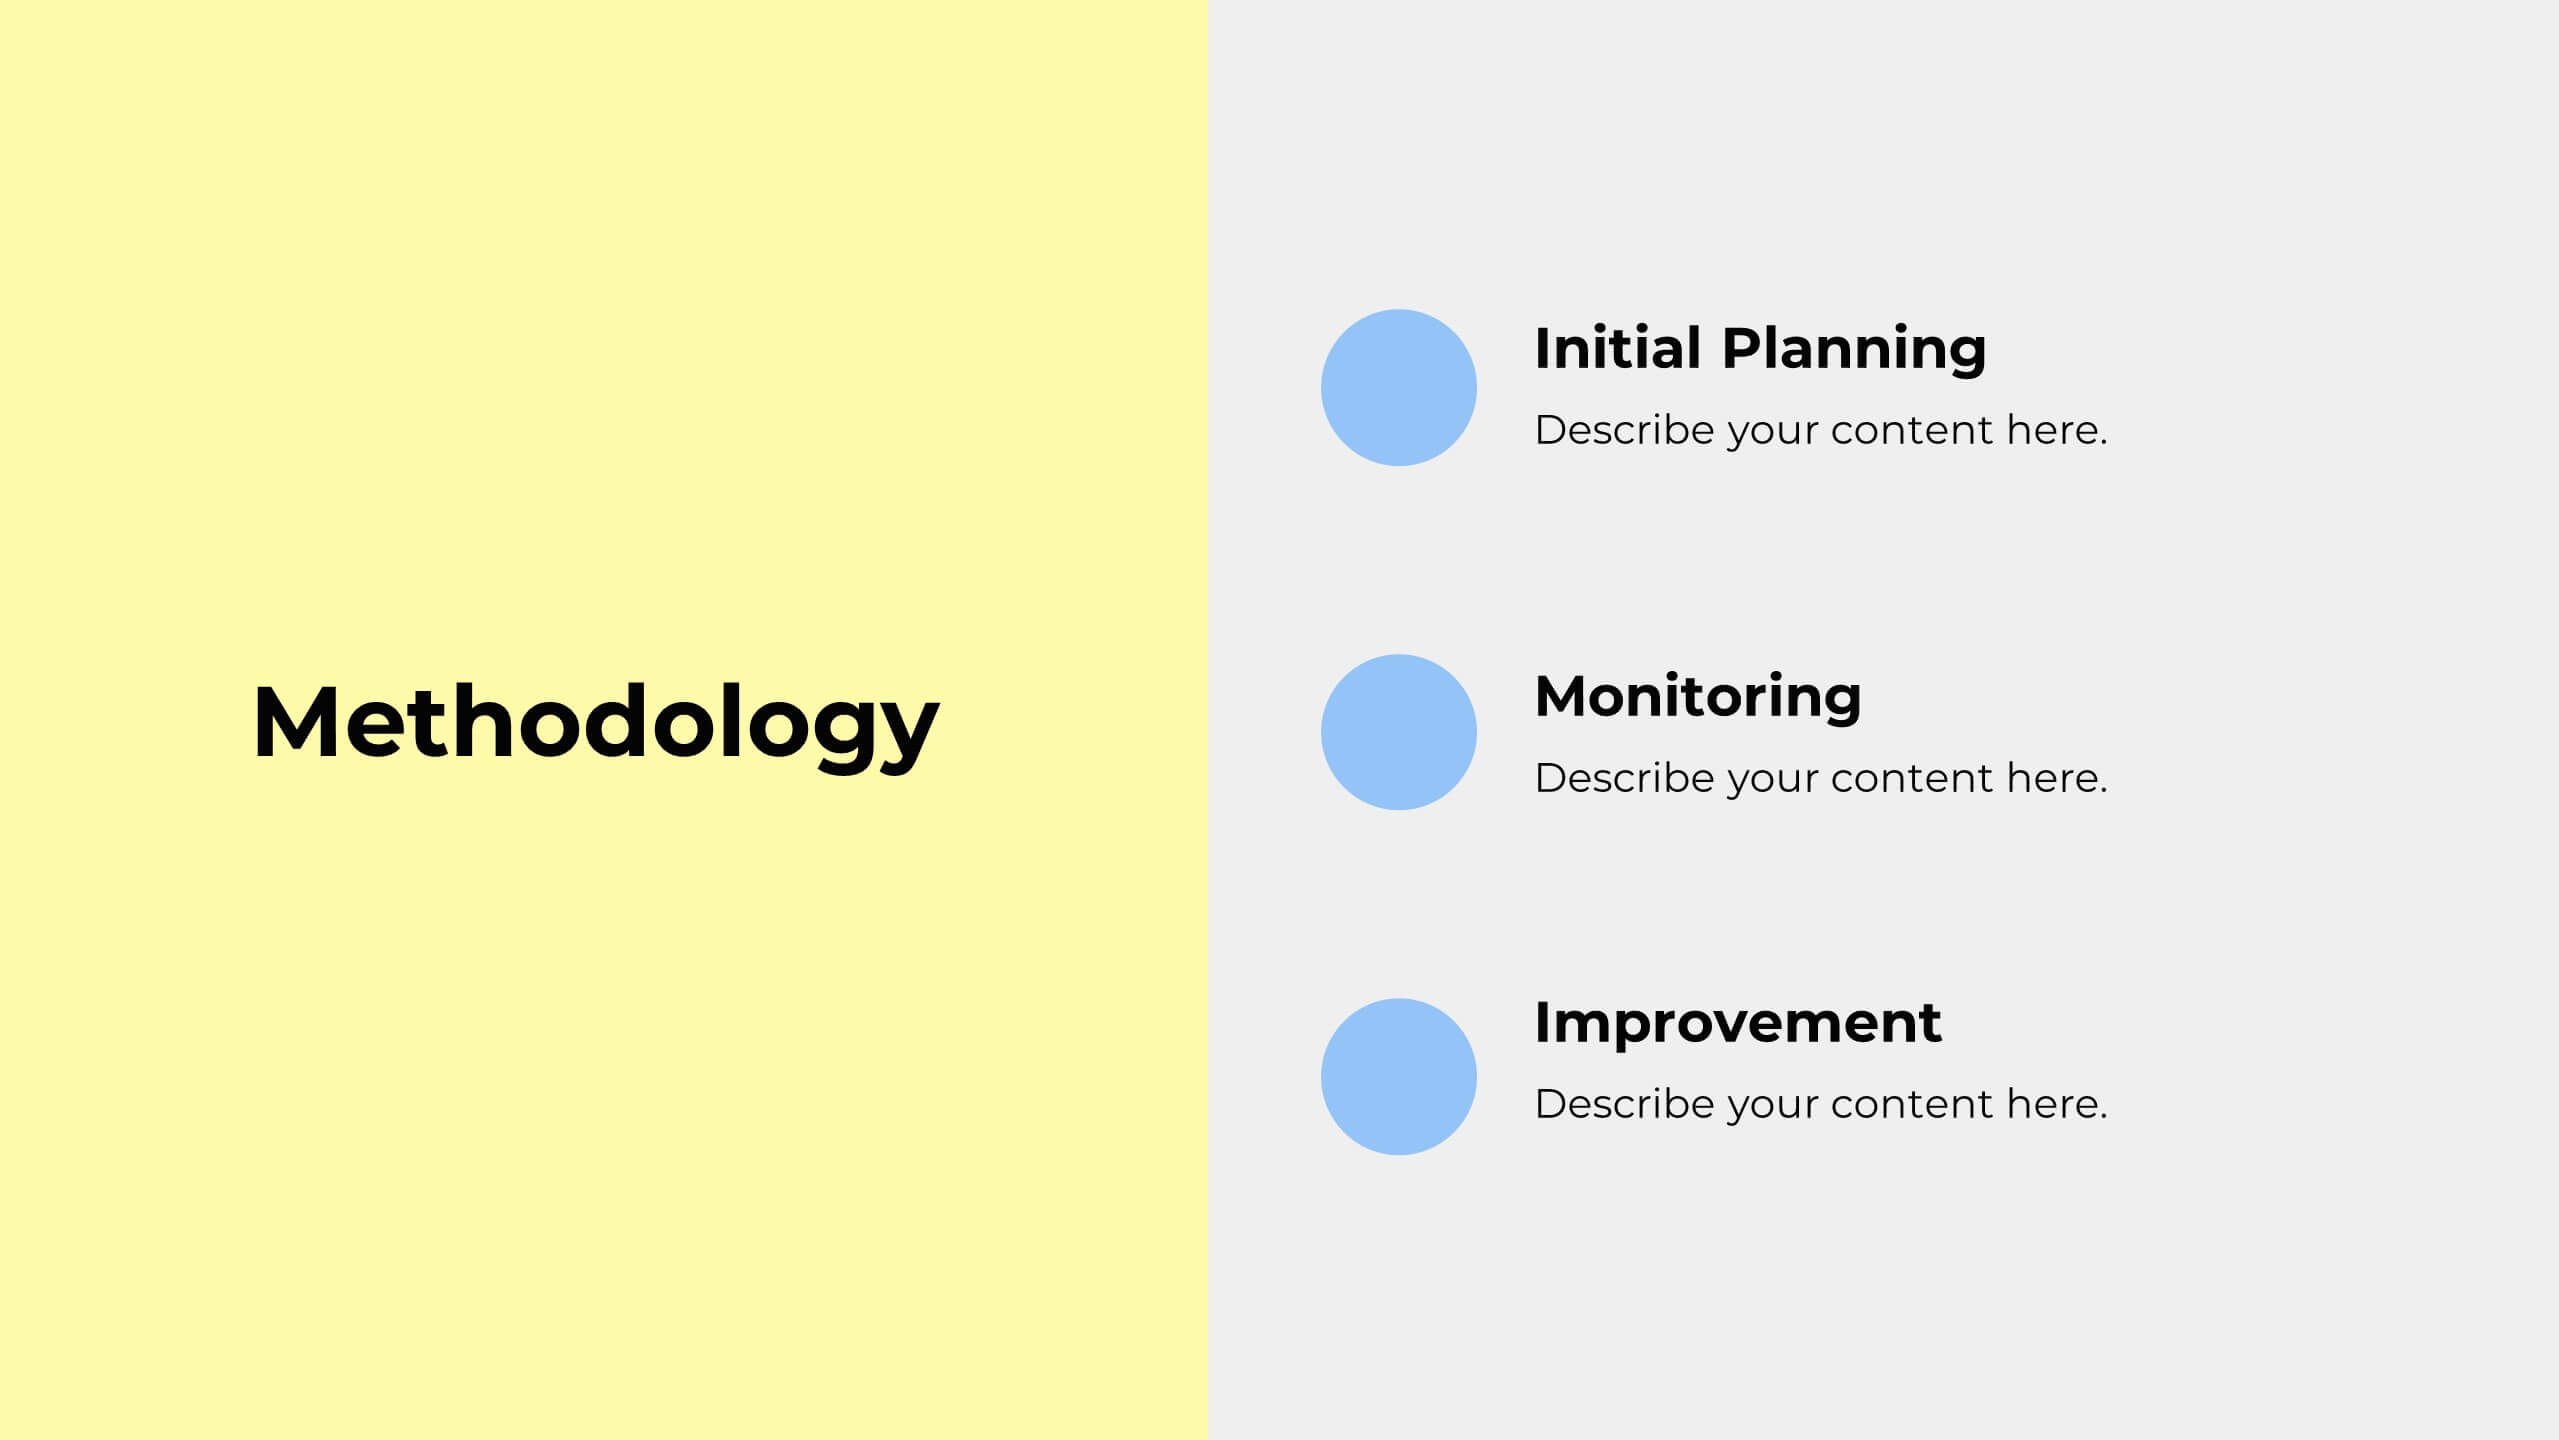
Drift Agile Project Plan Presentation
Take control of your projects with this comprehensive project plan template! From introductions to detailed objectives, this template covers scope of work, methodology, timelines, budget breakdowns, and risk management. Ideal for ensuring your project stays on track, it also includes stakeholder analysis and quality assurance plans. Compatible with PowerPoint, Keynote, and Google Slides.


6 slides
OKR Goal-Setting Framework
Clarify your goals and drive performance with this OKR-based layout that maps Objectives, Key Activities, and Results in a clear, actionable format. Ideal for teams, managers, and performance reviews. Each section is fully editable to match your organizational strategy. Compatible with PowerPoint, Keynote, and Google Slides.


4 slides
Strategic Business Plan Presentation
Bring your long-term vision to life with a clean, modern presentation that turns complex planning into an easy-to-follow growth path. This layout helps you explain goals, strategies, and key steps with clarity and confidence. Fully editable and compatible with PowerPoint, Keynote, and Google Slides.


5 slides
Customer Retention and Loyalty Marketing Presentation
Showcase your loyalty strategies in a visually compelling way with this modern shopping cart-themed slide. Ideal for outlining customer retention initiatives, this template highlights five key tactics or rewards using numbered icons and clean layout sections. Great for marketers, retail teams, and business consultants. Fully editable in PowerPoint, Keynote, and Google Slides.


8 slides
Business Revenue and Profit Analysis Presentation
Analyze and visualize Business Revenue and Profit trends effectively with this modern and data-driven slide template. Featuring a dual-chart layout with reseller performance trends and purchase breakdowns, this slide is ideal for financial reports, sales presentations, and strategic business meetings. Fully customizable, you can edit the text, colors, and data to fit your specific needs. Compatible with PowerPoint, Keynote, and Google Slides for easy editing and seamless integration.


6 slides
Big Data Technology Infographic
Big Data technology refers to the tools, techniques, and frameworks used to capture, store, process, analyze, and visualize large and complex datasets that are beyond the capabilities of traditional data processing systems. This infographic template is perfect for organizations that deal with massive volumes of data from various sources, including social media, sensors, machines, and more. This template enables businesses to gain valuable insights, make informed decisions, and create new opportunities. This infographic can be used for various industries, including e-commerce, healthcare, finance, manufacturing, and more.


4 slides
Stakeholder Analysis and Engagement Presentation
Enhance your strategic planning with our Stakeholder Analysis and Engagement Presentation template. Designed to map influence and interest effectively, this tool aids in identifying key stakeholders and tailoring engagement strategies. It’s compatible with PowerPoint, Keynote, and Google Slides, perfect for impactful presentations and workshops.


8 slides
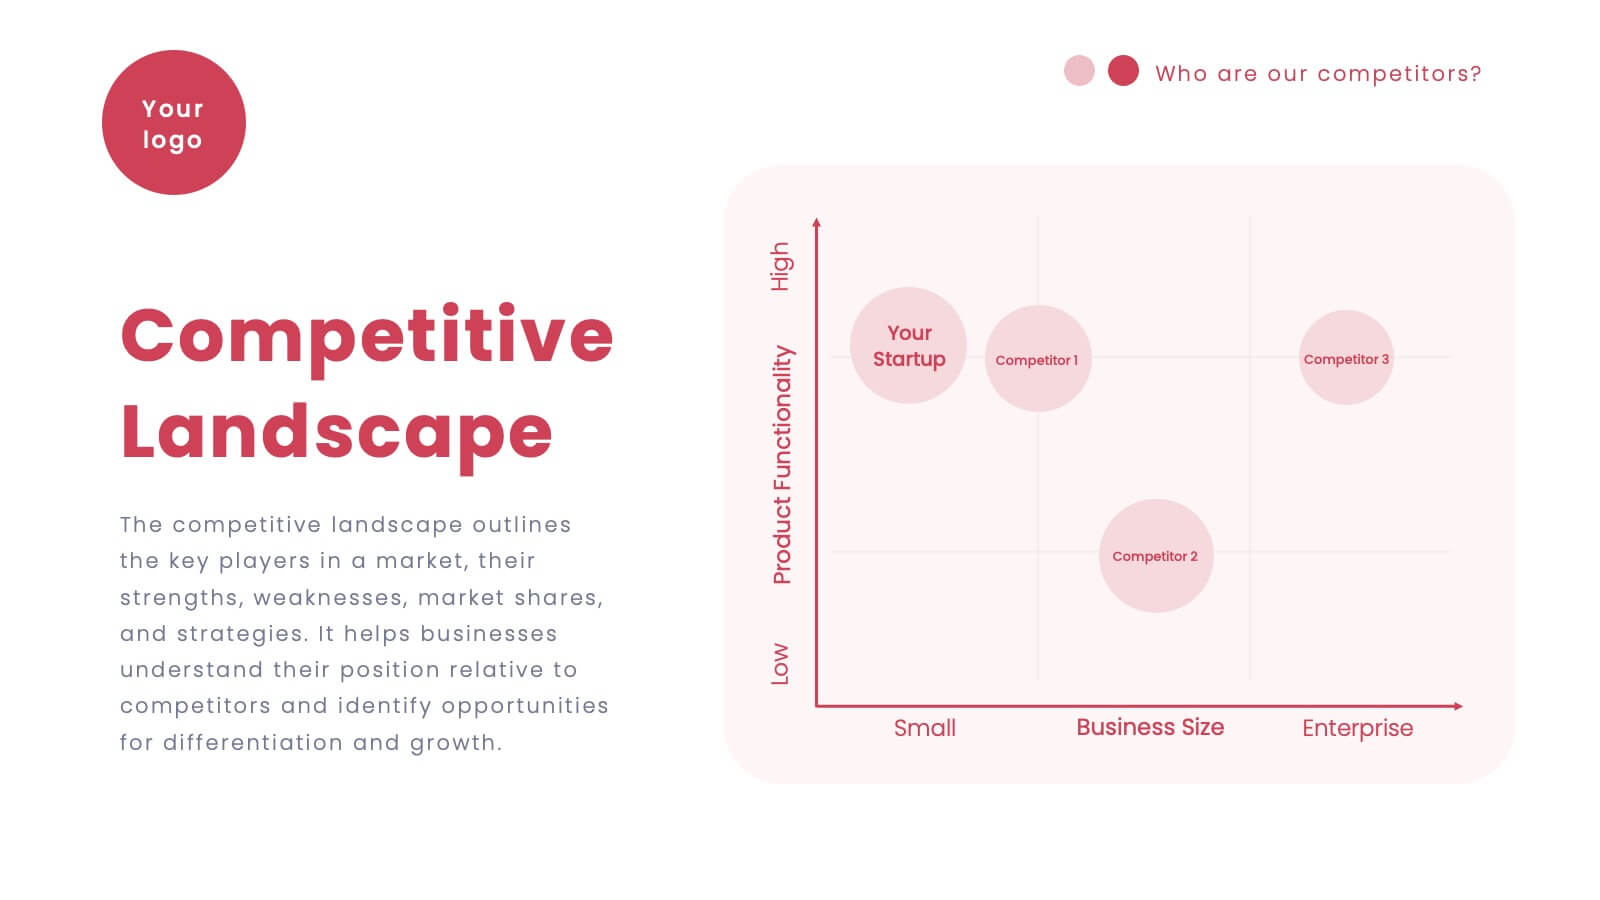
Data-Driven Market Segmentation
Visualize customer insights with clarity using the Data-Driven Market Segmentation Presentation. This dynamic circular infographic displays four key segments, each with percentage labels and curved connectors pointing to detailed descriptions. Ideal for marketing analysts, product strategists, or data-driven teams aiming to present behavioral, demographic, or purchasing trends. The sleek, radial layout makes comparisons intuitive and engaging. Fully editable in PowerPoint, Keynote, and Google Slides—customize colors, icons, and data points to match your brand and message.


20 slides
Firelight Design Portfolio Presentation
This Design Portfolio Presentation Template offers a bold and modern layout to showcase your creative projects, services, and achievements. It features sections for project highlights, awards, client testimonials, and pricing, making it perfect for freelancers and agencies. Fully customizable in PowerPoint, Keynote, and Google Slides.


21 slides
Mercurion Project Status Report Presentation
Stay on top of your project's progress with this structured and visually engaging presentation template. Covering key highlights, performance metrics, financial summaries, team productivity, and future priorities, this template helps you communicate project updates effectively. Whether for stakeholders, management, or team meetings, it provides clear insights and actionable recommendations. Fully customizable and compatible with PowerPoint, Keynote, and Google Slides.

20 slides
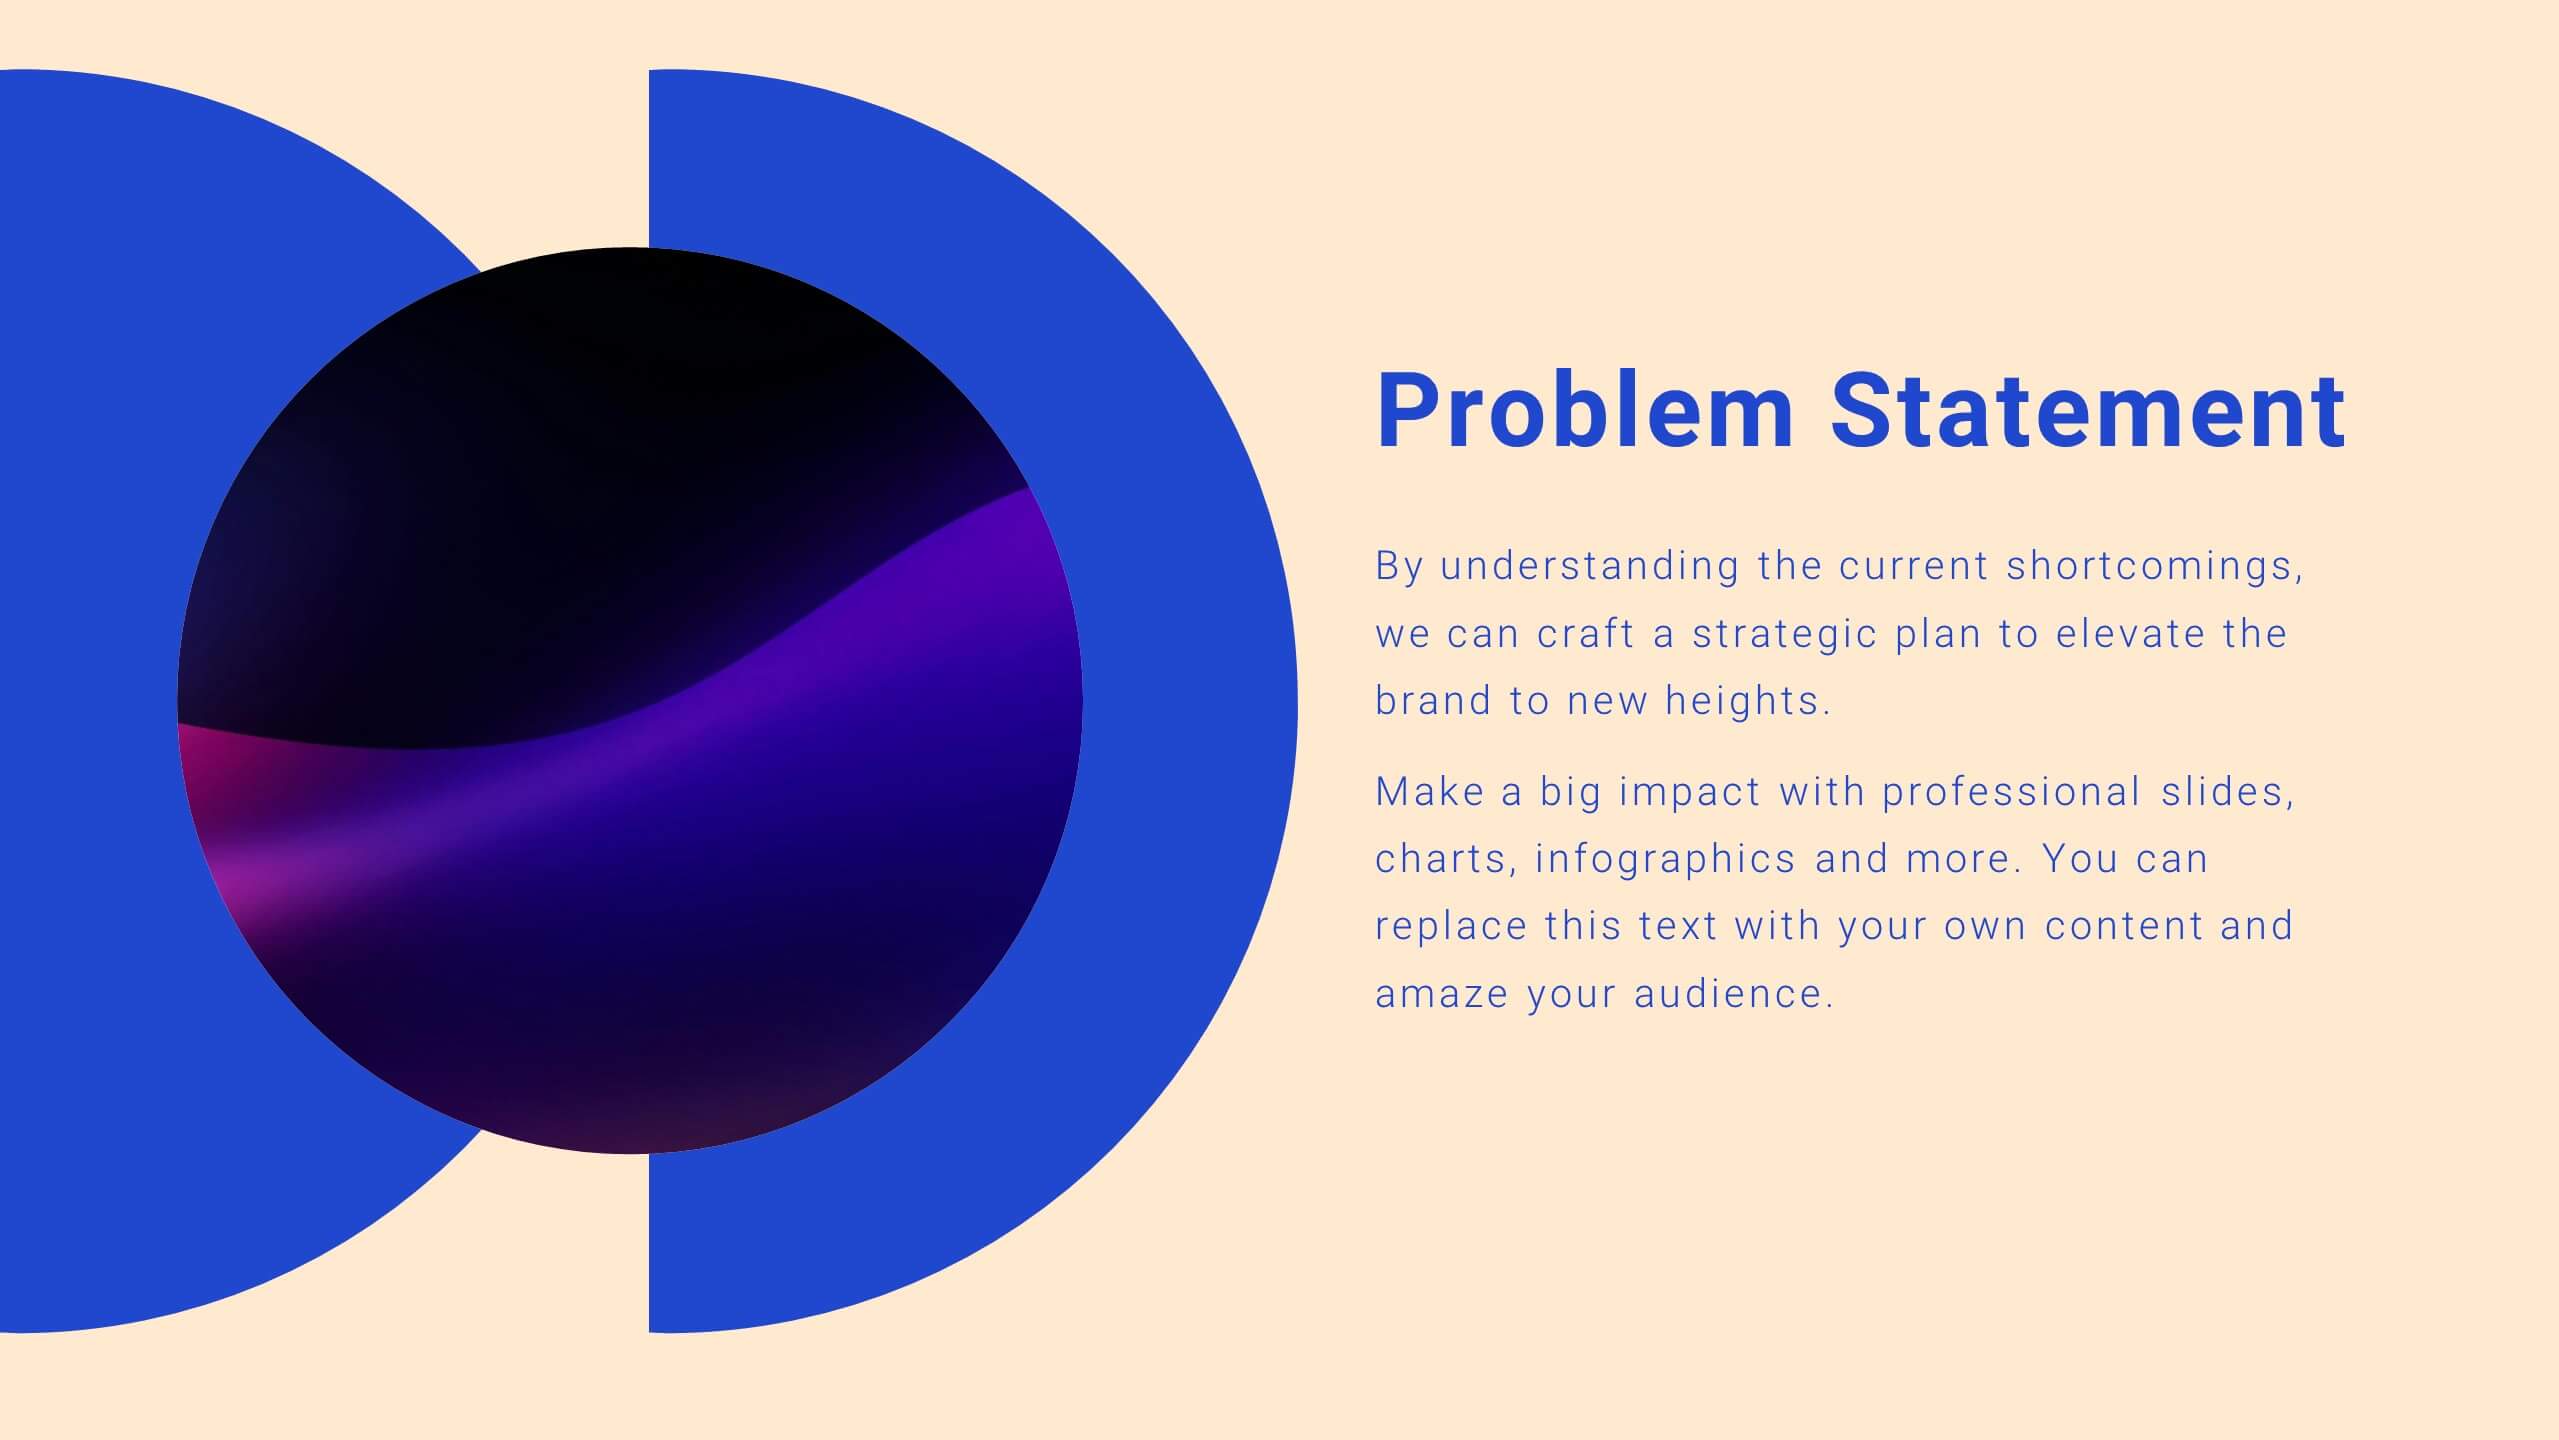
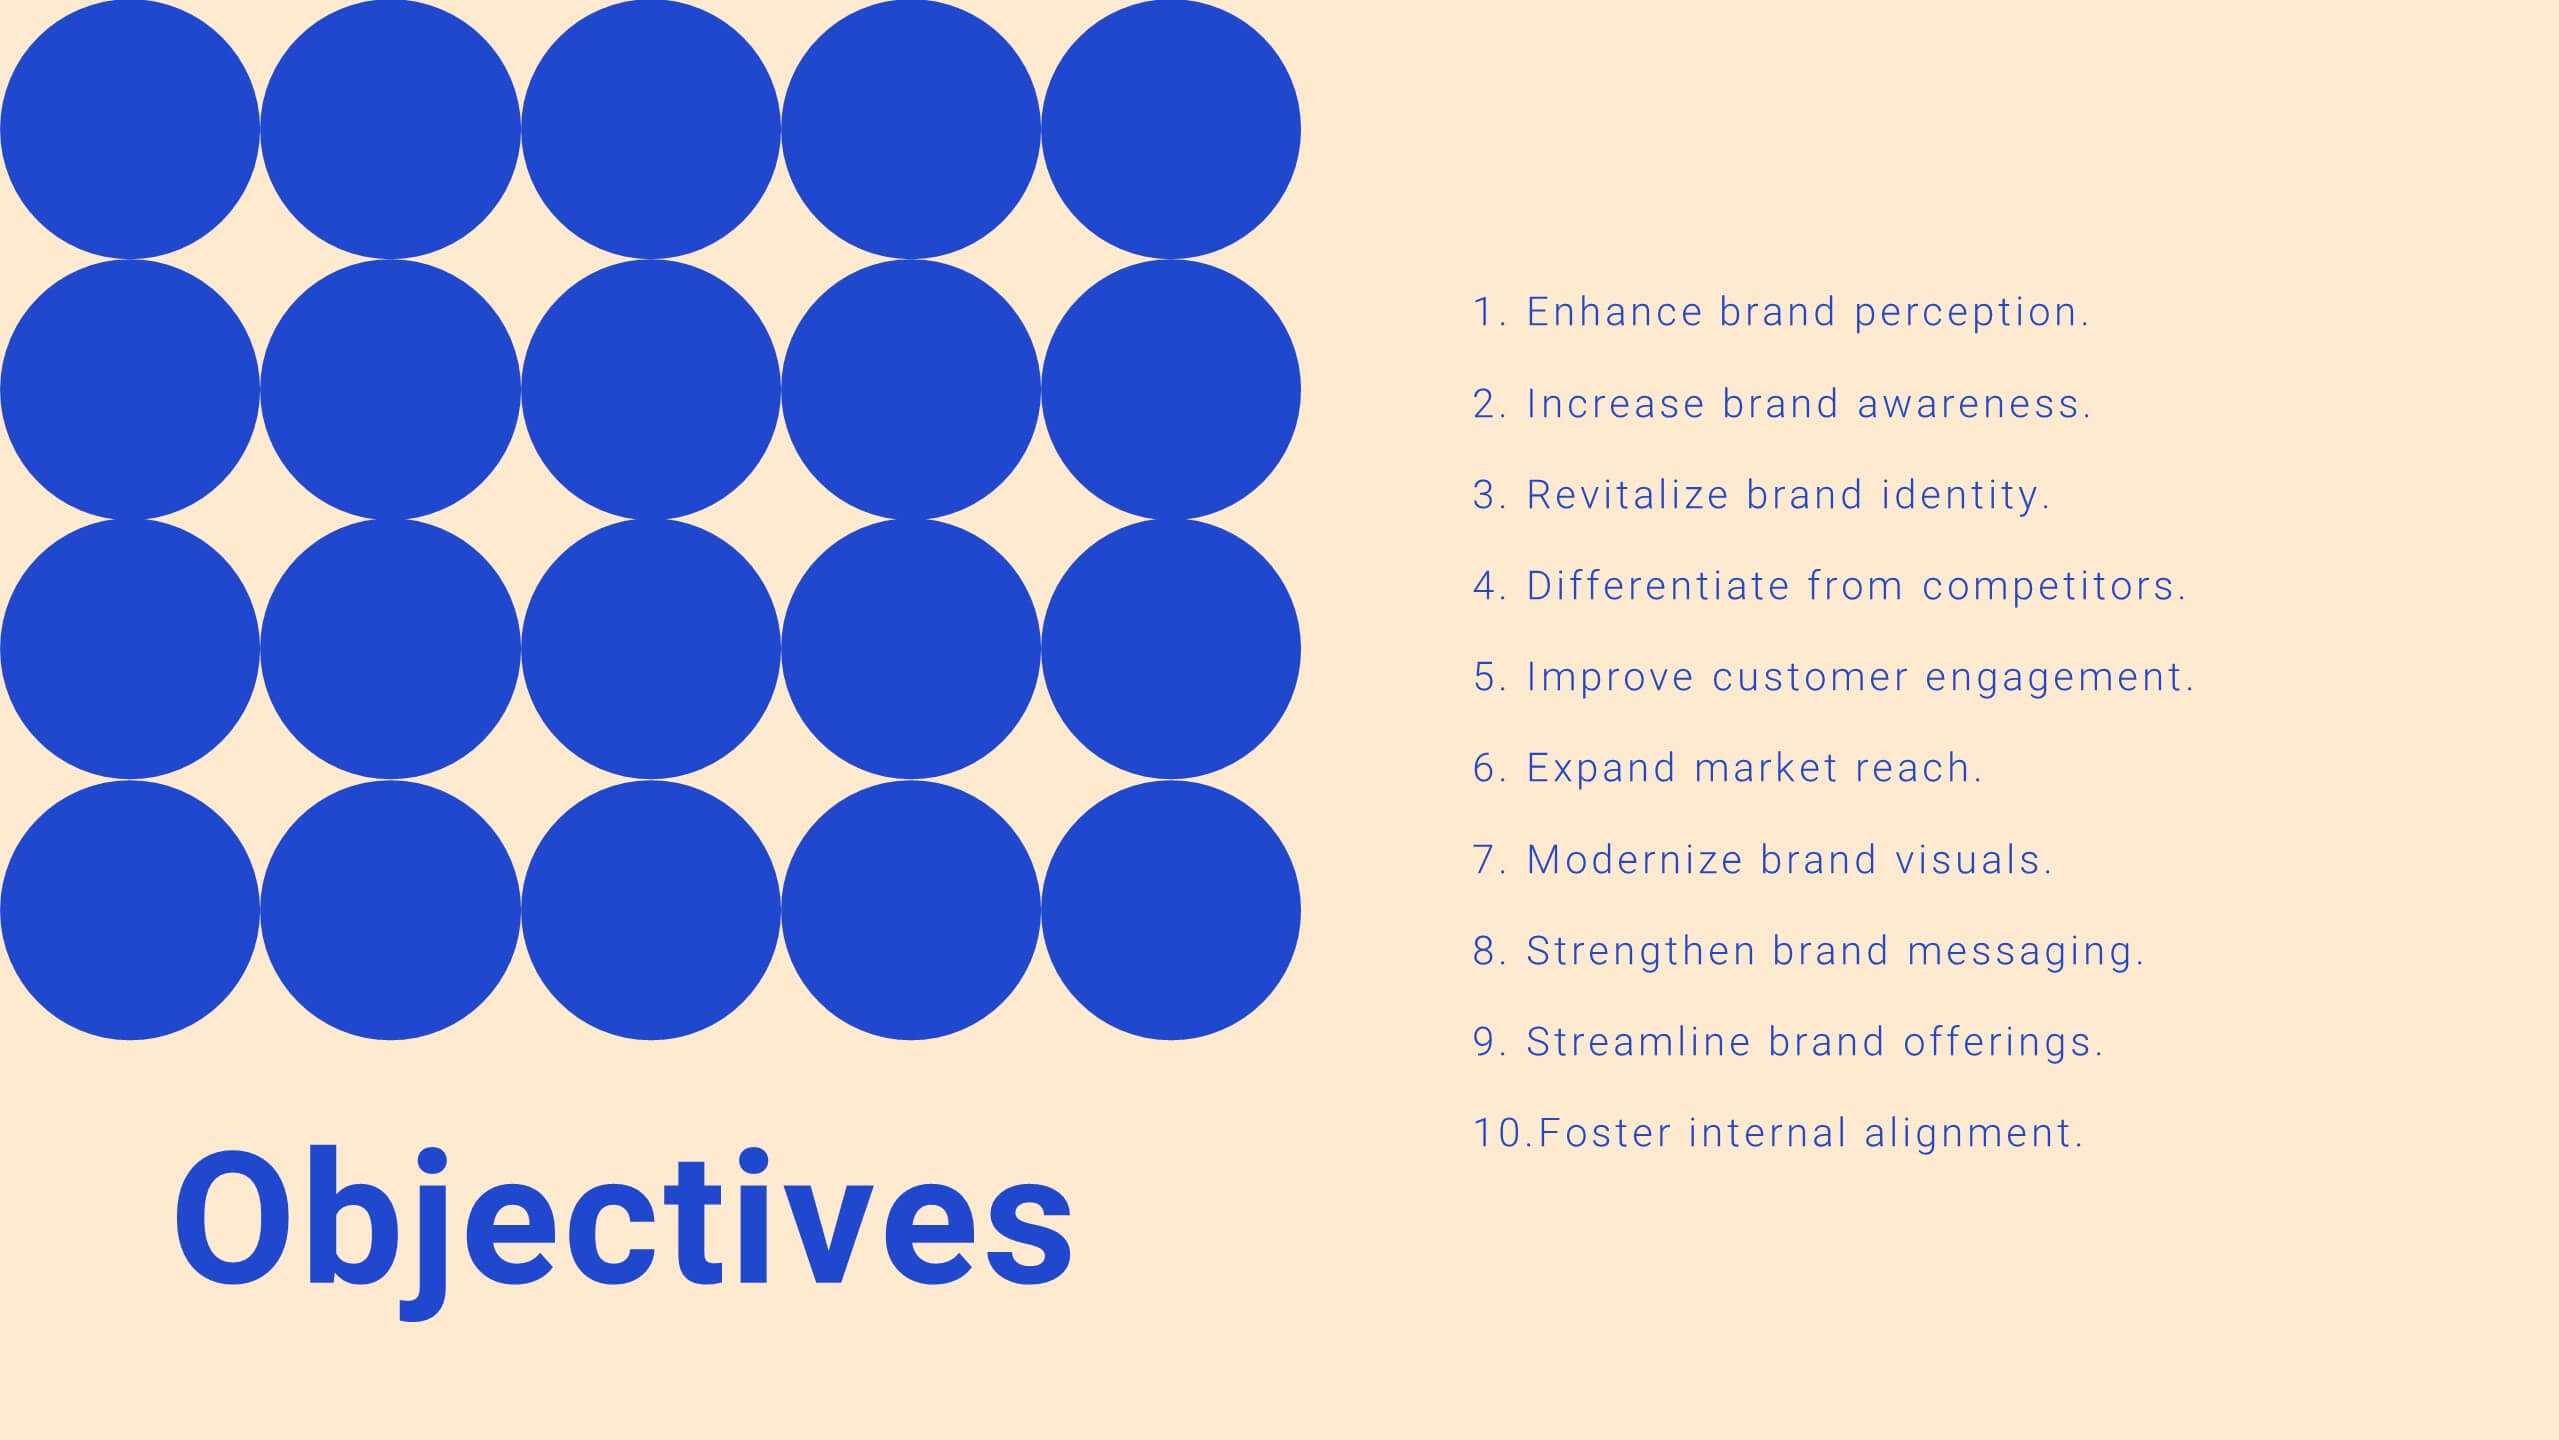
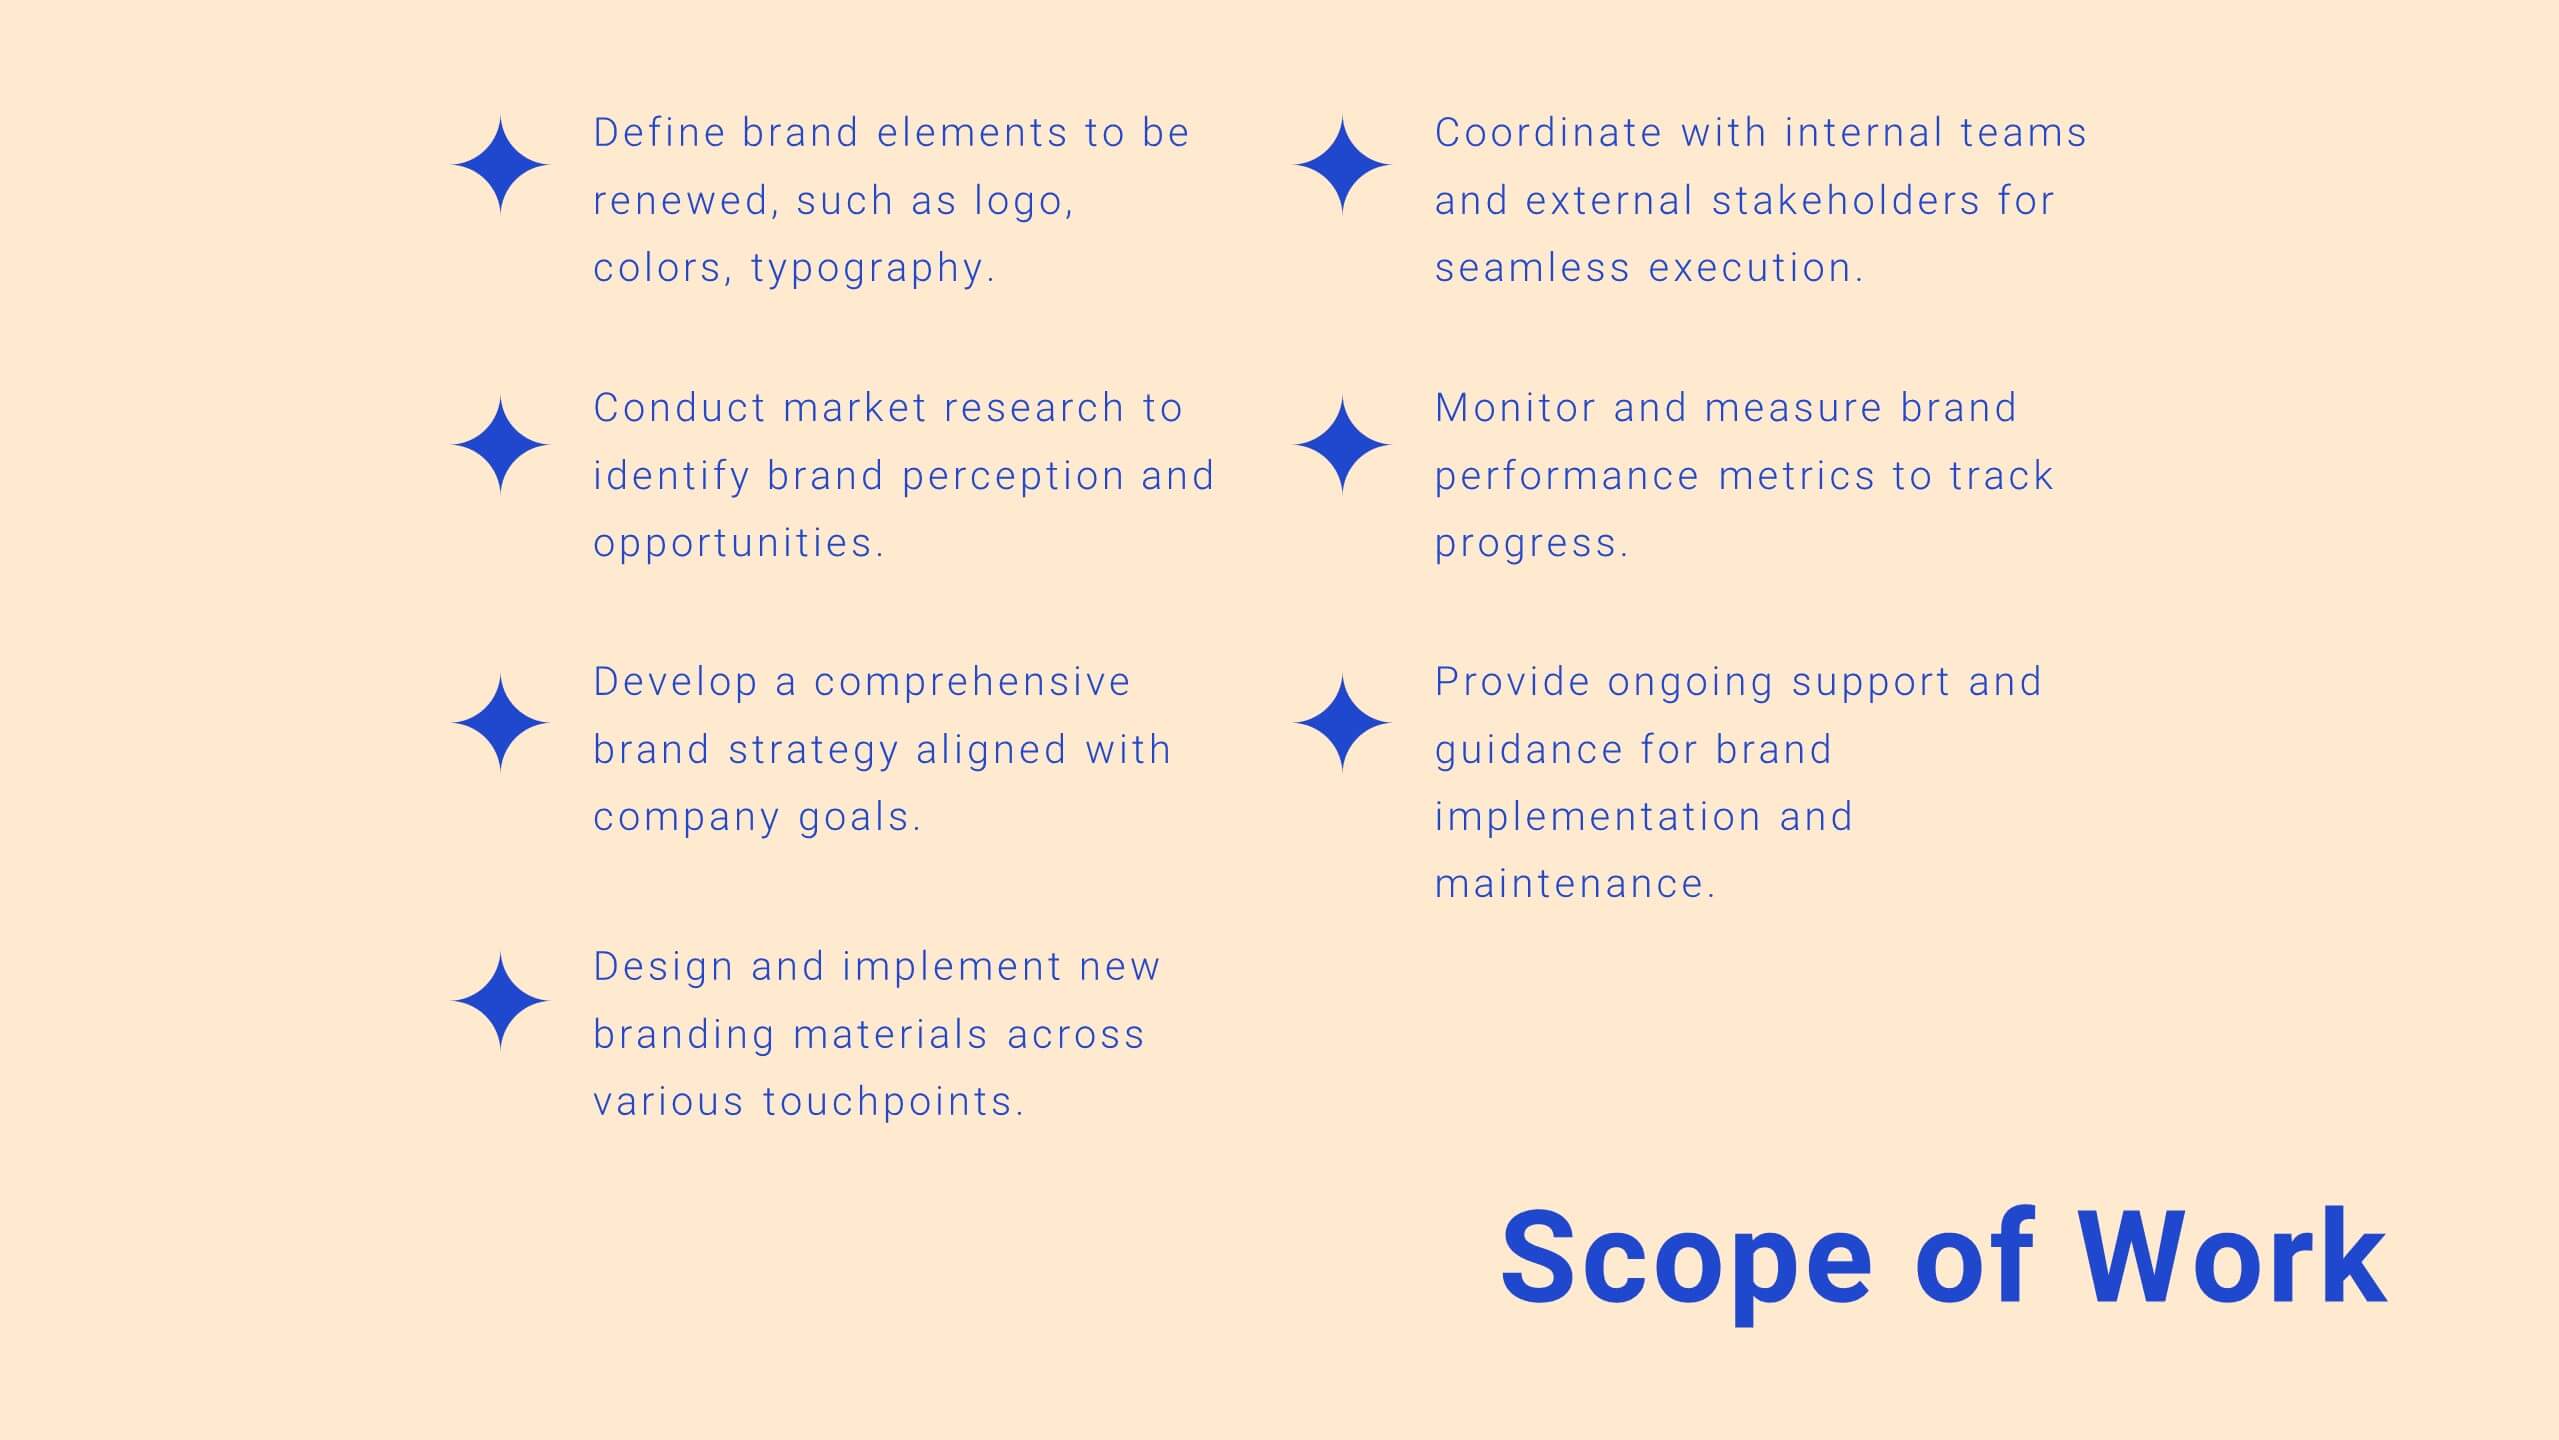
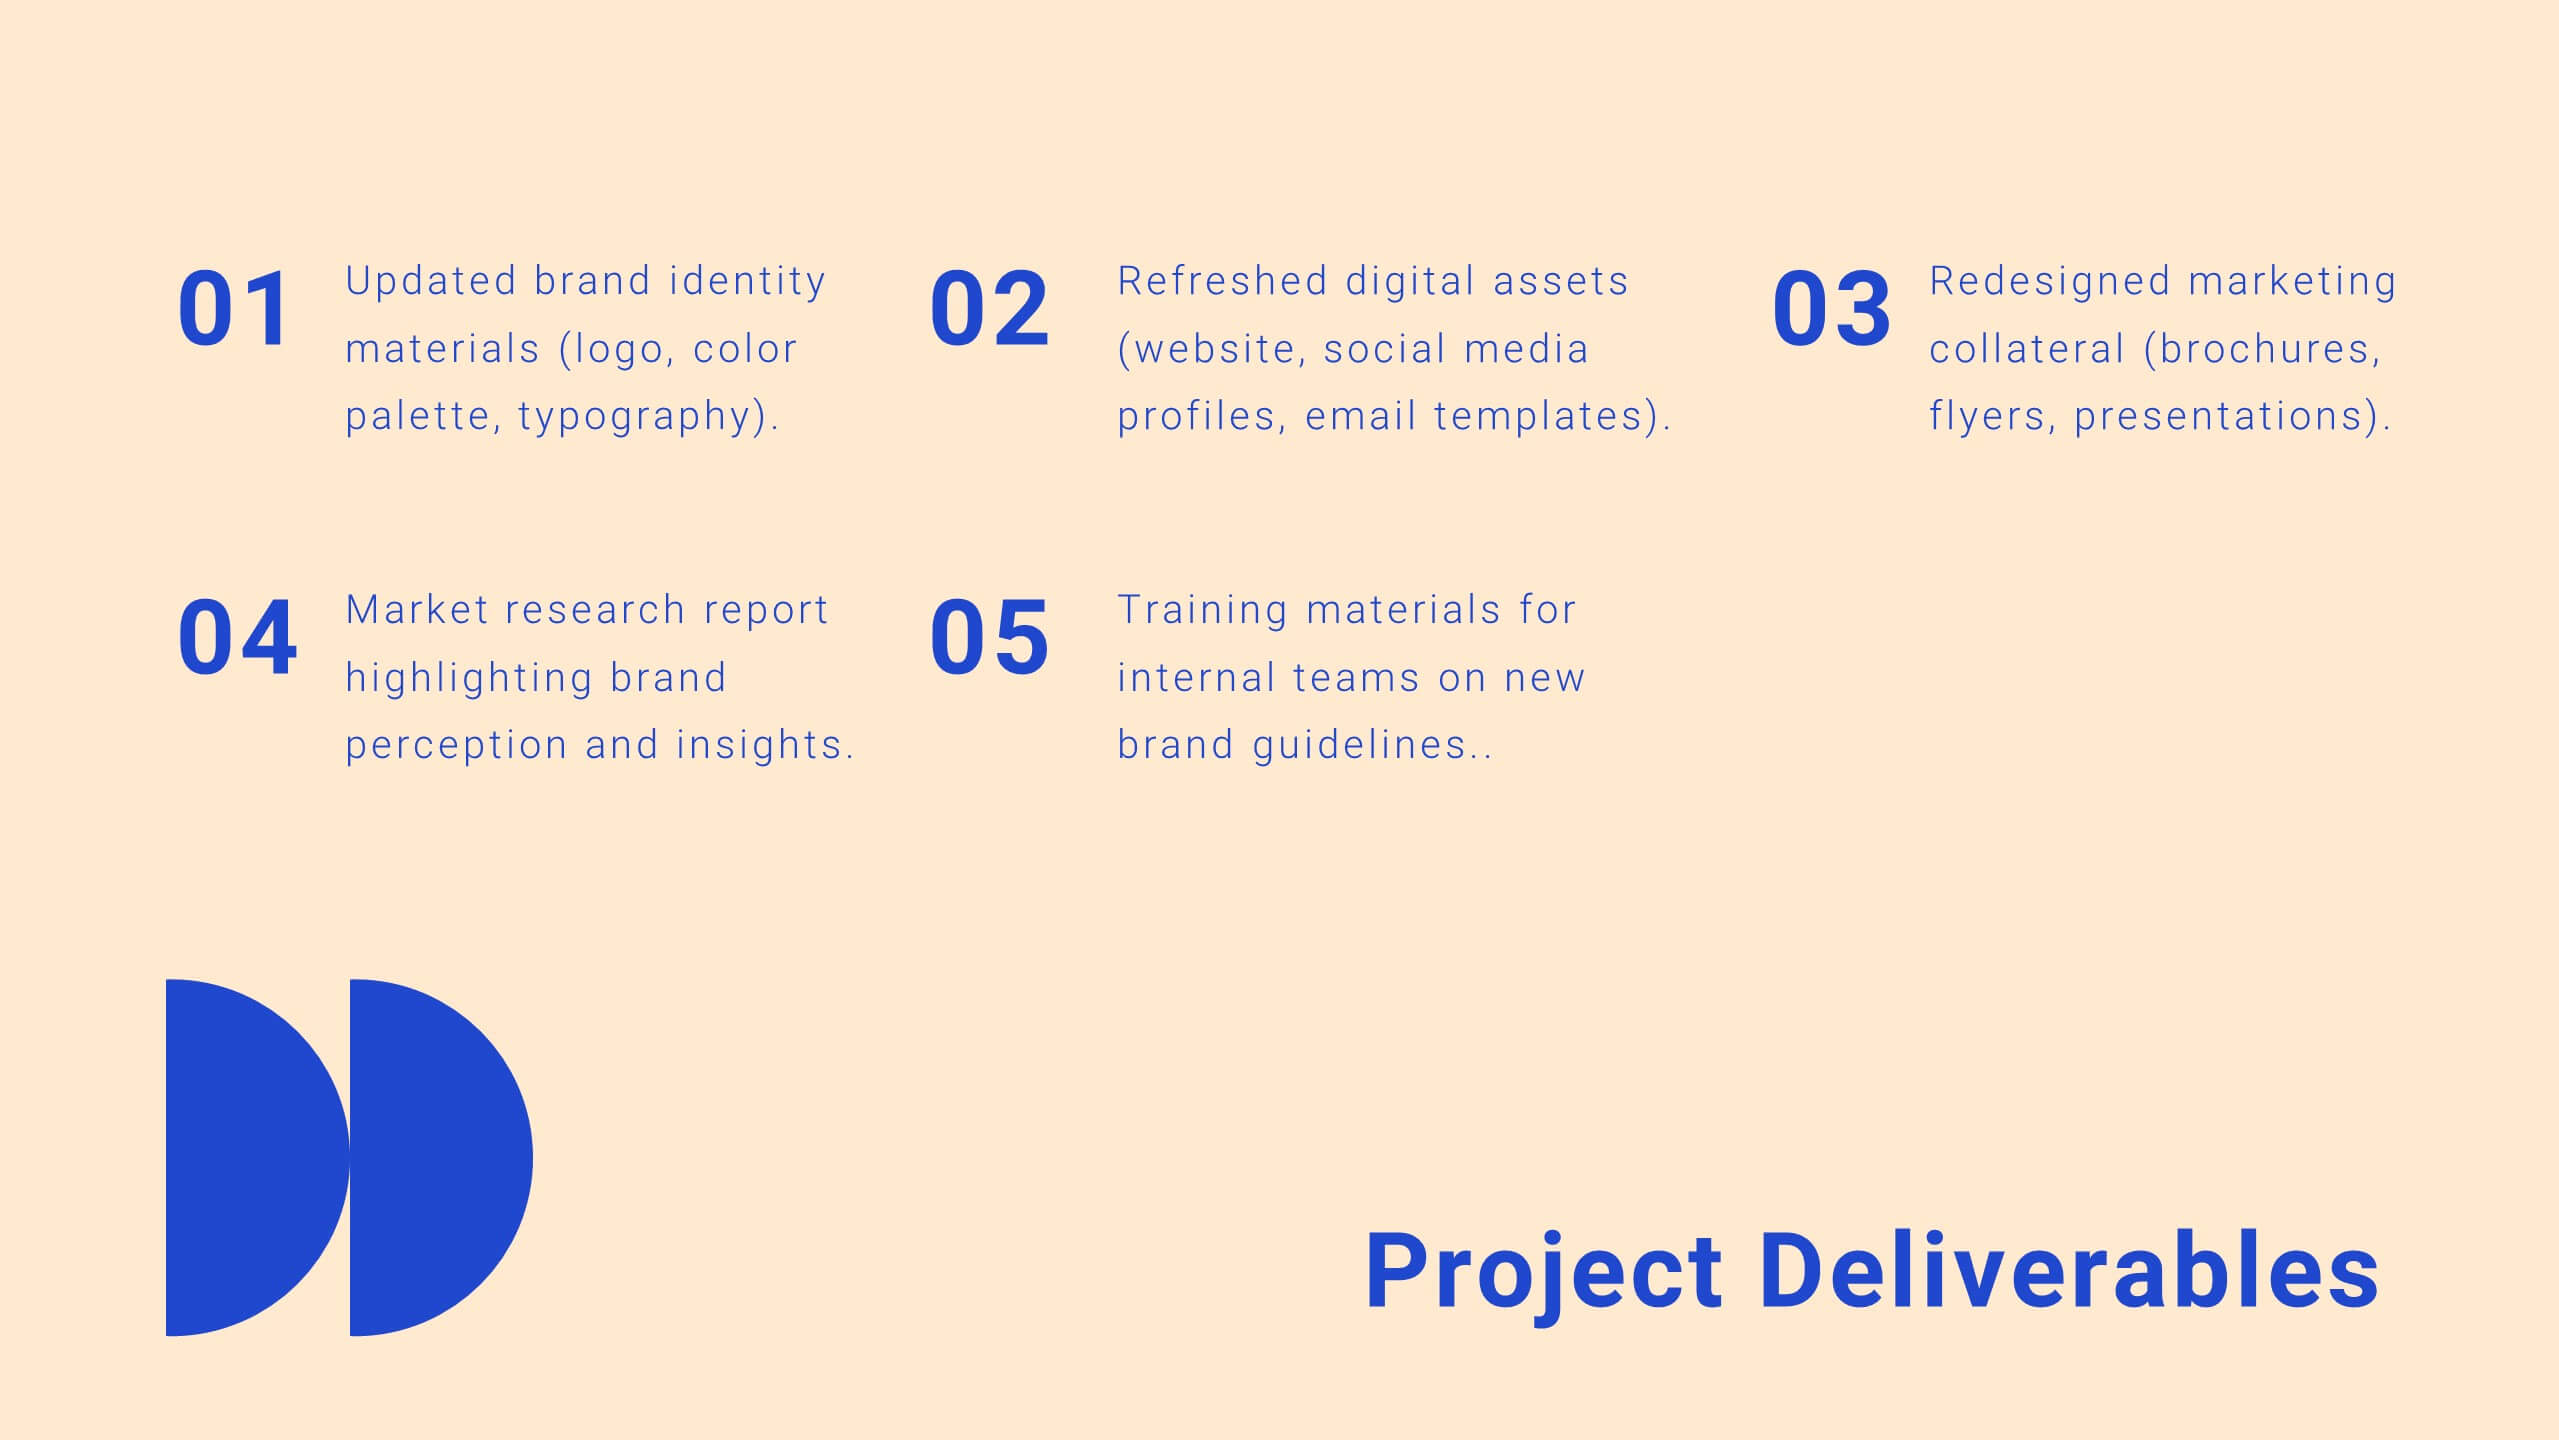
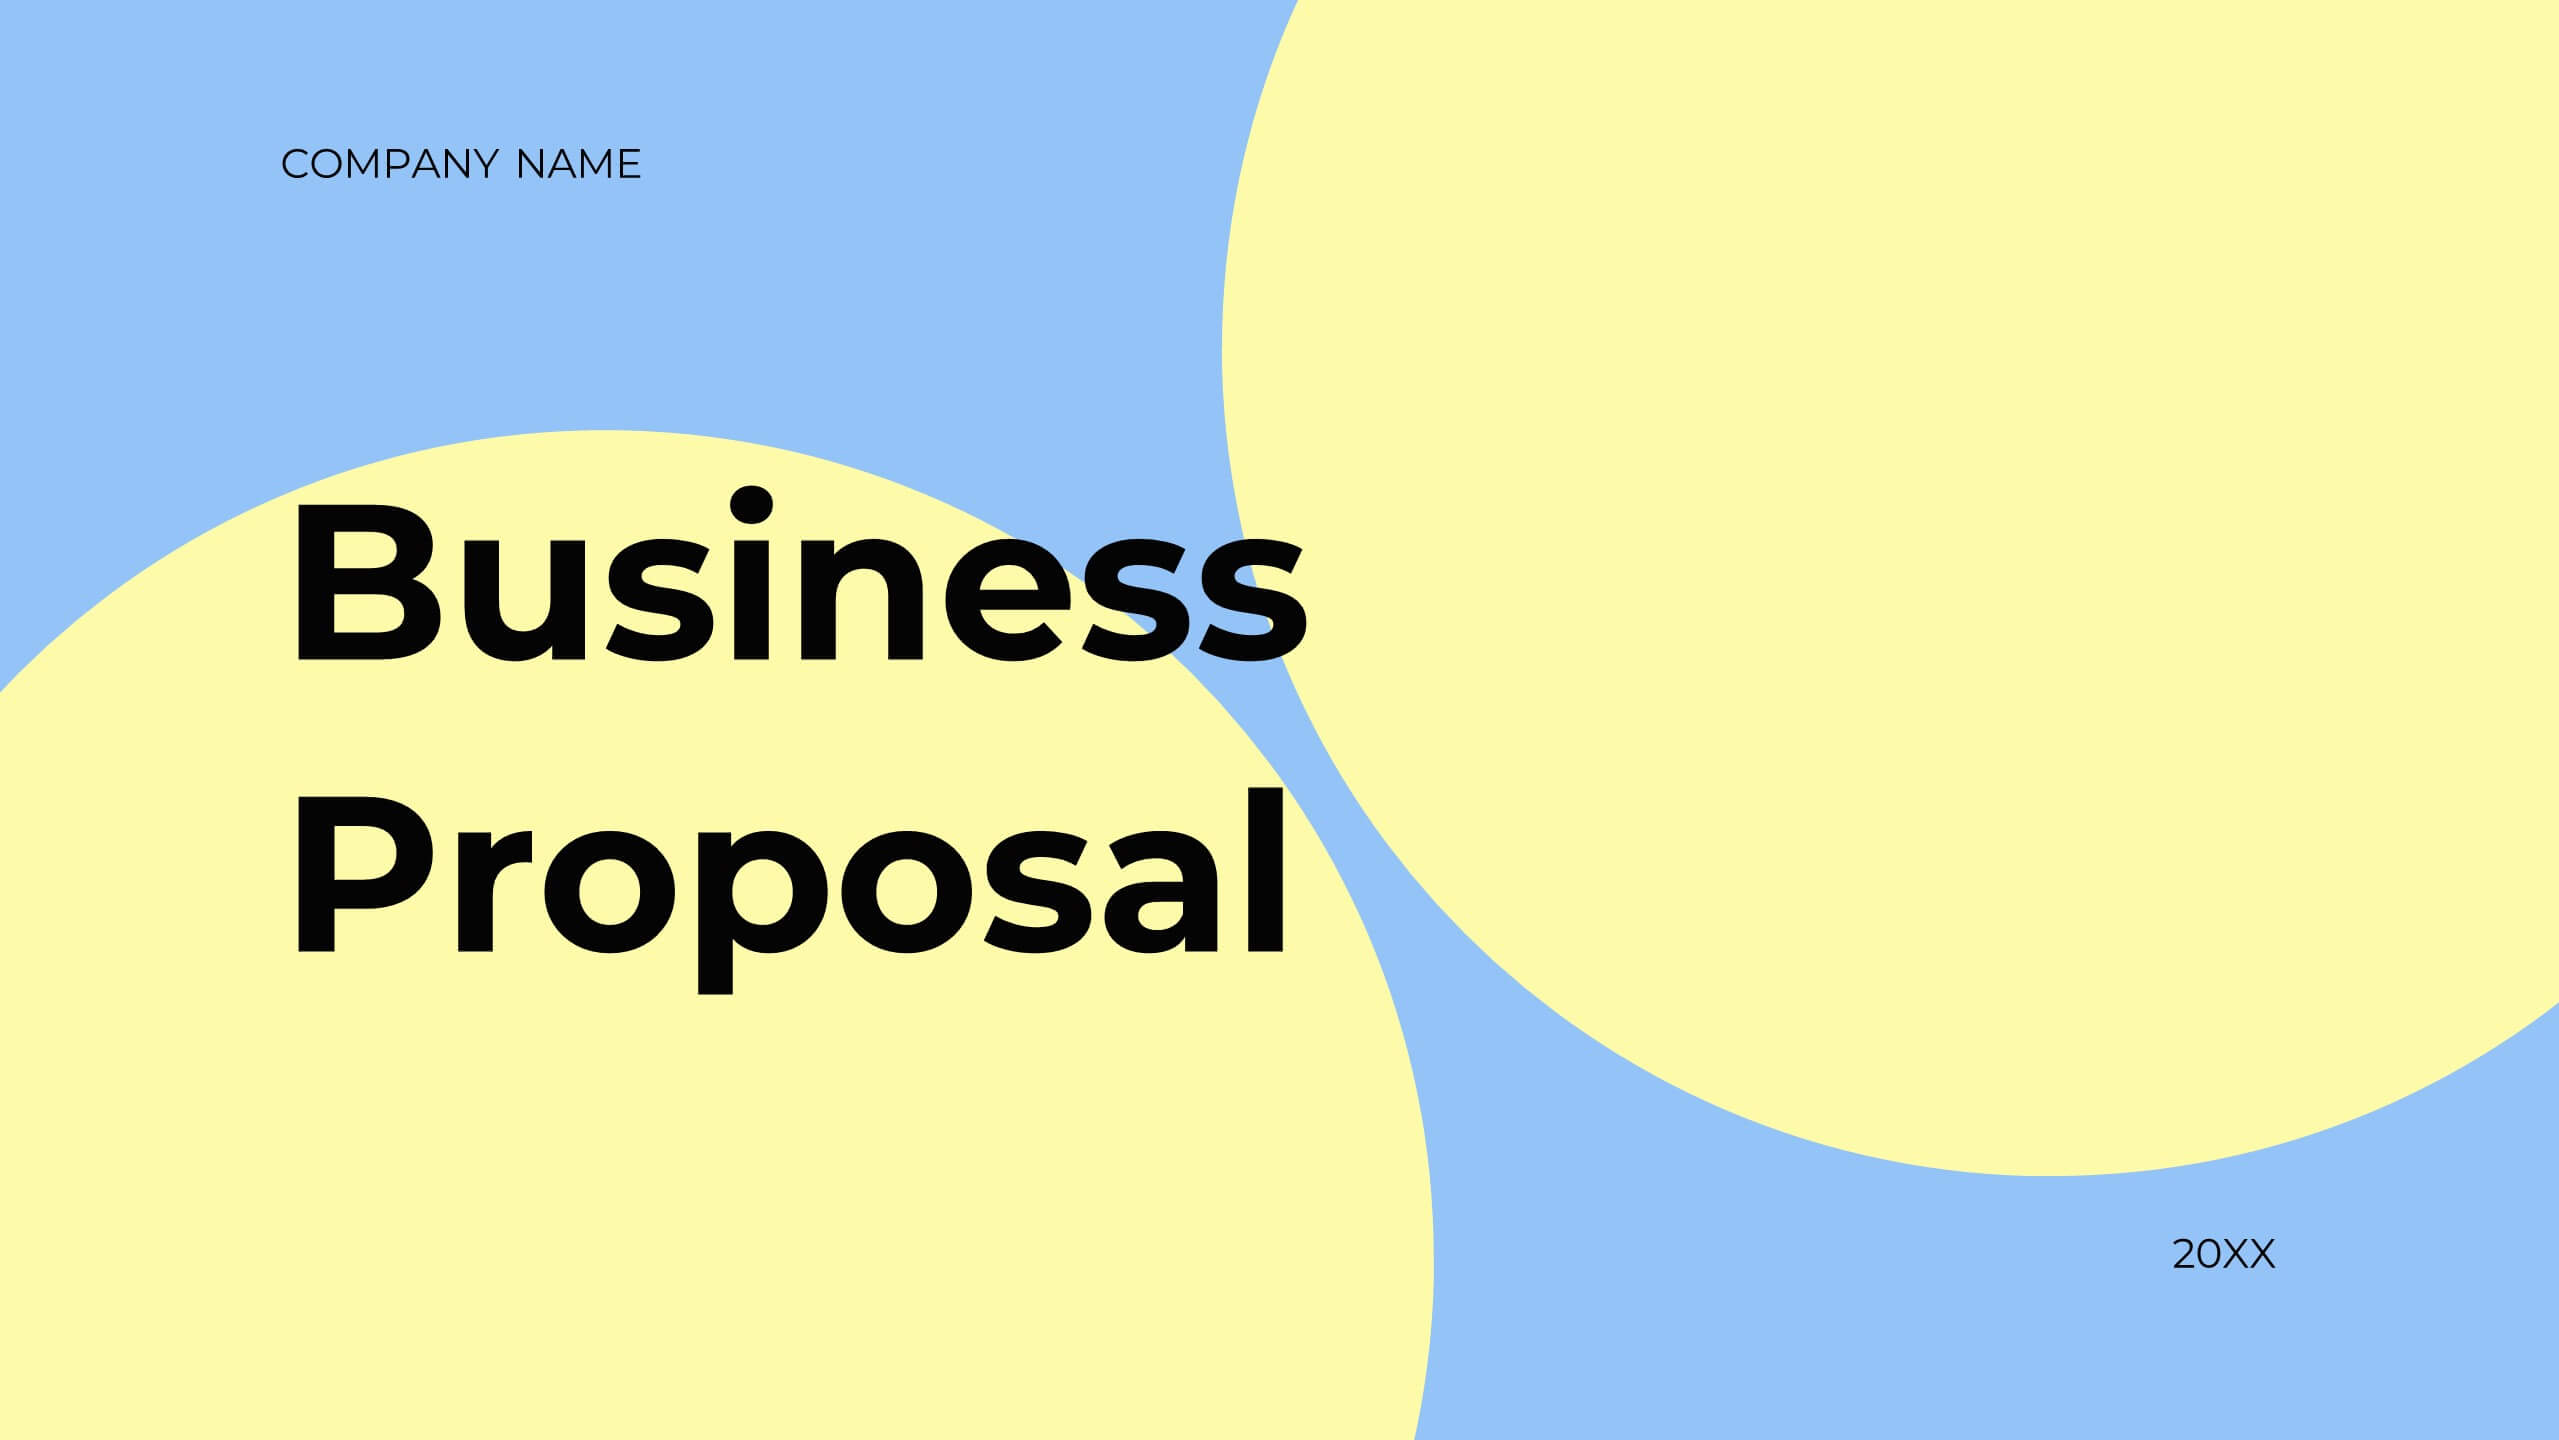
Inspire Business Proposal Presentation
Excite your audience with a compelling business proposal! This template includes sections for objectives, scope of work, timeline, budget, and more. Present your business plan clearly and effectively. Compatible with PowerPoint, Keynote, and Google Slides, it’s designed to impress stakeholders and secure approval for your project. Transform ideas into reality today!


6 slides
Market Research Case Study
Visualize your research findings with this step-by-step arrow-style case study slide. Ideal for outlining research methodology, key findings, and conclusions across six distinct phases. This layout is perfect for marketing reports, academic presentations, or business insights. Fully editable in PowerPoint, Keynote, and Google Slides.


4 slides
4-Quadrant RACI Chart Slide Presentation
Bring structure and clarity to your workflow with a bold, pyramid-style layout that makes responsibilities instantly understandable. This presentation helps teams outline who leads, supports, approves, and informs across key tasks, turning complex processes into a clean visual map. Fully editable and compatible with PowerPoint, Keynote, and Google Slides.