Title Infographic
PowerPoint Template and Google Slides Theme


Features
- 7 Unique slides
- Fully editable and easy to edit in Microsoft Powerpoint, Keynote and Google Slides
- 16:9 widescreen layout
- Clean and professional designs
- Export to JPG, PDF or send by email
Tags
- Remove from favorites
Powerpoint Template
1 MB
Google Slides Template
External link
Keynote Template
2 MB
Recommend
- Remove from favorites
Powerpoint Template
1 MB
Google Slides Template
External link
Keynote Template
1 MB
6 slides
Market Trends Heat Map Visualization
Easily analyze and compare trends across categories using this score-based heat map layout. Designed to highlight fluctuations, patterns, and data gaps, it’s perfect for tracking performance over time or across markets. Fully editable in PowerPoint, Keynote, and Google Slides.
- Remove from favorites
Powerpoint Template
1 MB
Google Slides Template
External link
Keynote Template
2 MB
4 slides
Simple Title Page Design Presentation
Make a memorable first impression with a clean, modern title design that instantly draws attention. Ideal for creative portfolios, business reports, or marketing decks, this layout combines strong typography with sleek visuals for a professional look. Fully editable in PowerPoint, Keynote, and Google Slides for complete flexibility.
- Remove from favorites
Powerpoint Template
1 MB
Google Slides Template
External link
Keynote Template
1 MB
6 slides
Project Timeline Infographic
A project timeline is a visual representation of the planned schedule and key milestones of a project. This infographic is designed to outline the sequence of activities, tasks, and events that need to be completed within a specific timeframe to achieve your project goals. This allows you to showcase the timeline of a project, from its inception to completion. It provides a clear and concise overview of the project's major milestones, tasks, and deadlines, enabling viewers to understand the project's progress at a glance. Compatible with Powerpoint, Keynote, and Google Slides.
- Remove from favorites
Powerpoint Template
1 MB
Google Slides Template
External link
Keynote Template
1 MB
6 slides
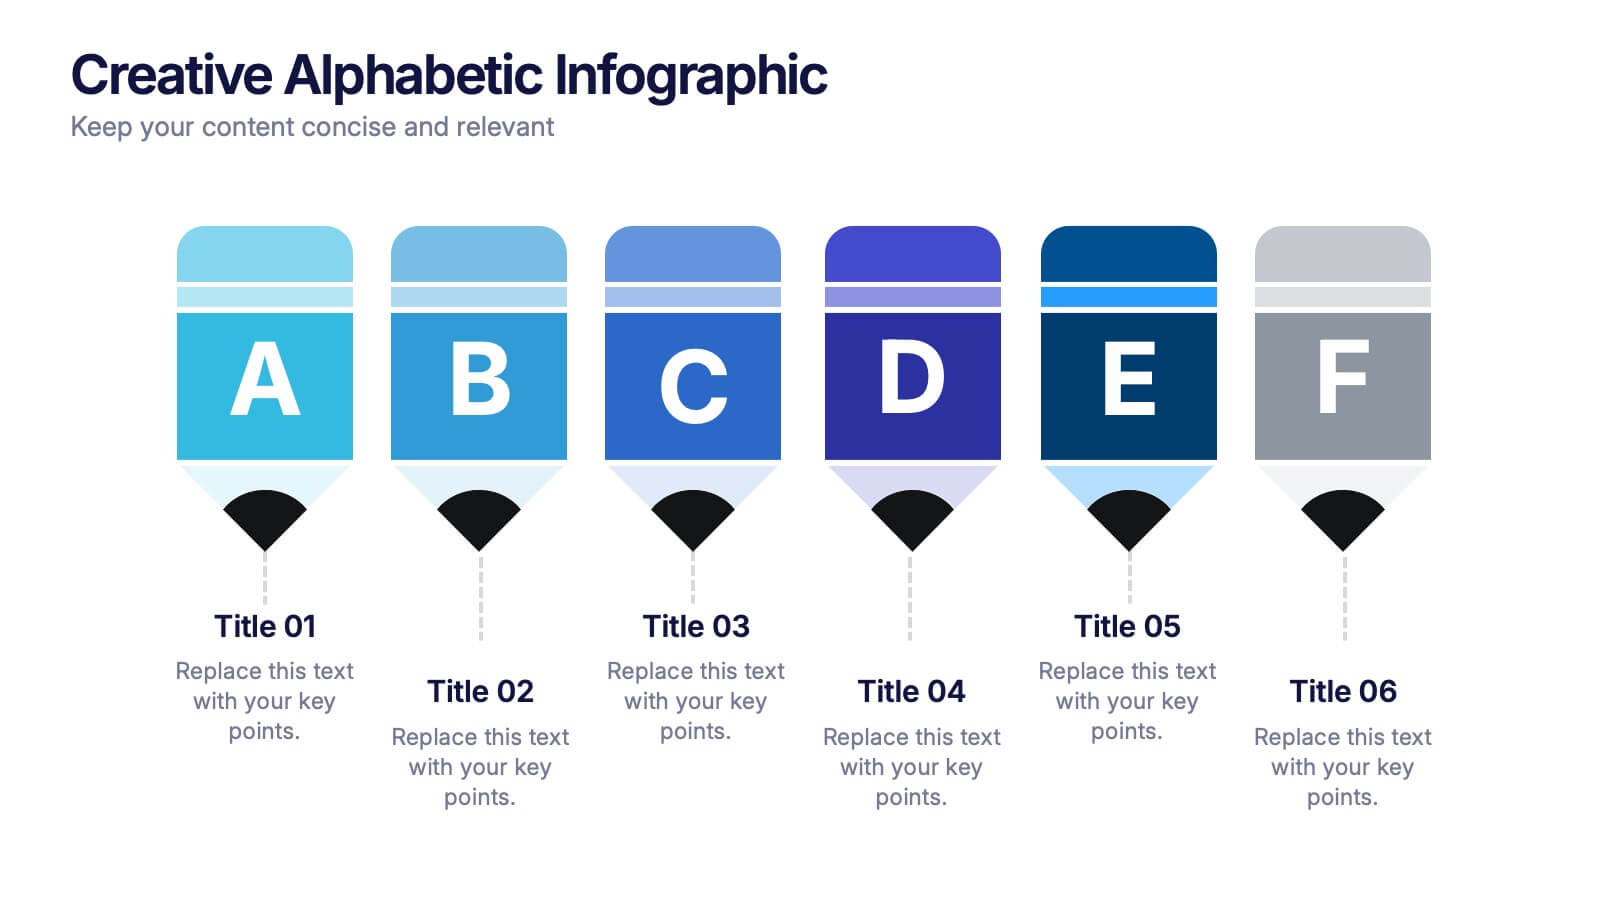
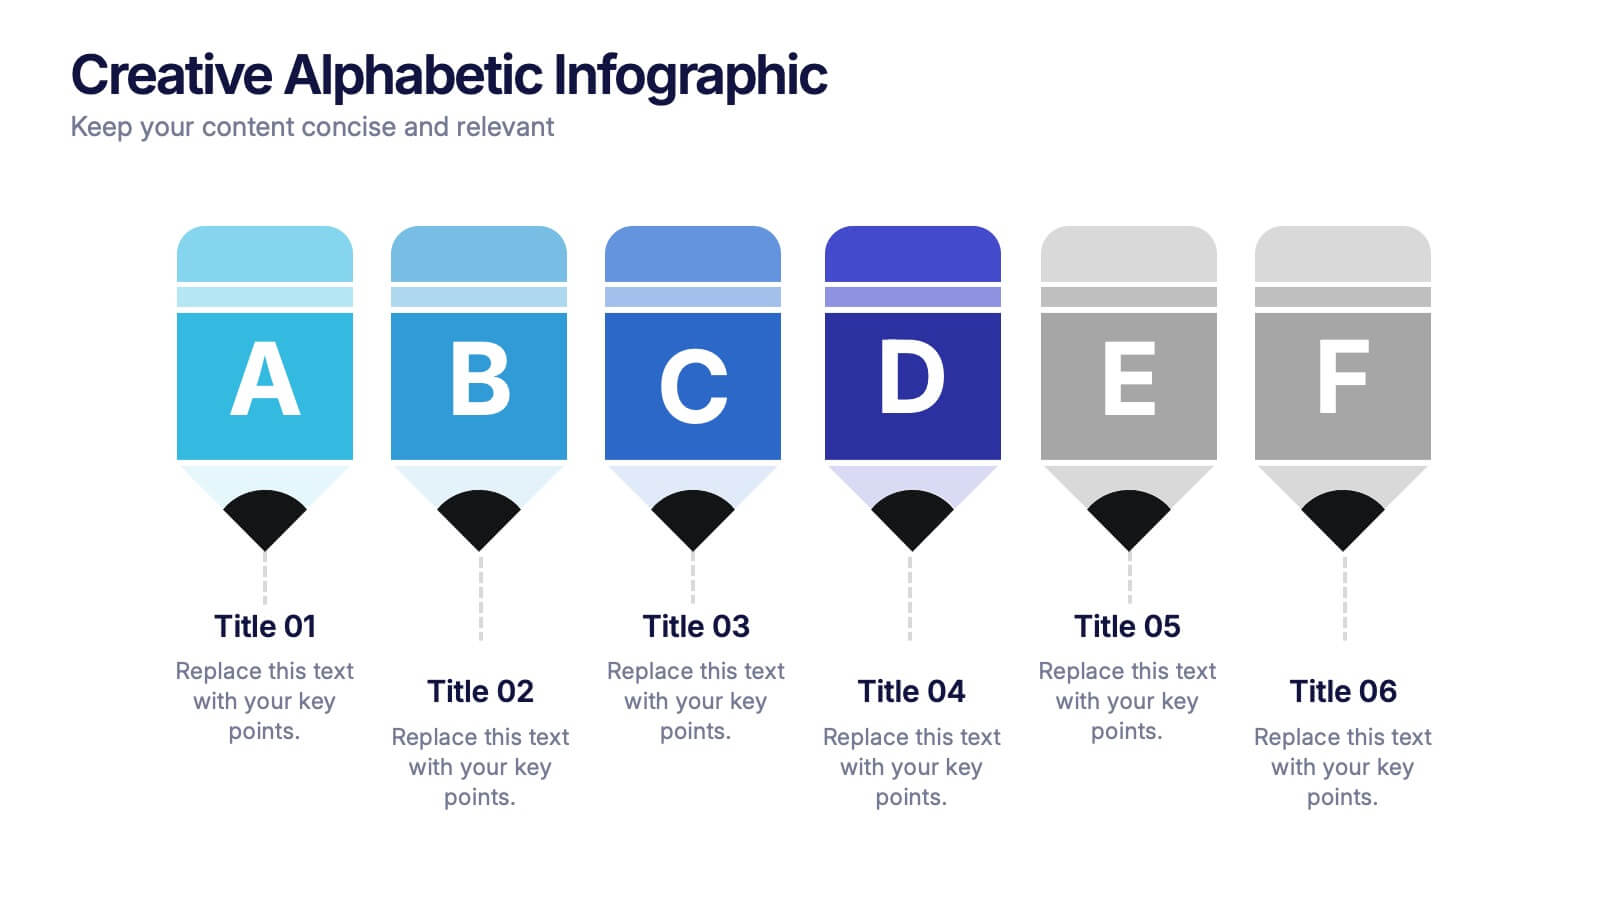
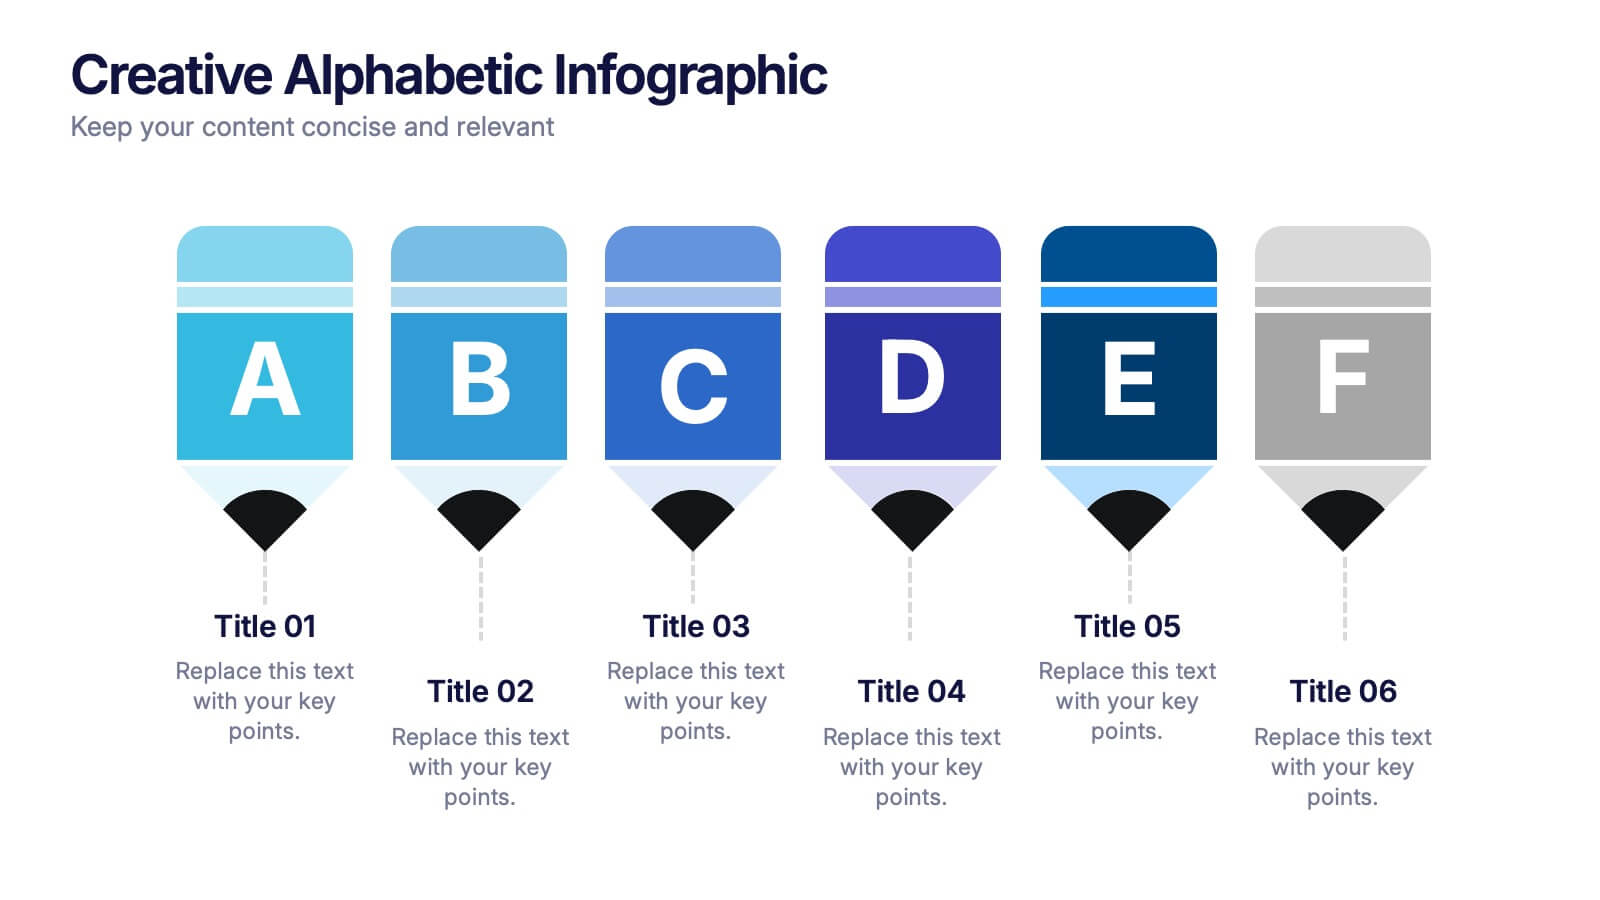
Creative Alphabetic Infographic
Bring your message to life with a bright, alphabet-inspired layout that turns simple letters into eye-catching storytelling elements. This presentation is perfect for organizing steps, categories, or key ideas in a memorable way while keeping everything clear and structured. Fully editable and compatible with PowerPoint, Keynote, and Google Slides.
- Remove from favorites
Powerpoint Template
1 MB
Google Slides Template
External link
Keynote Template
1 MB
5 slides
Hydrology and Water Cycle Presentation
Showcase the complete water cycle with this vibrant Hydrology and Water Cycle infographic. Highlight key stages like precipitation, collection, evaporation, and condensation using clear visuals and numbered sections. Fully customizable for science, sustainability, or educational presentations. Compatible with PowerPoint, Keynote, and Google Slides for easy editing.
- Remove from favorites
Powerpoint Template
1 MB
Google Slides Template
External link
Keynote Template
1 MB
4 slides
Virtual Team Meeting Guidelines Presentation
Streamline your remote collaborations with the "Virtual Team Meeting Guidelines" presentation template. Designed to enhance online interactions, this template offers a clear, structured layout for presenting effective communication strategies and meeting protocols. Its user-friendly design is ideal for guiding teams on maximizing productivity during virtual meetings. Compatible with PowerPoint, Keynote, and Google Slides, it's an essential tool for any team operating remotely.
- Remove from favorites
Powerpoint Template
1 MB
Google Slides Template
External link
Keynote Template
2 MB
2 slides
Presentation Title Design Options Presentation
Make a bold first impression with the Presentation Title Design Options template. This visually striking layout features a futuristic 3D cube graphic framed in a circular cutout, paired with two clean content blocks for highlighting your key messages. Ideal for opening slides or concept overviews, this design is fully editable in PowerPoint, Keynote, and Google Slides.
- Remove from favorites
Powerpoint Template
1 MB
Google Slides Template
External link
Keynote Template
1 MB
4 slides
Social Media Analytics Dashboard Presentation
Easily monitor and report on your content performance with the Social Media Analytics Dashboard Presentation. This sleek, modular layout combines key metrics like items, uploads, comments, and feeds with a vertical bar chart to visualize insights across platforms. Ideal for campaign reviews, stakeholder updates, or team reporting. Fully customizable in PowerPoint, Keynote, and Google Slides.
- Remove from favorites
Powerpoint Template
1 MB
Google Slides Template
External link
Keynote Template
1 MB
4 slides
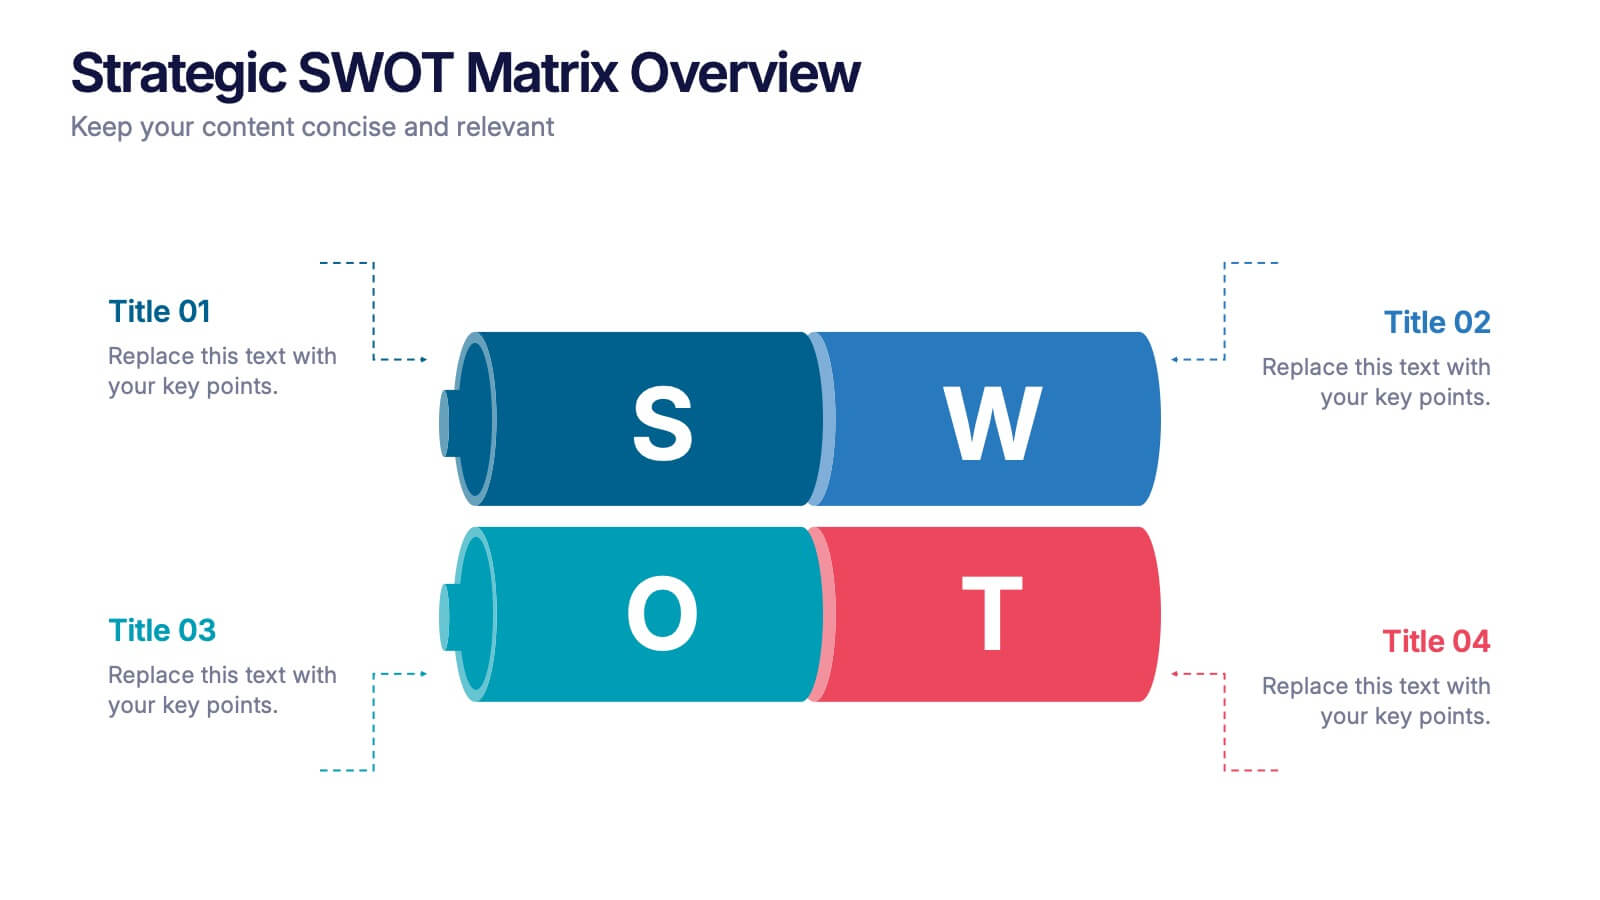
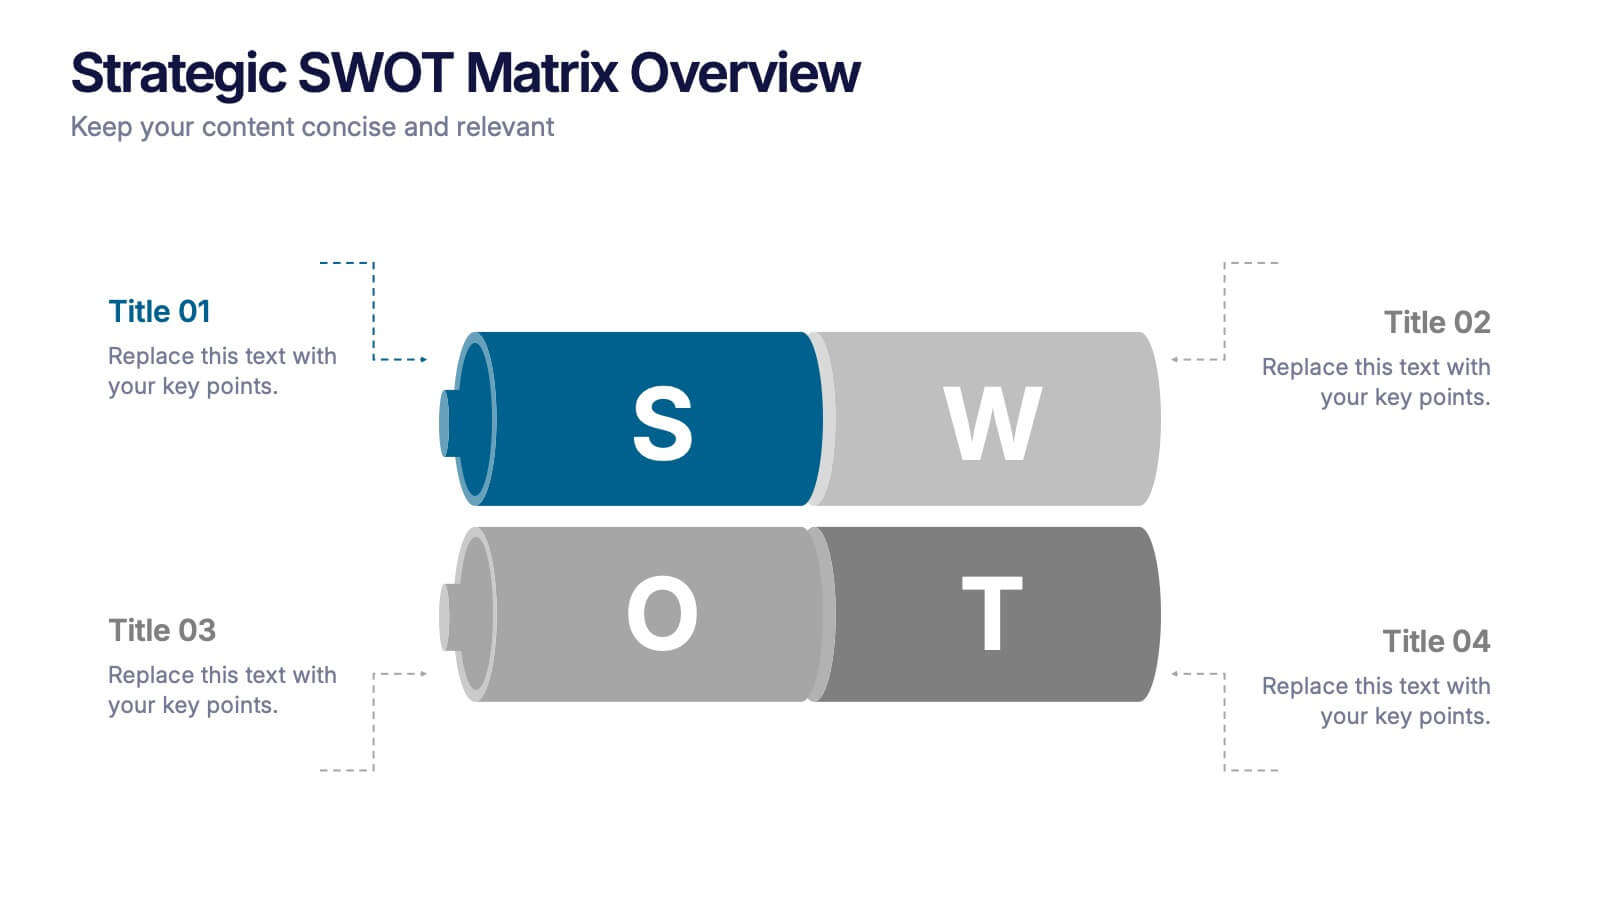
Strategic SWOT Matrix Overview Presentation
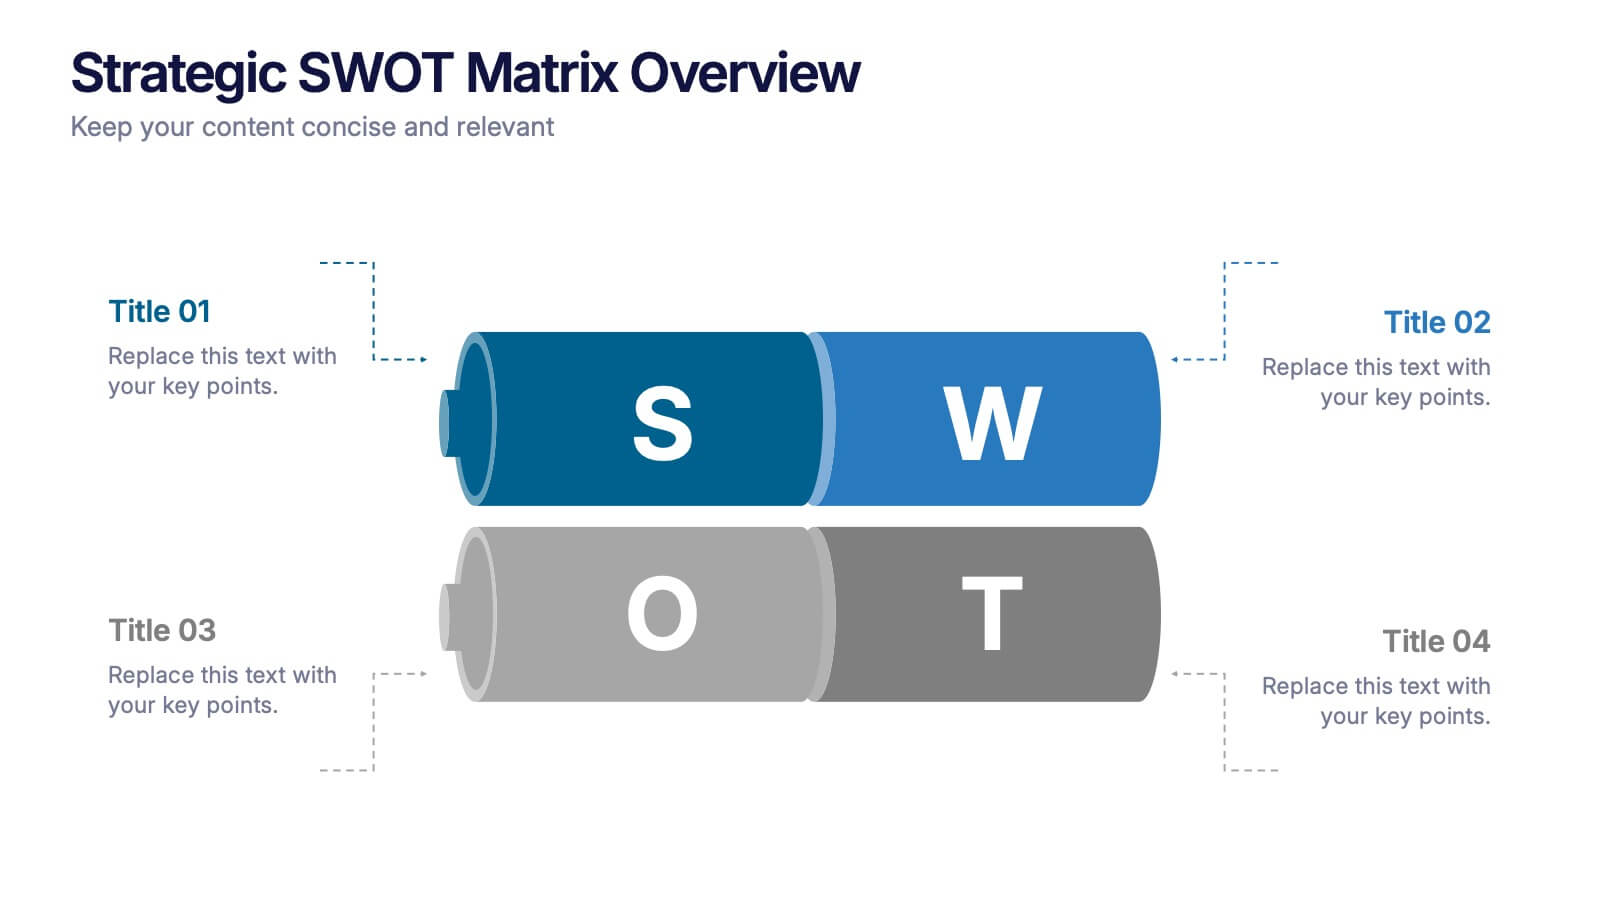
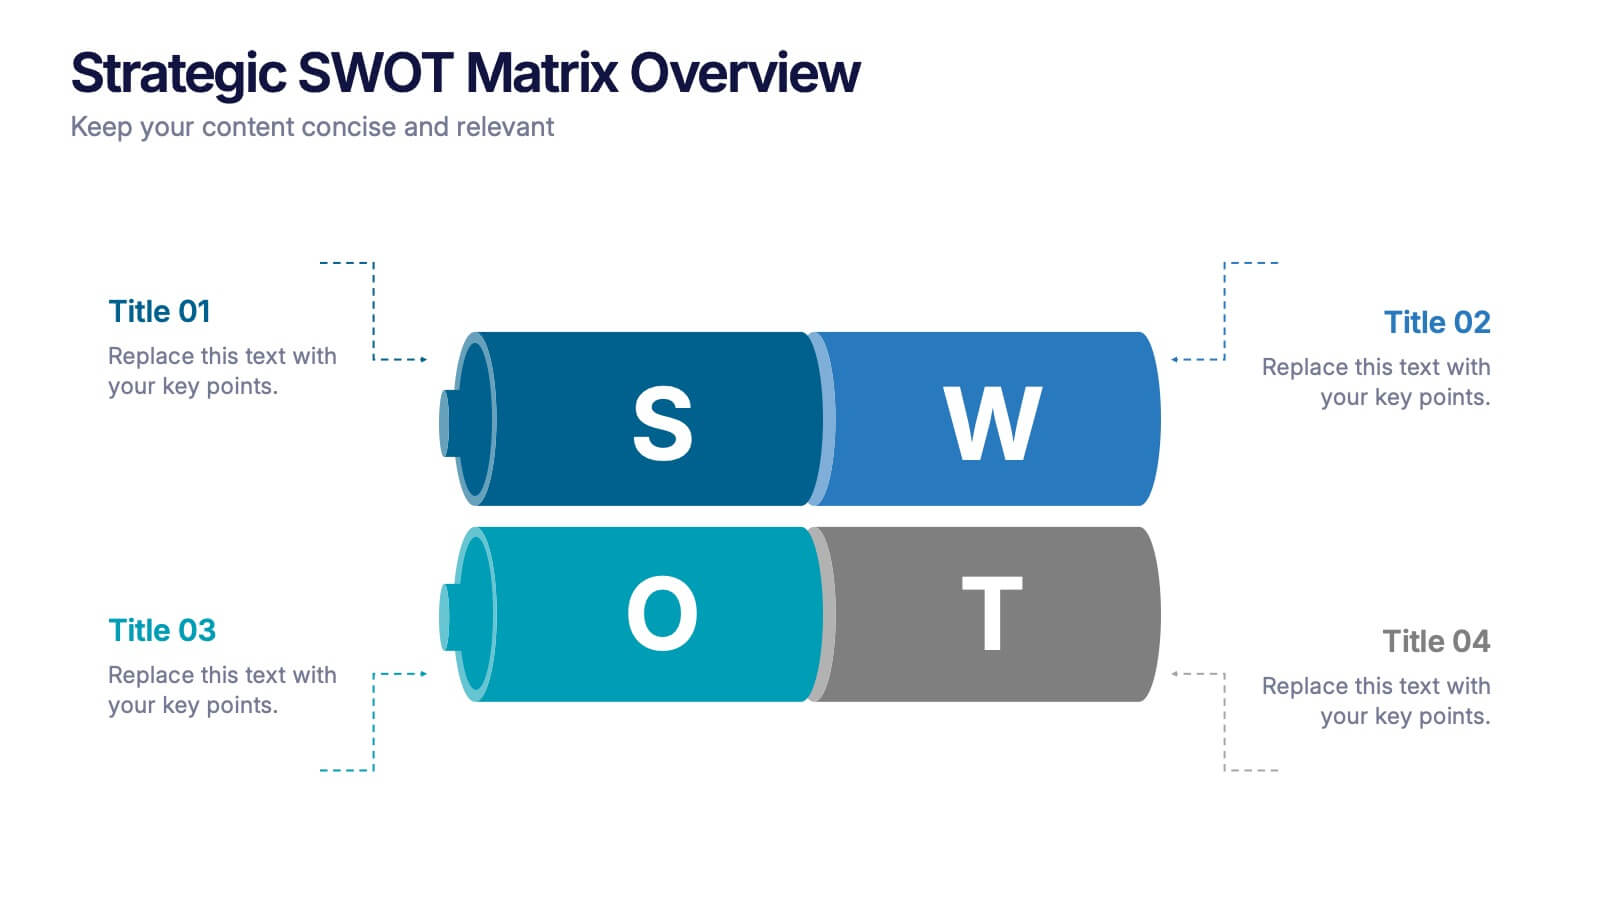
Present your strategic insights with clarity using the Strategic SWOT Matrix Overview Presentation. This modern slide layout features a sleek horizontal design that separates Strengths, Weaknesses, Opportunities, and Threats into visually distinct segments. Ideal for business planning, strategy reviews, or team discussions. Fully editable in PowerPoint, Canva, and Google Slides.
- Remove from favorites
Powerpoint Template
1 MB
Google Slides Template
External link
Keynote Template
1 MB
7 slides
AIDA Selling Model Infographic
The AIDA model is a widely used marketing and advertising framework that outlines the stages a consumer typically goes through when engaging with a product or service. This infographic template is a dynamic and compelling tool designed to conquer the attention and minds of your audience. AIDA, the cornerstone of marketing, stands for Attention, Interest, Desire, and Action—an unyielding formula for successful engagement. Fully customizable and compatible with Powerpoint, Keynote, and Google Slides. Prepare to take your marketing strategies to exhilarating heights with this infographic.
- Remove from favorites
Powerpoint Template
1 MB
Google Slides Template
External link
Keynote Template
1 MB
6 slides
Fishbone Concept Infographic
Dissect complex issues with our Fishbone Concept Infographic, ideal for Powerpoint, Google Slides, and Keynote. This infographic, also known as the Ishikawa or cause-and-effect diagram, is designed for problem-solving and root cause analysis. This template features a series of branching arrows leading to a central spine, enabling you to map out multiple cause-and-effect relationships. Each ‘bone’ represents a category of causes that you can customize to fit your specific analysis needs. With this fishbone infographic, you can effectively organize and present complex data, making it easier for your audience to understand and engage with the content of your presentation.
- Remove from favorites
Powerpoint Template
1 MB
Google Slides Template
External link
Keynote Template
1 MB
6 slides
Major World History Milestones Presentation
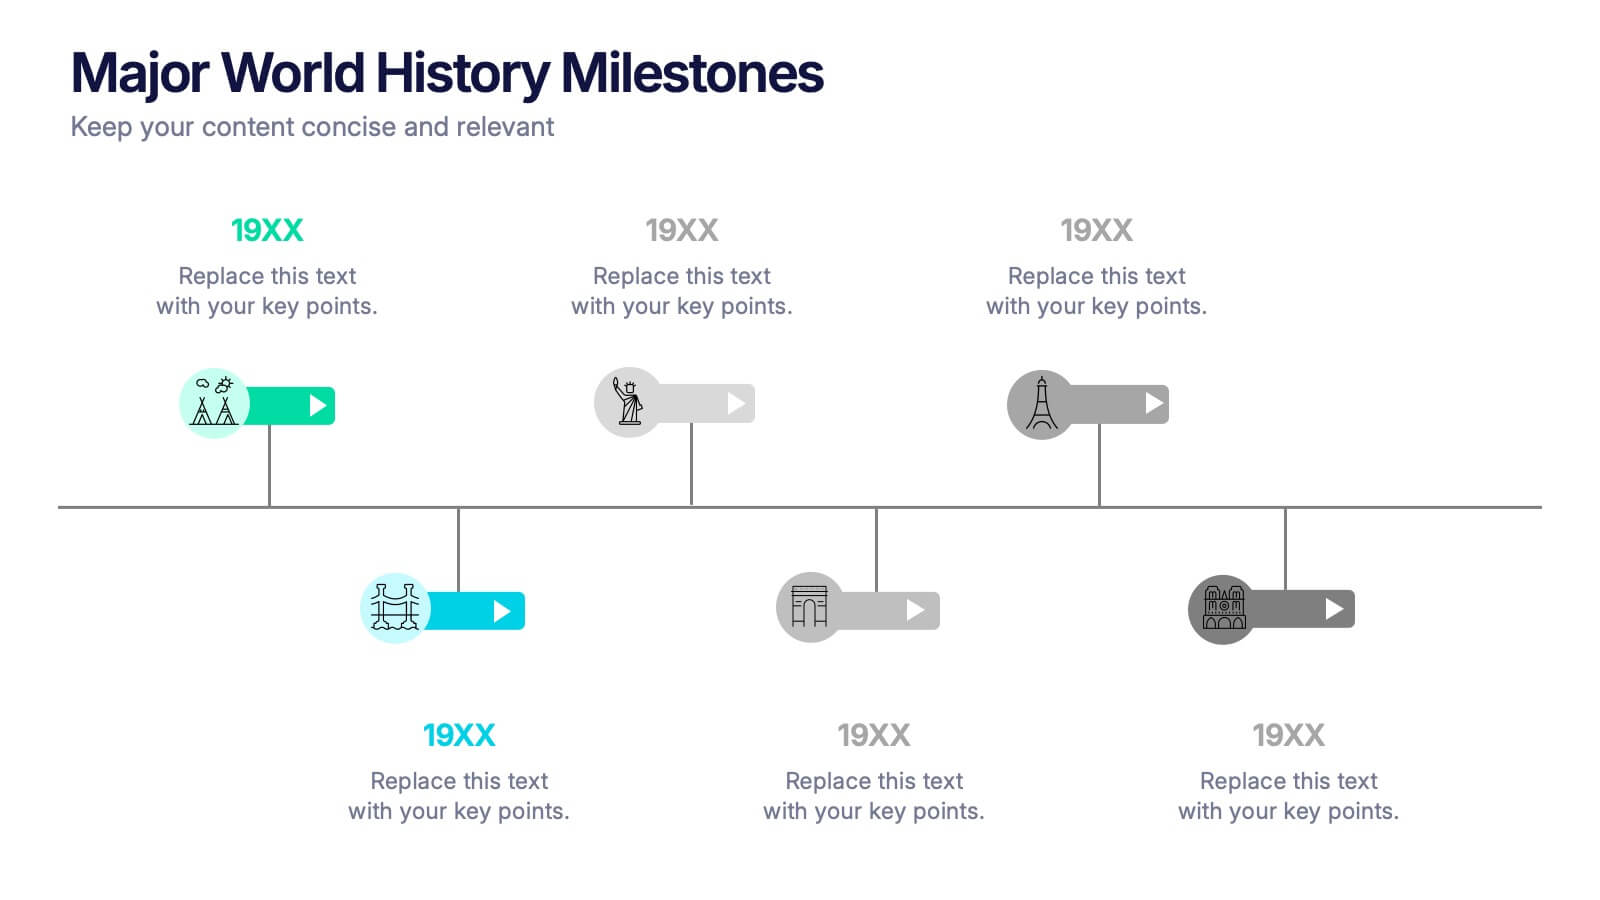
Highlight significant events in a visually engaging way with this horizontal timeline template. Featuring clean icons, color-coded markers, and spacious text areas, it’s ideal for showcasing historical sequences, educational lectures, or research summaries. Fully editable in PowerPoint, Keynote, and Google Slides for customized storytelling and clear chronological impact.
- Remove from favorites
Powerpoint Template
External link
Google Slides Template
External link
Keynote Template
External link
7 slides
SCRUM Master Infographic Presentation
A Scrum infographic provides an overview of all the key components of the Scrum framework and helps teams and individuals understand this powerful agile methodology. This Infographic template is fully editable and can be easily customized to reflect your business, company or organization. It’s a great way to present your ideas in a clear and efficient manner. Full of charts and diagrams, this template creates an impactful visual effect. The blue color scheme will help create a fresh look in your presentations. This template is designed for use in Powerpoint, Google Sheets or Keynote.
- Remove from favorites
Powerpoint Template
1 MB
Google Slides Template
External link
Keynote Template
2 MB
6 slides
Africa Population Map Infographics
Discover the flexibility of our Africa Population Map infographic template, a dynamic tool for illustrating population distribution across the African continent. This template is compatible with widely used presentation software like PowerPoint, Keynote, and Google Slides, allowing you to effortlessly customize it according to your specific requirements. The Africa Population Map infographic template provides a solid foundation for visualizing population data, highlighting densely populated areas, urban centers, and demographic trends. Whether you're an educator, researcher, or simply curious about Africa's demographics, this template offers a user-friendly platform to create engaging presentations and informative materials. Impress your audience with this SEO-optimized Africa Population Map infographic template, thoughtfully designed for clarity and ease of use. Tailor it to showcase population variations, growth patterns, and regional insights, making it a valuable asset for your projects and presentations. Start crafting your personalized infographic today!
- Remove from favorites
Powerpoint Template
1 MB
Google Slides Template
External link
Keynote Template
1 MB
6 slides
Effective Communication Infographics
Master the art of Effective Communication with our customizable infographic template. This template is fully compatible with popular presentation software like PowerPoint, Keynote, and Google Slides, allowing you to easily customize it to illustrate and communicate various aspects of effective communication. The Effective Communication infographic template offers a visually engaging platform to outline the principles, strategies, and skills needed to communicate effectively in various contexts, whether it's in business, personal relationships, or public speaking. Whether you're a professional communicator, leader, or someone looking to improve their communication skills, this template provides a user-friendly canvas to create informative presentations and educational materials. Optimize your communication skills with this SEO-optimized Effective Communication infographic template, thoughtfully designed for clarity and ease of use. Customize it to showcase the importance of active listening, nonverbal communication, effective messaging, and overcoming communication barriers, ensuring that your audience gains valuable insights into this essential skill. Start crafting your personalized infographic today to become a more proficient and confident communicator.
- Remove from favorites
Powerpoint Template
1 MB
Google Slides Template
External link
Keynote Template
1 MB
4 slides
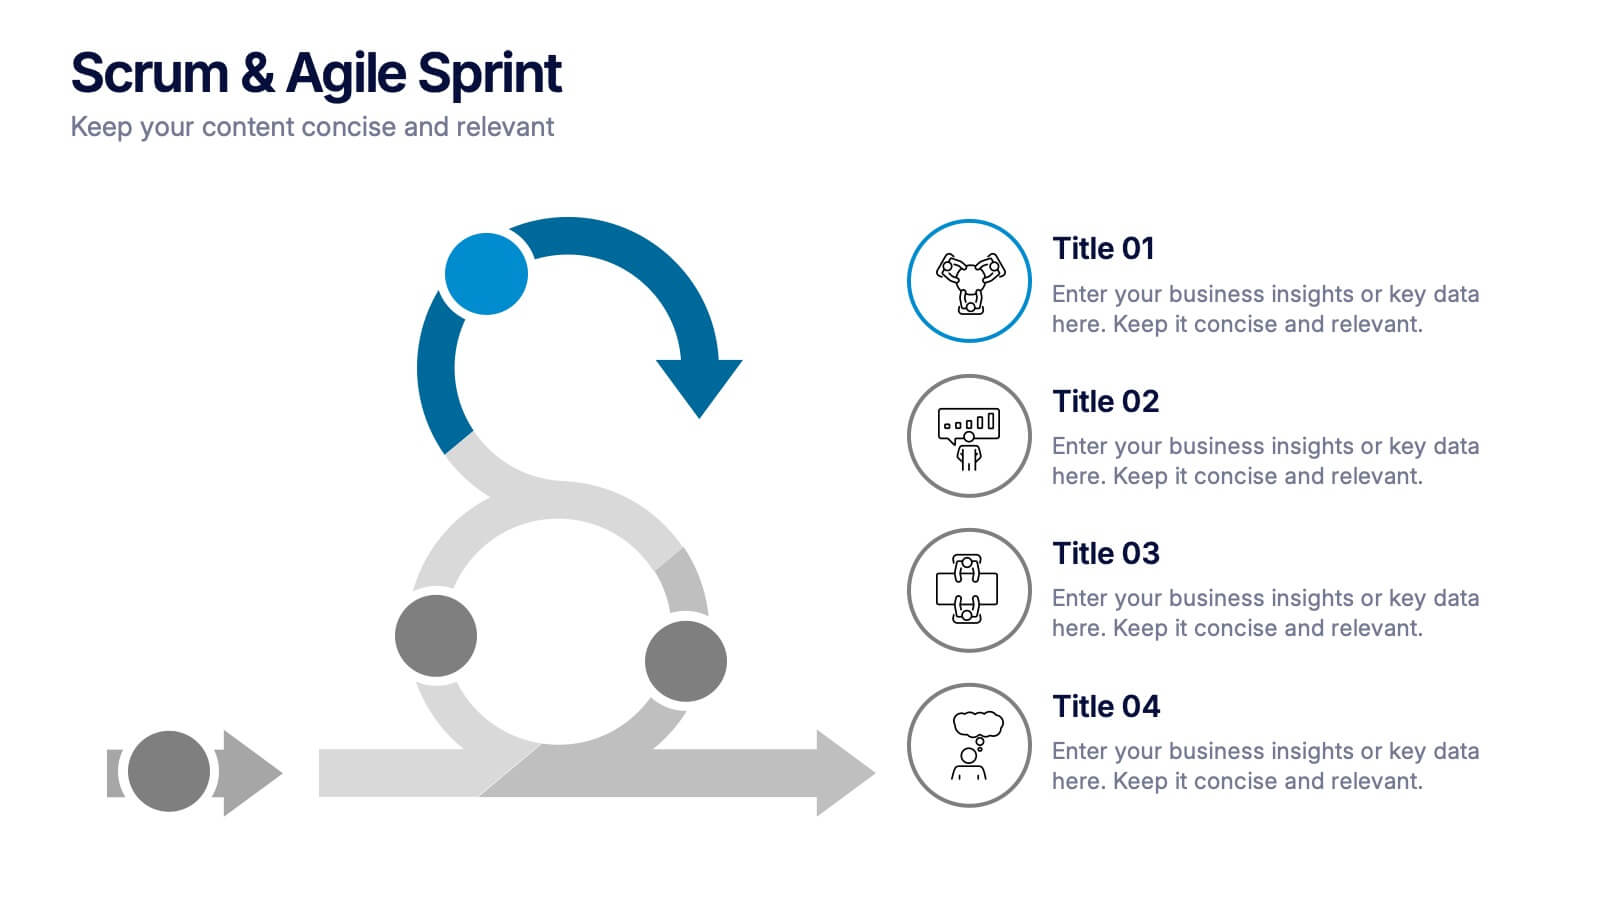
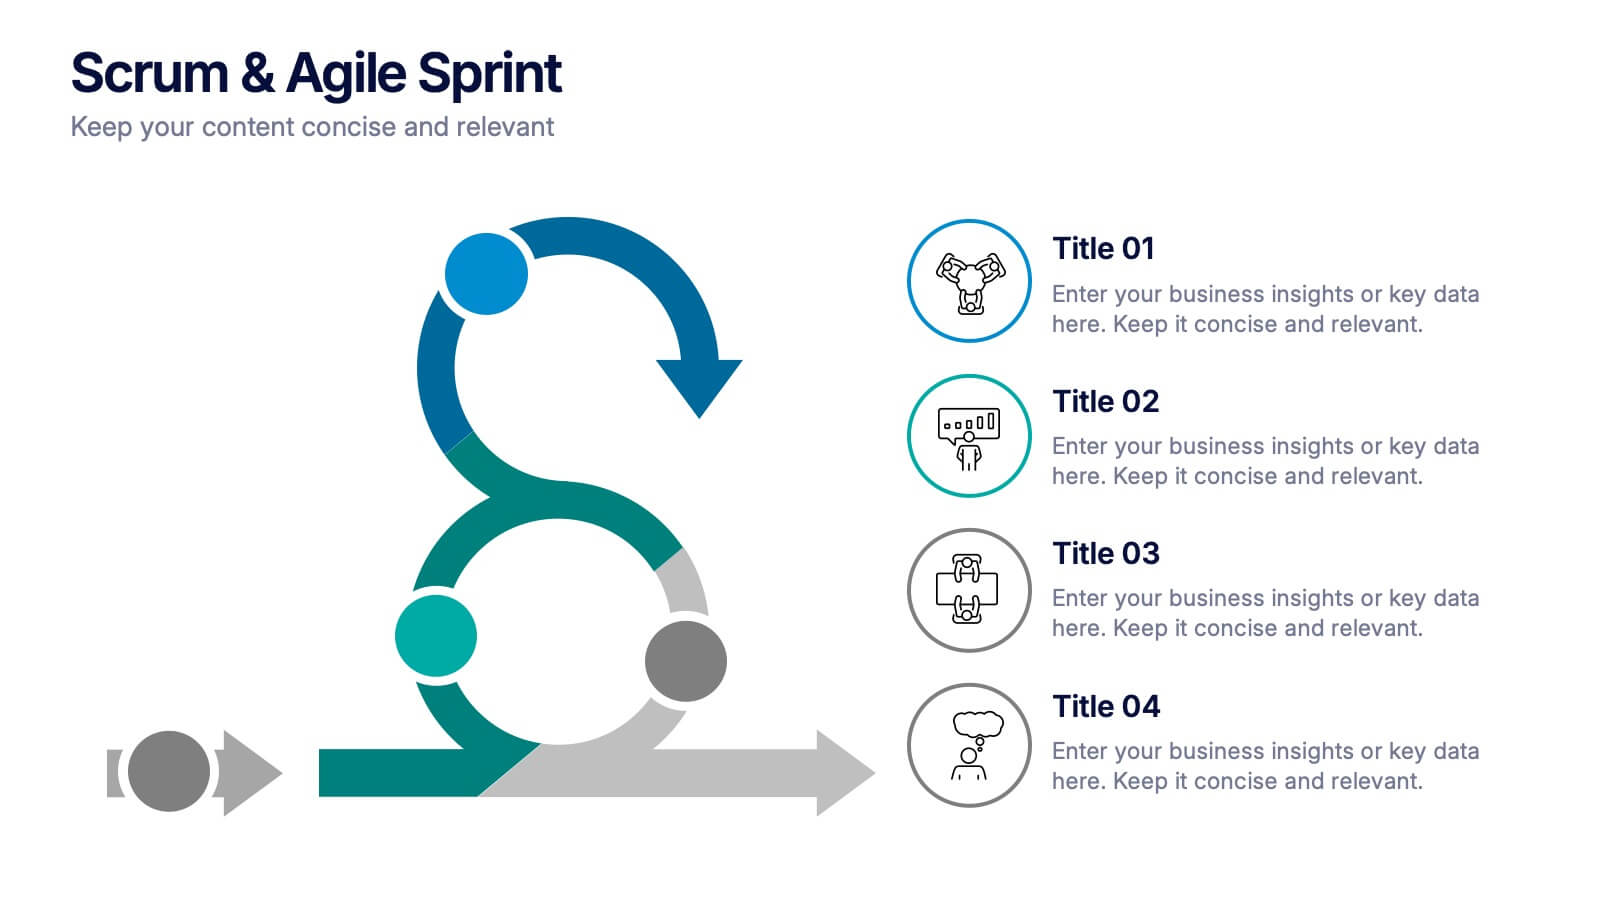
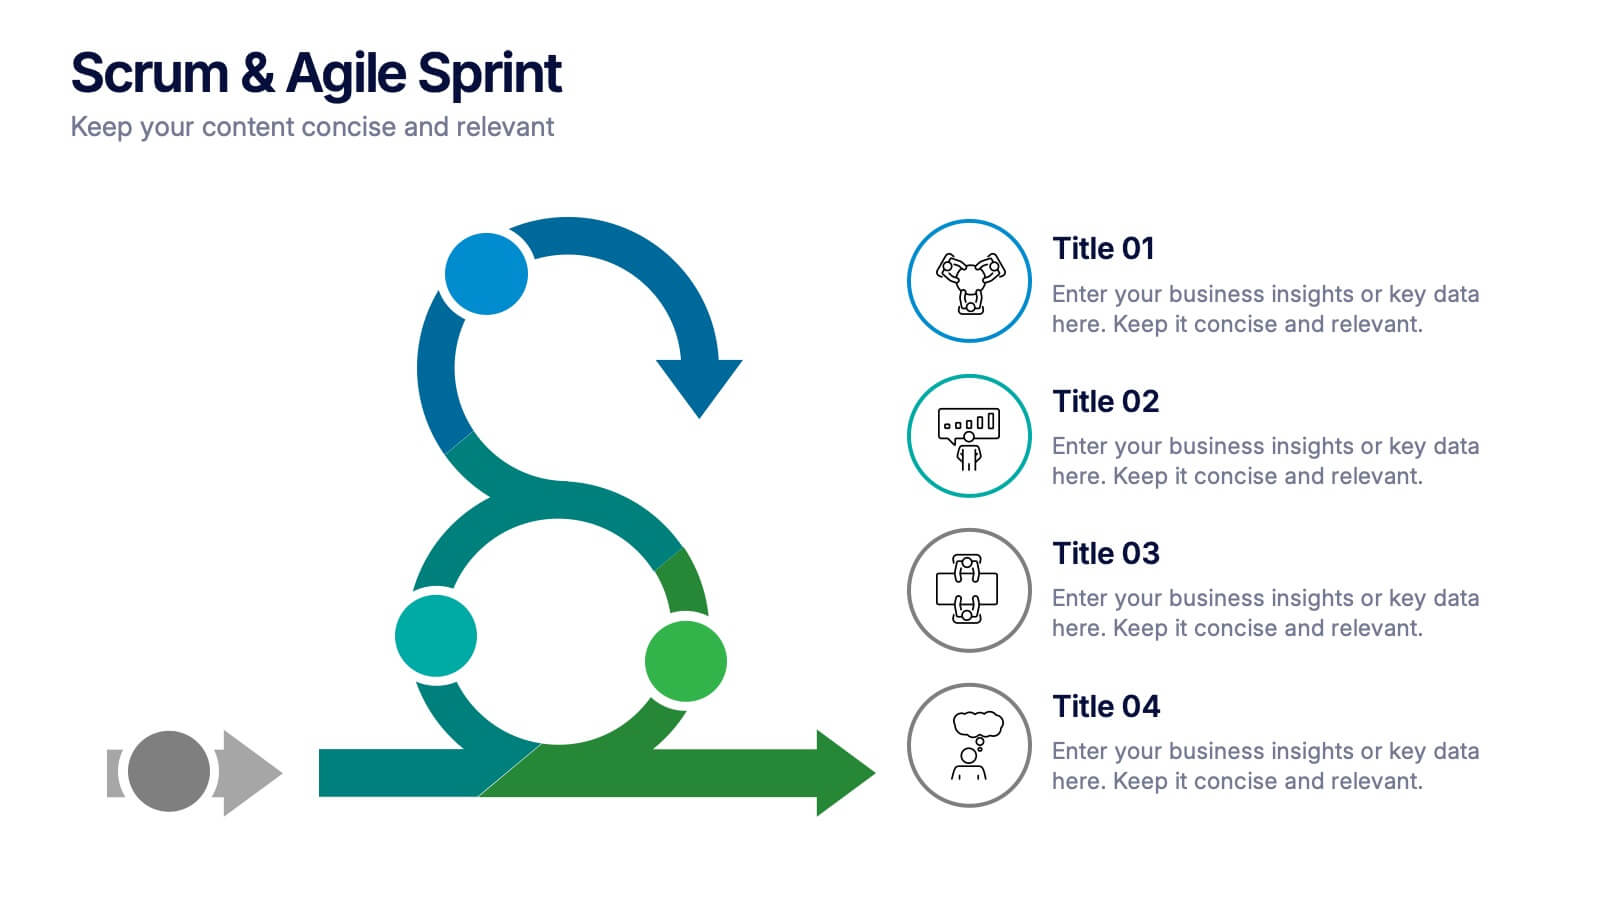
Scrum & Agile Sprint Presentation
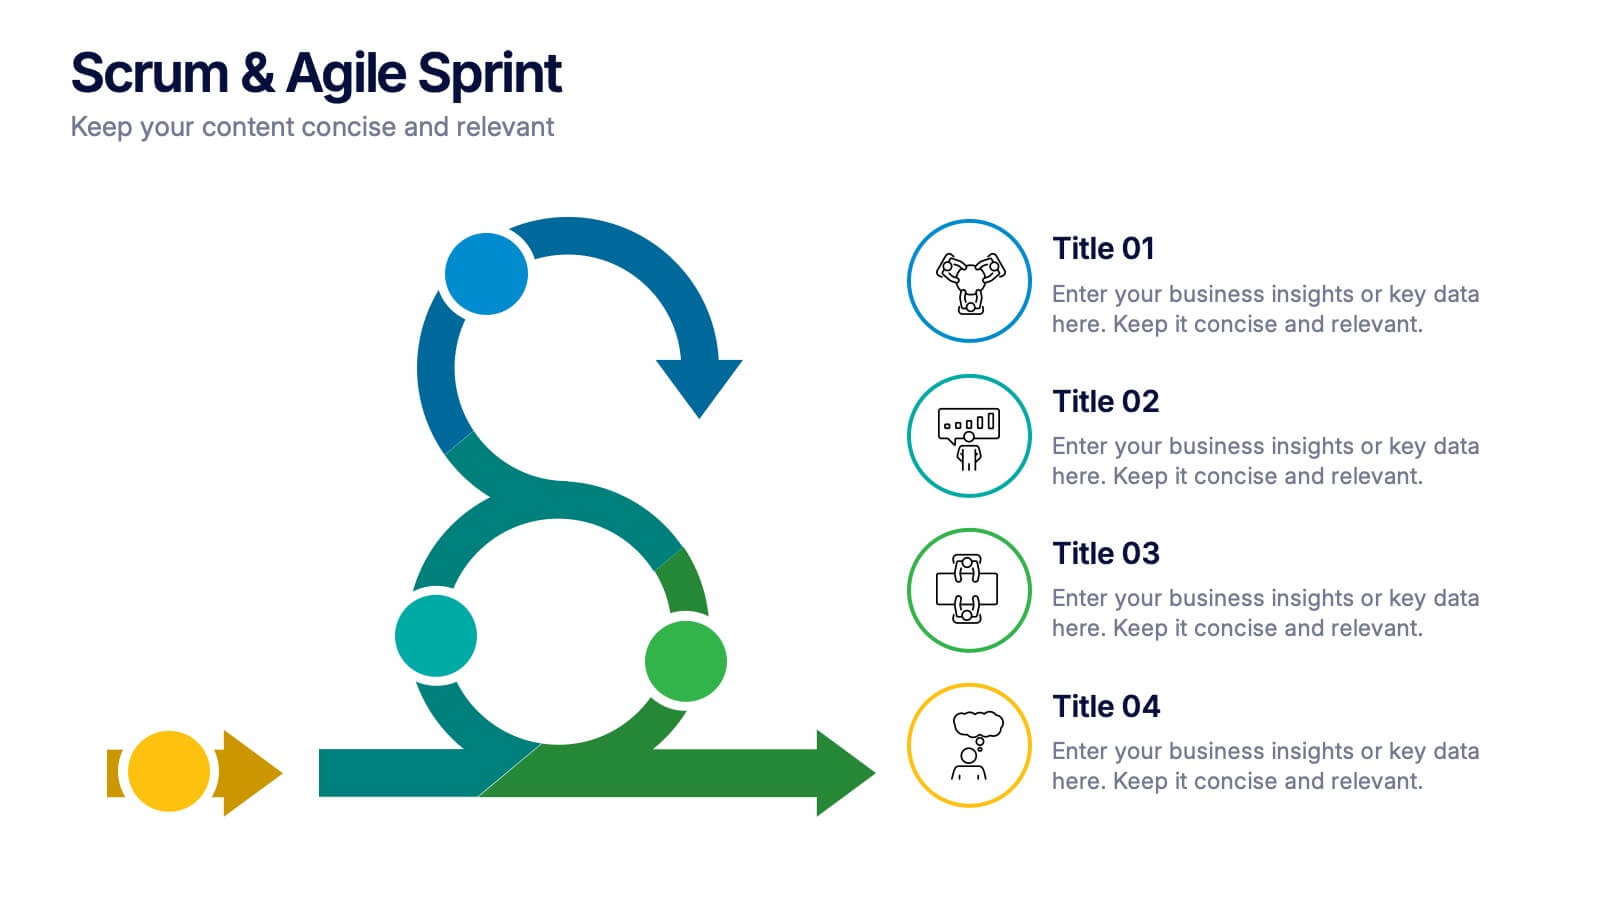
Bring movement and clarity to your workflow with a dynamic loop-and-sprint visual that makes progress feel intuitive and easy to track. This presentation helps you outline iterations, refine tasks, and communicate team priorities with confidence. Fully editable and compatible with PowerPoint, Keynote, and Google Slides.
- Remove from favorites
Powerpoint Template
1 MB
Google Slides Template
External link
Keynote Template
2 MB
6 slides
Consumer Psychology in Marketing Presentation
Unlock the secrets of customer behavior with our 'Consumer Psychology in Marketing' presentation template. Tailored for marketing professionals, this template allows you to visually dissect and present consumer insights and behaviors. Engage your audience with compelling content that's perfect for workshops or client presentations, compatible with PowerPoint, Keynote, and Google Slides.


