


Features
- 4 Unique slides
- Fully editable and easy to edit in Microsoft Powerpoint, Keynote and Google Slides
- 16:9 widescreen layout
- Clean and professional designs
- Export to JPG, PDF or send by email


Do you have any questions?
Recommend


6 slides
Pathway and Options Framework Analysis Presentation
Navigate your business strategy with clarity using the Pathway and Options Framework Analysis Presentation. This slide features a horizontal hexagon progression that visually maps out five distinct stages or decision points. Ideal for illustrating phased development, strategic alternatives, or milestone-based planning. Each segment includes an icon and customizable title area for key data points. Use this clean, modern layout to engage stakeholders or clarify complex processes. Fully editable in PowerPoint, Keynote, and Google Slides.

20 slides
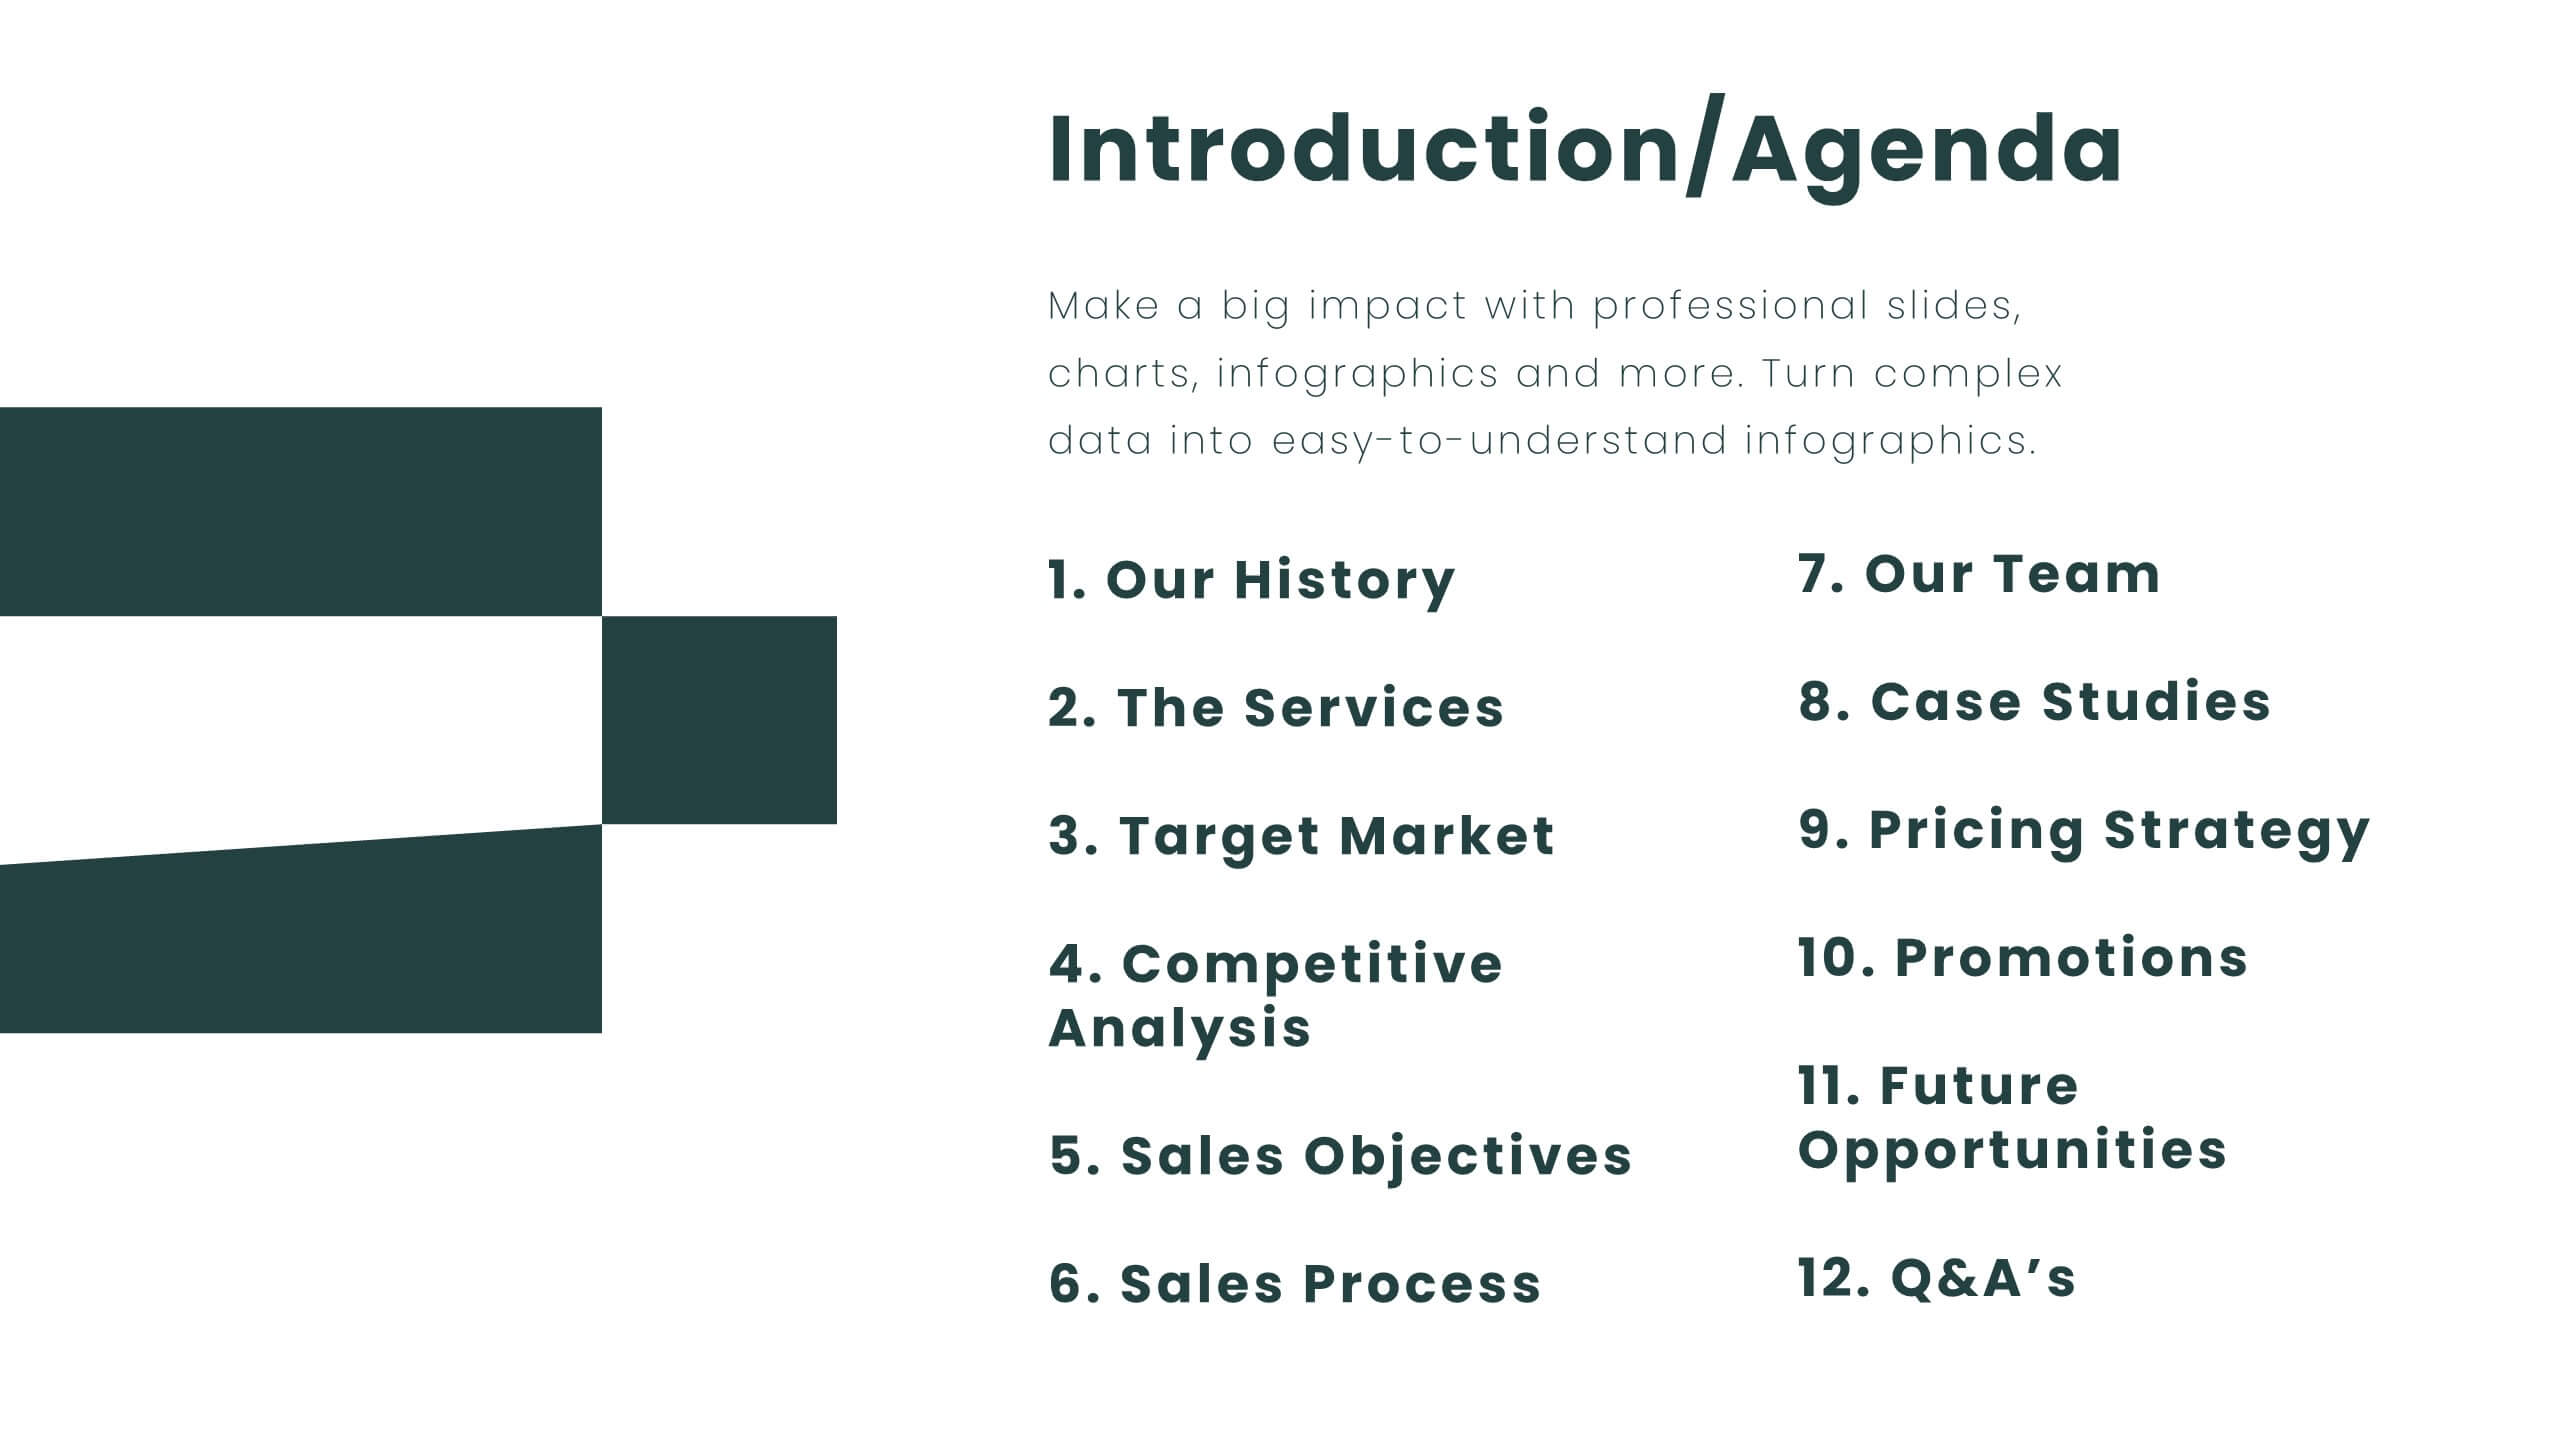
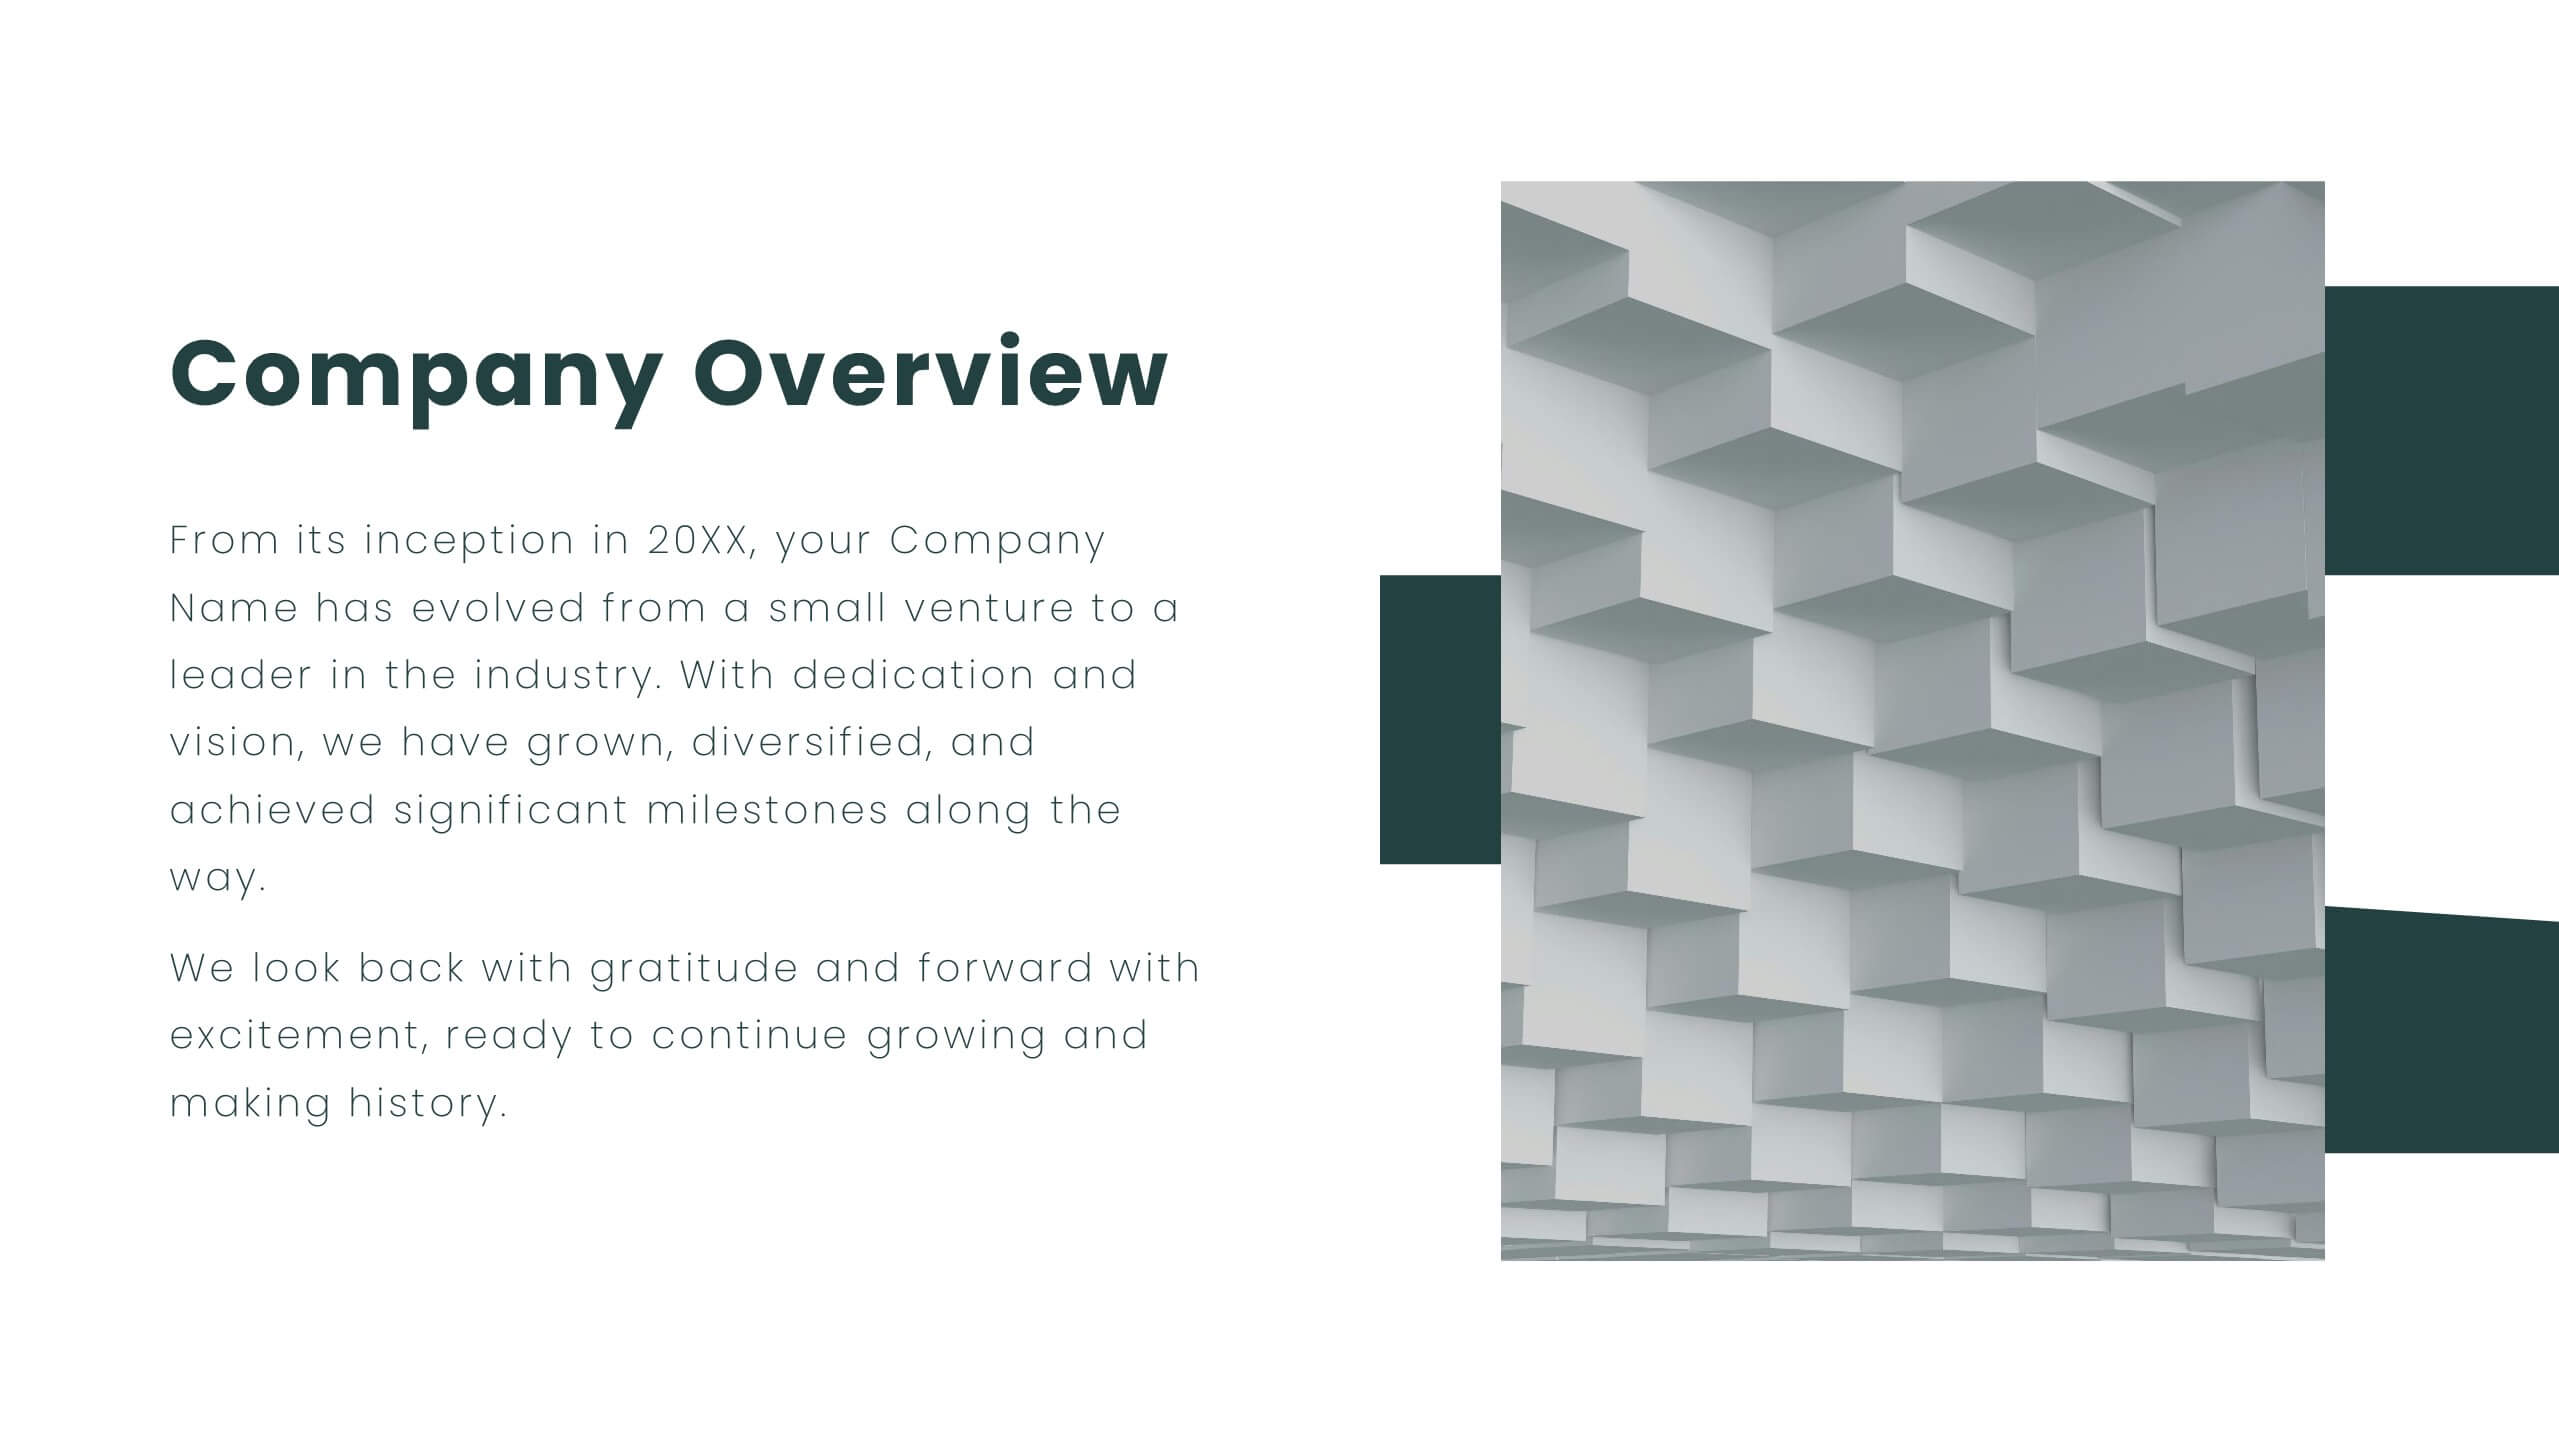
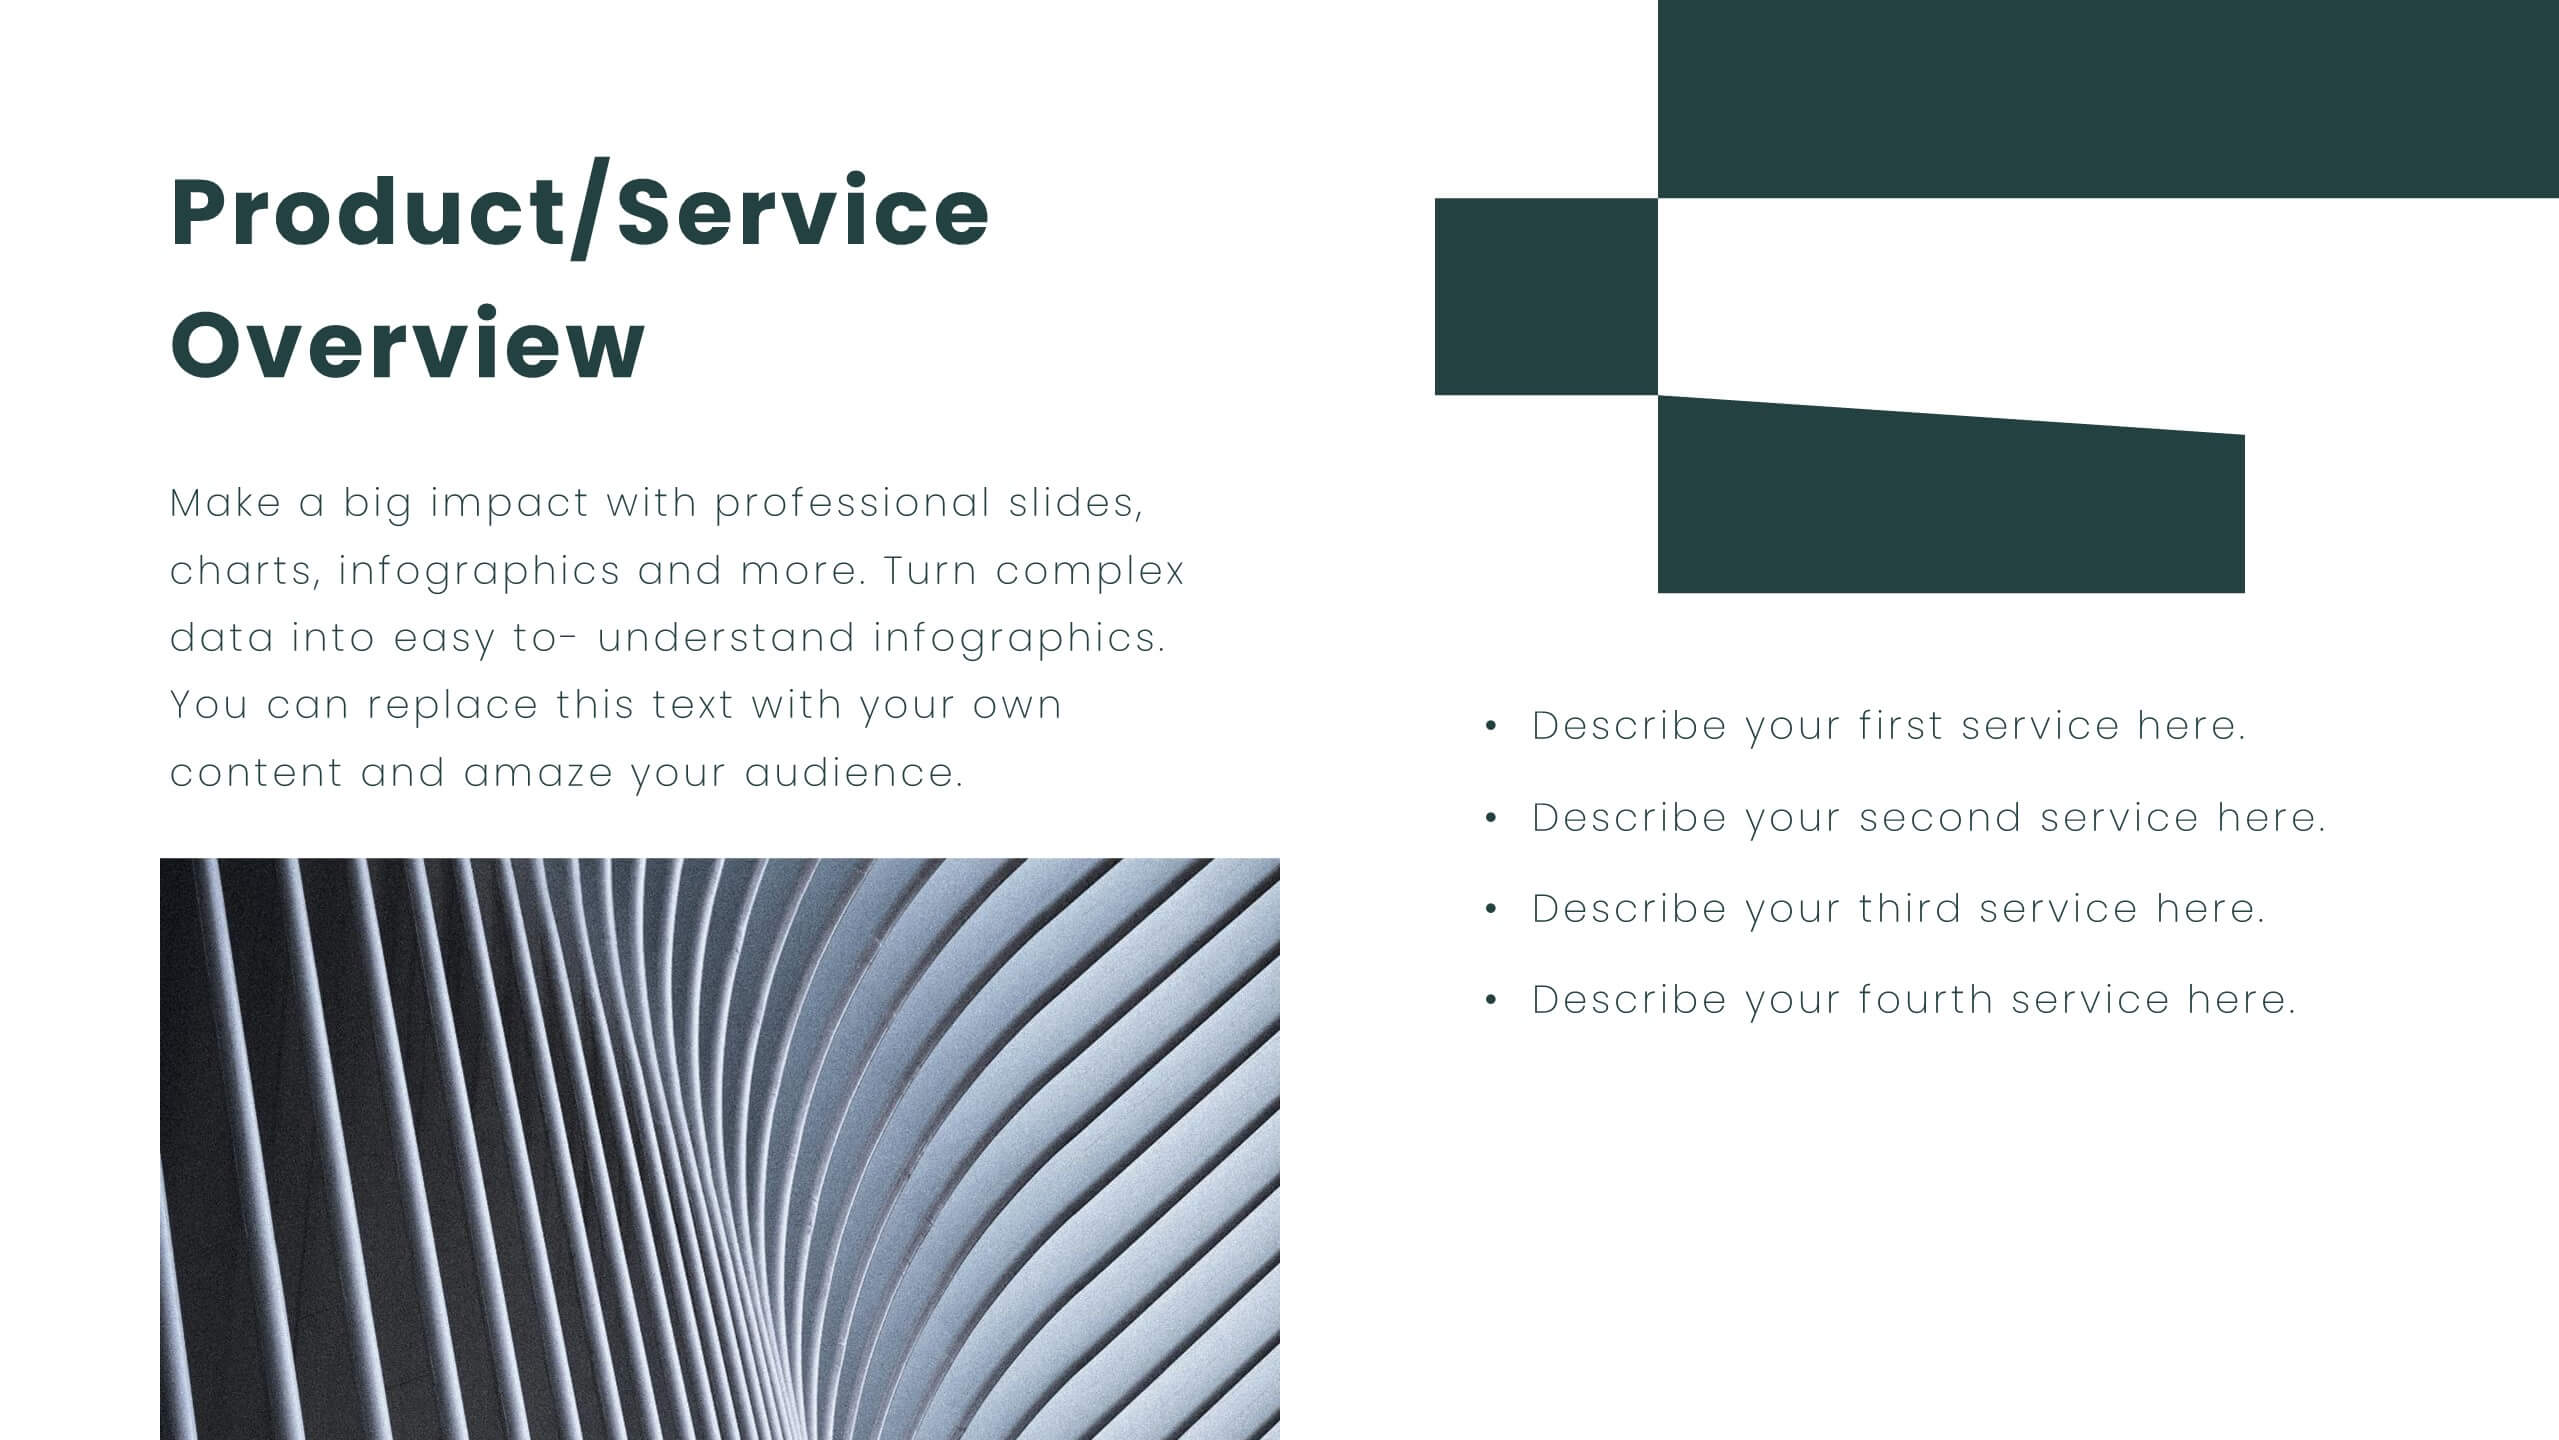
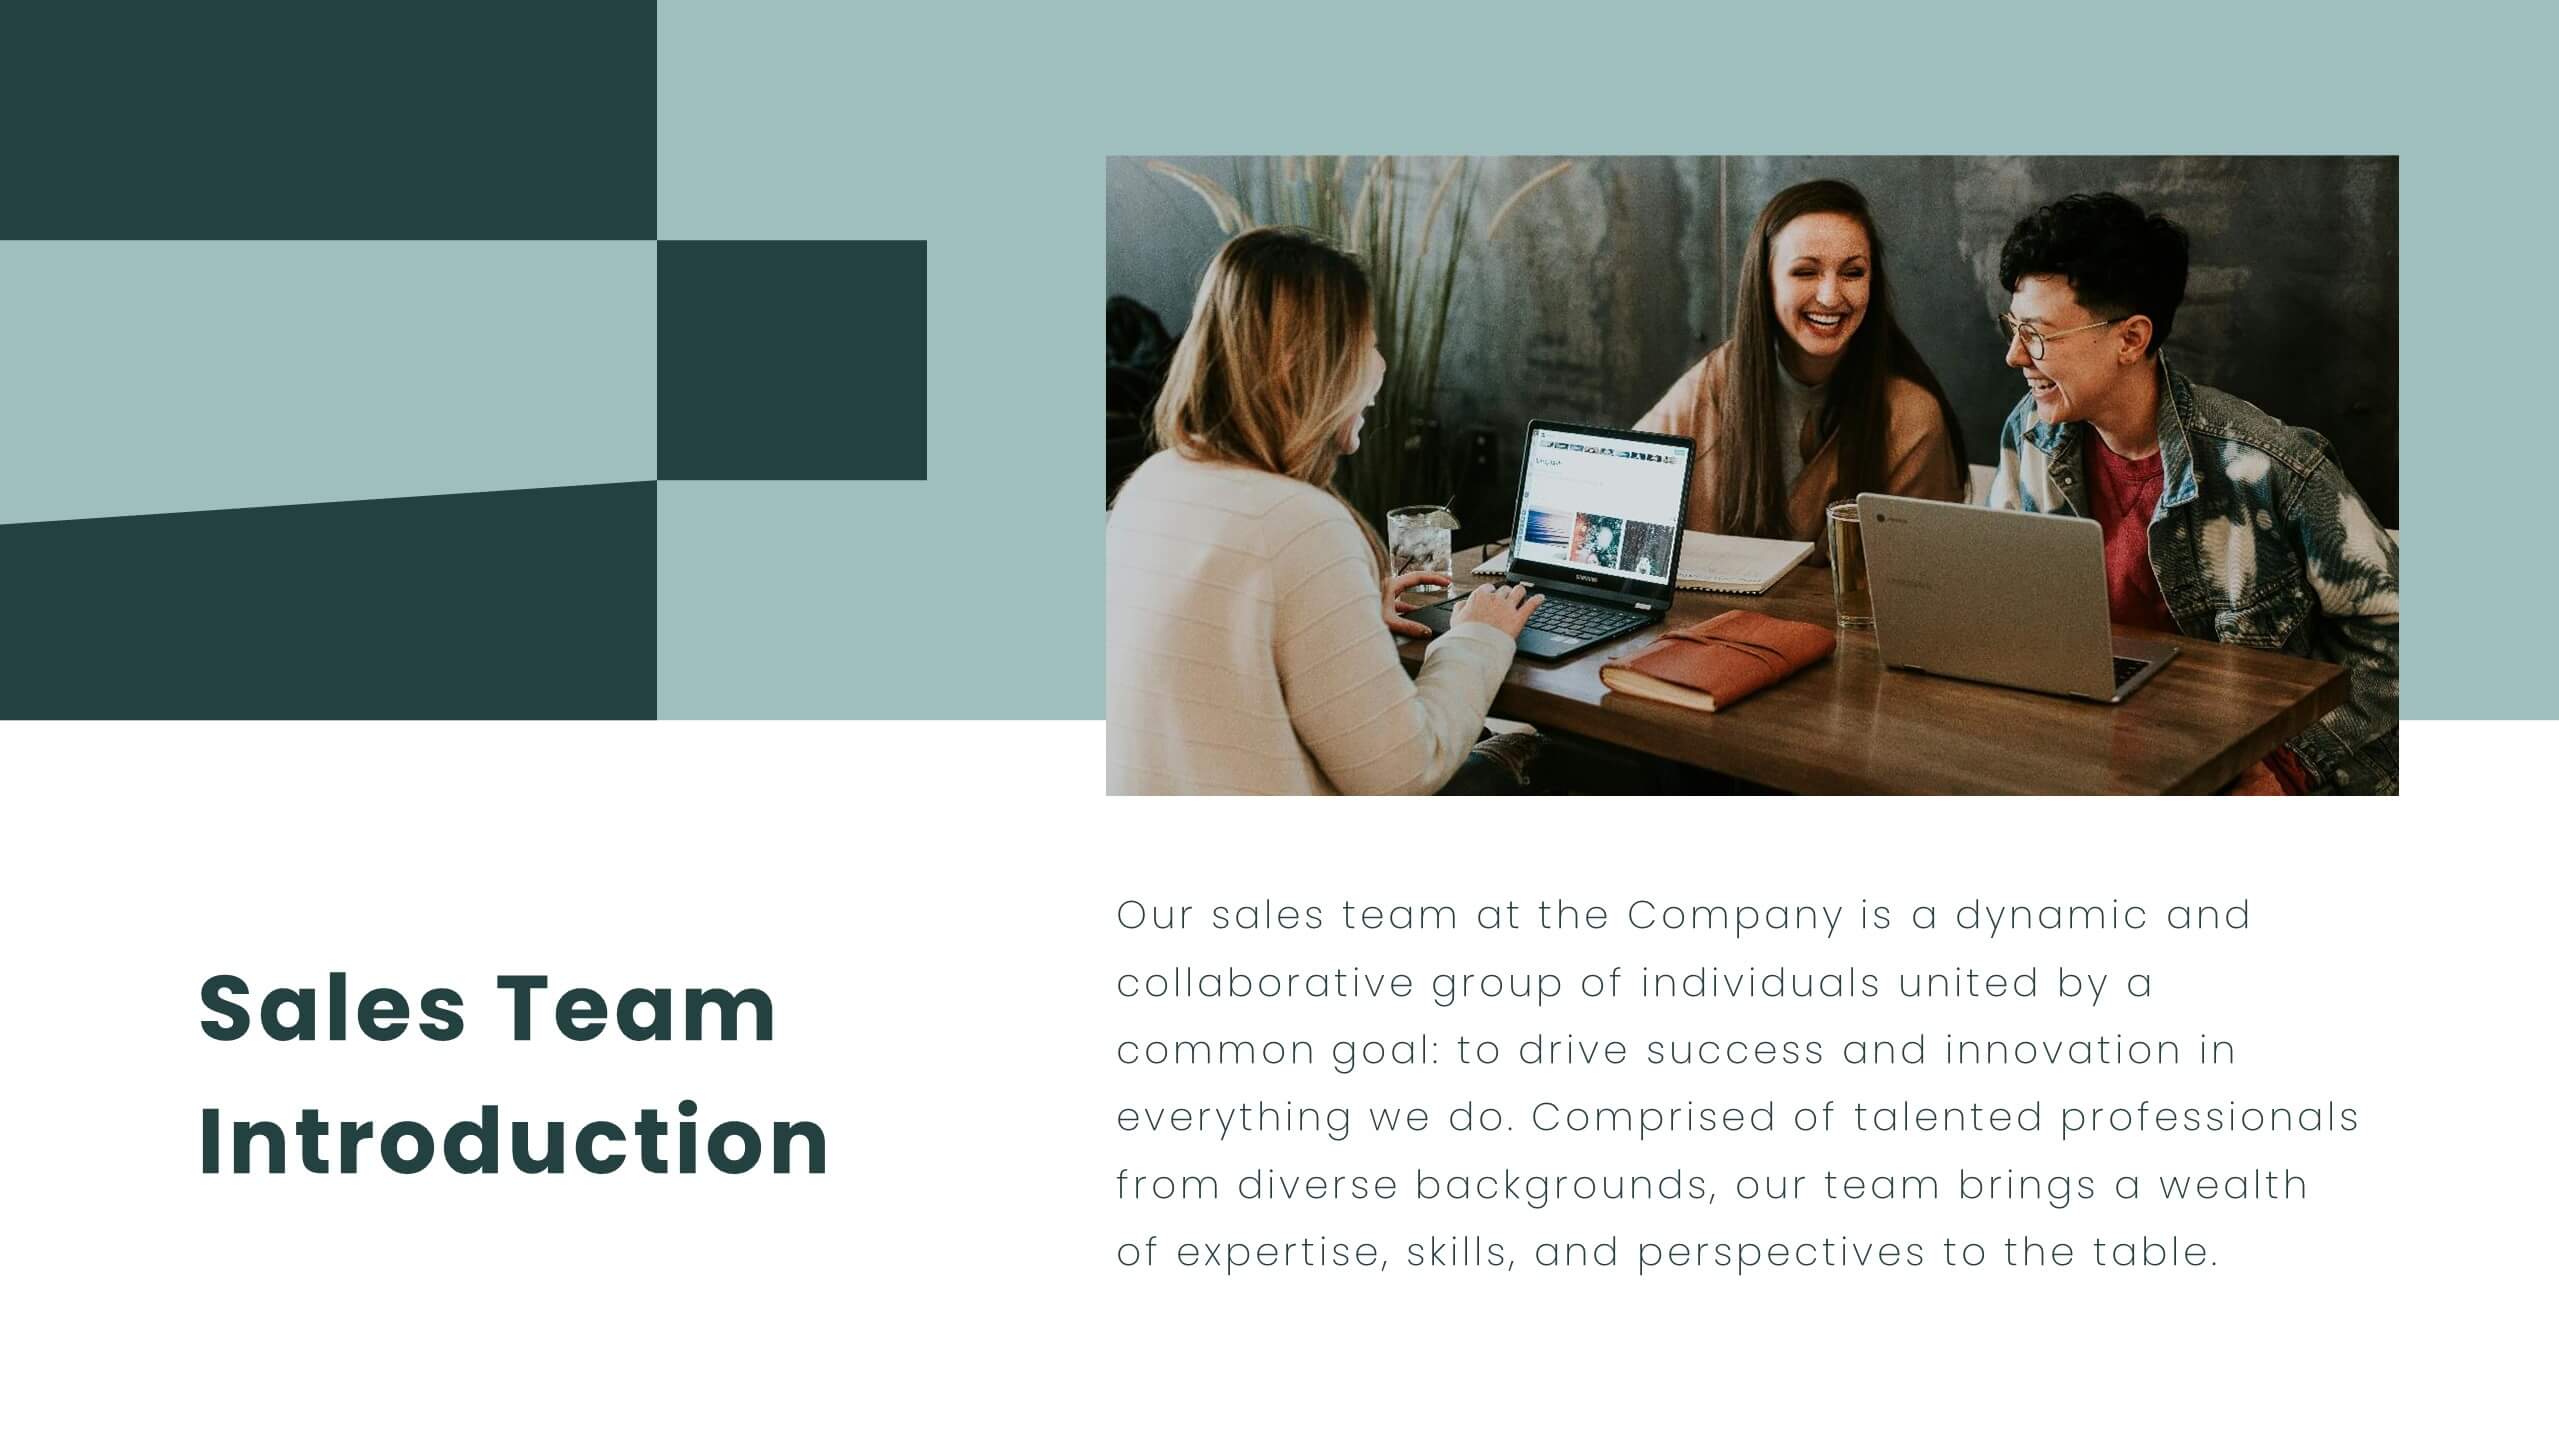
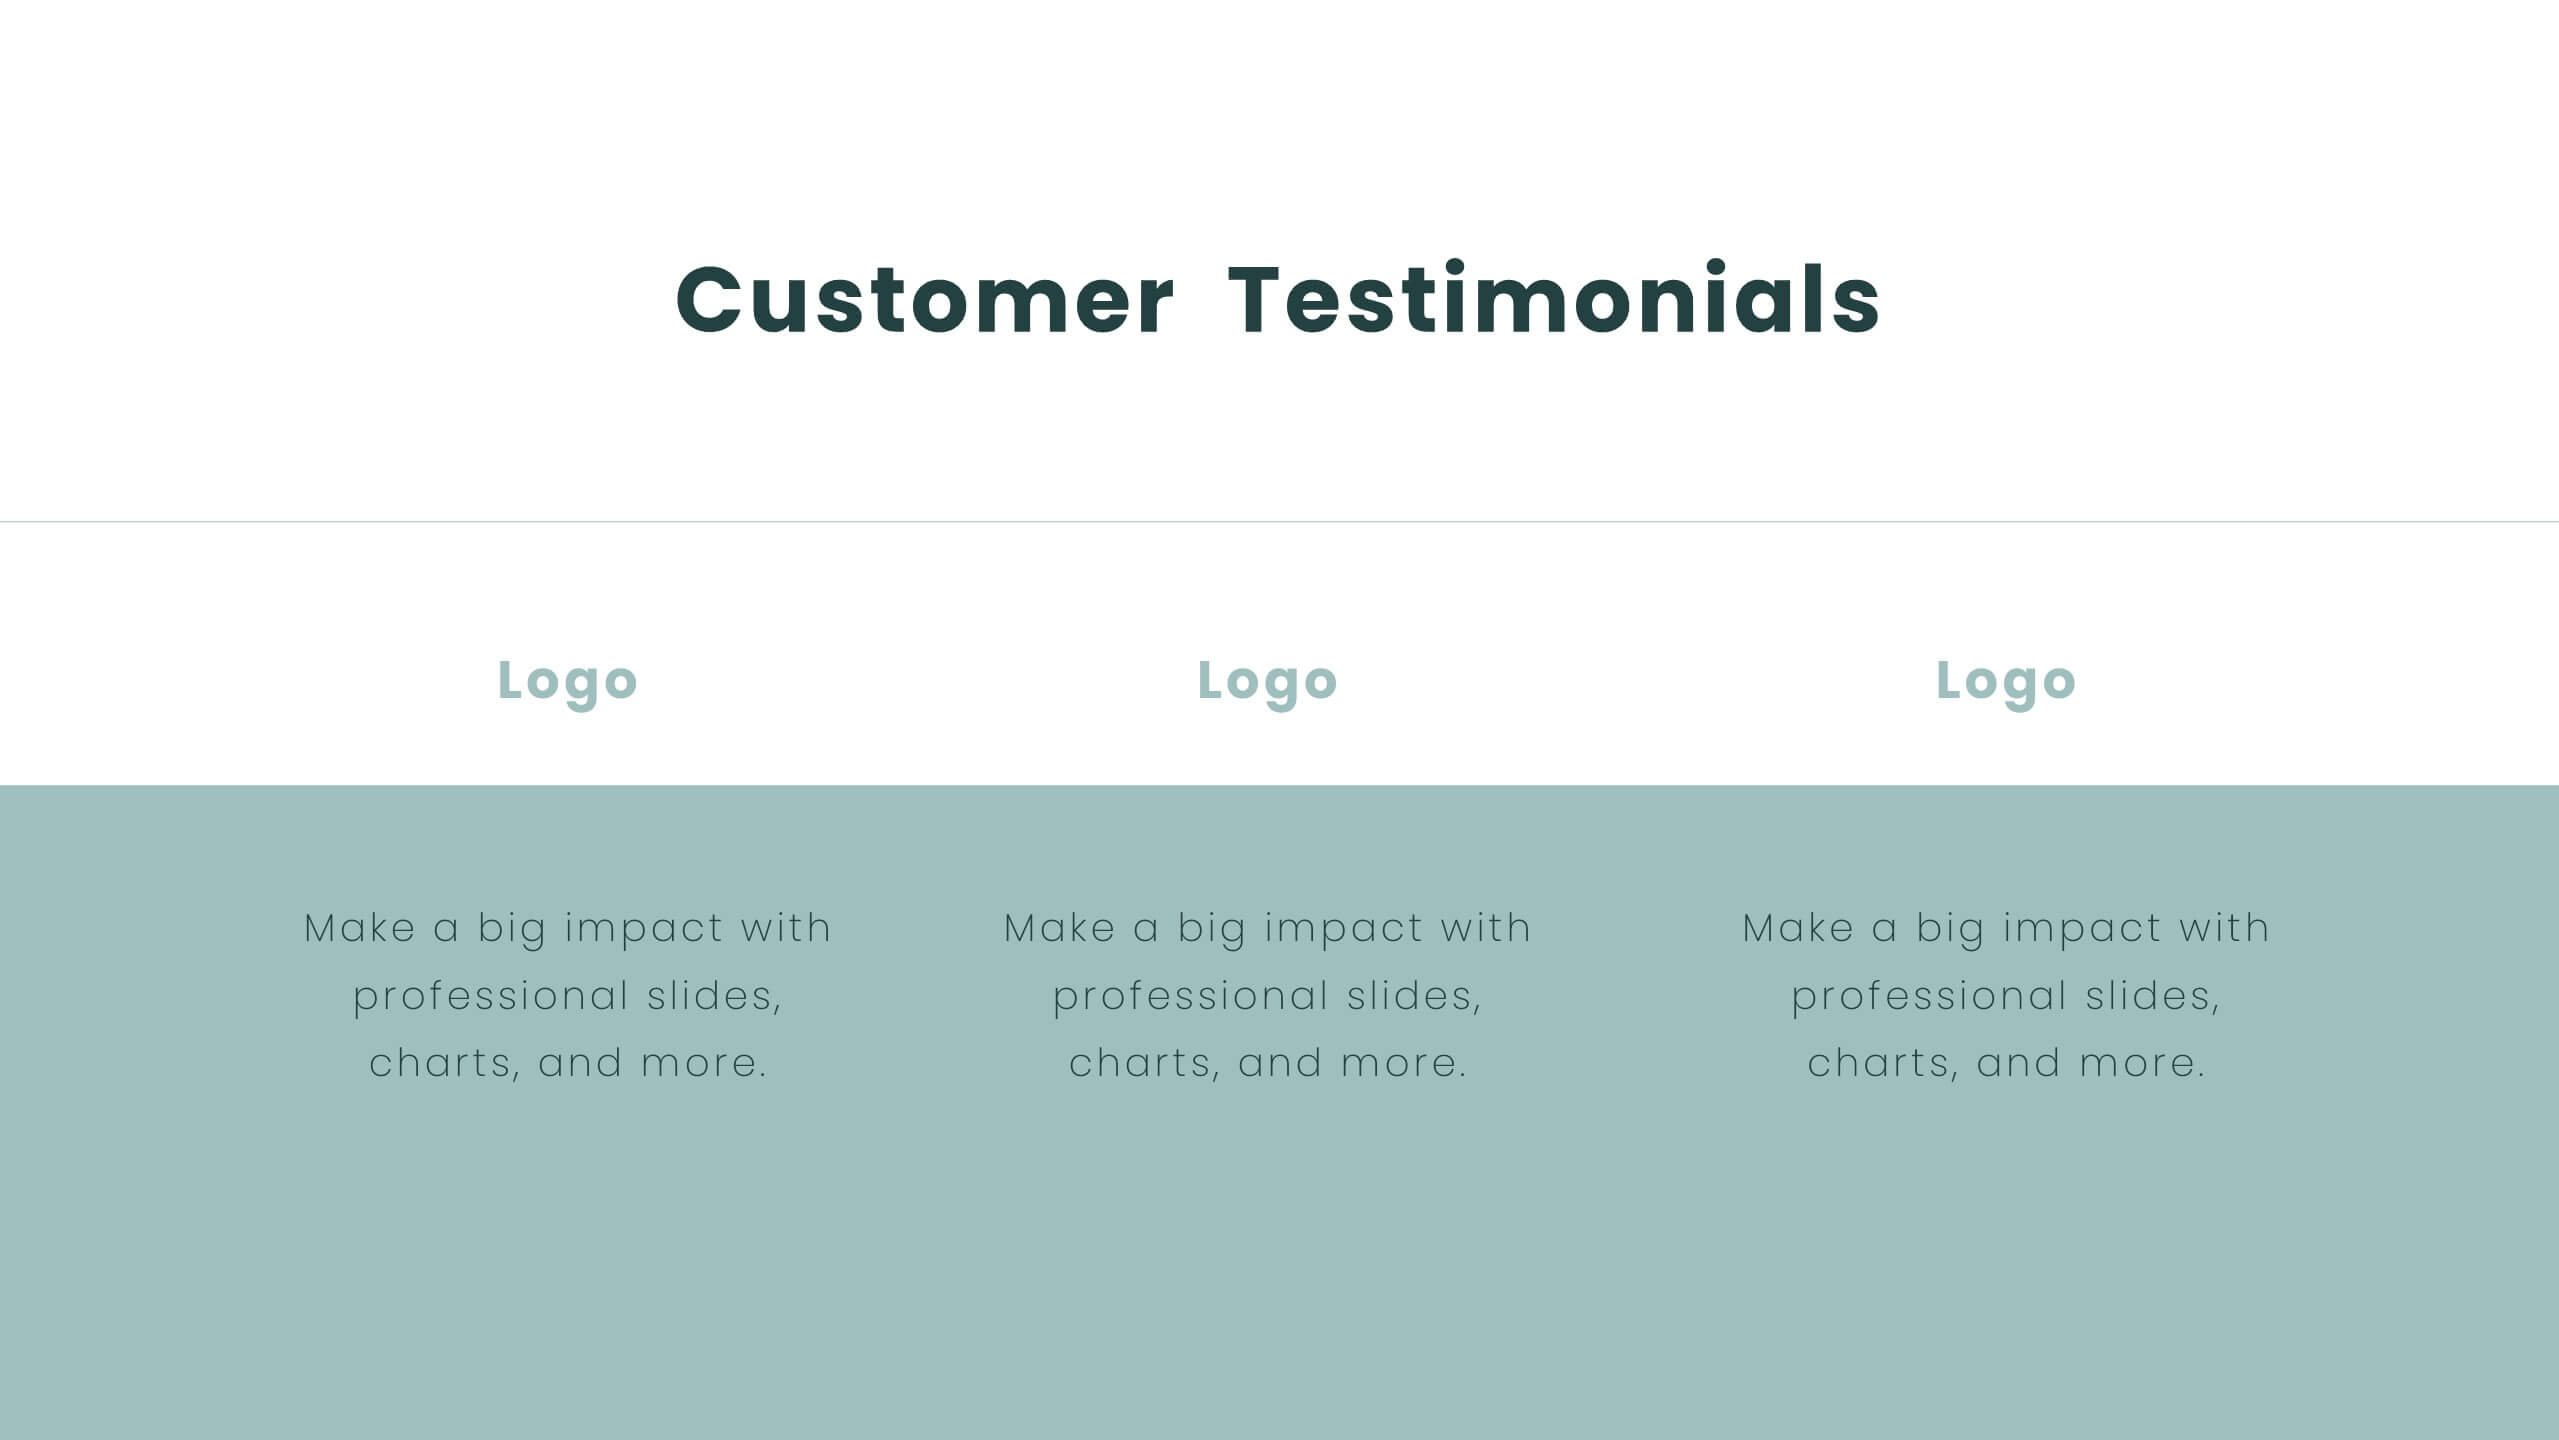
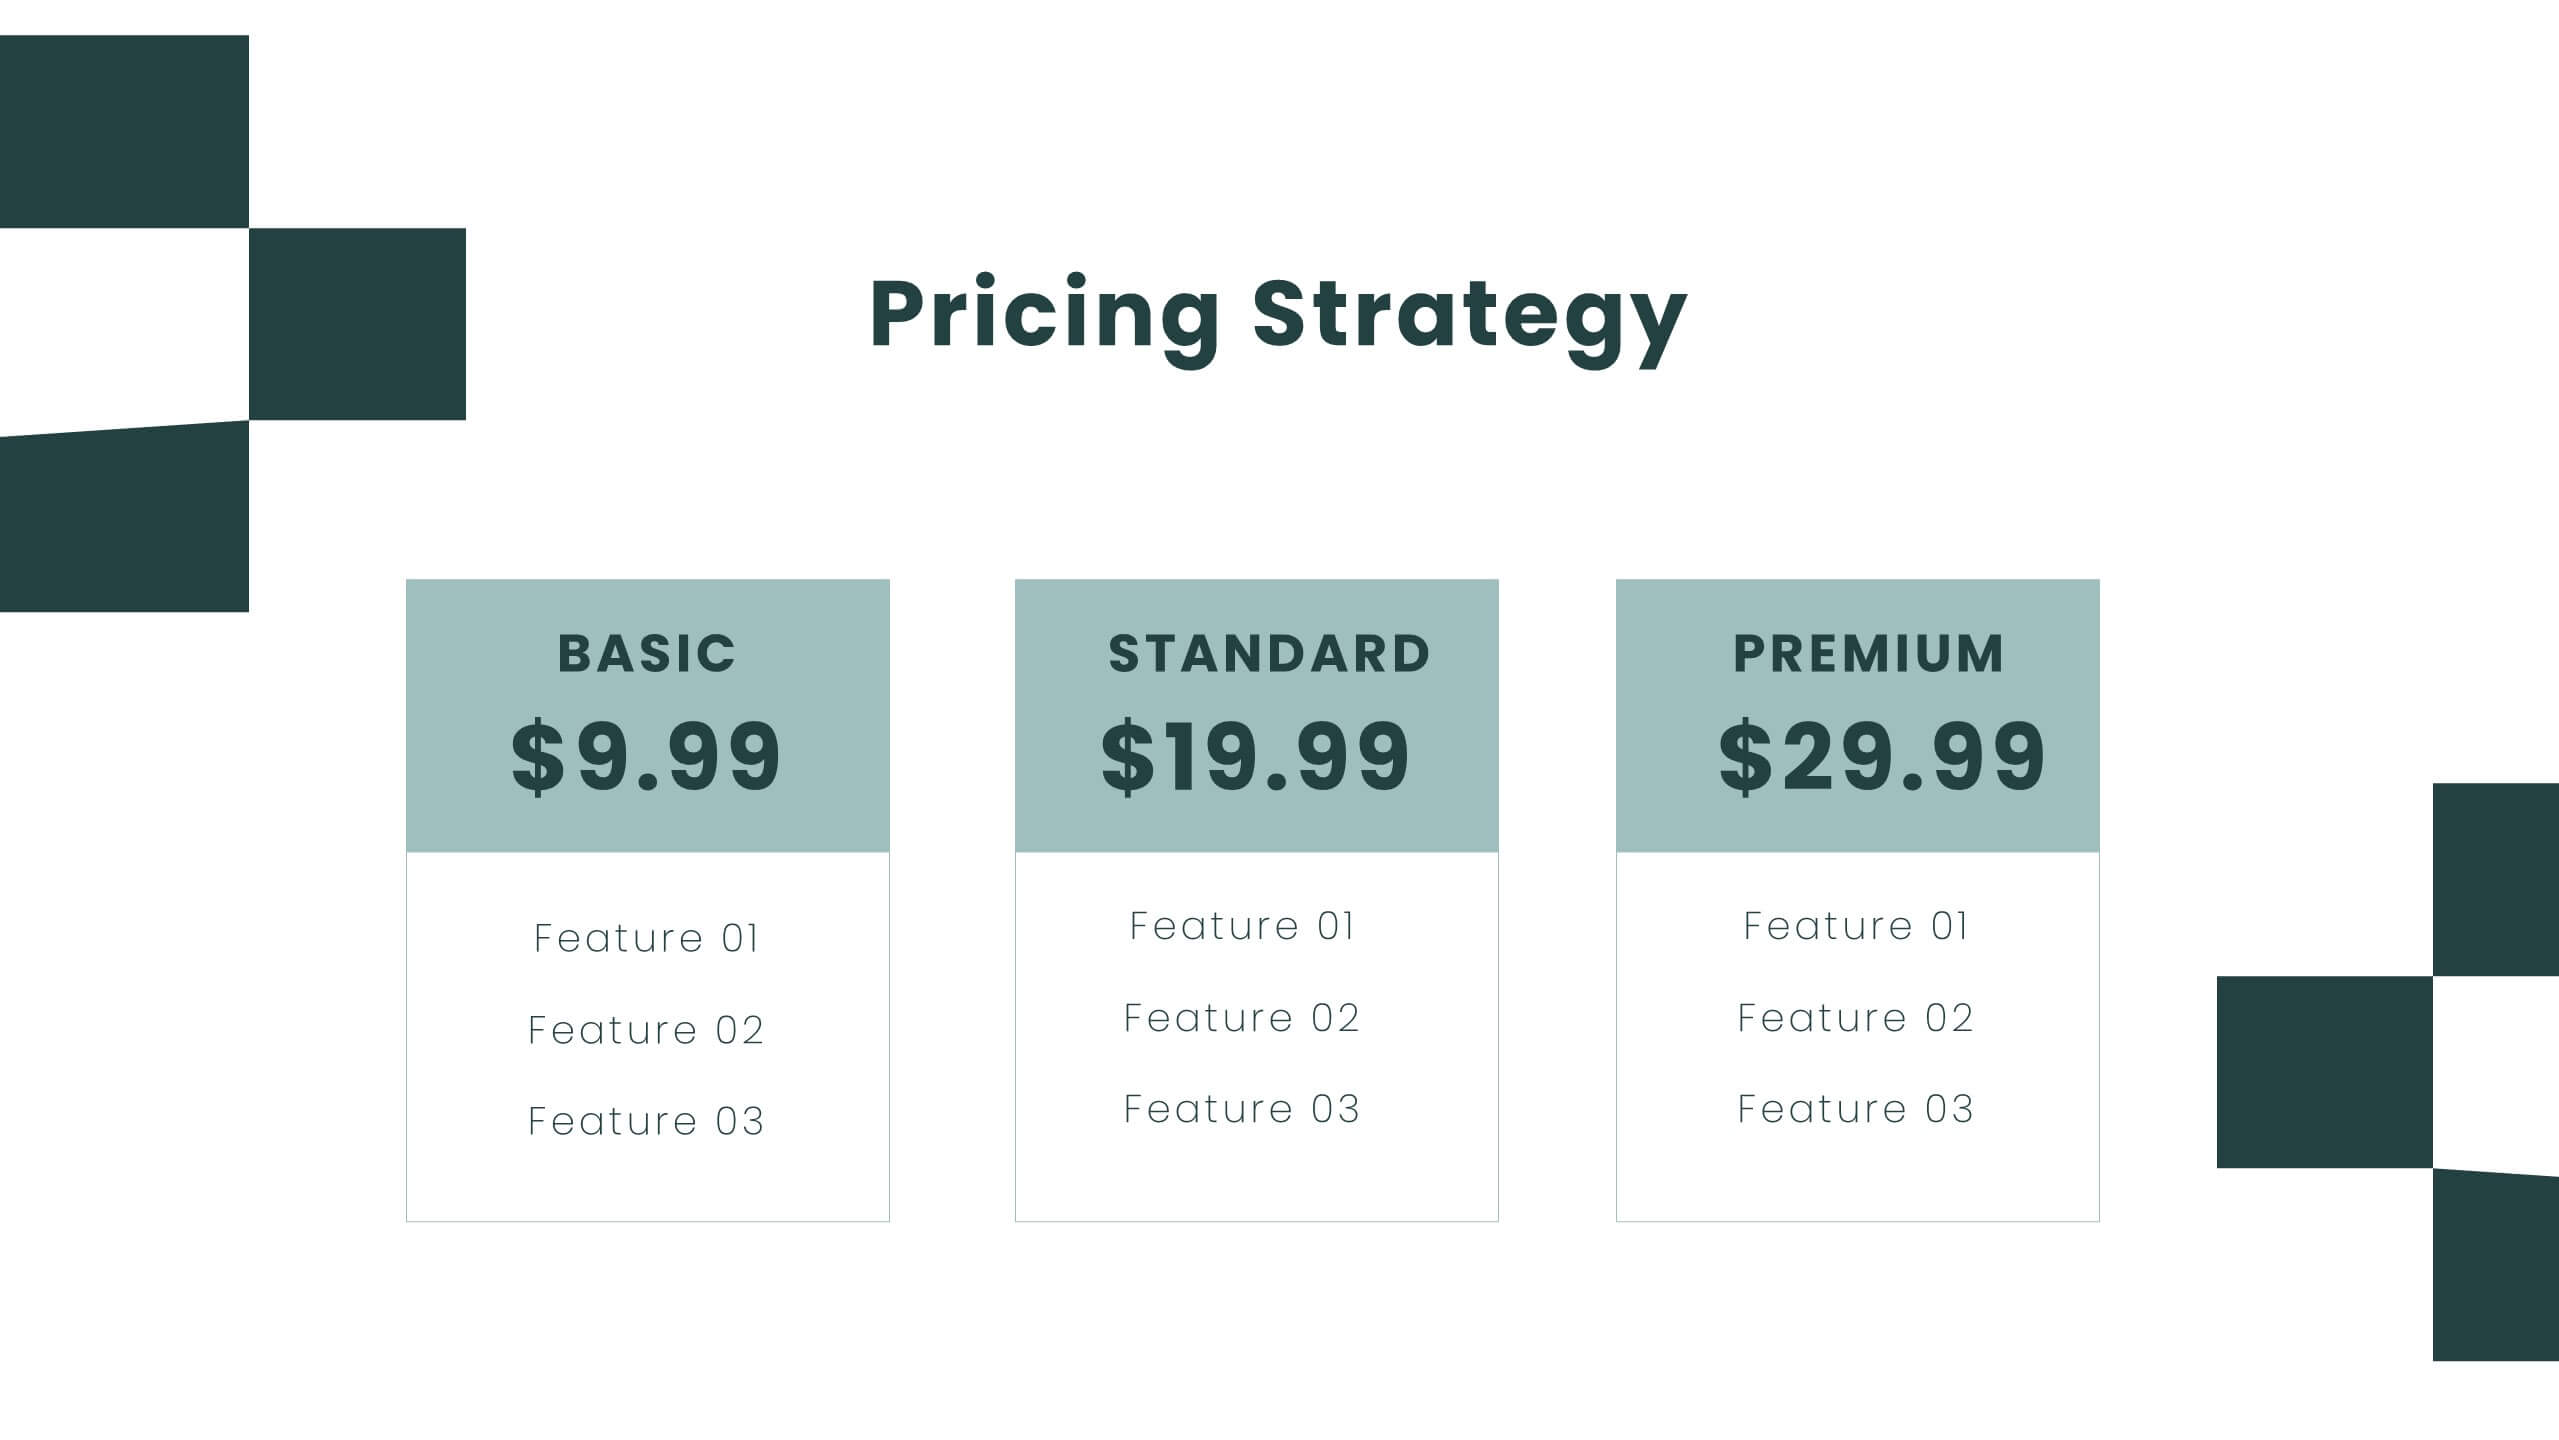
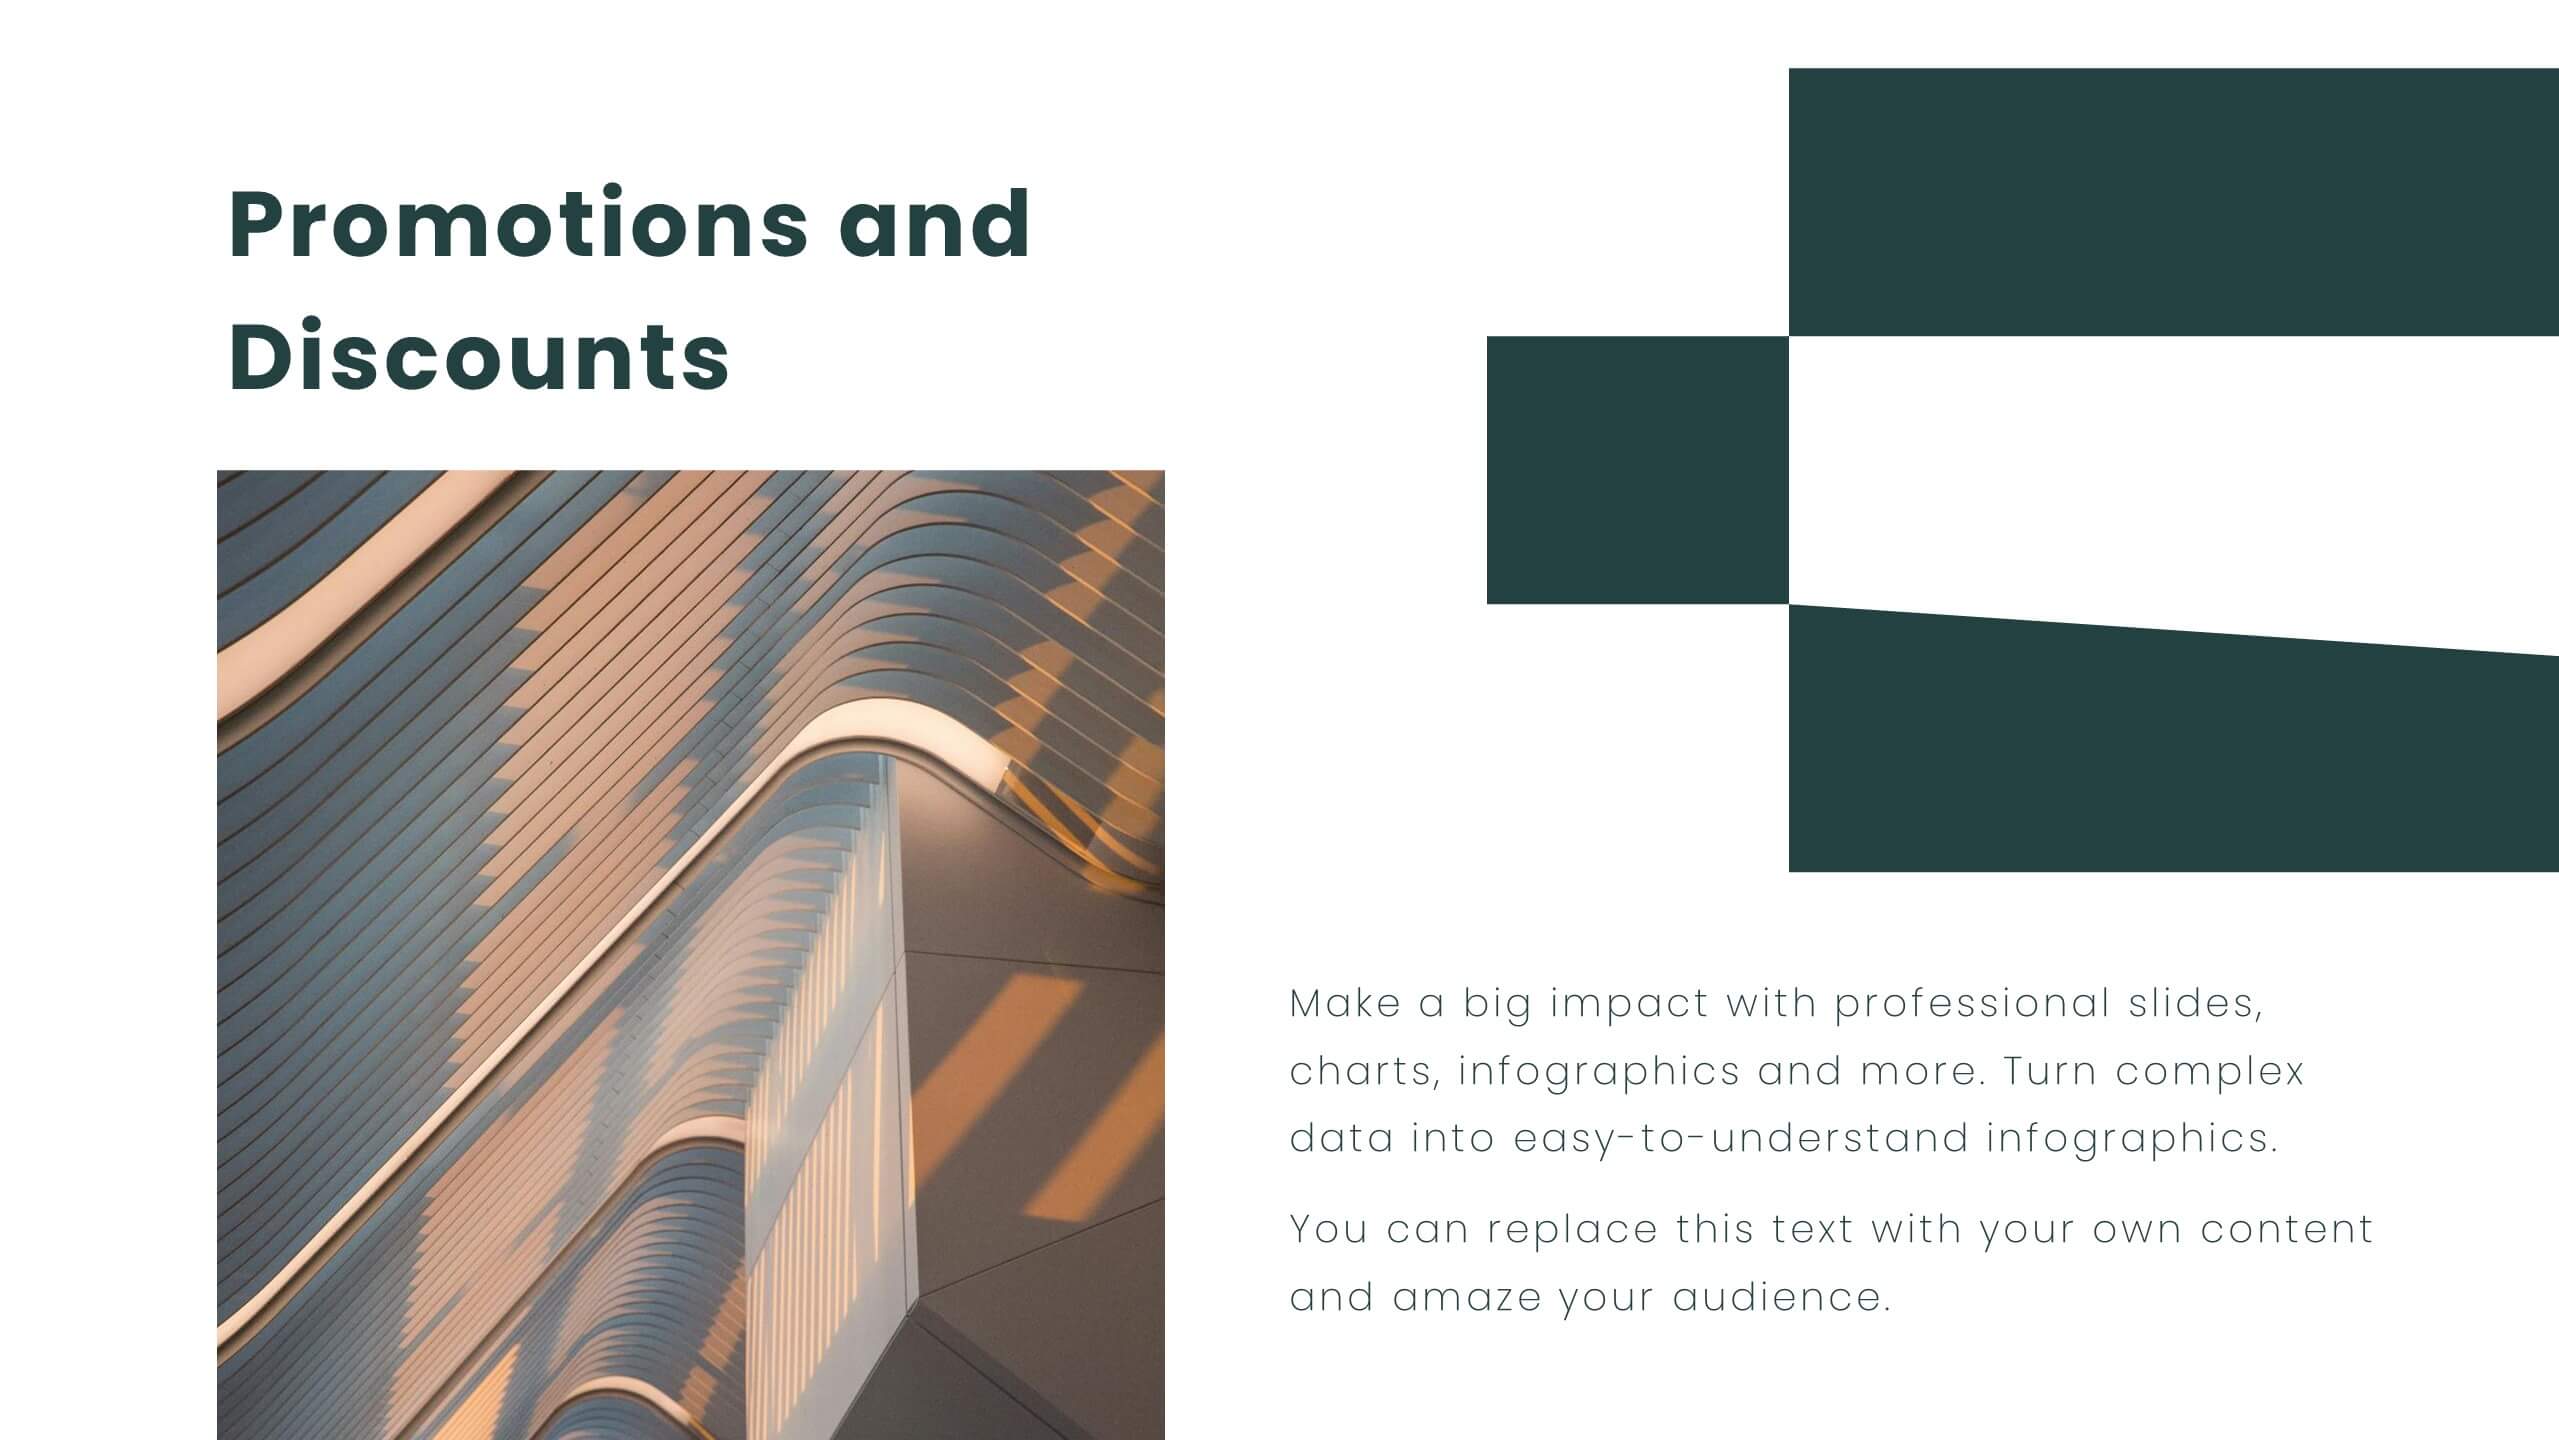
Radiant Sales Proposal Presentation
Elevate your pitch with this polished sales proposal template! Perfect for presenting company overviews, product/service details, and pricing strategies, it includes slides for competitive analysis and customer testimonials. Impress your audience with clear visuals and structured content. Compatible with PowerPoint, Keynote, and Google Slides for seamless presentations on any platform.


20 slides
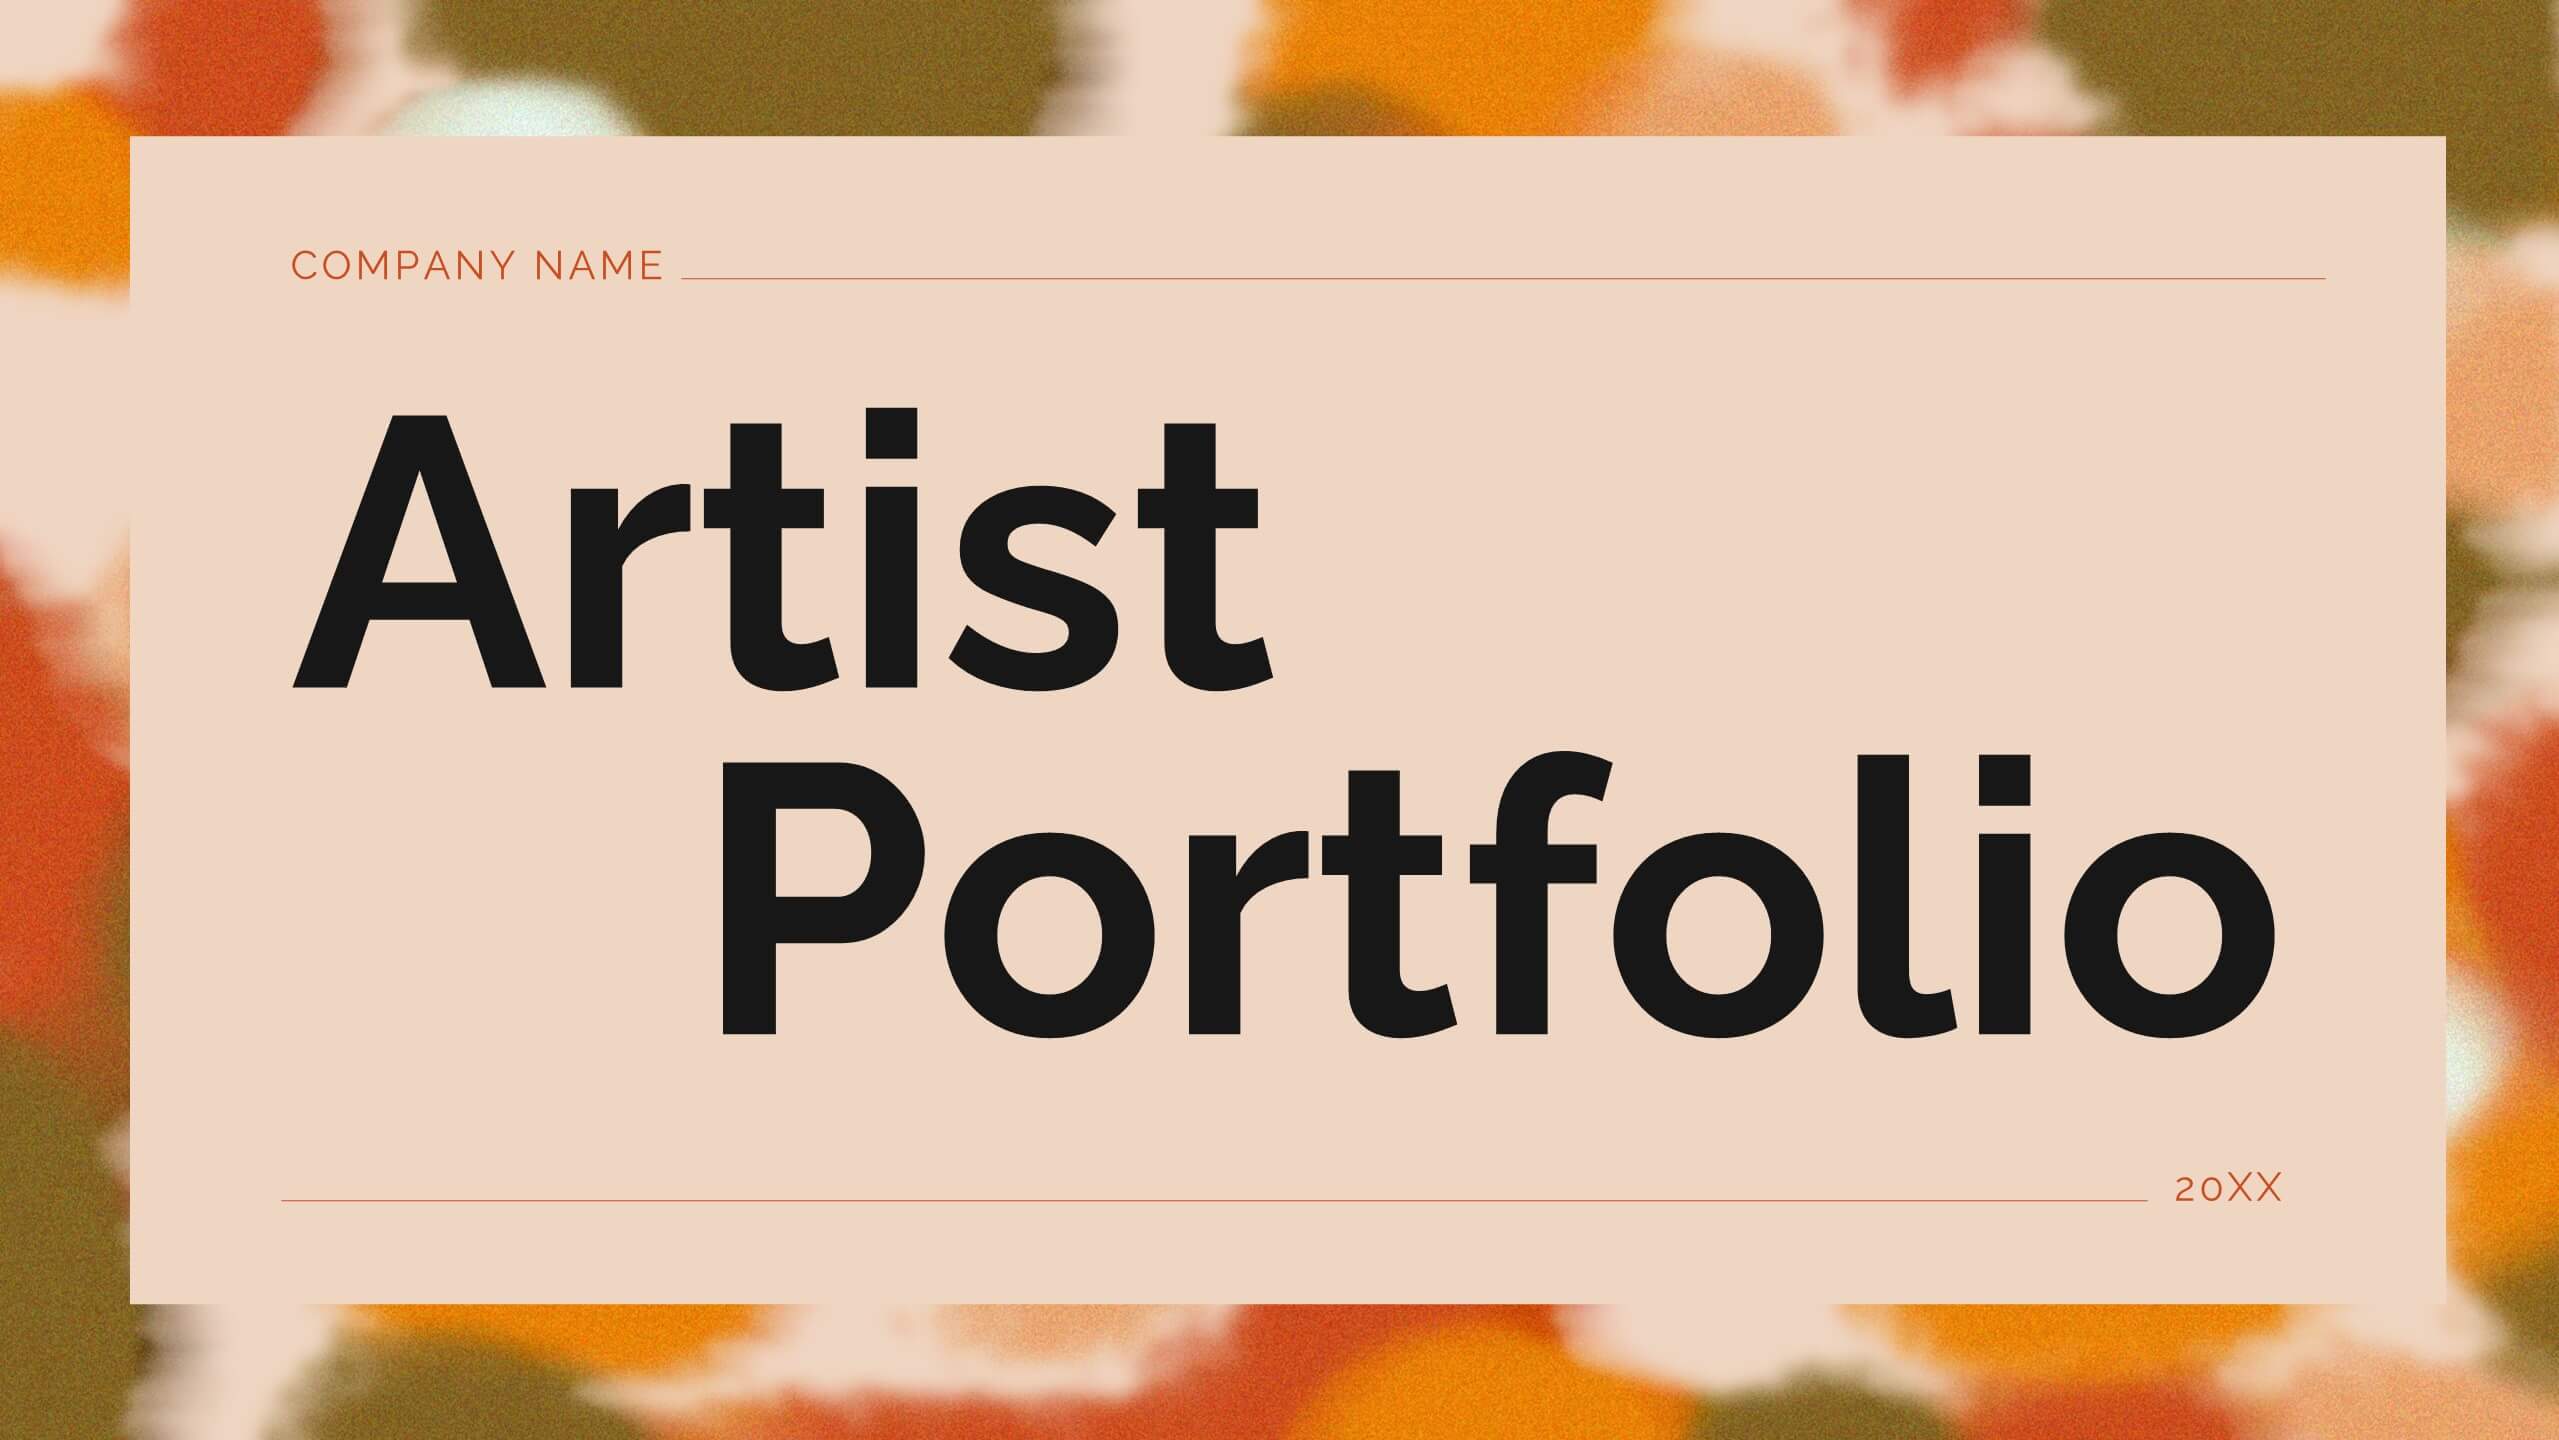
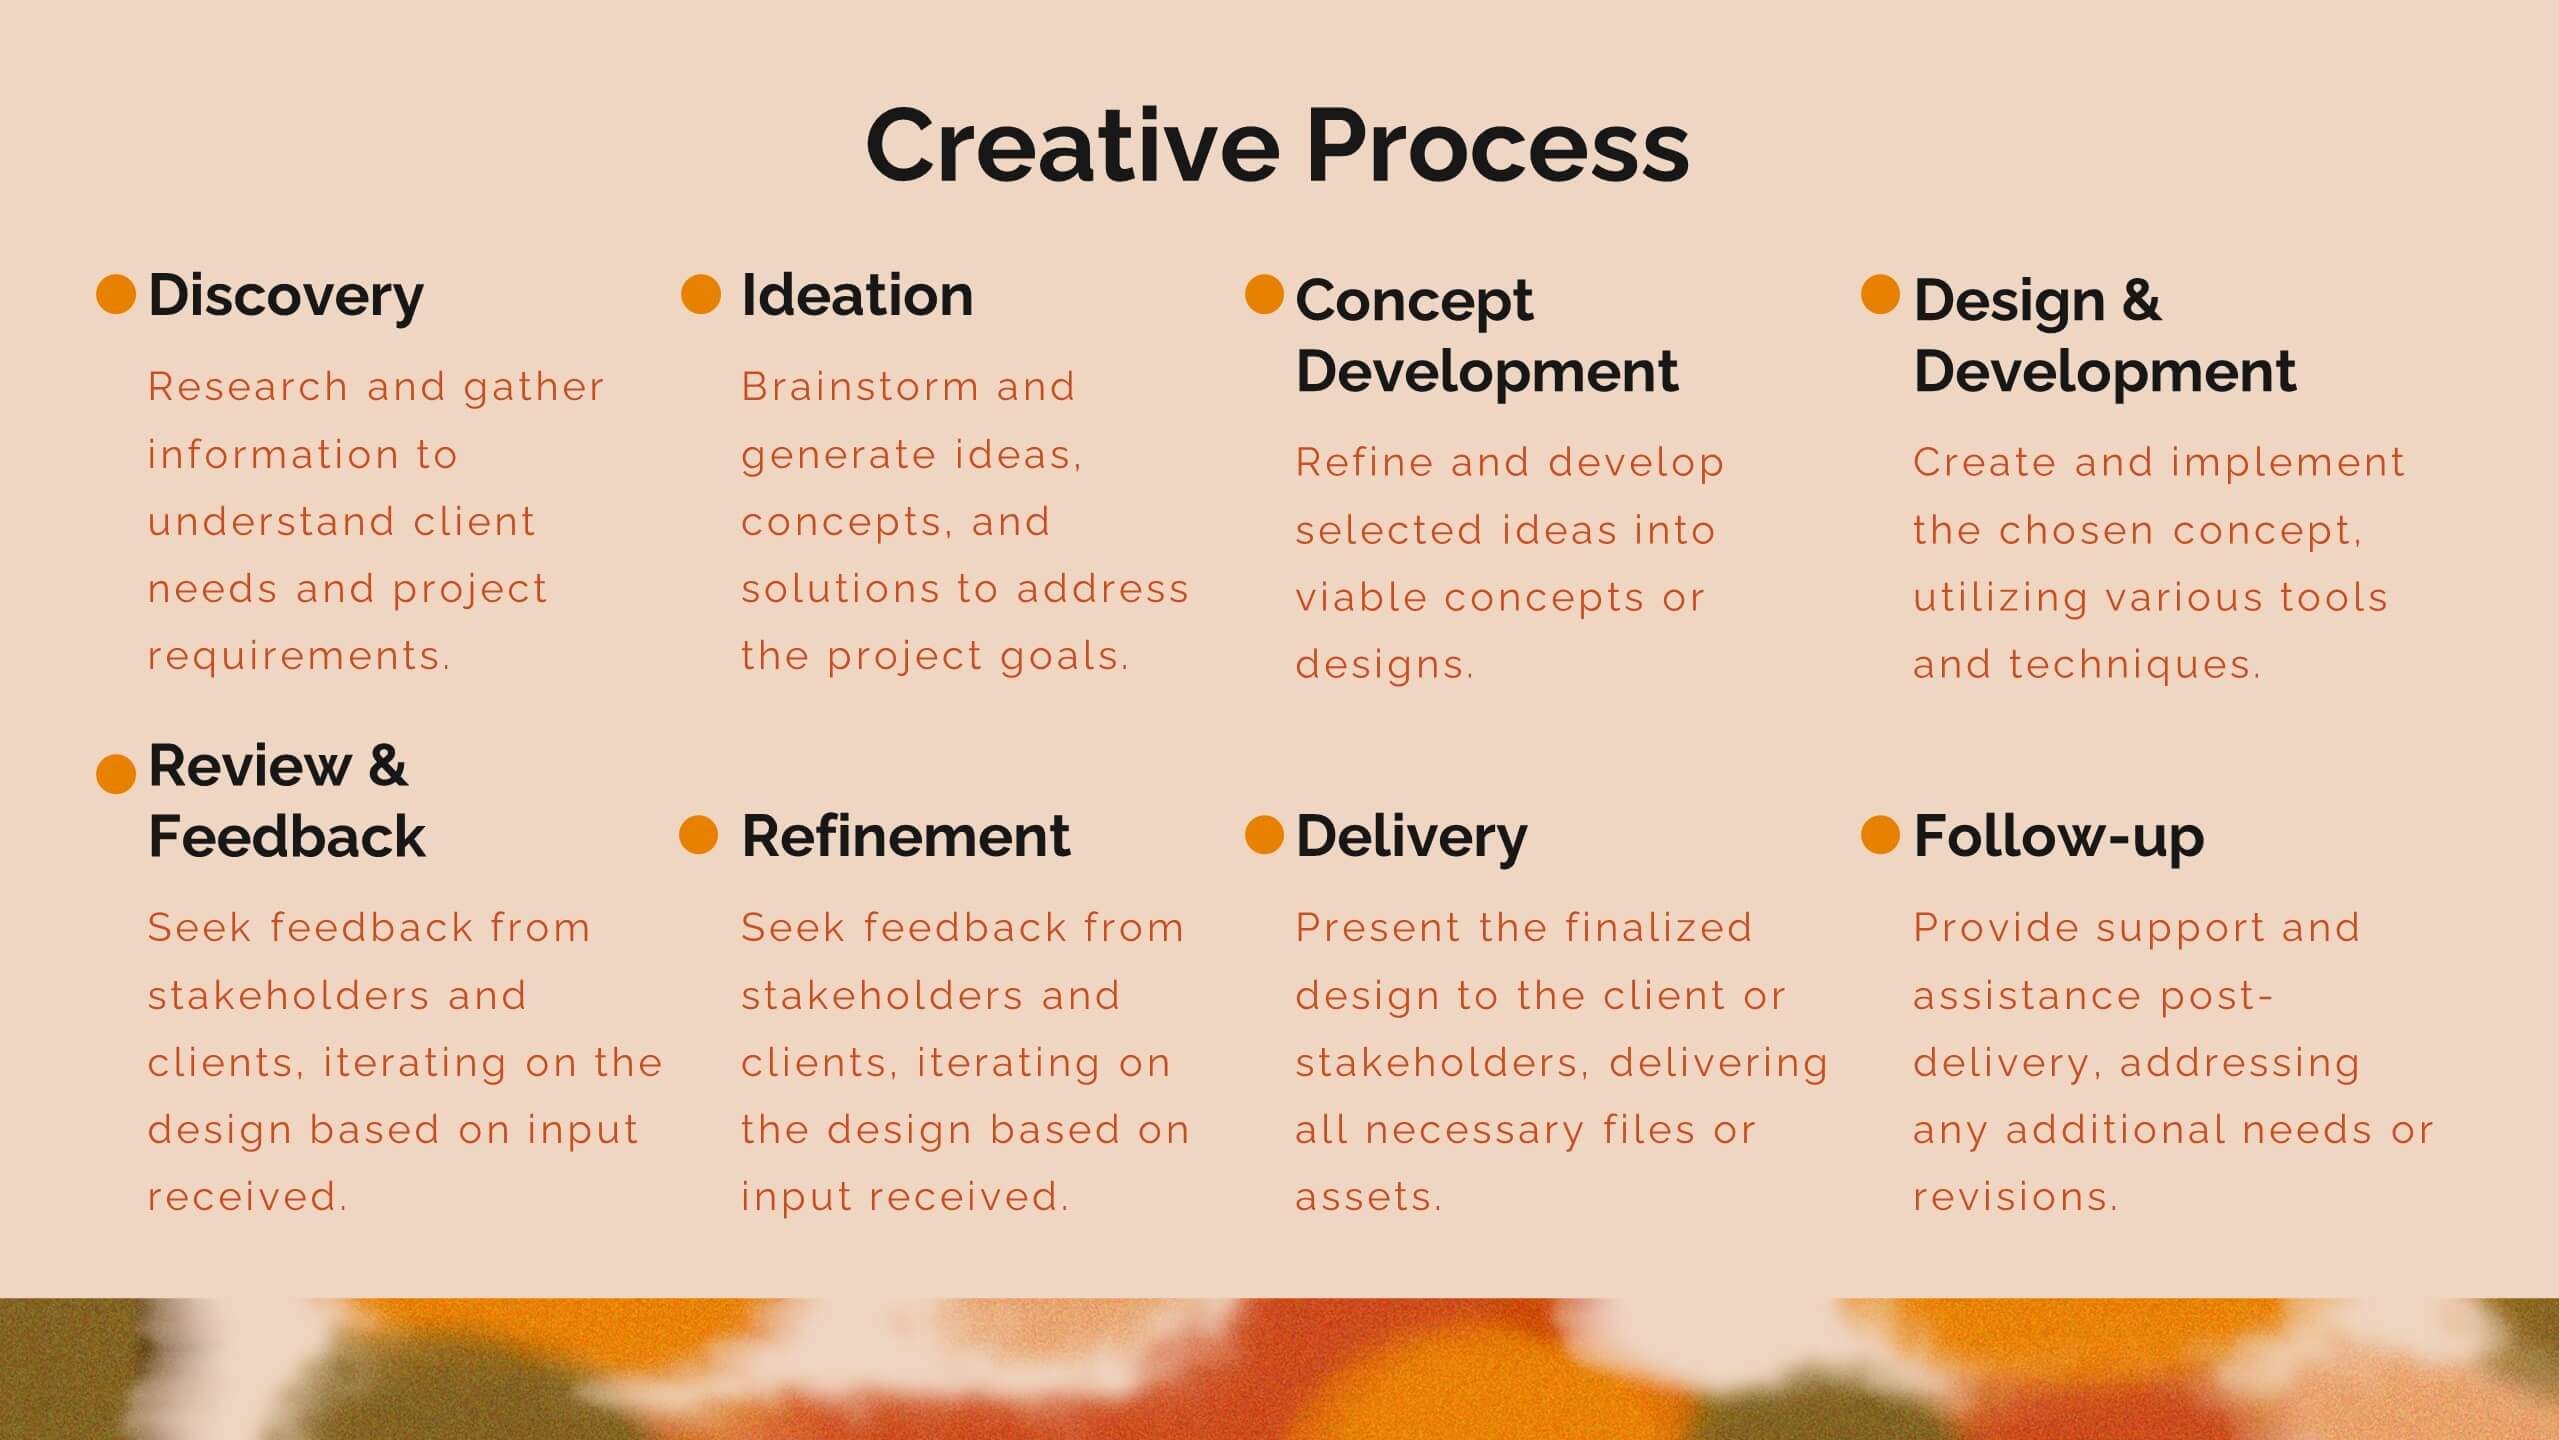
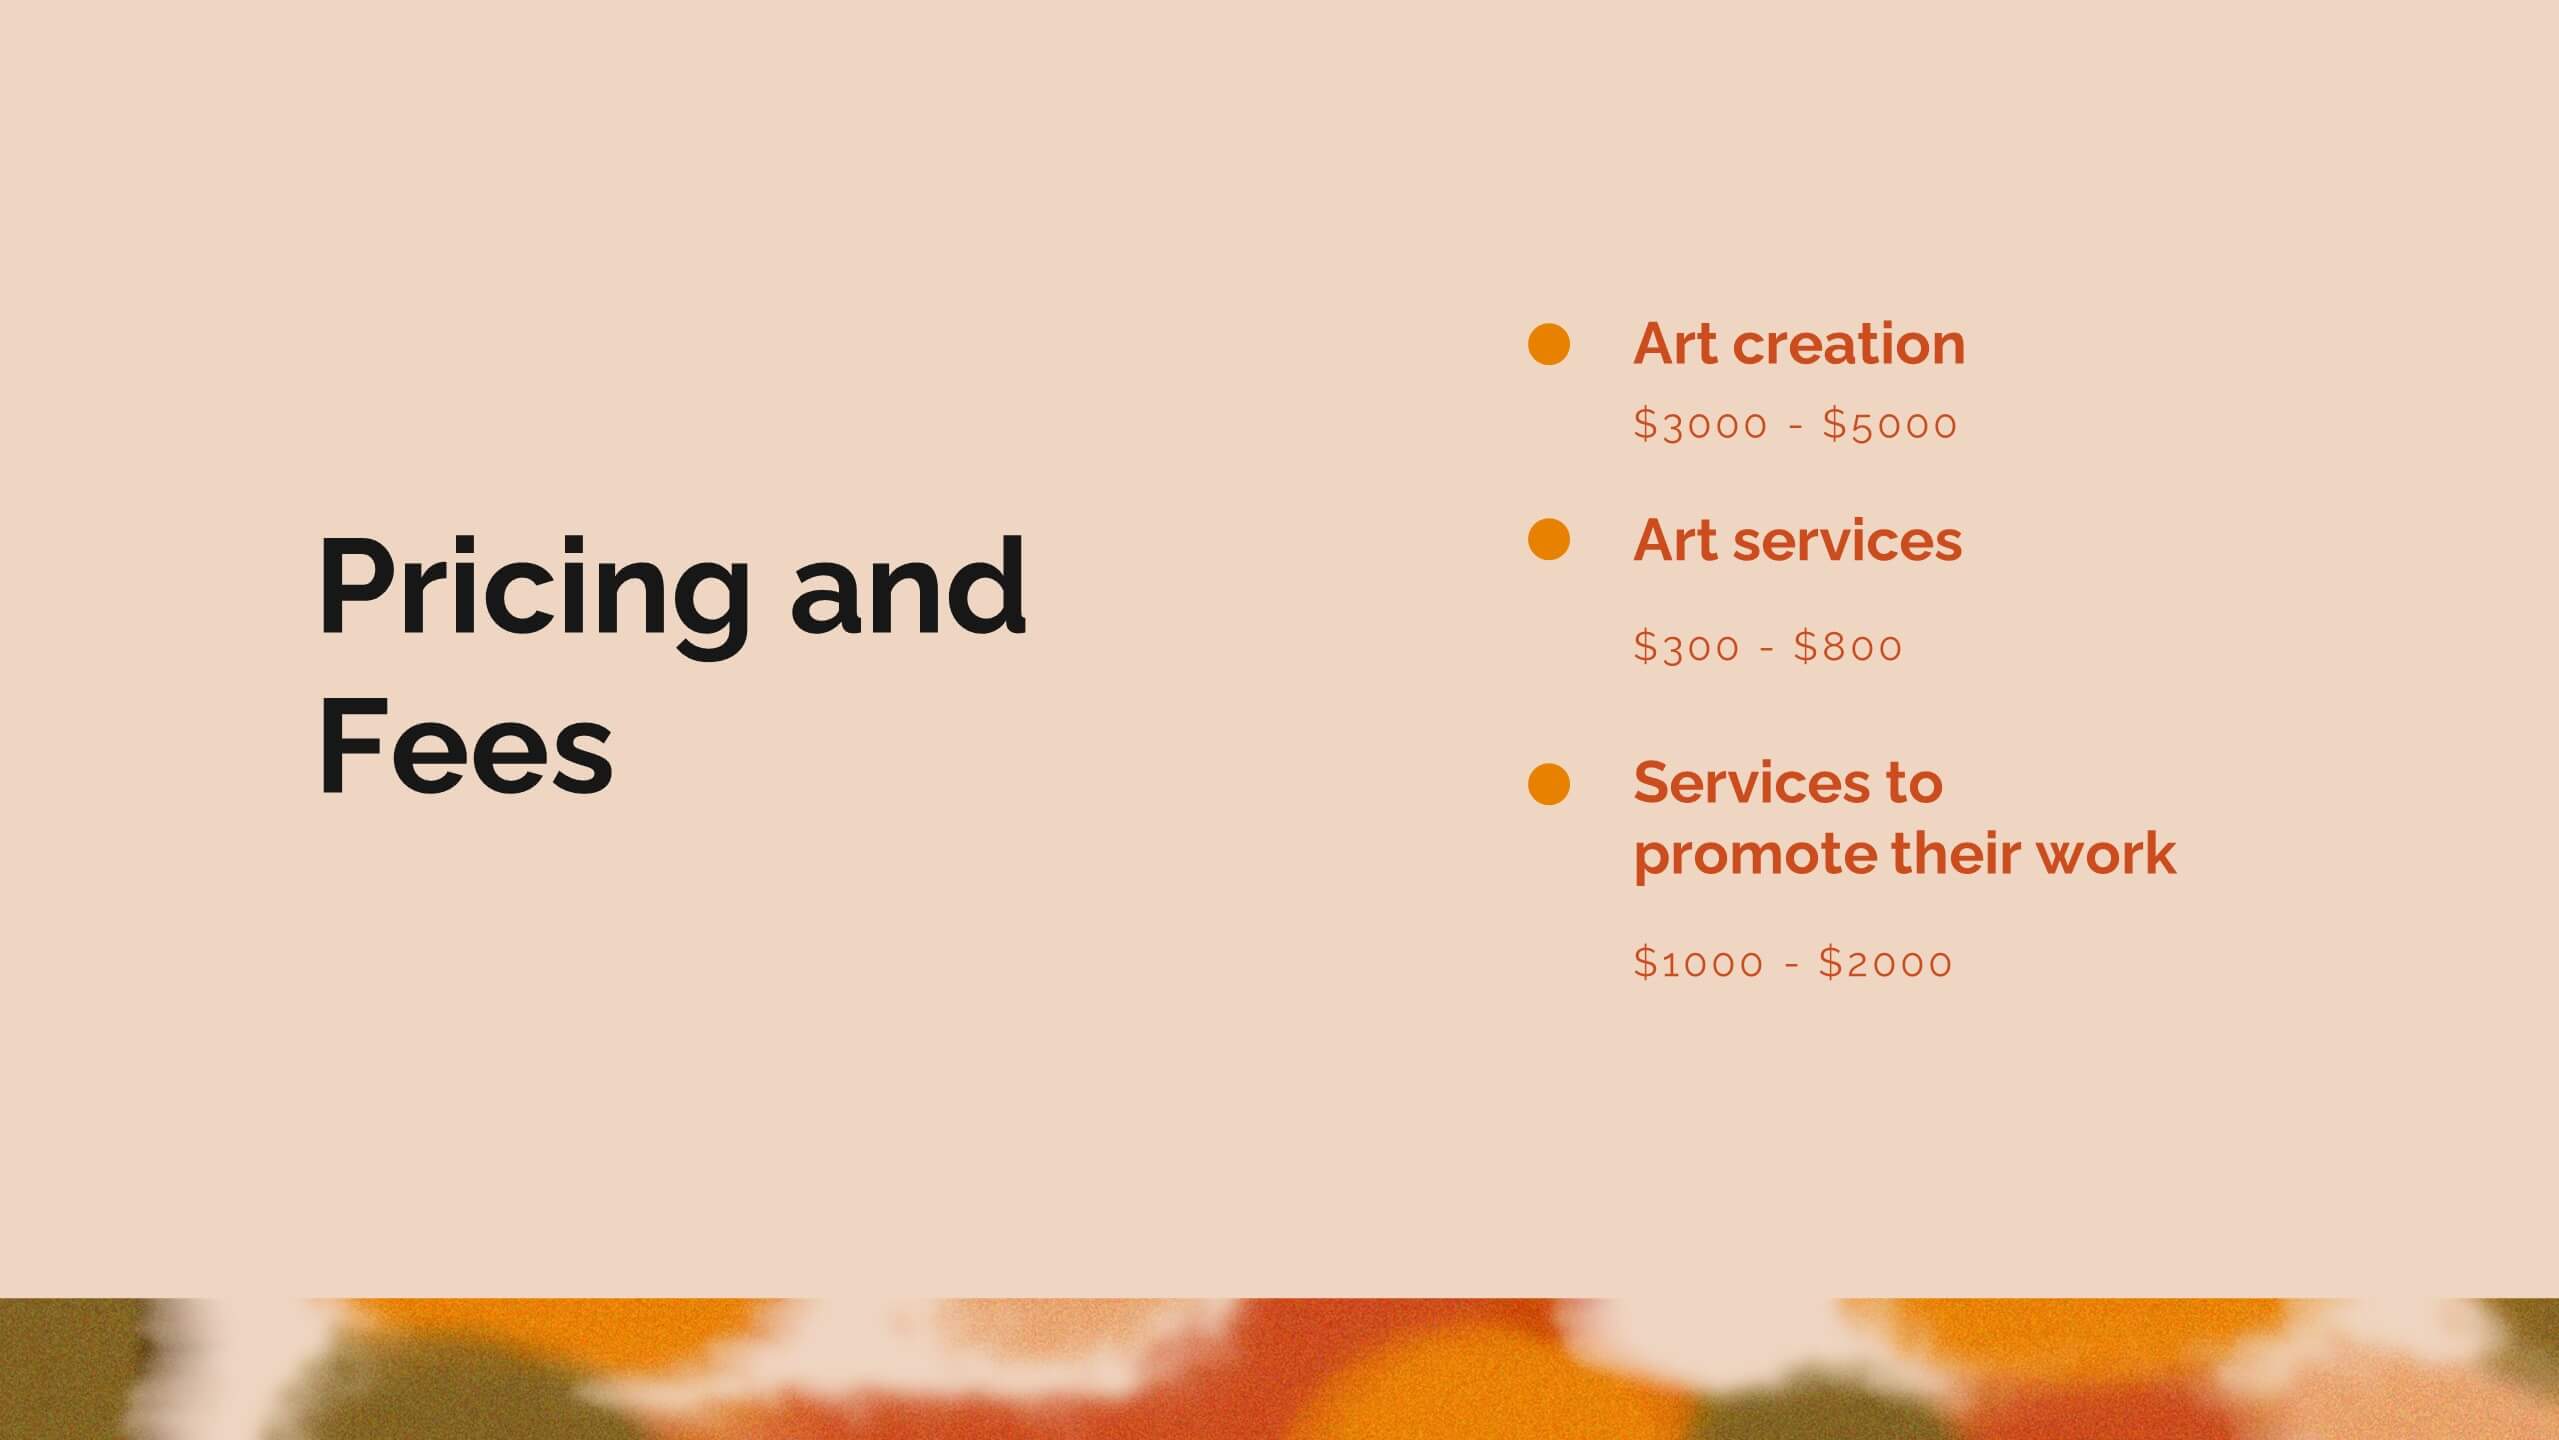
Zenith Artist Portfolio Presentation
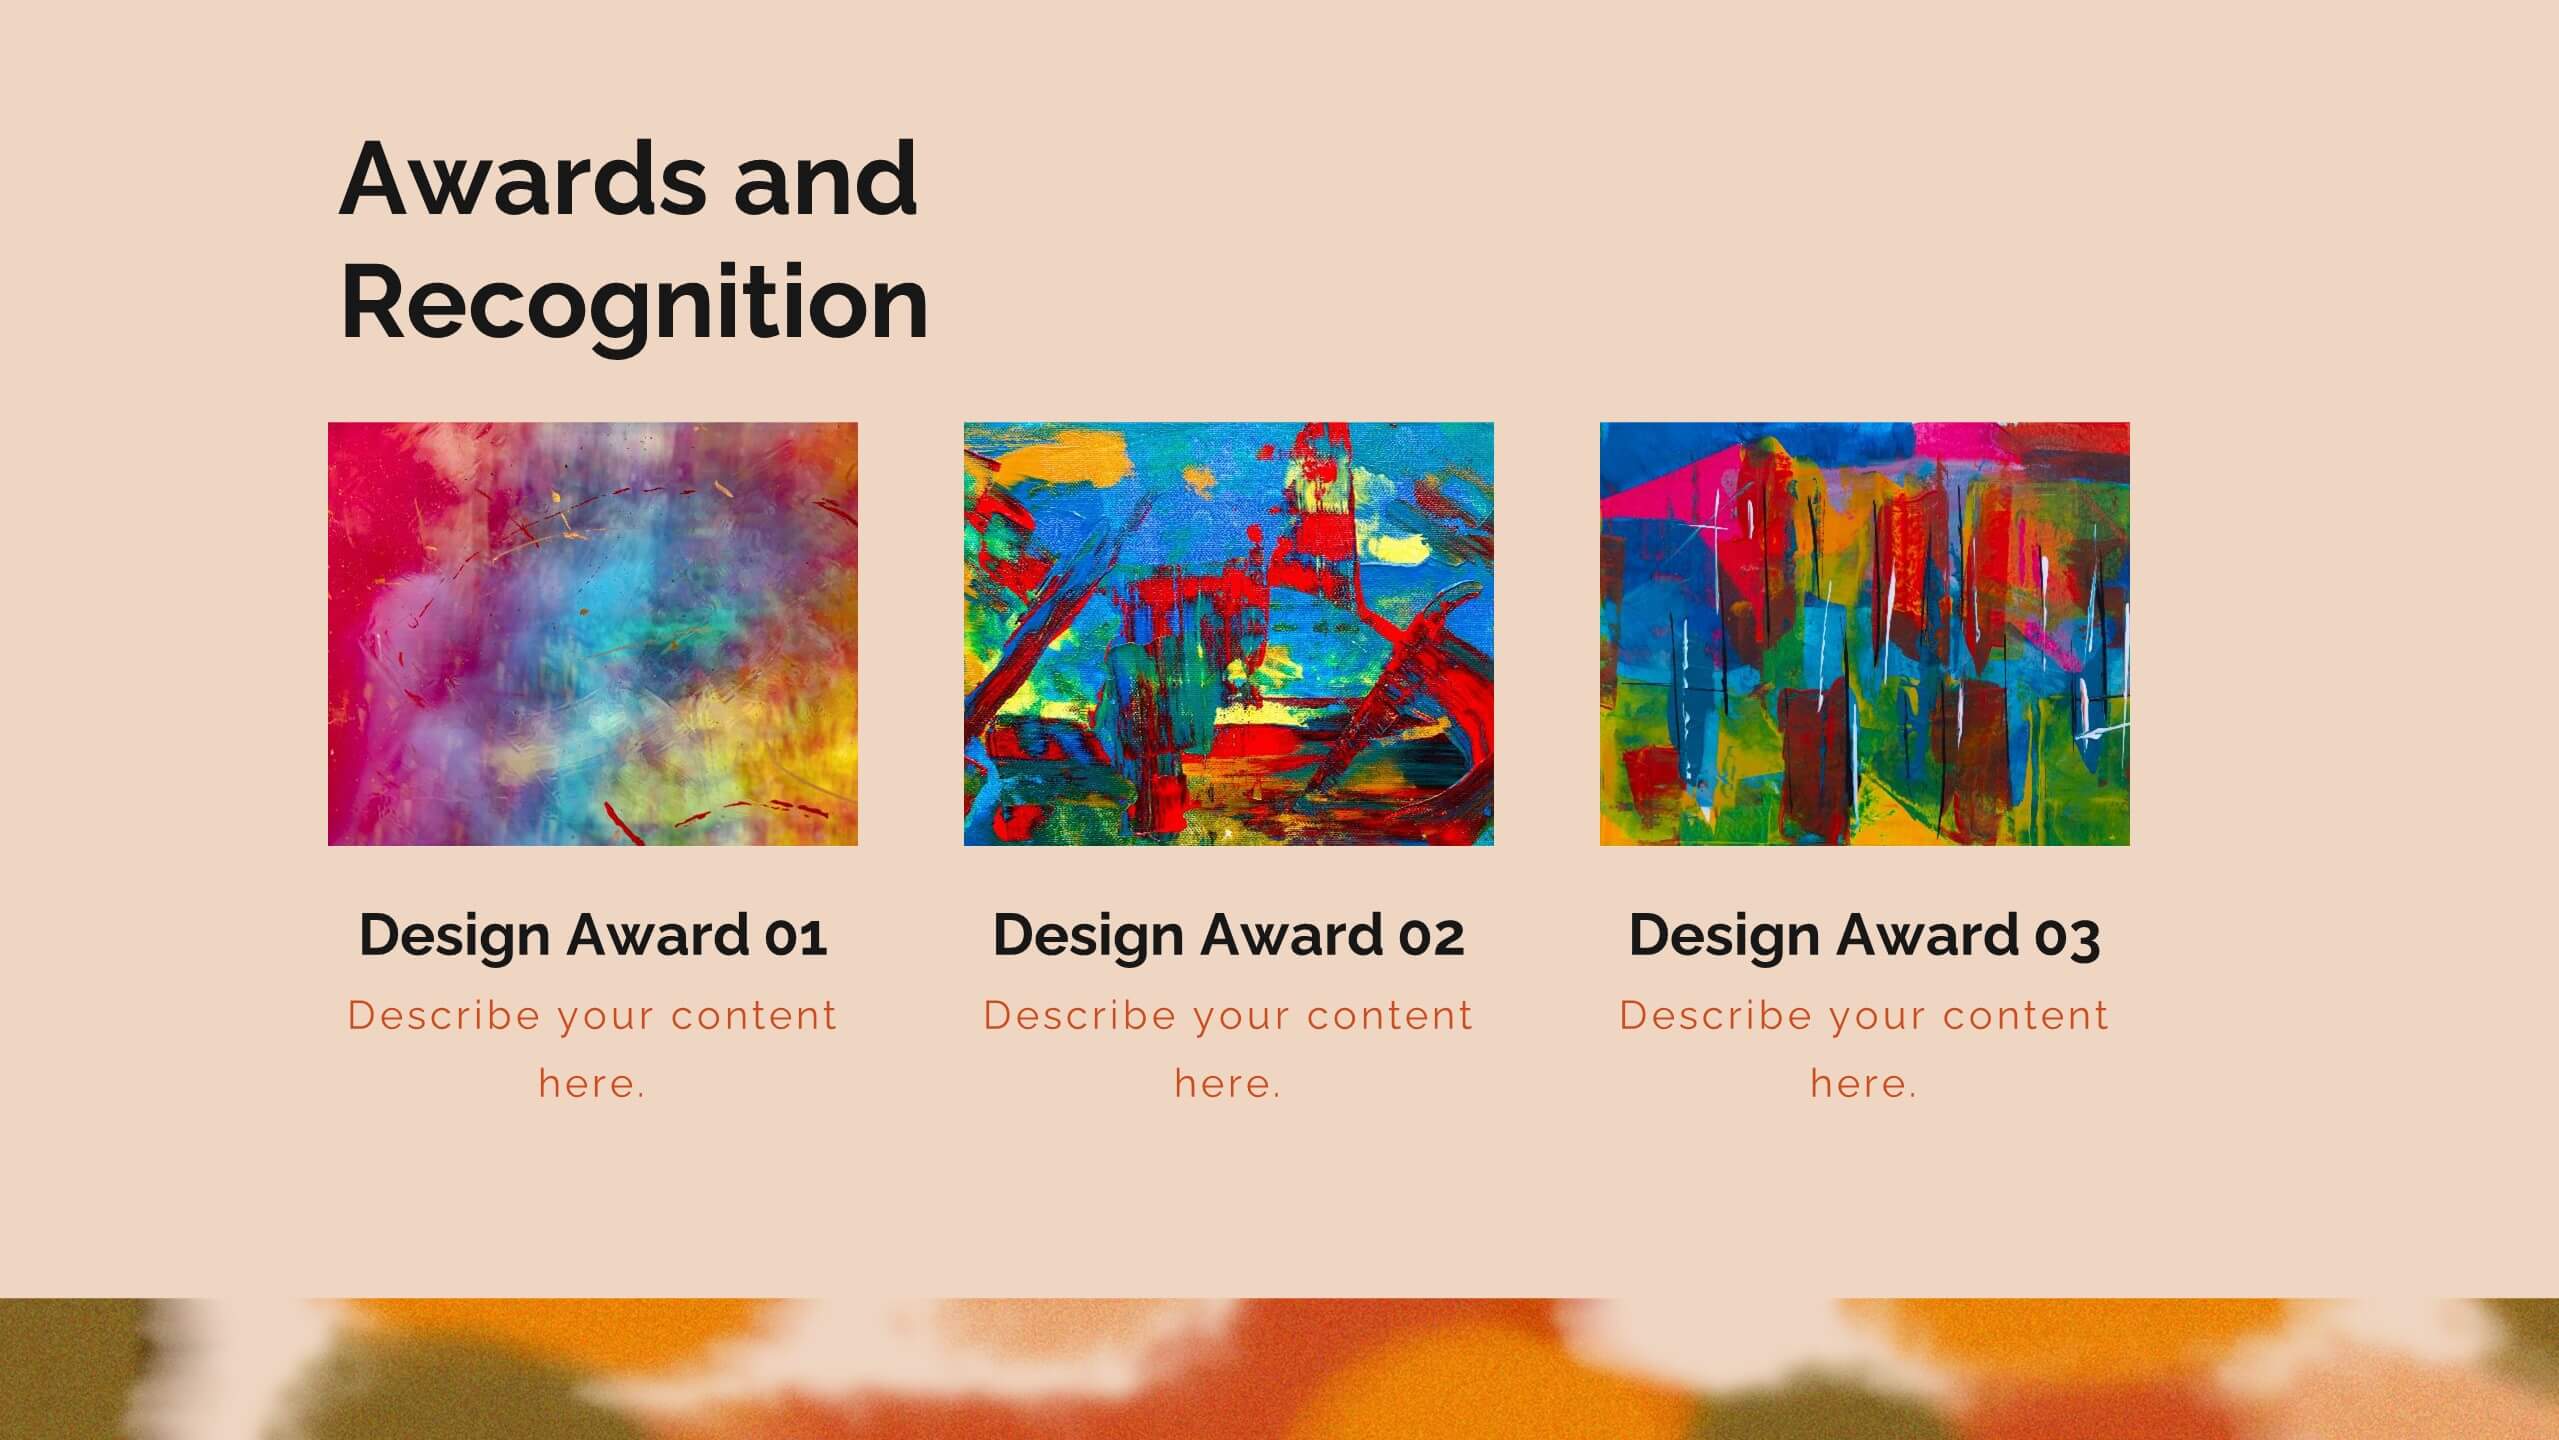
Showcase your artistic journey with this captivating portfolio template! Perfect for presenting your projects, creative process, and client testimonials. Ideal for artists aiming to highlight their work and achievements. Compatible with PowerPoint, Keynote, and Google Slides, this template ensures your portfolio is visually stunning and professionally presented. Make your art stand out!


4 slides
Corporate Company Profile Overview Presentation
Present your business story with clarity and impact using this sleek company profile layout. Designed for corporate overviews, it highlights key points alongside a modern visual backdrop. Ideal for executive summaries, strategy decks, or investor briefings—fully editable in PowerPoint, Keynote, and Google Slides for effortless customization and professional results.


5 slides
Organizational Management Frameworks Overview Presentation
Clarify reporting lines and decision-making roles with the Organizational Management Frameworks Overview Presentation. This clean and color-coded hierarchy chart helps visualize team structure, leadership levels, or departmental breakdowns. Ideal for organizational design, onboarding, or strategic alignment discussions, each placeholder is fully customizable to reflect your company’s framework. Compatible with PowerPoint, Keynote, and Google Slides—perfect for HR professionals, managers, and consultants seeking structure and clarity.


2 slides
Website UI Mockup Device Display Presentation
Showcase your website's interface with the Website UI Mockup Device Display slide. This professional and modern layout features a desktop screen to elegantly present your web design, user interface, or digital product. Perfect for designers, developers, and marketing presentations. Fully editable and compatible with PowerPoint, Keynote, and Google Slides.


5 slides
Supply Chain Industry Infographics
The supply chain industry refers to the network of organizations, resources, activities, and technologies involved in the production, distribution, and delivery of goods and services from the point of origin to the point of consumption. These vertical infographics encompasses all the stages and processes involved in the movement of products, including procurement, manufacturing, logistics, and customer service. These are designed to help your audience understand the intricacies of supply chain management and its role in business operations. Compatible with Powerpoint, Keynote, and Google Slides.


4 slides
Team Collaboration Puzzle Slide Presentation
Showcase team synergy with the Team Collaboration Puzzle Slide Presentation. This engaging design uses interlocking human figures to symbolize unity and contribution, making it perfect for presenting roles, responsibilities, or collaborative workflows. Fully editable in Canva, PowerPoint, or Google Slides—ideal for team introductions, project planning, or partnership overviews.


6 slides
Project Milestone Infographic
A project milestone is a significant event or point of progress during the execution of a project. This infographic template represents the completion of a specific phase or task and can be used as a reference point to track the project's progress and measure its success. This template will help project teams stay on track, align their efforts, and provide stakeholders with a clear understanding of the project's status. The infographic is designed to help project managers, team members, and stakeholders track and understand the project's development at a glance. This template is compatible with Powerpoint, Keynote, and Google Slides.


6 slides
Big Data Analytics Business Presentation
Analyze and visualize data-driven insights with the Big Data Analytics Business infographic. Designed with a central magnifying glass layout, this template highlights key metrics, trends, and processes in data analytics. Fully customizable and compatible with PowerPoint, Keynote, and Google Slides.


6 slides
Personal Productivity Time Management Techniques Presentation
Streamline your workflow with the Personal Productivity Time Management Techniques presentation slide. Featuring a step-by-step staircase layout, this template visually maps out five core techniques or habits leading to improved efficiency and goal achievement. Each step includes an icon and placeholder text for easy customization. Ideal for productivity coaches, corporate trainers, or time management workshops. Fully editable in PowerPoint, Keynote, and Google Slides.


7 slides
Subsistence Agriculture Infographic
Bring the essence of sustainability to your presentations with our Subsistence Agriculture infographic, designed for seamless integration with Powerpoint, Keynote, and Google Slides. This infographic is perfect for educators, agricultural professionals, and sustainability advocates who need to convey the importance of self-sufficient farming practices and their impact on local communities. Our Subsistence Agriculture infographic illustrates the fundamentals of agriculture that relies on the self-production of food by individuals and small communities. It highlights how this method supports sustainability, food security, and ecological balance. The visually engaging elements emphasize traditional farming techniques, crop diversity, and the role of agriculture in rural livelihoods. By incorporating this infographic into your presentations, you present a compelling narrative on the significance of subsistence farming in today's world. It not only educates your audience on the basics but also inspires discussions on the broader implications for global food systems. Use this infographic to effectively communicate the value of subsistence agriculture in maintaining community resilience and environmental stewardship.


8 slides
Credit Card Comparison Presentation
The "Credit Card Comparison" presentation template visualizes the differences between credit and debit card options in a straightforward and engaging way. Featuring side-by-side comparisons, the template allows for easy insertion of key points such as fees, benefits, and suitability for different user profiles, making it an excellent tool for financial educators, advisors, and banking professionals. The template’s design ensures that the content is accessible and relatable, making complex financial concepts easier to grasp for the audience. This makes it ideal for presentations aimed at educating consumers about financial choices or for internal training within financial institutions.


7 slides
RACI Matrix Project Infographic
A RACI Matrix, sometimes referred to as a Responsibility Assignment Matrix, is a project management tool used to clarify and communicate the roles and responsibilities of team members in completing tasks and activities within a project. This is a visually captivating and informative template designed to demystify the complexities of project accountability. Navigate through the world of roles and responsibilities in a project setting with this dynamic and easily digestible visual aid. With this infographic your audience will journey toward effective project management and accountability with the RACI Matrix.


8 slides
Annual Highlights and Key Achievements Presentation
Showcase your biggest wins with this award-themed highlights slide. Featuring colorful trophy icons, it’s perfect for summarizing yearly accomplishments or milestones. Each section is clearly labeled to spotlight key points. Fully editable and compatible with PowerPoint, Keynote, and Google Slides—ideal for business recaps, team recognition, or performance reviews.


5 slides
Pandemic Prevention and Treatment Options Infographics
Pandemic Prevention is the proactive measures taken to reduce the risk of the spread and impact of infectious diseases on a global scale. These infographic templates are designed to communicate the essential information about pandemic prevention and treatment options. It provides a visually appealing and easy-to-understand overview of key concepts, preventive measures, and treatment options. Use this template to educate and empower your audience with the knowledge needed to navigate pandemics effectively and contribute to public health and safety. This template is perfect for healthcare professionals, educators, and organizations looking to share valuable information.


10 slides
Brand Loyalty and Customer Retention Presentation
Strengthen your brand’s relationship with your audience using the "Brand Loyalty and Customer Retention" presentation template. This design effectively illustrates how strong branding strategies enhance customer loyalty and retention rates. Ideal for marketers and business strategists, this template is fully compatible with PowerPoint, Keynote, and Google Slides, making it perfect for presentations aimed at improving customer engagement and business growth.