


Features
- 6 Unique slides
- Fully editable and easy to edit in Microsoft Powerpoint, Keynote and Google Slides
- 16:9 widescreen layout
- Clean and professional designs
- Export to JPG, PDF or send by email


Do you have any questions?
Recommend


4 slides
Butterfly Comparison Chart Presentation
Bring clarity to your comparisons with a sleek, balanced design that highlights both sides of your data. This presentation is perfect for showing pros and cons, alternatives, or performance metrics in a visually engaging way. Fully customizable and compatible with PowerPoint, Keynote, and Google Slides.


4 slides
Professional Team Member Slides Presentation
Meet your team in a fresh, dynamic way with a layout that highlights personalities, roles, and key contributions at a glance. This presentation helps introduce members clearly, supporting stronger collaboration and professional communication across any project. Fully customizable and compatible with PowerPoint, Keynote, and Google Slides.


6 slides
Big Data Analytics Business Presentation
Analyze and visualize data-driven insights with the Big Data Analytics Business infographic. Designed with a central magnifying glass layout, this template highlights key metrics, trends, and processes in data analytics. Fully customizable and compatible with PowerPoint, Keynote, and Google Slides.


6 slides
Process Flow in Wheel Format Presentation
Showcase cyclical processes and step-by-step workflows with this Process Flow in Wheel Format. This dynamic, circular diagram is perfect for illustrating ongoing operations, development cycles, or organizational stages. Each section is clearly labeled and color-coded for easy customization. Fully editable in PowerPoint, Keynote, and Google Slides — ideal for operations managers, project leads, and consultants.


5 slides
The Future of Food Waste Infographics
Food Waste refers to the loss or disposal of food that is still edible or could have been consumed. These infographic template are designed with the aim of raising awareness, inspiring change, and empowering individuals and organizations to take action towards a more sustainable food system. These infographics are perfect for anyone interested in understanding the future trajectory of food waste and exploring potential solutions. With these infographic templates, create a presentation that inspires action and foster a collective commitment to combating food waste for a more sustainable future.


8 slides
Competitive Market Strategy Presentation
Stay Ahead in the Market with this Competitive Market Strategy Presentation template. This slide helps you analyze industry competition, market positioning, and strategic advantages with a clean, engaging circular layout. Ideal for business planning, marketing strategy meetings, and competitive analysis, this template allows you to highlight key differentiators and action steps clearly. Fully customizable and available for PowerPoint, Keynote, and Google Slides.


26 slides
Financial Planning Essentials Presentation
Take control of your financial destiny with our Financial Planning Essentials presentation template, suitable for PowerPoint, Keynote, and Google Slides. This template is meticulously designed for financial advisors, planners, and anyone seeking to educate on the principles of sound financial management. Our Financial Planning Essentials template is a rich resource that provides an extensive range of slides to explain the basics of financial planning, investment strategies, and wealth management. It allows you to break down financial concepts into easy-to-understand elements, making it perfect for client presentations, financial workshops, and educational seminars. Featuring customizable diagrams, charts, and financial models, the template enables a personalized approach to presenting financial data and strategies. Whether you're outlining budgeting techniques, investment plans, or retirement strategies, this template helps you communicate complex information in a clear and professional manner. Optimize your financial planning presentations with our SEO-friendly template to become a trusted resource in financial education and planning. Lead your audience toward financial freedom with a comprehensive and engaging presentation that simplifies the path to financial success.


8 slides
Directional Diagram with Progress Arrows Presentation
Showcase milestones, track development, or visualize progress with the Directional Diagram with Progress Arrows Presentation. This modern layout features arrow-based steps, making it ideal for roadmaps, process stages, or timeline breakdowns. Customize labels, icons, and colors to suit your message. Fully editable in PowerPoint, Google Slides, and Canva.


6 slides
3D Technologies Infographics
Dive into the world of 3D Technologies with our customizable infographic template. This template is fully compatible with popular presentation software like PowerPoint, Keynote, and Google Slides, allowing you to easily customize it to showcase various aspects and applications of 3D technologies. The 3D Technologies infographic template provides a visually engaging platform to explore and explain the world of three-dimensional technology, from 3D printing and modeling to virtual reality and augmented reality. Whether you're an enthusiast, educator, or industry professional, this template offers a user-friendly canvas to create informative presentations and educational materials. Elevate your understanding of 3D Technologies with this SEO-optimized infographic template, thoughtfully designed for clarity and ease of use. Customize it to highlight the key principles, applications, and innovations within the 3D technology landscape, making complex concepts accessible to your audience. Start crafting your personalized infographic today to delve into the exciting realm of 3D Technologies.


6 slides
Meeting Planner Infographics
Efficiently plan and organize meetings with our Meeting Planner infographic template. This template is fully compatible with popular presentation software like PowerPoint, Keynote, and Google Slides, allowing you to easily customize it to illustrate and communicate the key steps and strategies for effective meeting planning. The Meeting Planner infographic template offers a visually engaging platform to outline the meeting planning process, including scheduling, agenda creation, participant coordination, and follow-up actions. Whether you're a project manager, event planner, or business professional, this template provides a user-friendly canvas to create informative presentations and educational materials on meeting planning best practices. Optimize your meeting planning skills and efficiency with this SEO-optimized Meeting Planner infographic template, thoughtfully designed for clarity and ease of use. Customize it to showcase tips for successful meetings, tools for scheduling, and strategies for engaging participants, ensuring that your audience becomes more proficient in planning and executing productive meetings. Start crafting your personalized infographic today to become a more effective Meeting Planner.


10 slides
Corporate Governance Model Presentation
Bring clarity and structure to complex leadership systems with this clean, modern slide, perfect for explaining how key responsibilities flow across an organization. It helps simplify roles, decisions, and oversight for any business audience. Fully editable and easy to use in PowerPoint, Keynote, and Google Slides.


6 slides
Startup Business Validation Plan Presentation
Present your startup’s validation strategy with this structured, color-coded framework. Ideal for mapping business assumptions, customer segments, and testing stages. Includes five top-phase boxes and supporting rows for team input or feedback. Fully editable in PowerPoint, Keynote, or Google Slides—perfect for founders, incubators, or pitch decks.


5 slides
Strategic Blue Ocean Shift Presentation
Dive into bold new thinking with a slide that makes strategic transformation feel clear, focused, and actionable. This presentation breaks down key decisions that help teams shift from competitive pressure to value innovation, making complex choices easy to visualize and present. Fully compatible with PowerPoint, Keynote, and Google Slides.


7 slides
Flow Chart Infographic Presentation Template
A Flow Chart Infographic uses shapes and lines to show the flow of information, steps in a process, or the relationship between different ideas. Flow Charts are often used in business, education, and technology to show the steps in a process, decision-making flow, or to illustrate the relationship between different pieces of information. This template is perfect for showing how things work or how to do something step by step. This flowchart infographic includes a variety of different charts and description boxes that you can customize with your information to make it work for you.


6 slides
Task Management Checklist
Stay on top of your workflow with this visually engaging task management checklist slide. Designed to help teams track progress across multiple tasks or project stages, this layout includes six editable sections with icon markers and color-coded completion states. Fully compatible with PowerPoint, Keynote, and Google Slides.


22 slides
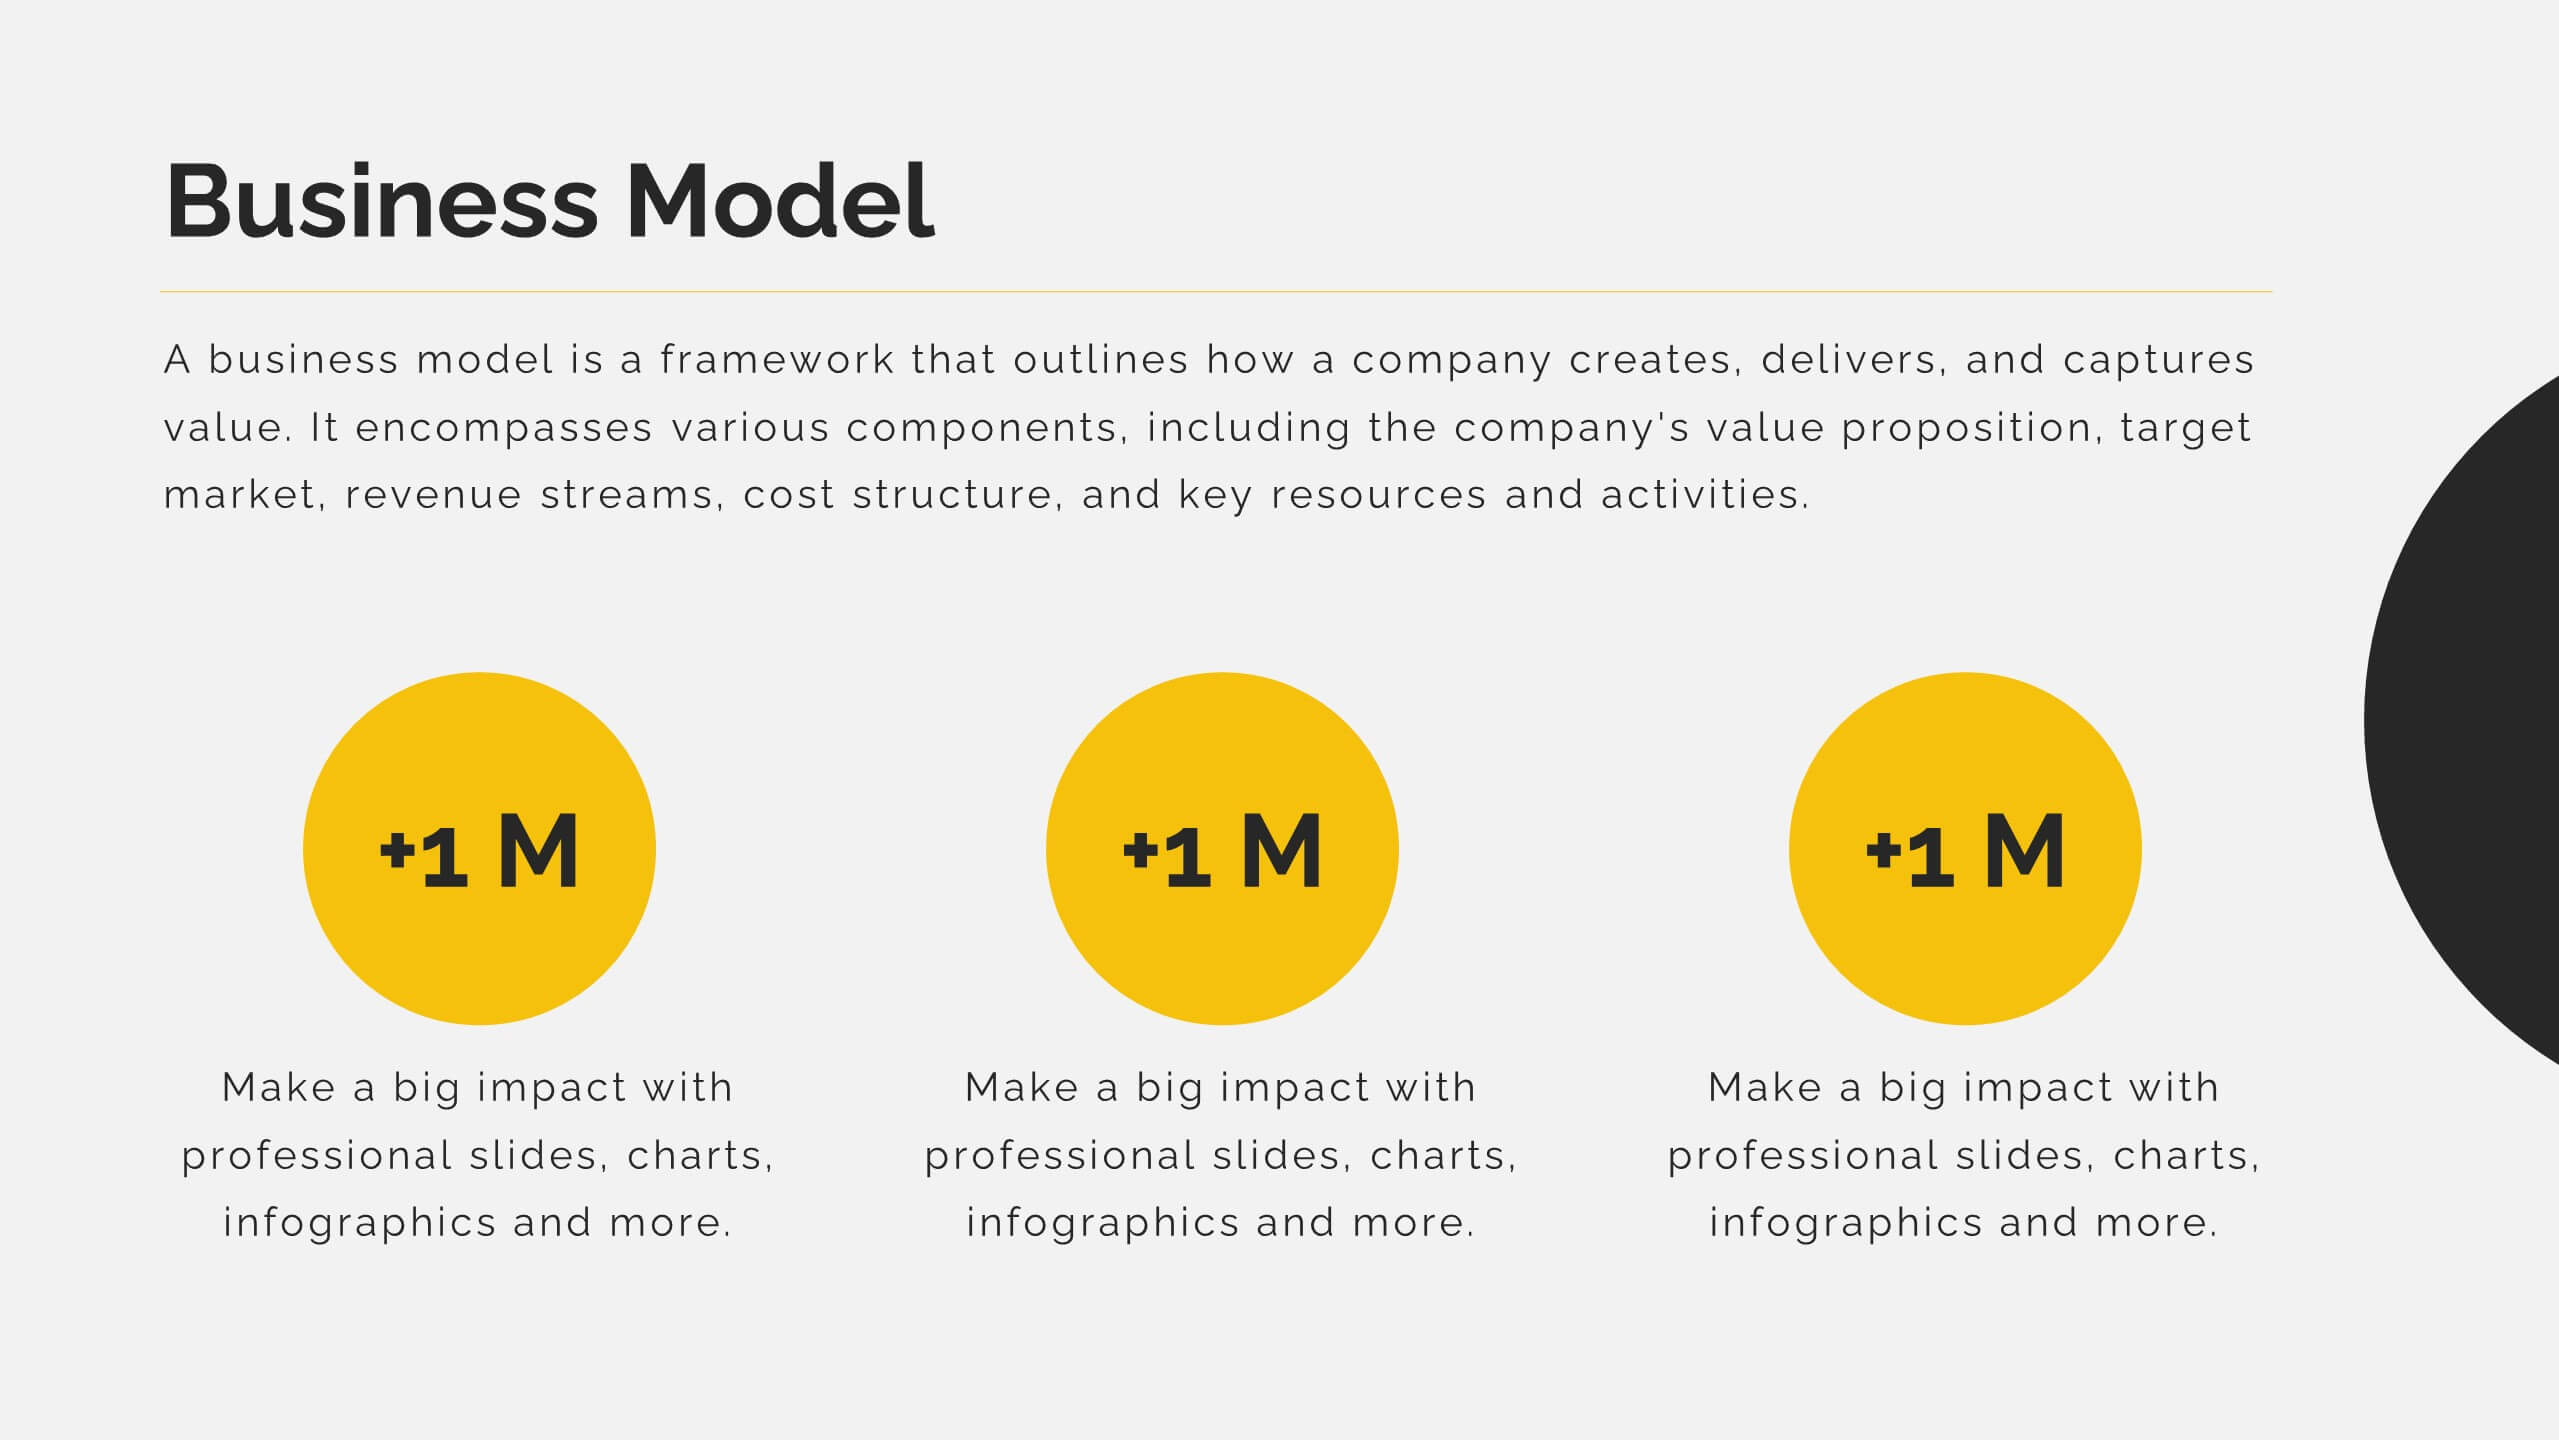
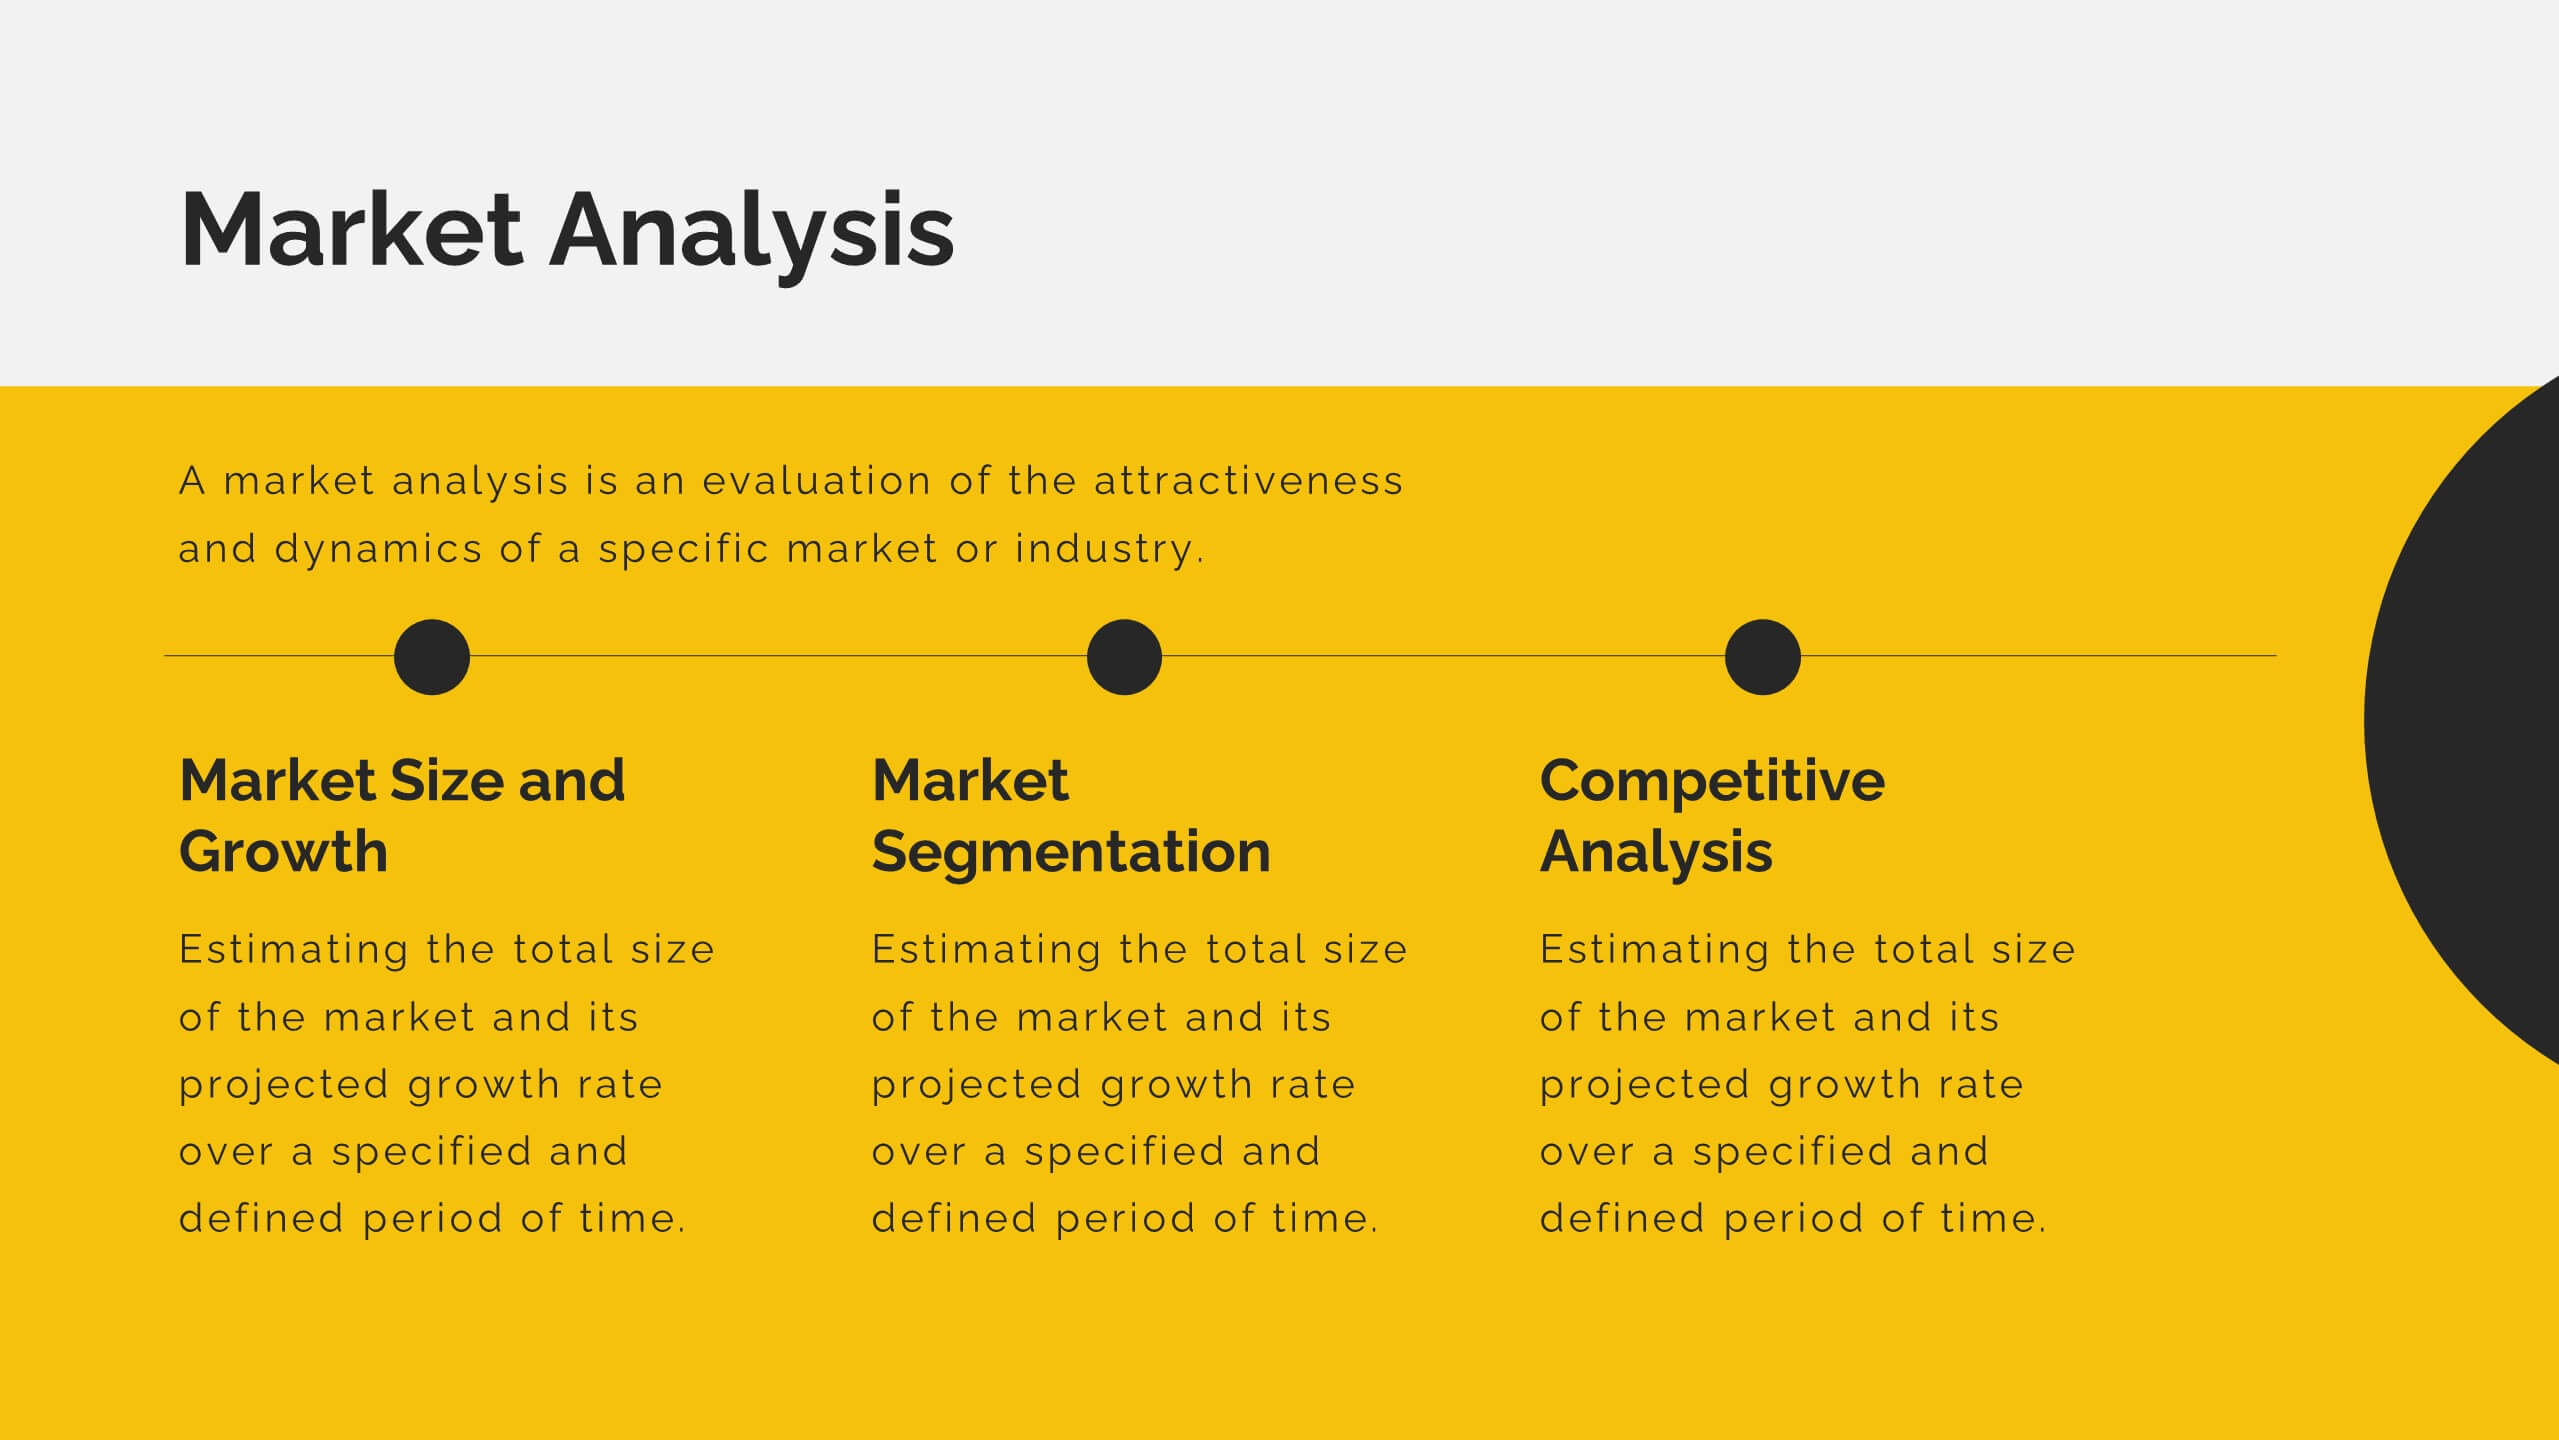
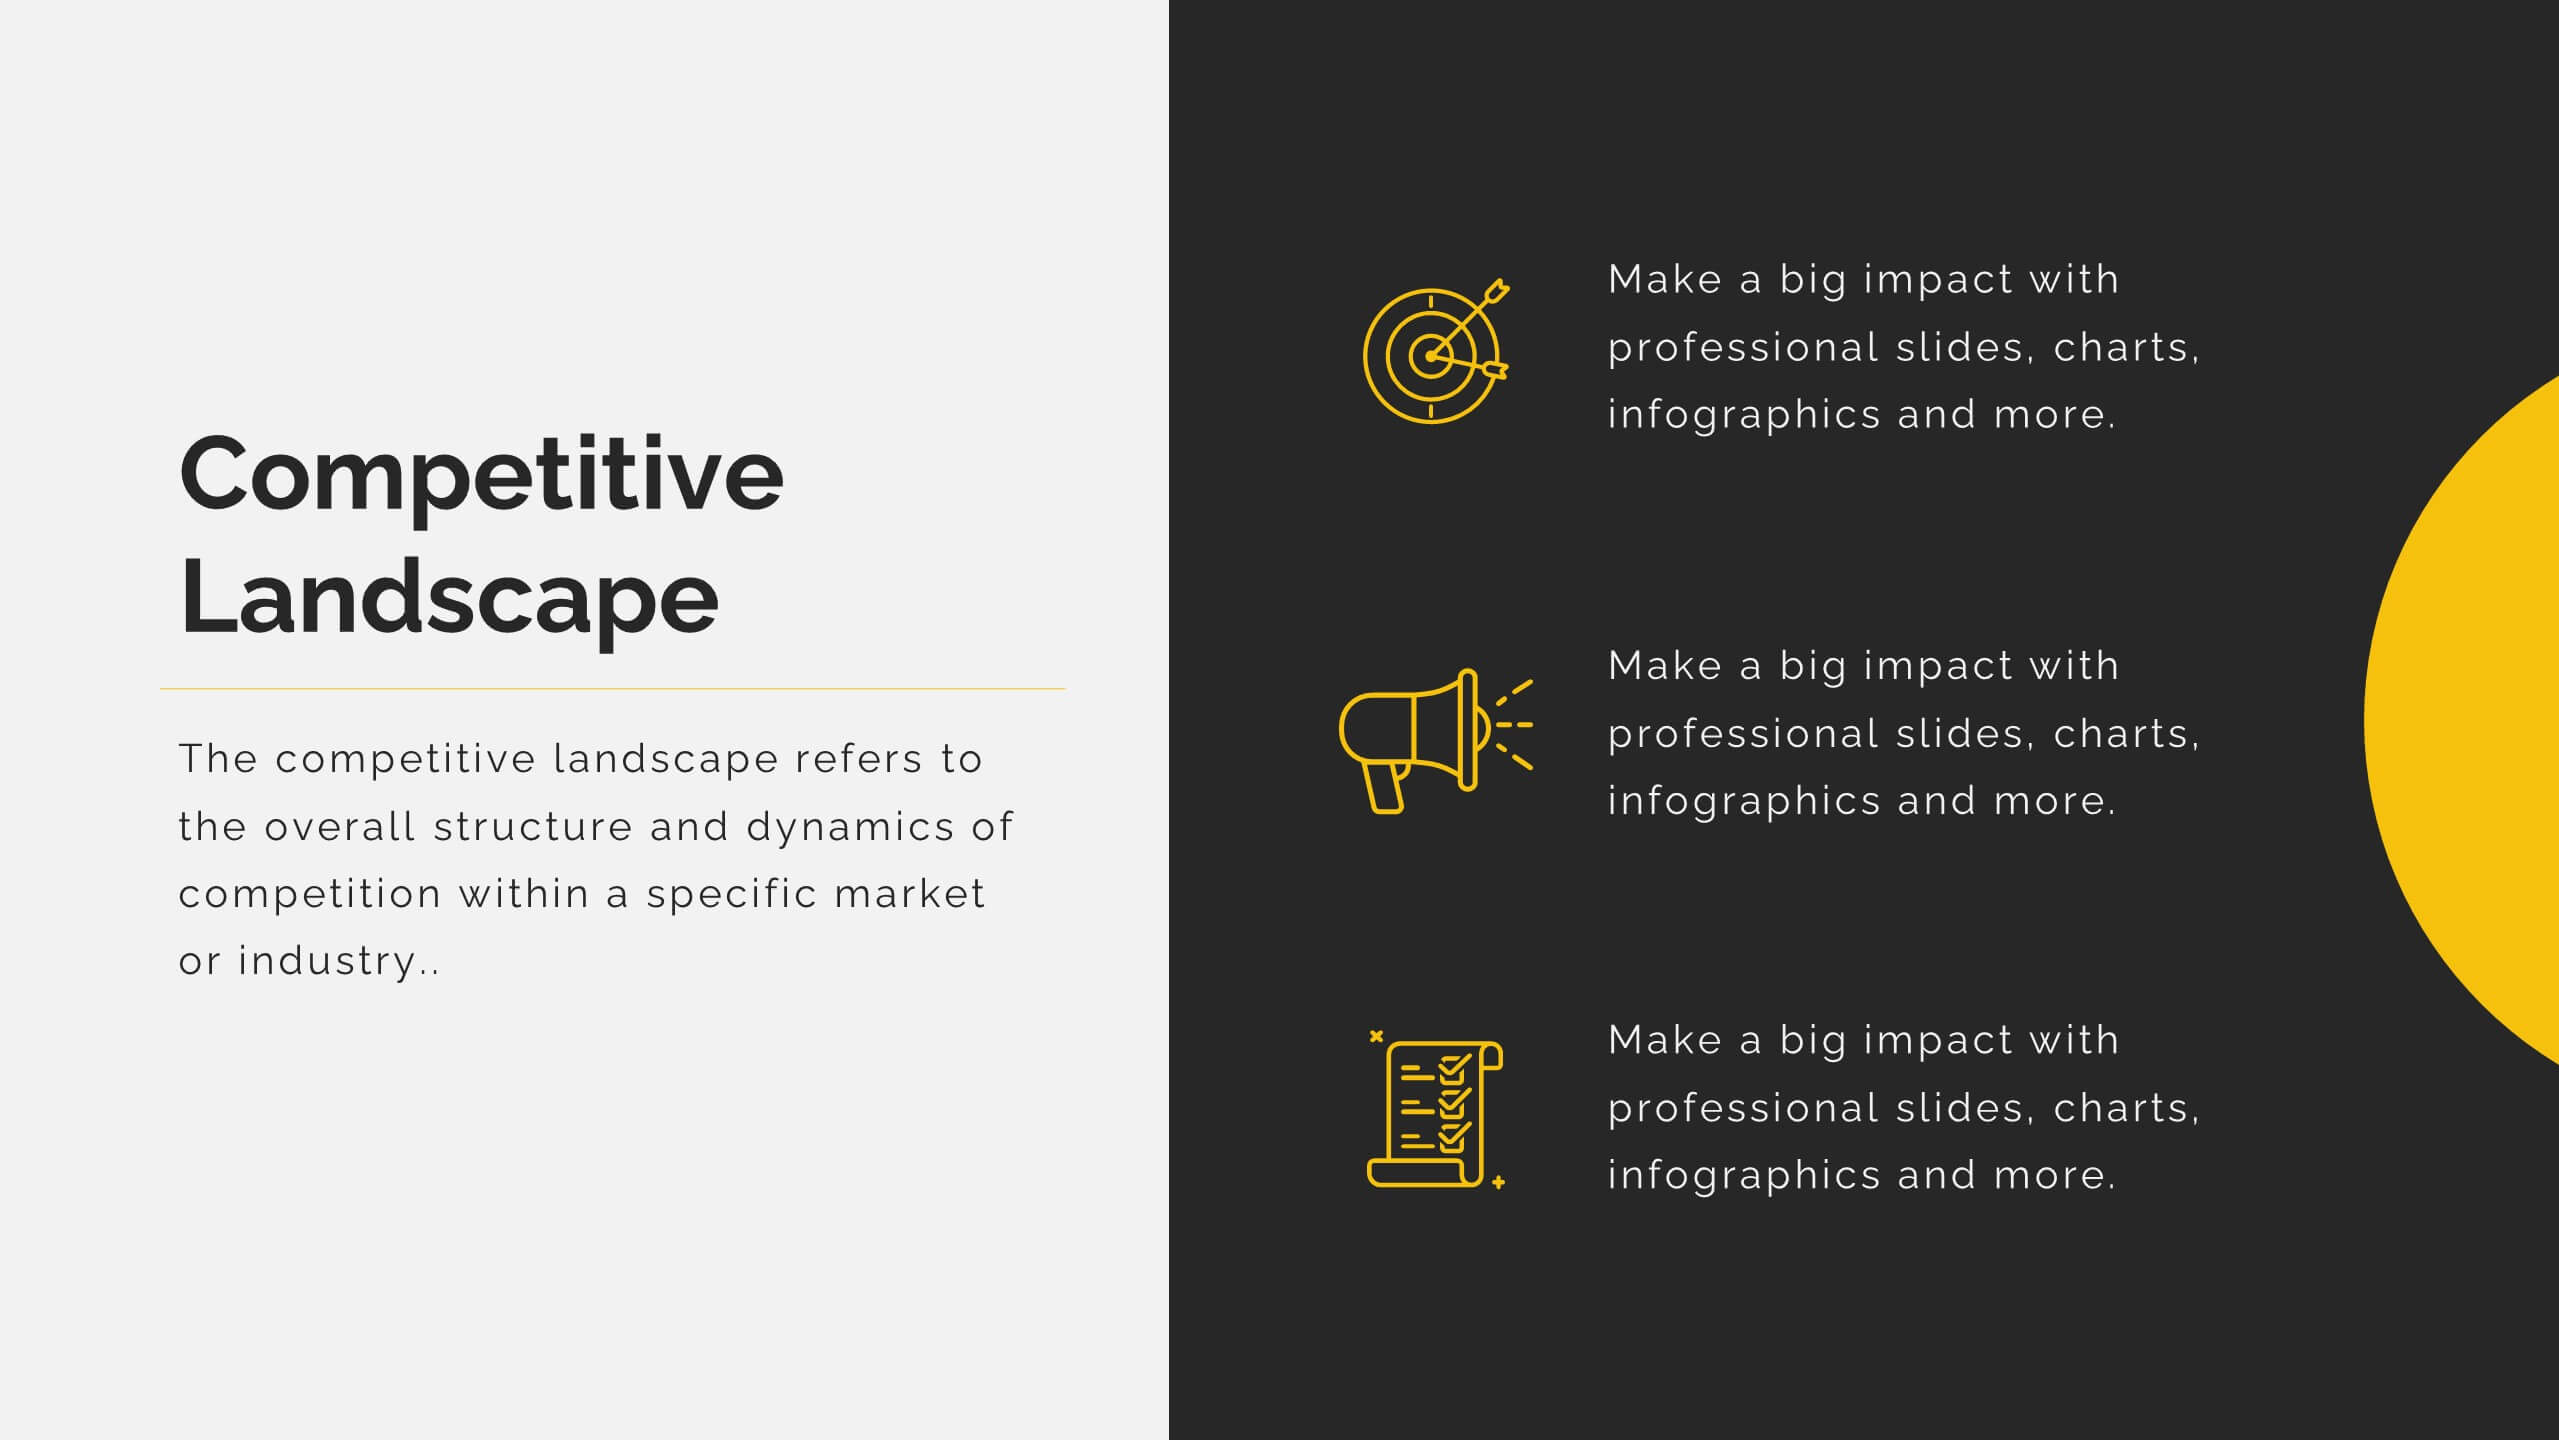
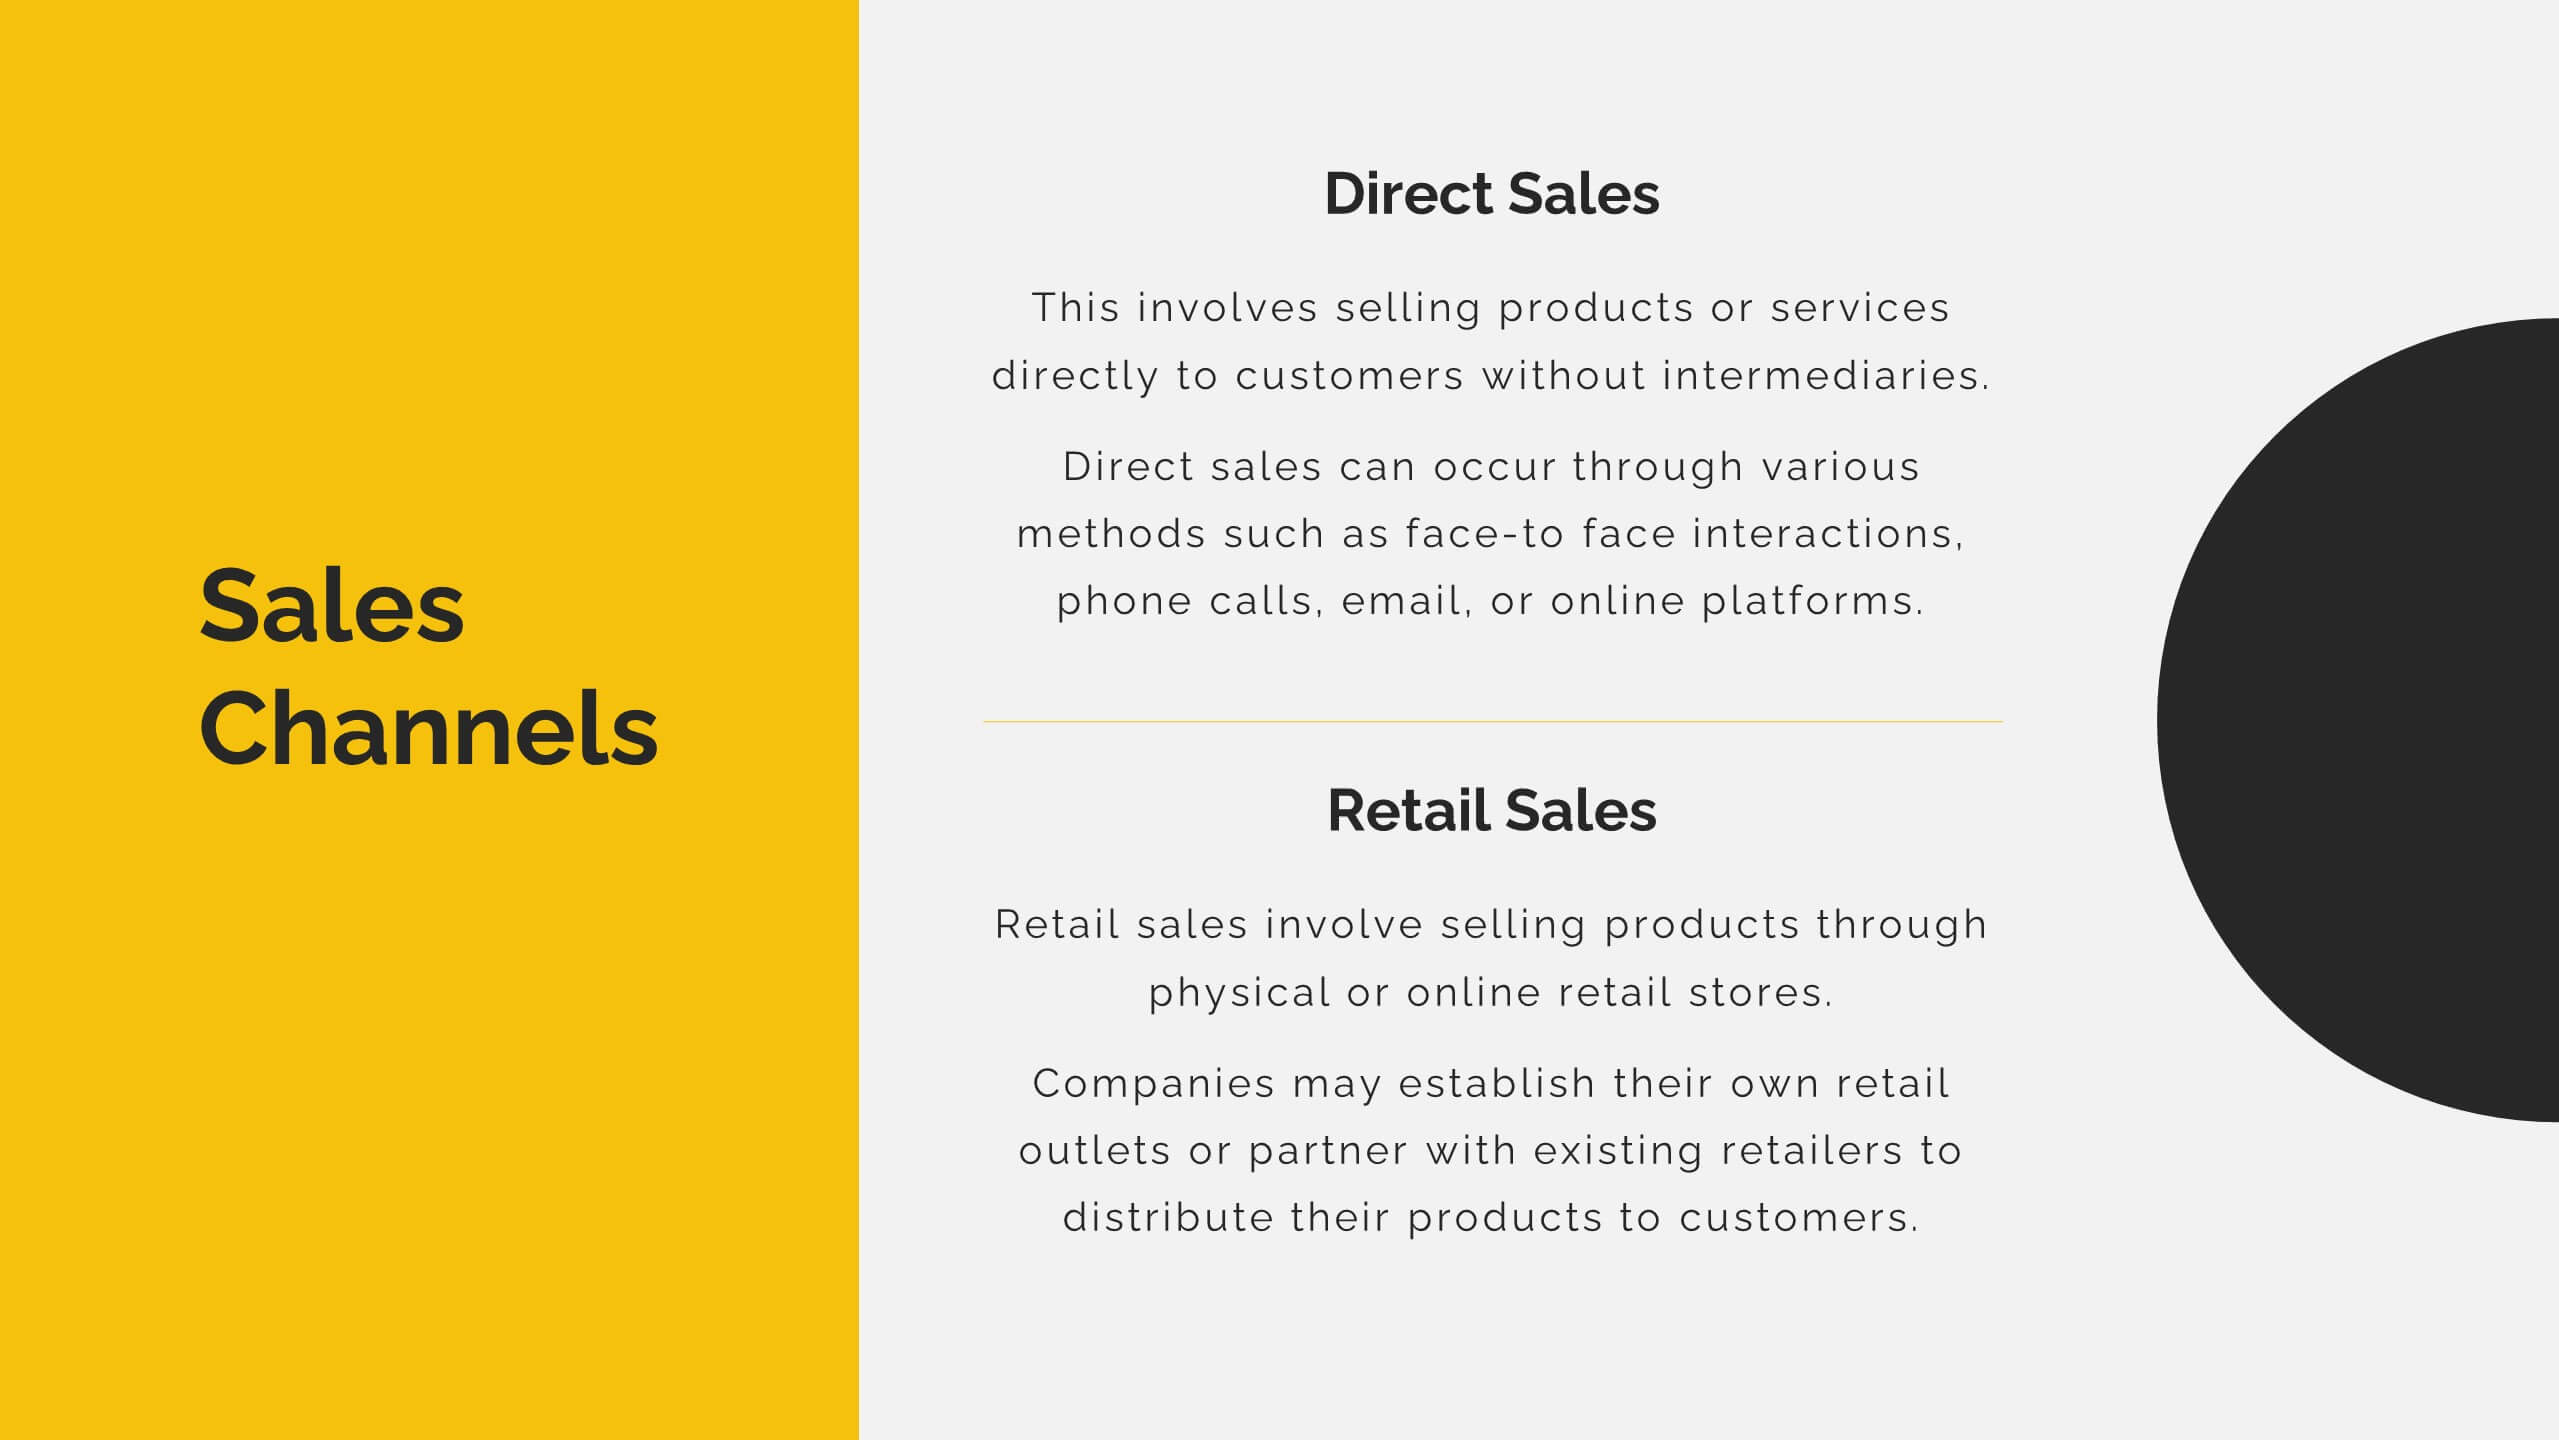
Mirage Startup Funding Proposal Presentation
Secure funding with this dynamic startup proposal template! Perfect for presenting your mission, vision, business model, and market analysis. Ideal for entrepreneurs aiming to impress investors and stakeholders. Compatible with PowerPoint, Keynote, and Google Slides, this template ensures your proposal is clear, professional, and compelling. Achieve your startup goals today!


4 slides
To-Do Lists and Task Management Presentation
Stay organized and boost productivity with the To-Do Lists and Task Management Presentation. This sleek layout features vertical note-style columns that are perfect for displaying tasks, priorities, or checklists in a structured format. Ideal for project timelines, personal goals, or team deliverables. Each list area includes customizable titles, checkmarks, and space for key points. Fully editable in PowerPoint, Keynote, and Google Slides—perfect for visual task tracking across presentations.