


Features
- 8 Unique slides
- Fully editable and easy to edit in Microsoft Powerpoint, Keynote and Google Slides
- 16:9 widescreen layout
- Clean and professional designs
- Export to JPG, PDF or send by email


Do you have any questions?
Recommend


21 slides
Dreameon Agency Portfolio Presentation
Showcase your agency's expertise with this sleek and modern portfolio presentation template. Designed to highlight your achievements, creative processes, and client success stories, this template offers a comprehensive layout that communicates professionalism and innovation. From introducing your team and services to detailing case studies and market analysis, each slide is meticulously crafted to leave a lasting impression. Display your strategy development, social media impact, and measurement analytics effectively, ensuring a cohesive narrative that resonates with your audience. Easily customizable and compatible with PowerPoint, Google Slides, and Keynote, this template is perfect for agencies looking to pitch their capabilities, attract new clients, or present project achievements with confidence.


7 slides
Online Marketing Plan Presentation
Turn your digital strategy into a story worth sharing with this clean, modern layout designed to showcase marketing goals, channels, and performance insights. Ideal for planning campaigns or presenting analytics, it keeps content structured and engaging. Fully editable and compatible with PowerPoint, Keynote, and Google Slides for easy customization.


5 slides
Country Data Mapping in South America Presentation
Present data with impact using the Country Data Mapping in South America Presentation. This clean, professional slide highlights key statistics across up to five countries using labeled connectors, icons, and a gradient-based map. Ideal for showcasing regional growth, KPIs, or operational breakdowns across South America. Fully editable and compatible with PowerPoint, Keynote, Google Slides, and Canva.


5 slides
Puzzle-Based Team Alignment Strategy Presentation
Bring collaboration to the forefront with the Puzzle-Based Team Alignment Strategy Presentation. This creative layout uses interlocking puzzle pieces to represent interconnected team roles, milestones, or initiatives—perfect for showcasing synergy and strategic cohesion. Each section is color-coded and icon-enhanced for quick visual recognition, making it ideal for team briefings, onboarding, or workflow planning. Fully editable in PowerPoint, Keynote, and Google Slides.


5 slides
Venn Diagram Comparison Slide Presentation
Bring clarity to your ideas with a layered visual that makes comparing multiple concepts feel effortless and engaging. This presentation helps you highlight differences, similarities, and key insights using clean shapes and simple labels. Fully customizable and compatible with PowerPoint, Keynote, and Google Slides.


4 slides
Modern Geometric Shapes
Present your ideas with clean, minimal, and visually striking 3D shapes. This layout uses a sequence of geometric figures—cube, cone, and sphere—to represent step-by-step flows or abstract concepts. Ideal for design, architecture, education, or tech topics. Fully editable in PowerPoint, Keynote, and Google Slides.


6 slides
Project Scope and Deliverables Overview Presentation
Make your project presentations flow effortlessly with a clear, structured layout that highlights goals, milestones, and deliverables. Ideal for tracking progress and aligning teams, this professional design balances clarity and style. Fully compatible with PowerPoint, Keynote, and Google Slides for smooth editing and presentation flexibility.


5 slides
Online Digital Marketing Infographics
Online Digital Marketing refers to the promotion of products, services, or brands using digital channels and technologies. These infographic templates aims to educate and inspire the audience about the world of digital marketing and equip them with valuable insights and strategies to enhance their online presence. This is a valuable tool for presenting the intricacies of digital marketing in a clear and engaging manner. The templates provide slides that focus on analytics and measurement, emphasizing the importance of tracking and evaluating digital marketing efforts. You can customize the templates with your own branding to create a professional look.


6 slides
Business RAPID Model Diagram Presentation
Turn decision-making into a visual story with this bold, professional diagram that highlights each stage of responsibility and collaboration. Designed to simplify complex workflows, it’s perfect for outlining business strategies, performance reviews, or team structures. Fully compatible with PowerPoint, Keynote, and Google Slides for easy editing and presentation.


12 slides
Geometric Shapes Design Slide Presentation
Make your content stand out with a bold, modern layout built from clean geometric forms that guide the viewer’s eye effortlessly. This presentation helps you organize ideas, highlight key points, and create a polished visual flow without distractions. Fully editable and compatible with PowerPoint, Keynote, and Google Slides.


5 slides
Business Innovation Strategy Presentation
Present a compelling Business Innovation Strategy with this modern infographic. Designed to highlight key insights, innovative solutions, and strategic approaches, this template is perfect for business professionals, consultants, and startups. Fully editable and compatible with PowerPoint, Keynote, and Google Slides.


5 slides
Global Market Trends World Map Presentation
Visualize your market insights with this sleek and professional Global Market Trends World Map slide. Designed to highlight key regional data with pinpoint accuracy, it’s ideal for presenting statistics, regional performance, or global expansion strategies. The sidebar gradient layout offers space for five categories, each linked to map locations. Fully customizable and compatible with PowerPoint, Keynote, and Google Slides.


4 slides
Professional Team Profiles and Roles Presentation
Showcase your team with impact using the Professional Team Profiles and Roles Presentation. Ideal for company introductions, this slide highlights key members with photo, name, title, and a brief role description. Clean, modern layout makes it easy to customize in PowerPoint, Canva, or Google Slides to match your brand.


6 slides
Sustainabilitiy Management Goals and Metrics Presentation
Make your sustainability story shine with a clean, modern presentation that highlights environmental goals, measurable results, and ongoing progress. Perfect for communicating corporate impact and performance data with clarity and purpose. Fully customizable and compatible with PowerPoint, Keynote, and Google Slides for a professional and visually engaging delivery.


4 slides
Differentiation through Blue Ocean Framework Presentation
Make waves with this bold, eye-catching layout built to show what sets your strategy apart. This presentation template explores how to stand out in untapped markets using a simple comparison framework, perfect for teams shifting from competition to innovation. Easily editable and ready for PowerPoint, Keynote, and Google Slides.


30 slides
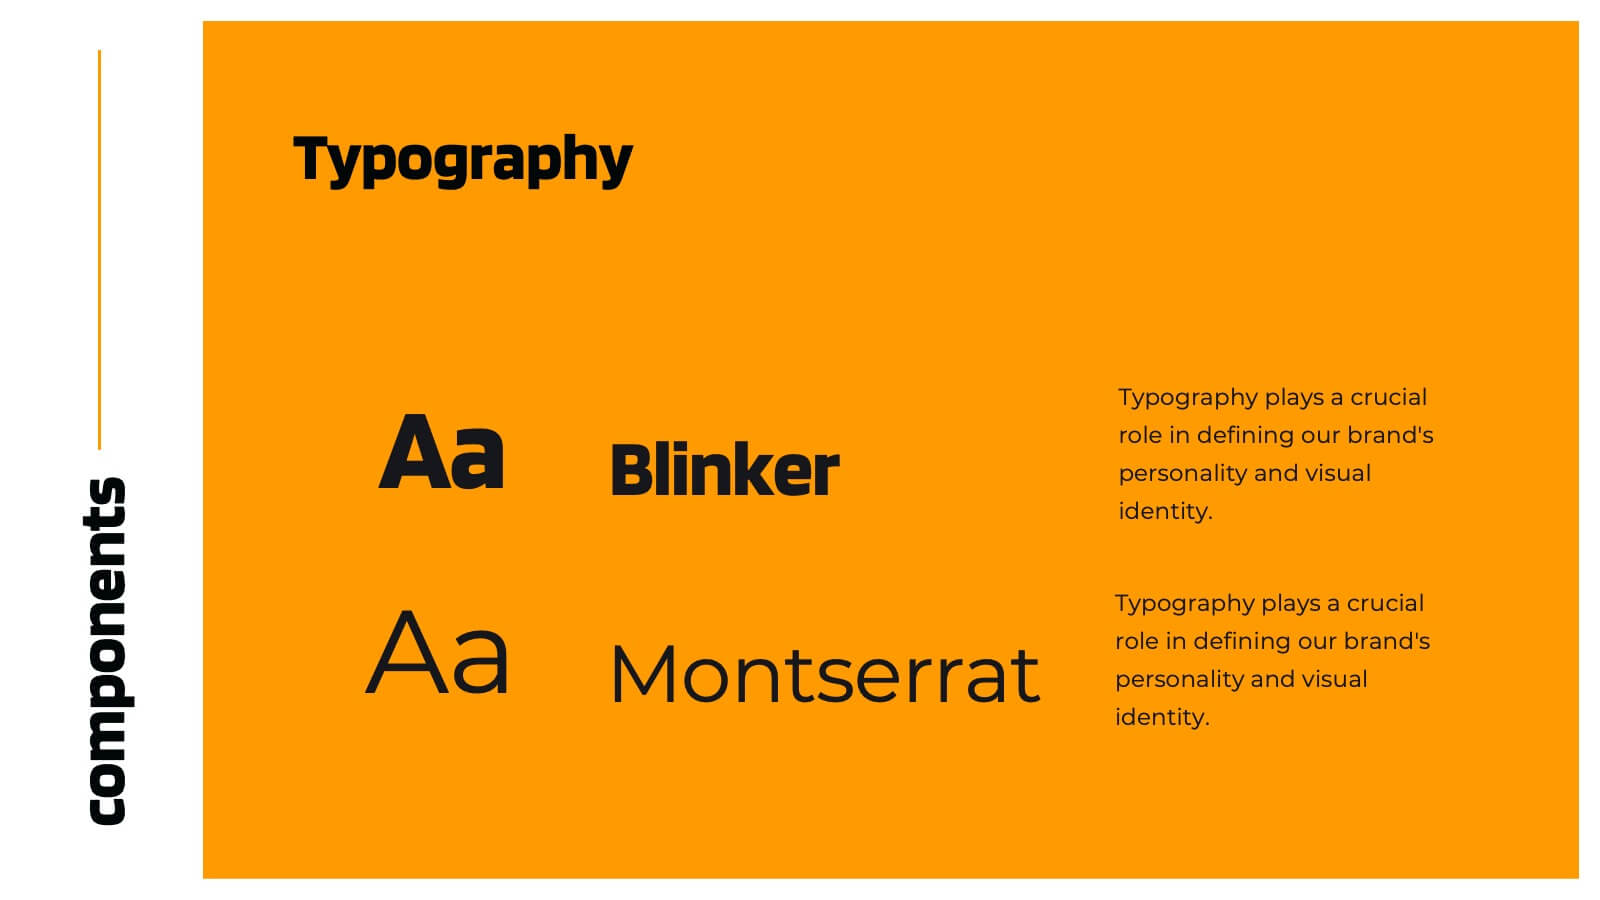
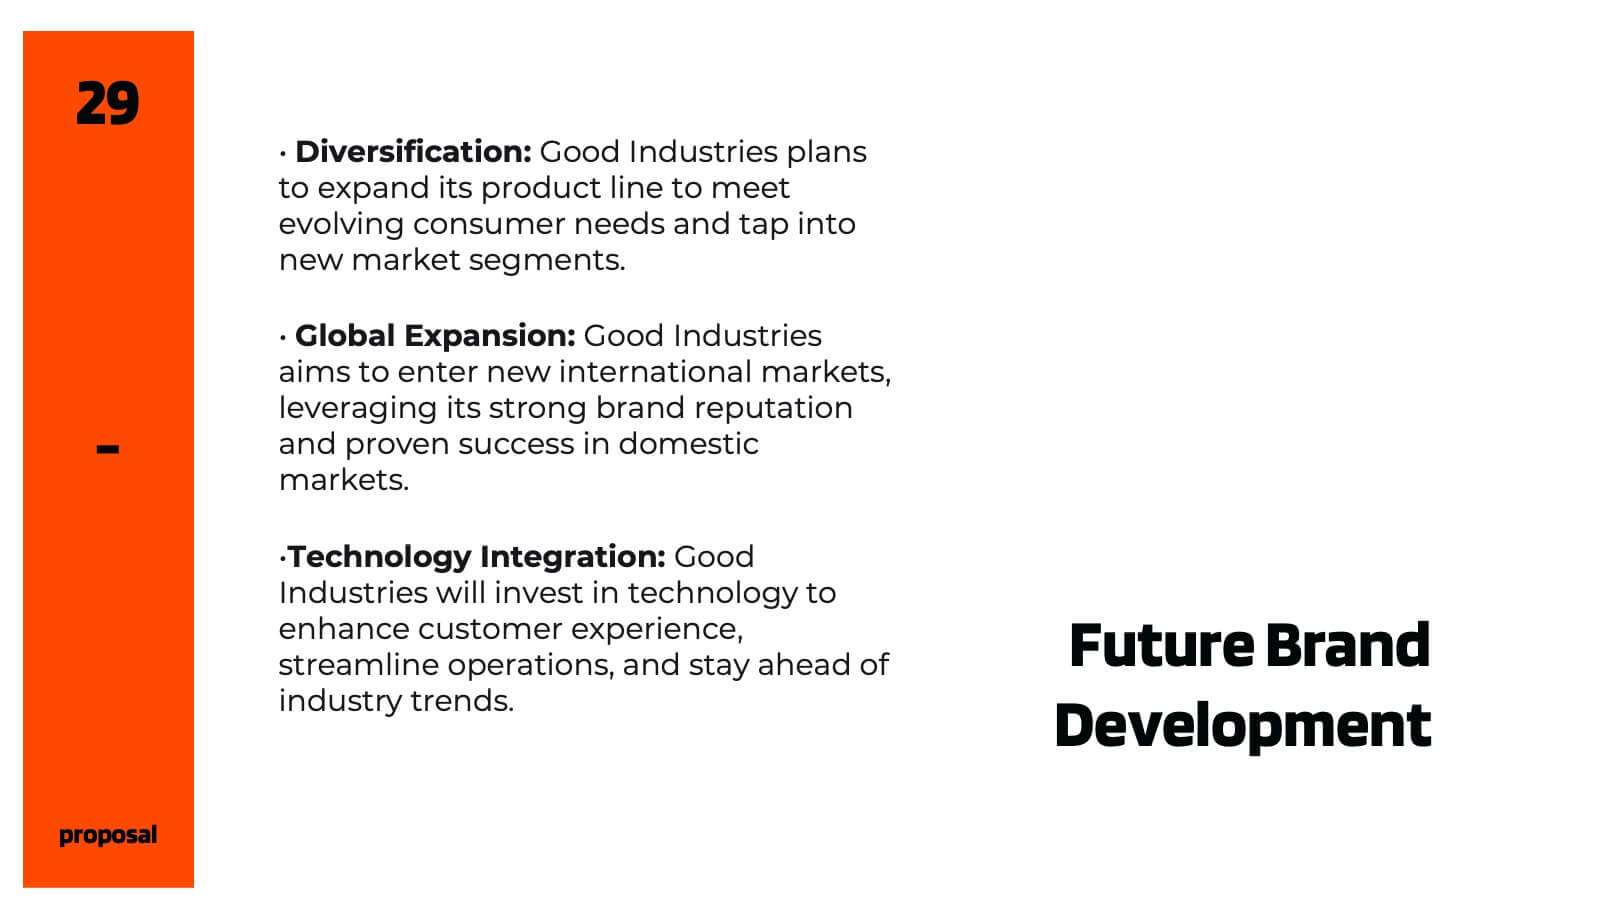
Chromalight Brand Guidelines Proposal Presentation
Elevate your brand's story with this visually engaging presentation template that embodies modern, professional aesthetics. From mission and vision statements to brand identity and market positioning, each slide is crafted to showcase your brand's core essence. Ideal for brand strategists and marketers, this template is compatible with PowerPoint, Keynote, and Google Slides.


26 slides
Ethical Business Practices Presentation
Promote integrity with our Ethical Business Practices presentation template, suitable for PowerPoint, Keynote, and Google Slides. This essential tool is crafted for business leaders, compliance officers, and educators who aim to reinforce the importance of ethics in the corporate environment. Our template facilitates a clear understanding of ethical standards in business operations. It includes slides on ethical decision-making, corporate governance, social responsibility, and the long-term benefits of maintaining high ethical standards. With customizable layouts, you can present real-world scenarios, ethical frameworks, and company policies that illustrate your commitment to ethical conduct. This SEO-optimized template is key for reaching audiences interested in building trust and credibility through responsible business practices. Use this template to lead discussions on ethics, influence corporate culture positively, and showcase how ethical behavior is not just right but also beneficial for business success.