


Features
- 8 Unique slides
- Fully editable and easy to edit in Microsoft Powerpoint, Keynote and Google Slides
- 16:9 widescreen layout
- Clean and professional designs
- Export to JPG, PDF or send by email


Do you have any questions?
Recommend


21 slides
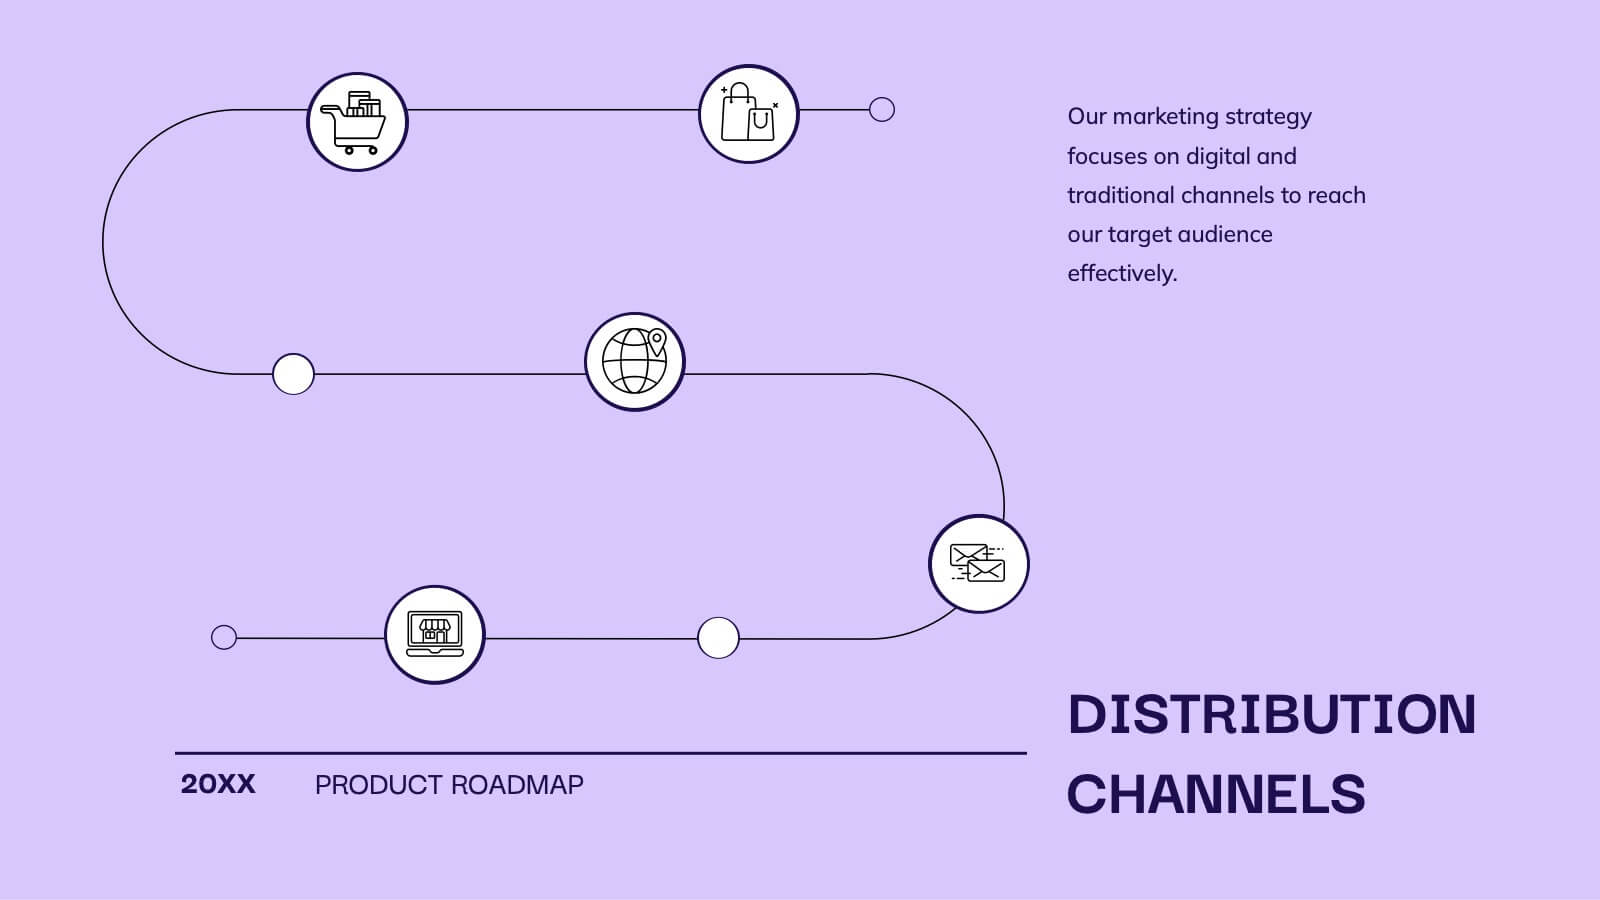
Glimmer Product Roadmap Presentation
Illuminate your product's future with this vibrant glimmer-themed presentation template! Perfect for outlining your product roadmap, it allows you to present key milestones, features, and timelines in a visually engaging way. Captivate your audience and keep them informed about your exciting journey ahead. Compatible with PowerPoint, Keynote, and Google Slides.


5 slides
Core to Outer Ring Concentric Planning Presentation
Present your strategy from the inside out with the Core to Outer Ring Concentric Planning Presentation. This layered, radial design guides viewers through a central concept outward into supporting elements—ideal for planning, process modeling, or decision frameworks. Fully customizable in PowerPoint, Keynote, and Google Slides.


27 slides
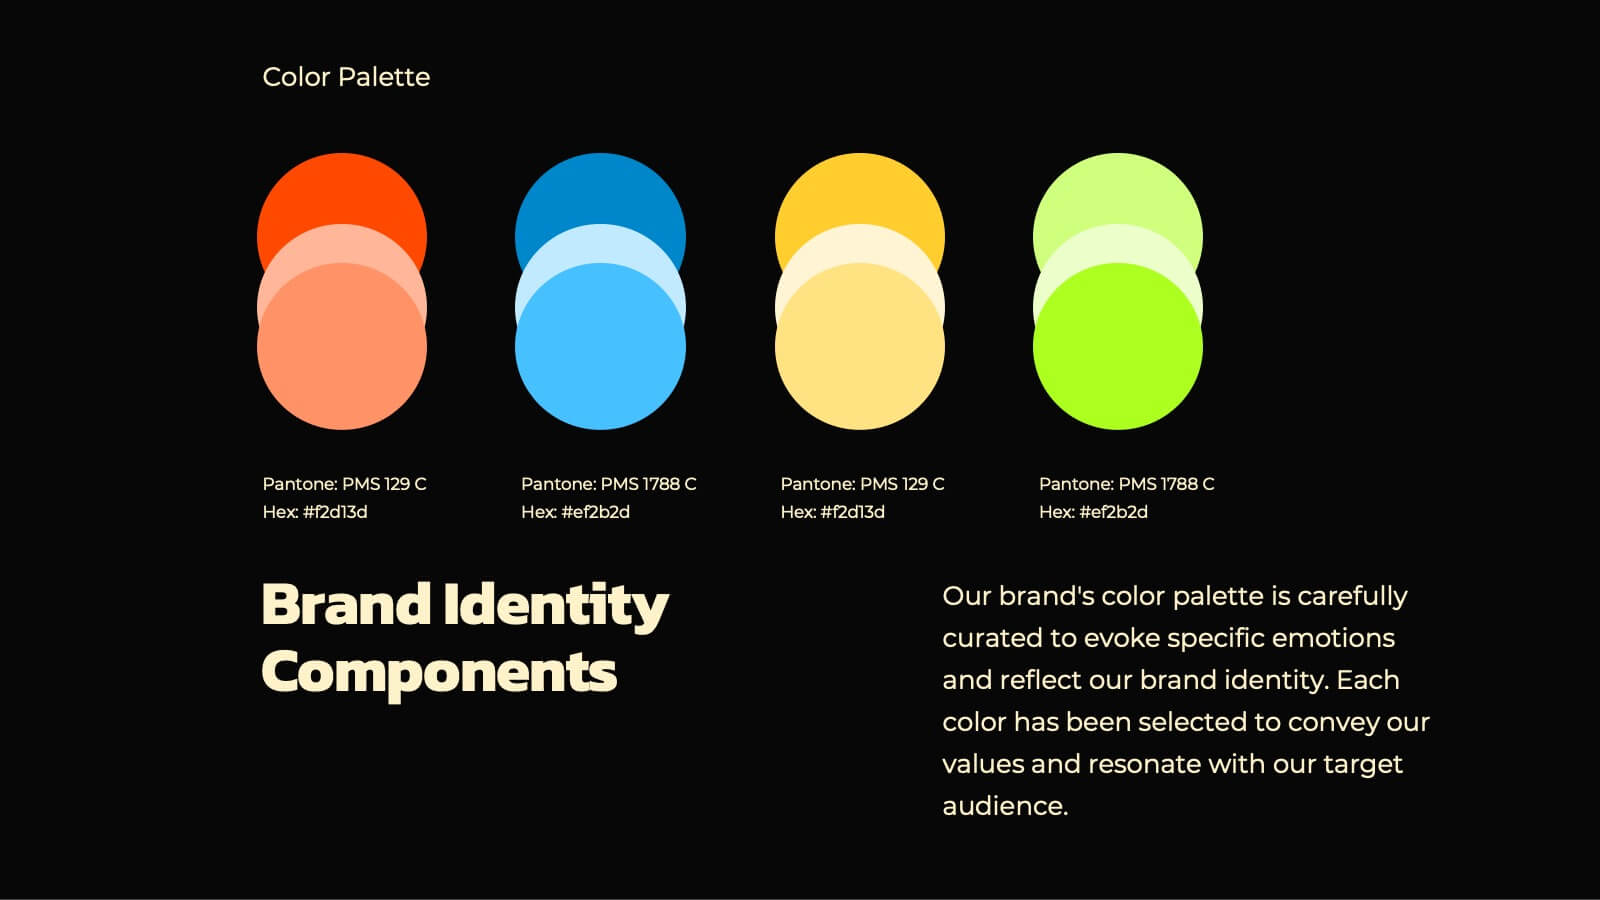
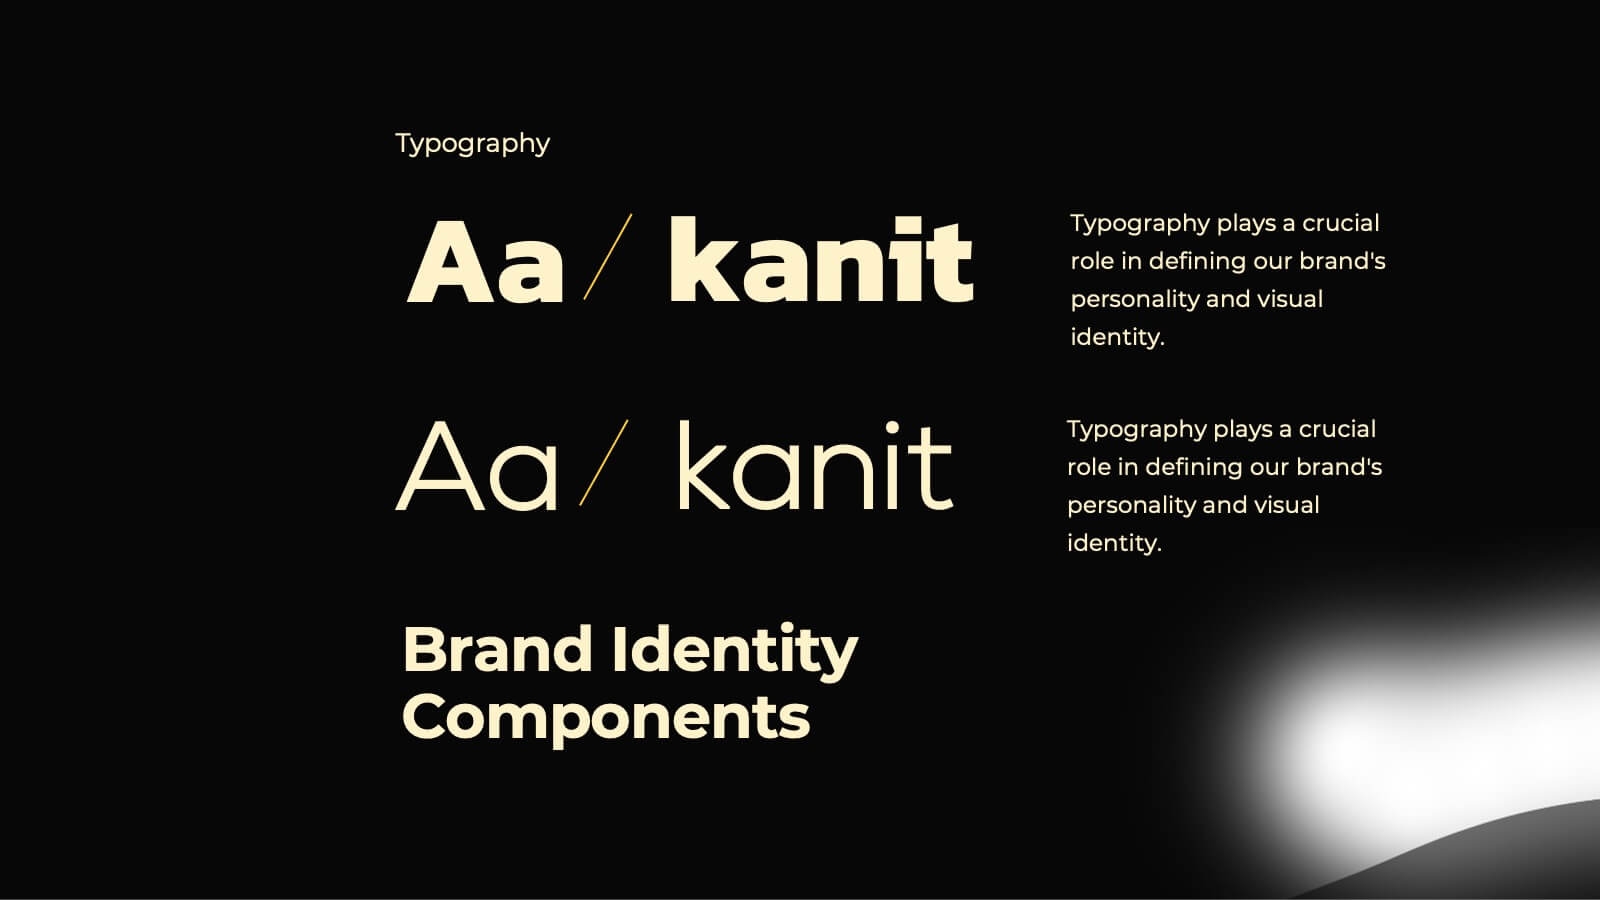
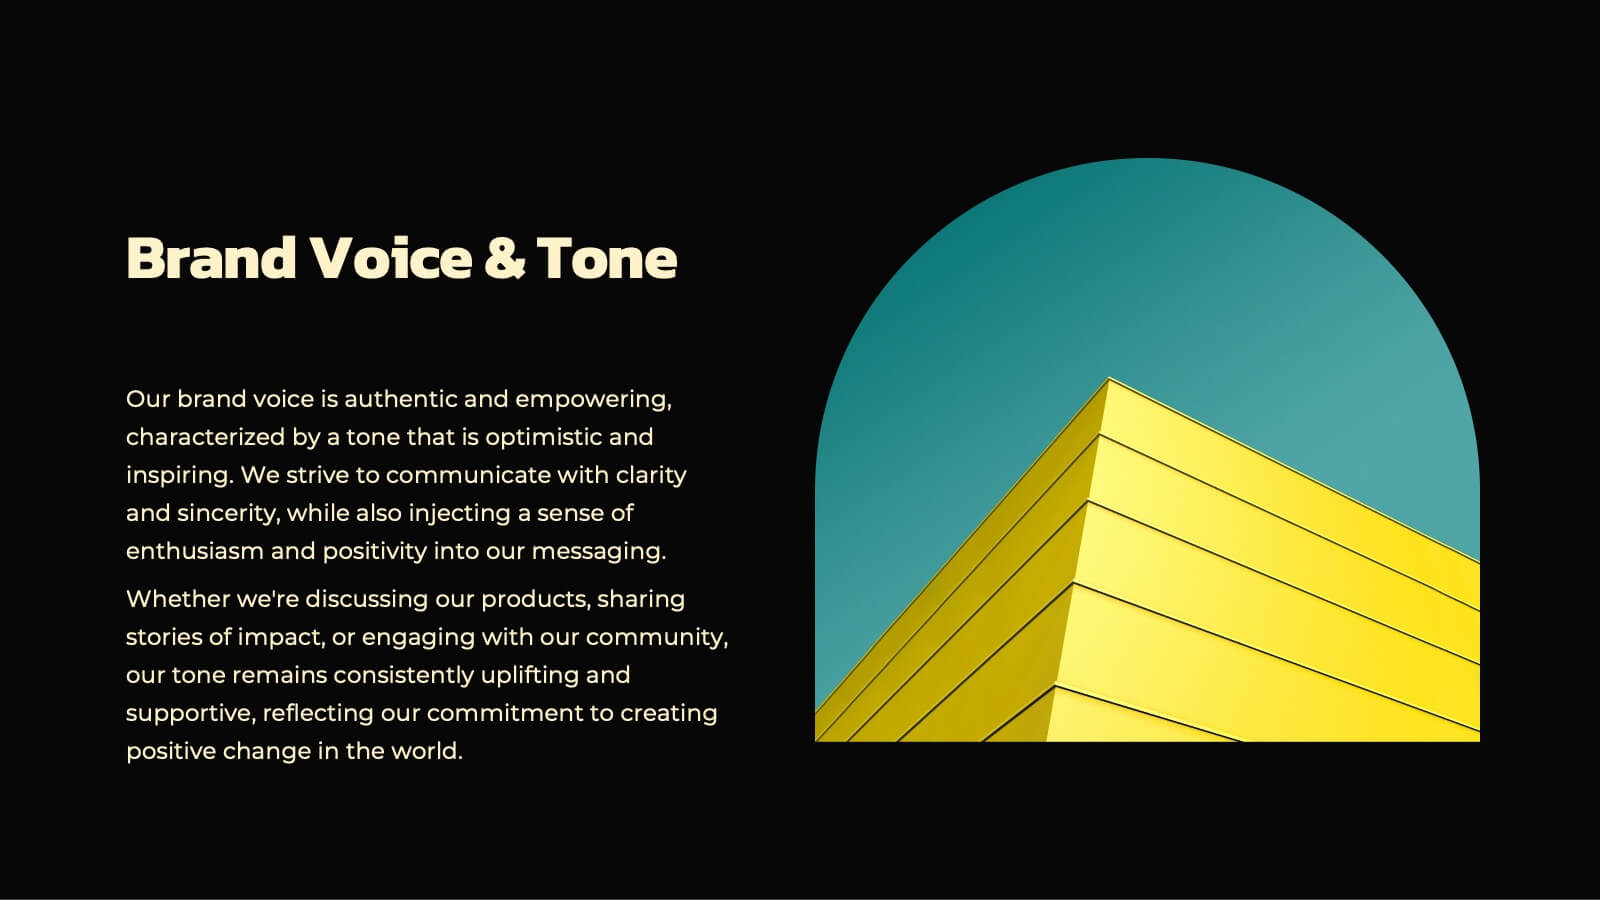
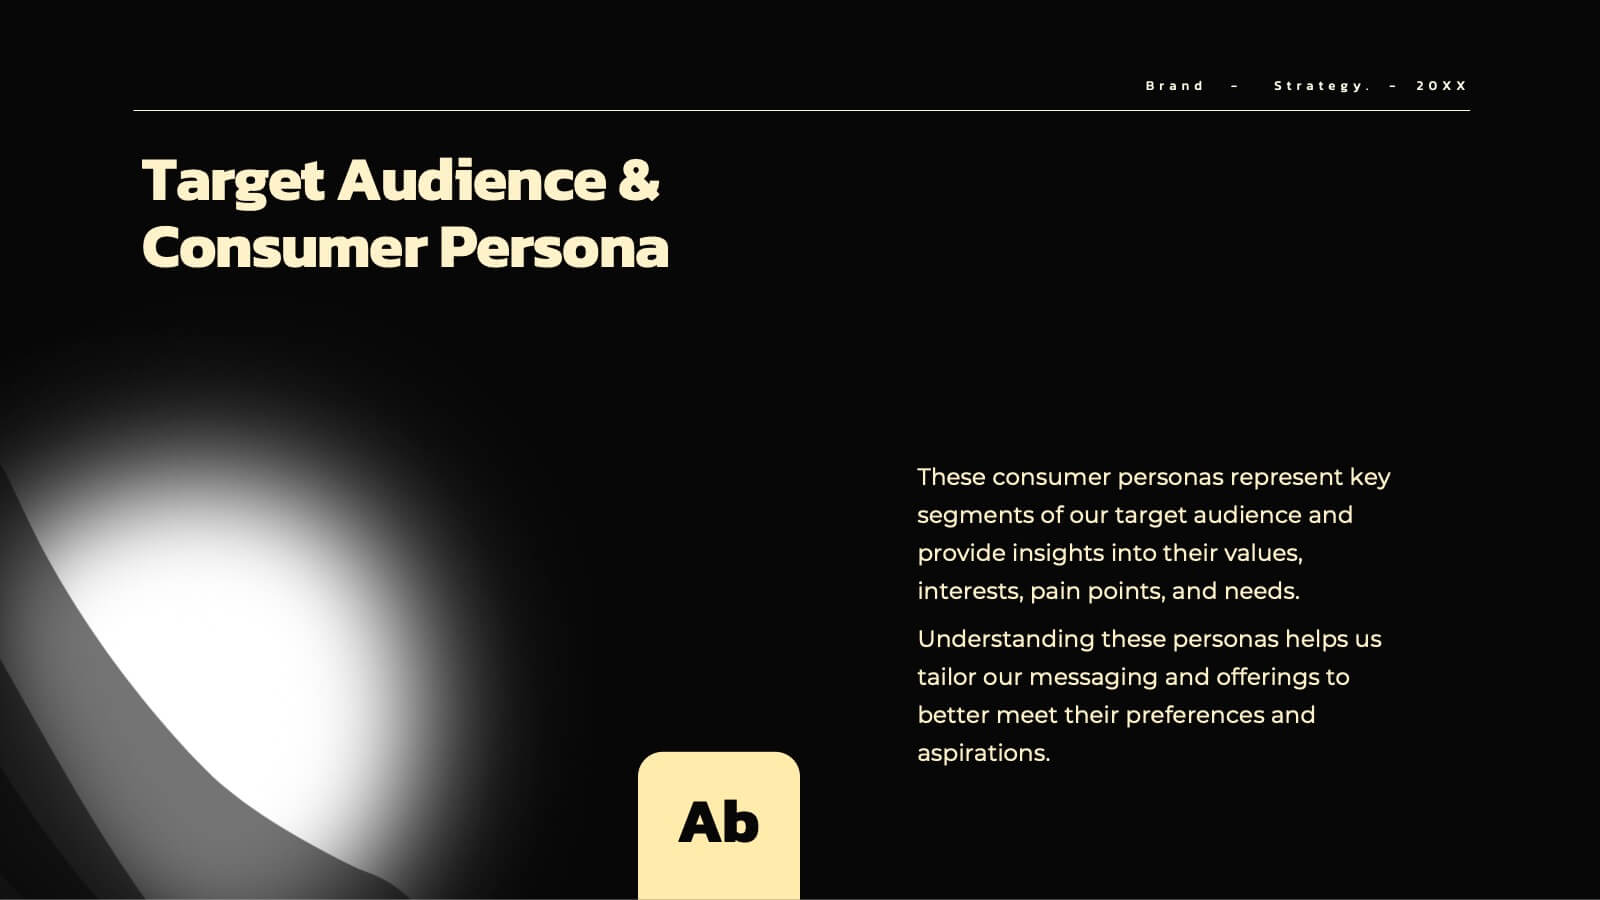
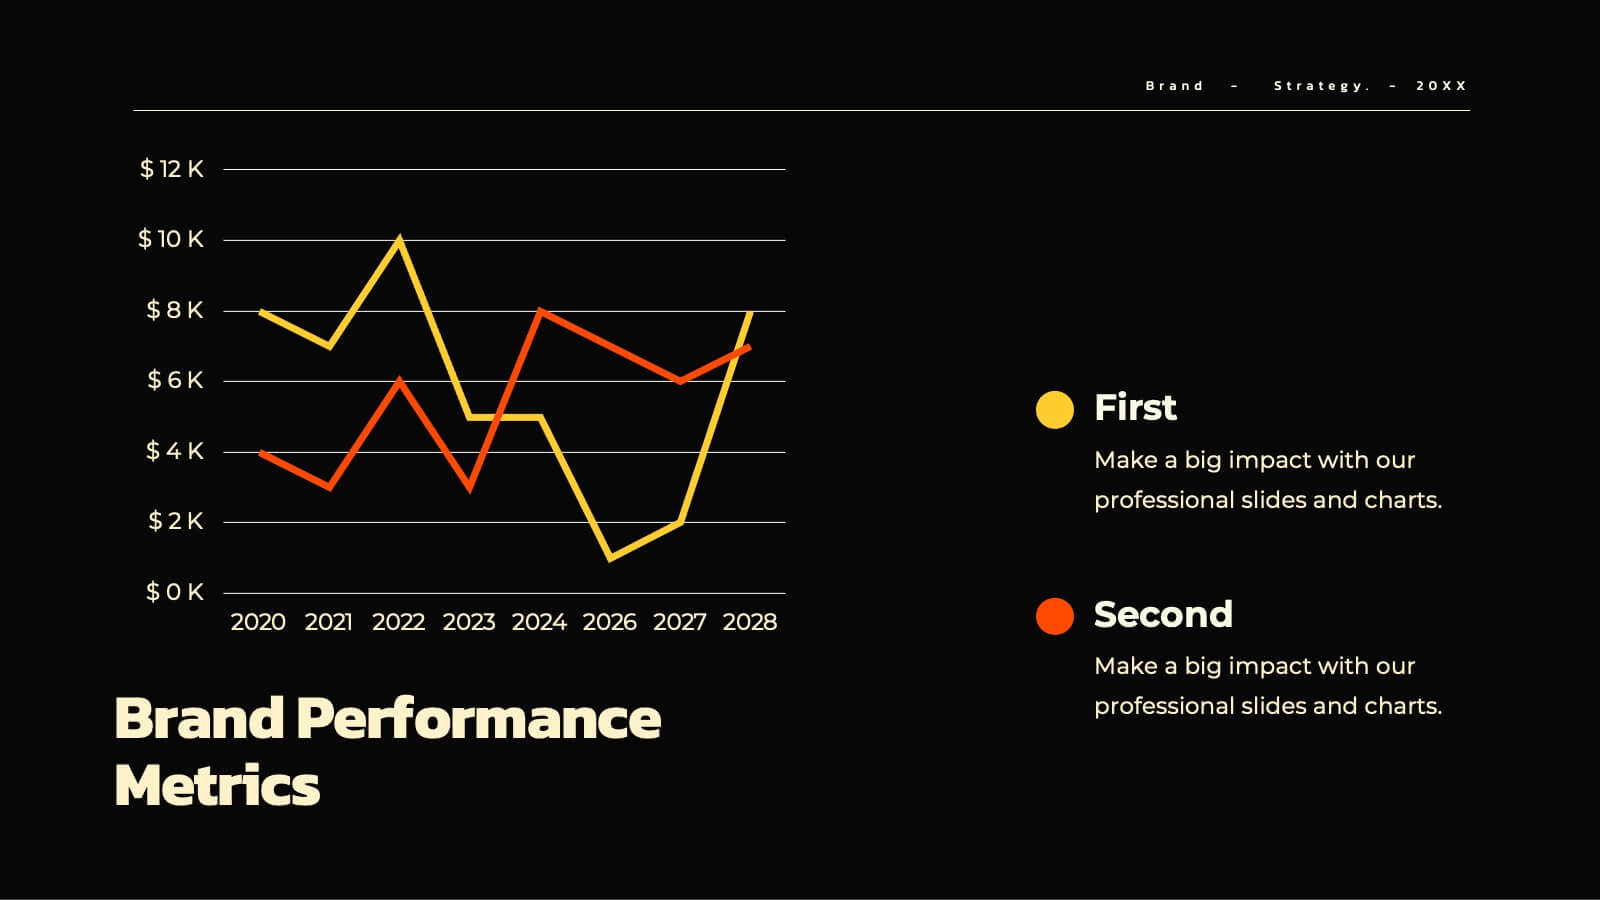
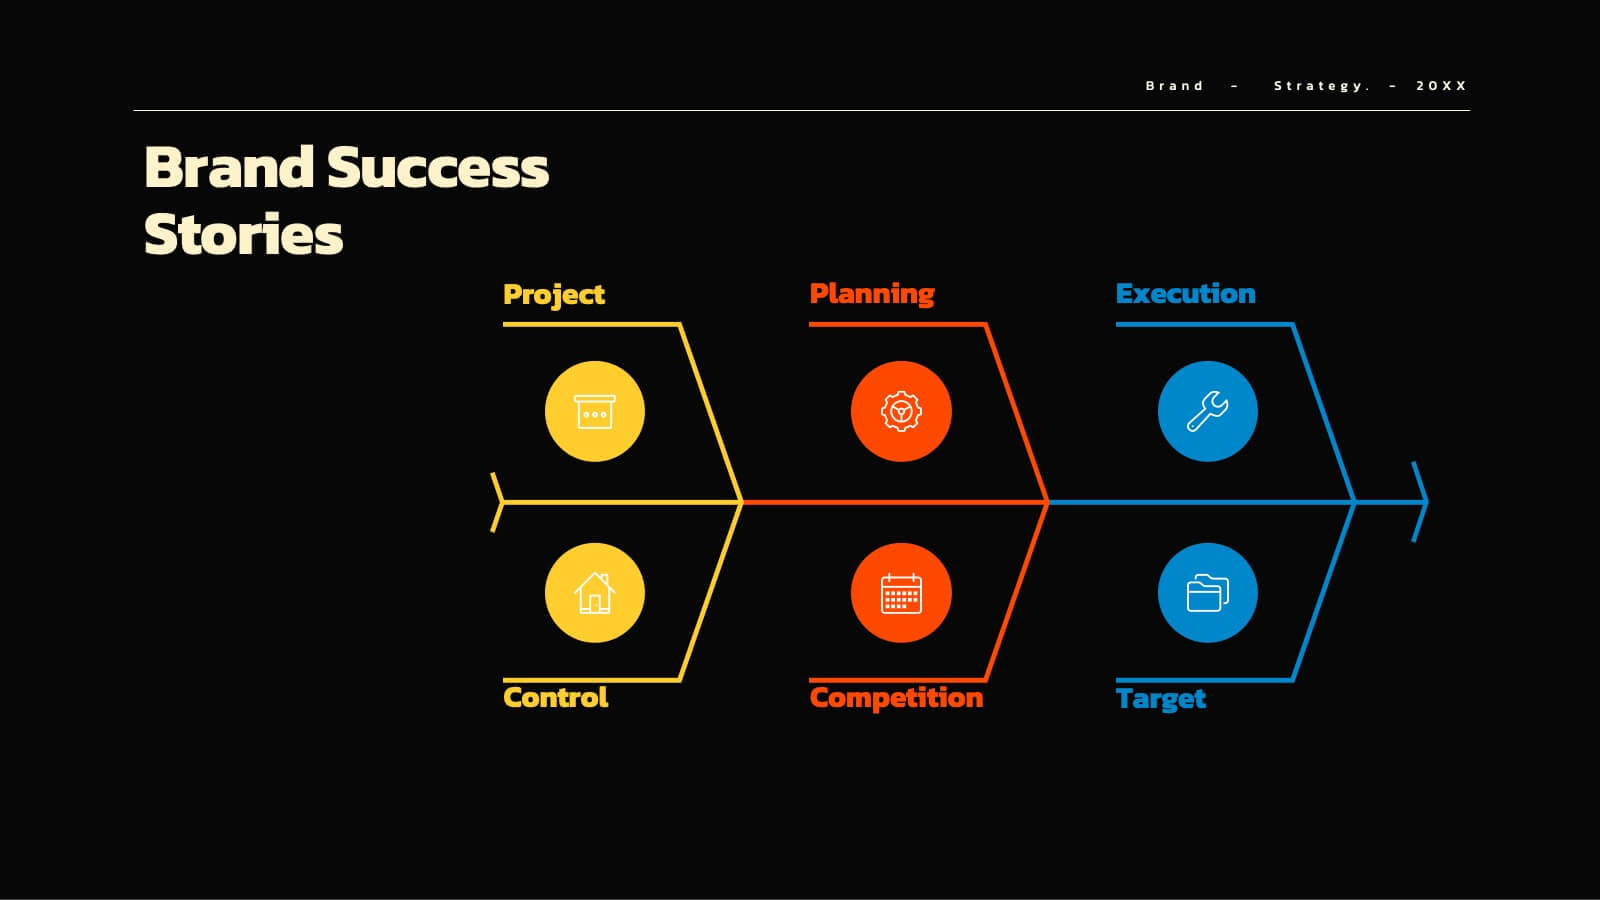
Aqua Brand Strategy Report Presentation
Make waves with this fresh, aqua-inspired presentation template, perfect for delivering a standout brand strategy report! Designed to help you showcase your brand's vision, market positioning, and strategic goals, it features a clean, modern layout that grabs attention. Compatible with PowerPoint, Keynote, and Google Slides for effortless customization.


8 slides
3-Part Business Triangle Diagram
Showcase interconnected ideas or processes with this clean 3-part triangle layout. Ideal for illustrating strategies, relationships, or project phases in a clear and visually engaging way. Fully customizable in PowerPoint, Keynote, and Google Slides for seamless editing.


5 slides
Impacts of Fake News Infographics
Fake News refers to deliberately false or misleading information presented as factual news. The spread of fake news can have significant impacts on individuals, society, and even the democratic process. With this infographic template, you can effectively communicate the far-reaching consequences of fake news and encourage critical thinking and media literacy. Whether you're presenting to a classroom, sharing on social media, or creating educational materials, this template serves as a powerful tool to raise awareness and promote responsible consumption of information in the digital era. Compatible with Powerpoint, Keynote, and Google Slides.


6 slides
Cryptocurrency Analysis Infographics
Analyze cryptocurrency effectively with our Cryptocurrency Analysis infographic template. This template is fully compatible with popular presentation software like PowerPoint, Keynote, and Google Slides, allowing you to easily customize it to illustrate and communicate various aspects of cryptocurrency analysis. The Cryptocurrency Analysis infographic template offers a visually engaging platform to explore and explain the key elements of analyzing cryptocurrencies, including market trends, technical analysis, fundamental analysis, and investment strategies. Whether you're a cryptocurrency enthusiast, trader, or investor, this template provides a user-friendly canvas to create informative presentations and educational materials. Enhance your cryptocurrency knowledge and analysis skills with this SEO-optimized Cryptocurrency Analysis infographic template, thoughtfully designed for clarity and ease of use. Customize it to showcase cryptocurrency charts, indicators, risk management techniques, and insights into the volatile world of digital assets, ensuring that your audience gains valuable insights into this evolving field. Start crafting your personalized infographic today to become a more proficient cryptocurrency analyst.


5 slides
Strategic Planning with Concentric Circles Presentation
Visualize Your Strategy with Clarity using this Strategic Planning with Concentric Circles Presentation template. Designed to illustrate layered processes, decision-making frameworks, and business growth strategies, this concentric model helps communicate core ideas with structured, expanding details. Fully customizable and compatible with PowerPoint, Keynote, and Google Slides, this template is perfect for business leaders, strategists, and consultants aiming for clear and impactful presentations.


6 slides
Numeric Data Slide Layout Presentation
Bring your numbers to life with a clean, flowing visual that turns data into an easy-to-follow story. This presentation guides viewers through each step of your process, helping them understand key insights without overwhelm. Ideal for analytics, reporting, and planning. Fully compatible with PowerPoint, Keynote, and Google Slides.


10 slides
AIDA Model Explained with Graphics Presentation
Bring your message to life with a dynamic visual flow that guides viewers through each stage of your communication strategy in a clear, compelling way. This presentation breaks complex concepts into simple steps, helping audiences follow your narrative effortlessly. Fully customizable and compatible with PowerPoint, Keynote, and Google Slides.


5 slides
Business Development Five-Step Plan Presentation
Accelerate your growth with the Business Development Five-Step Plan presentation. This structured template guides you through key stages of business expansion, from strategy to execution. Designed for entrepreneurs, startups, and corporate teams, this clear and engaging format ensures effective planning and communication. Fully customizable for PowerPoint, Keynote, and Google Slides to fit your specific needs.


7 slides
Project Status Summary Infographic
A Project Status Summary is an overview or report that provides key information about the progress, performance, and current state of a project. This infographic template is a visual tool designed to provide a quick and comprehensive overview of your project's progress, empowering you to track milestones, anticipate roadblocks, and ensure project success. This template is ideal for project management and communication, allowing stakeholders to quickly grasp the project's status without delving into detailed project documents. The goal of this Project Status is to present a snapshot of your project's progress in an easily understandable format.


23 slides
Lexicon Startup Pitch Deck Template Presentation
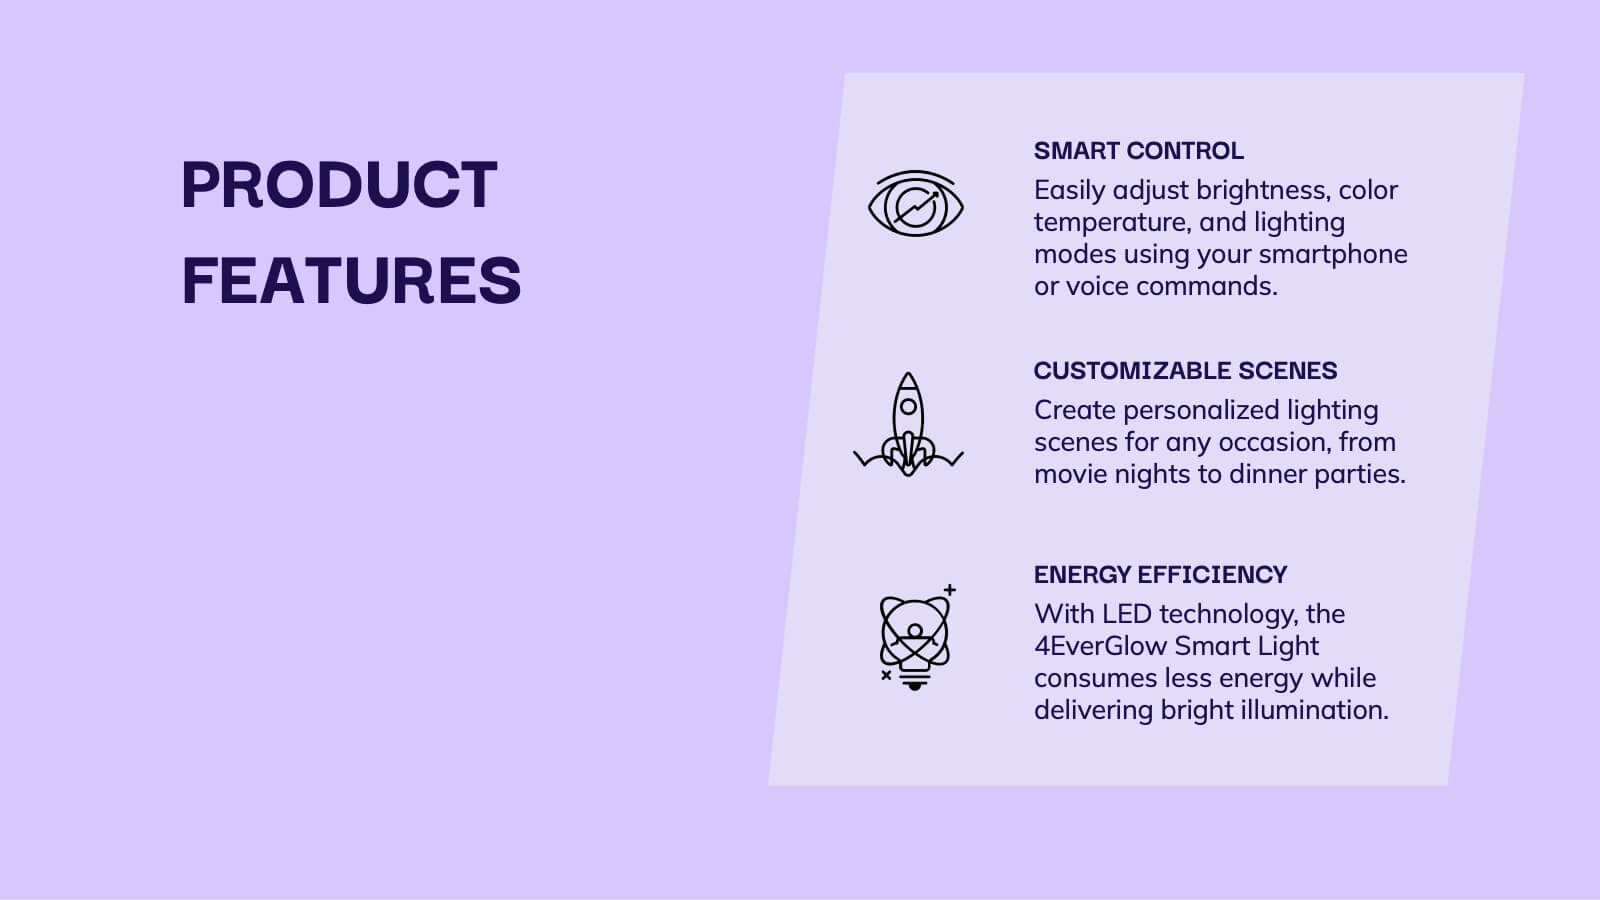
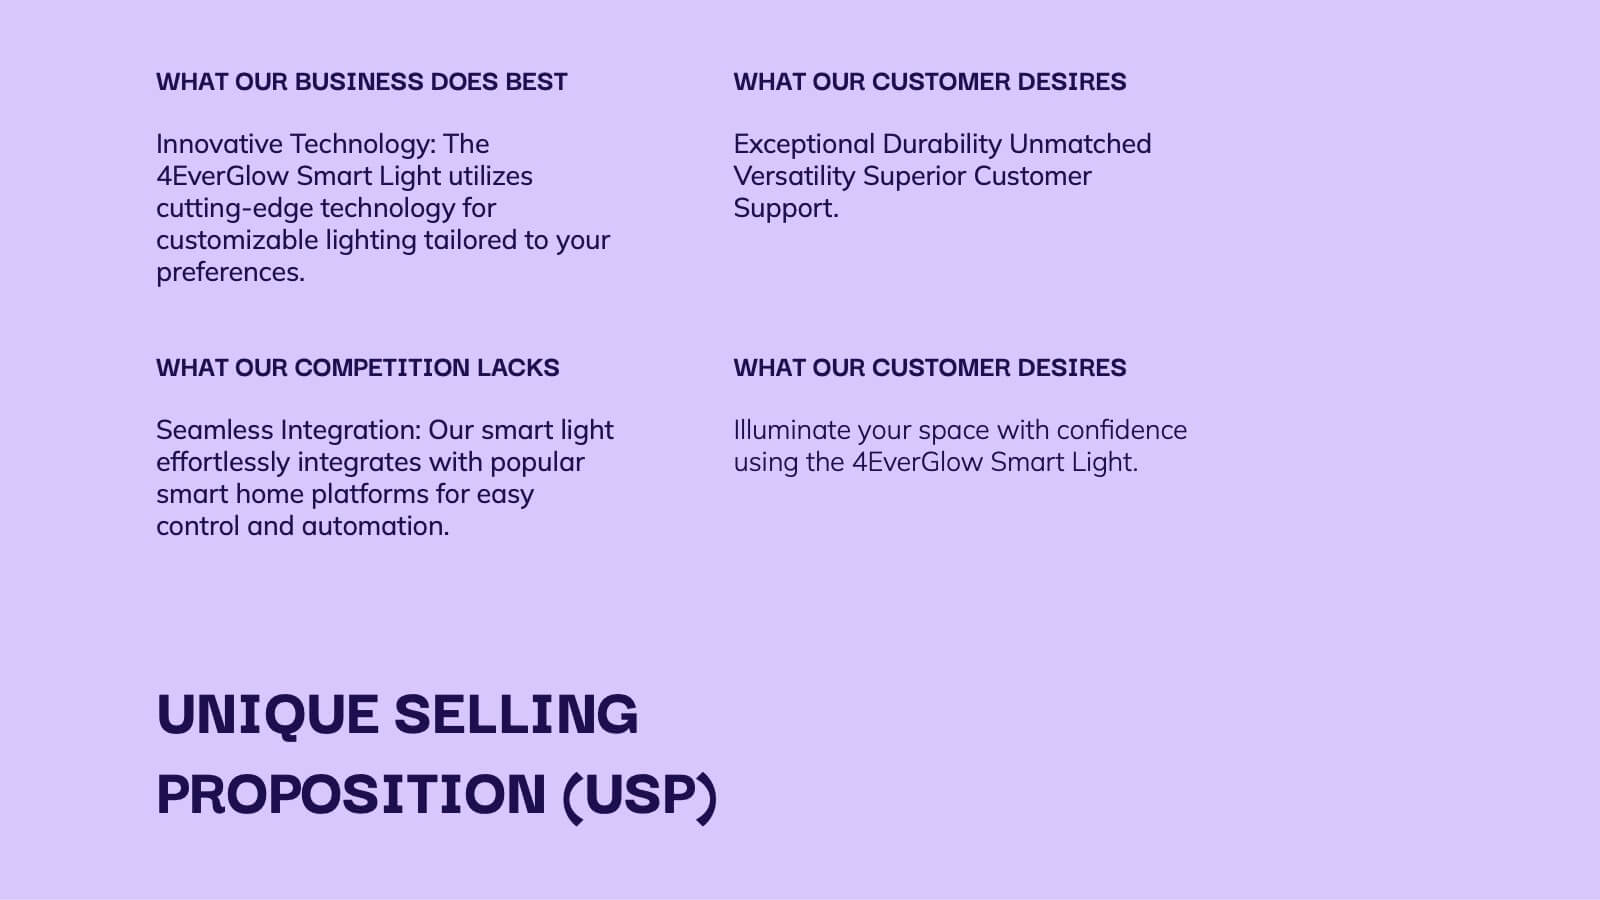
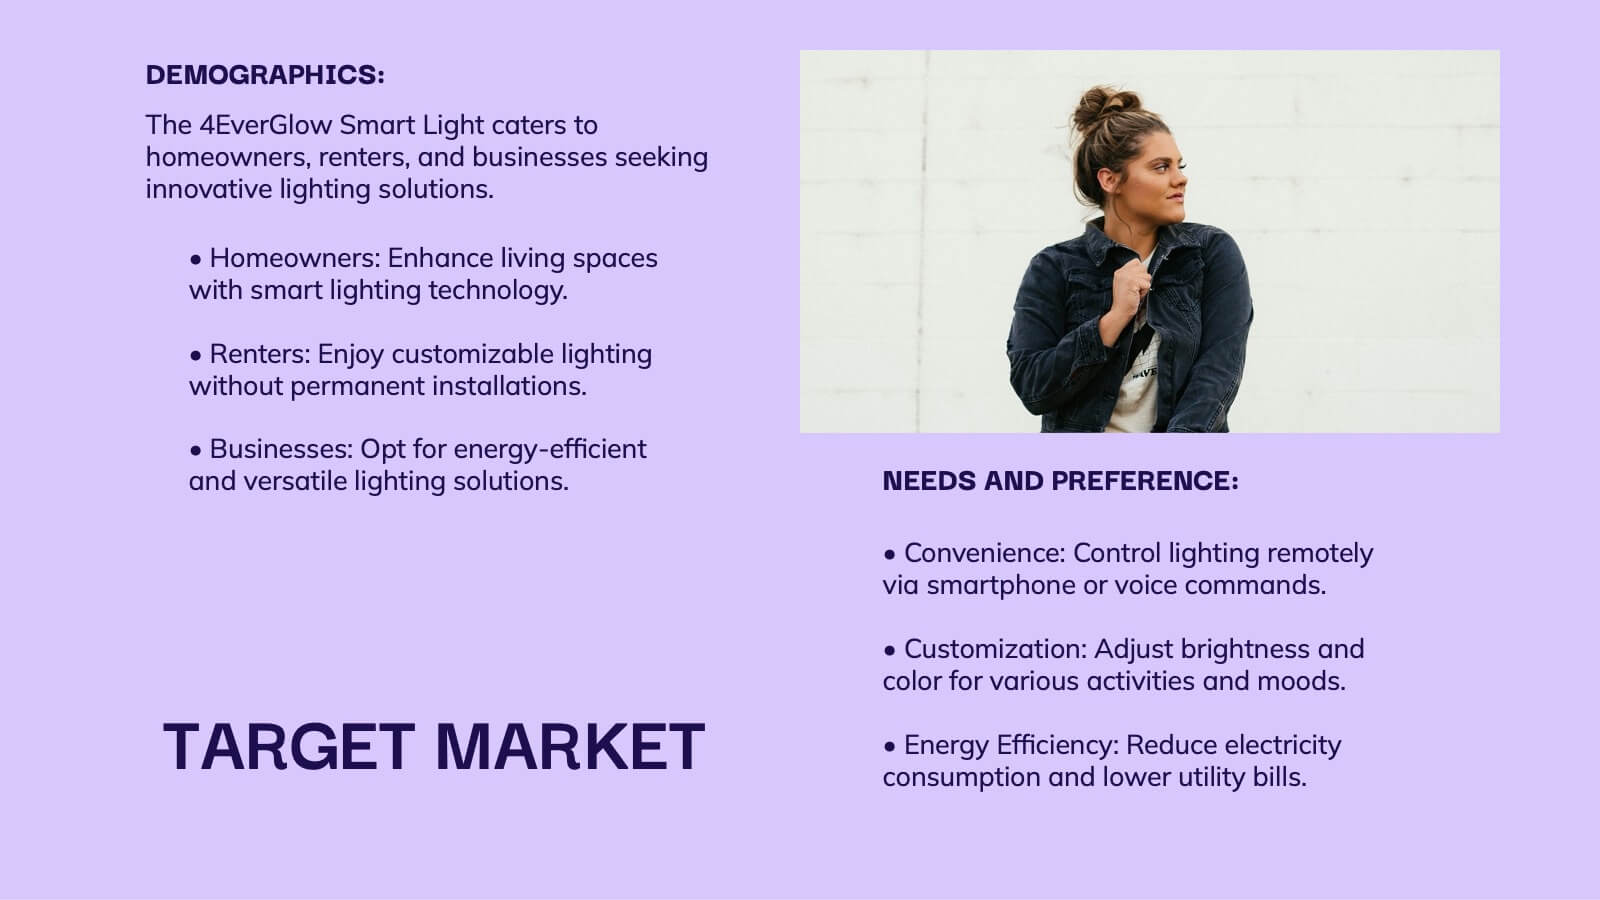
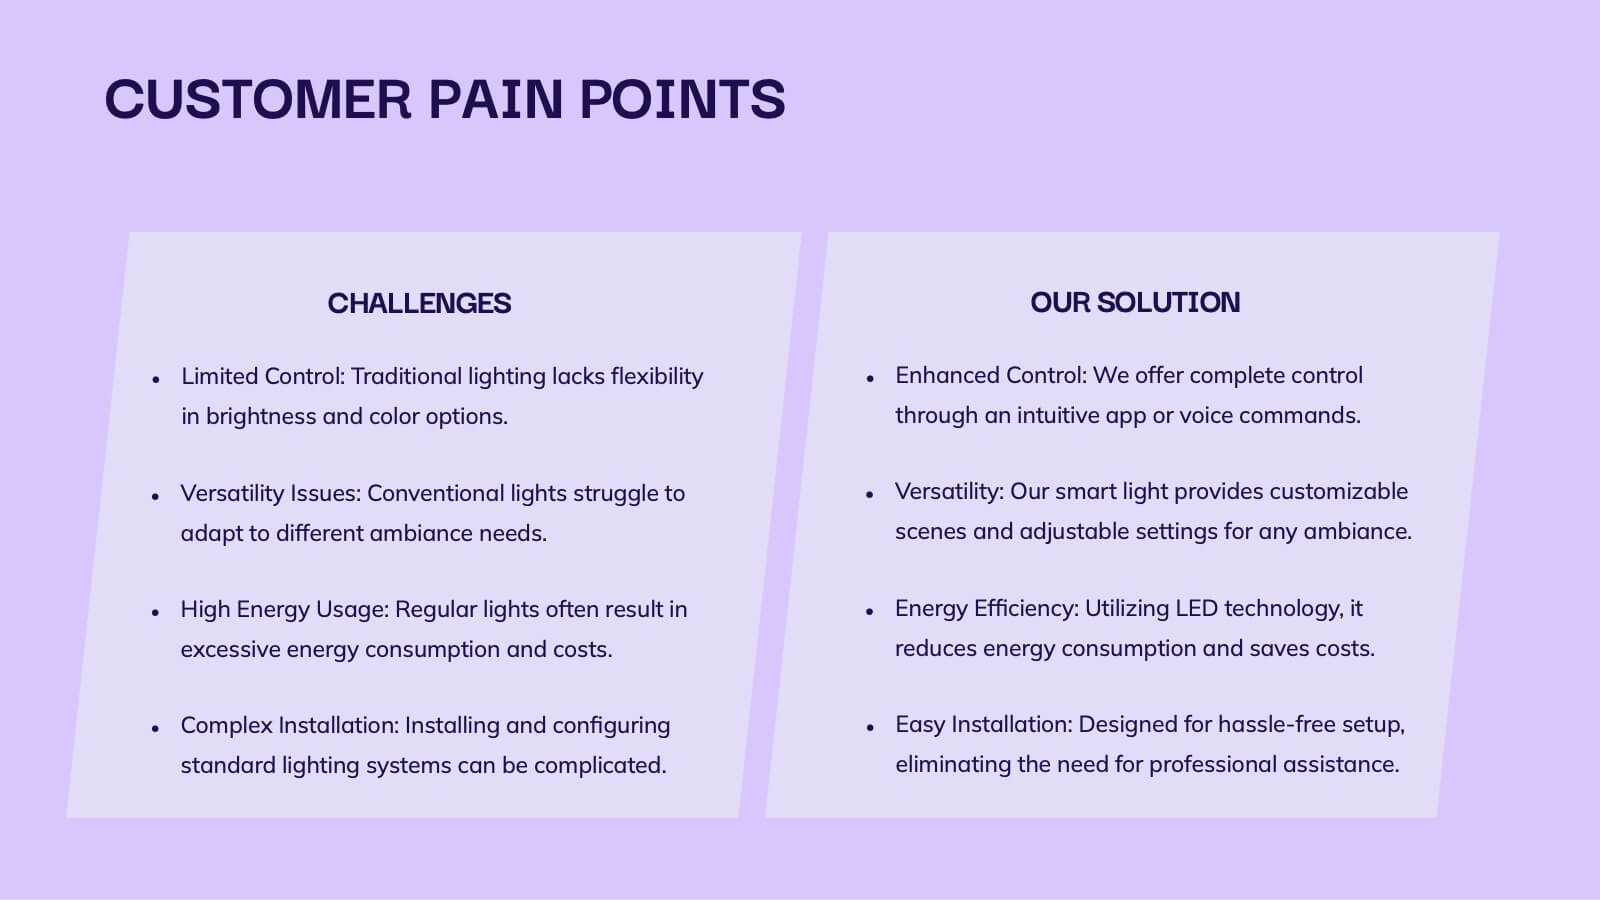
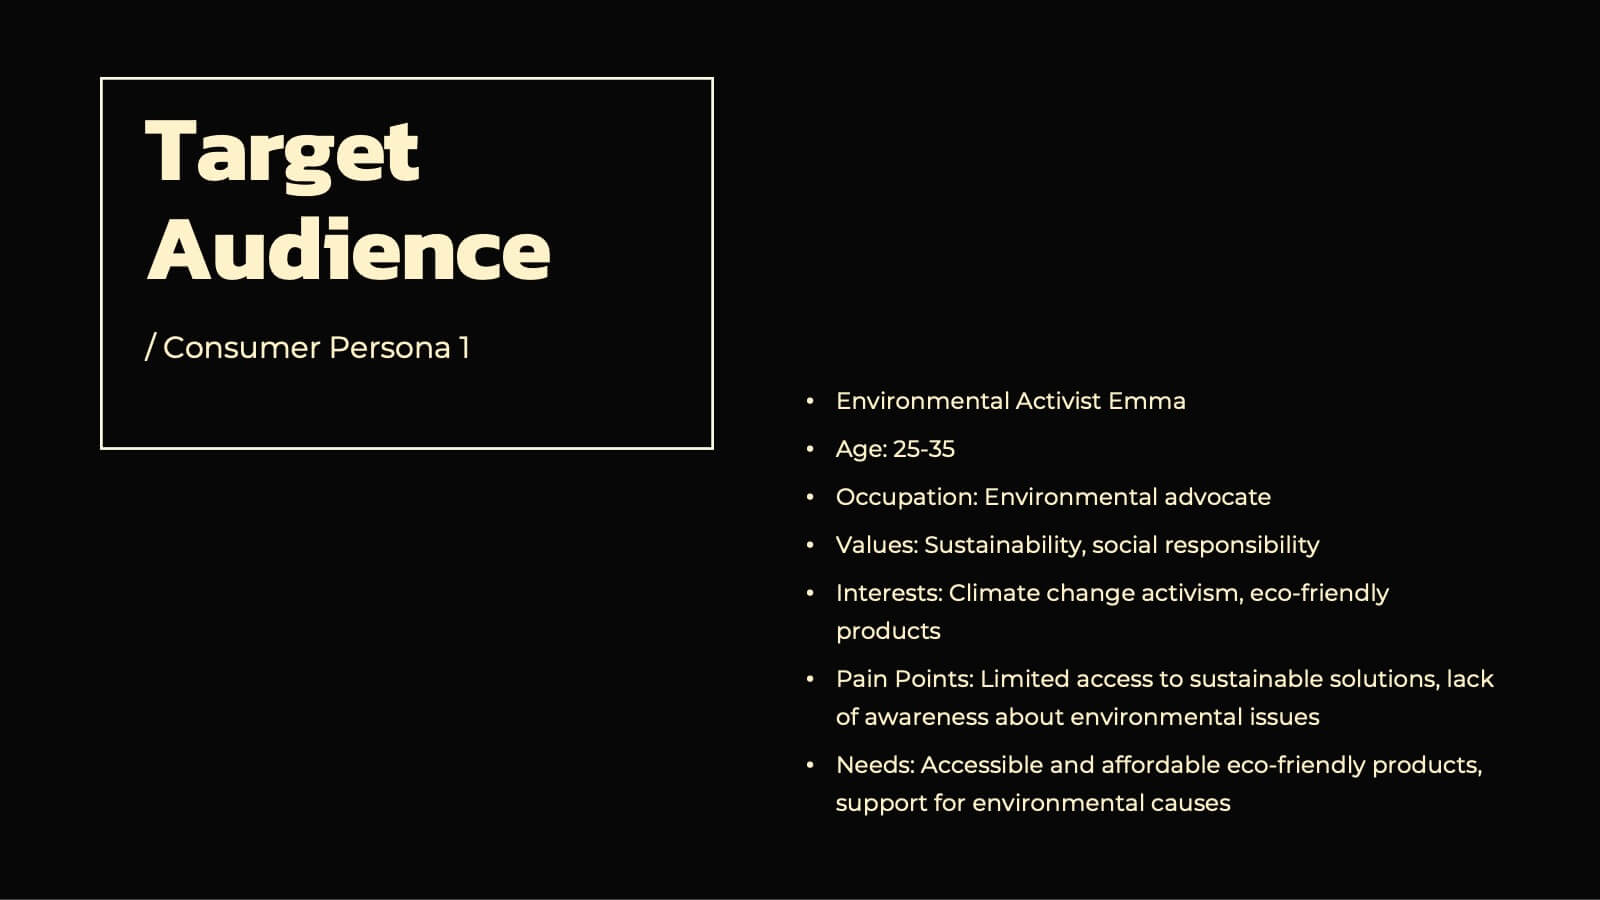
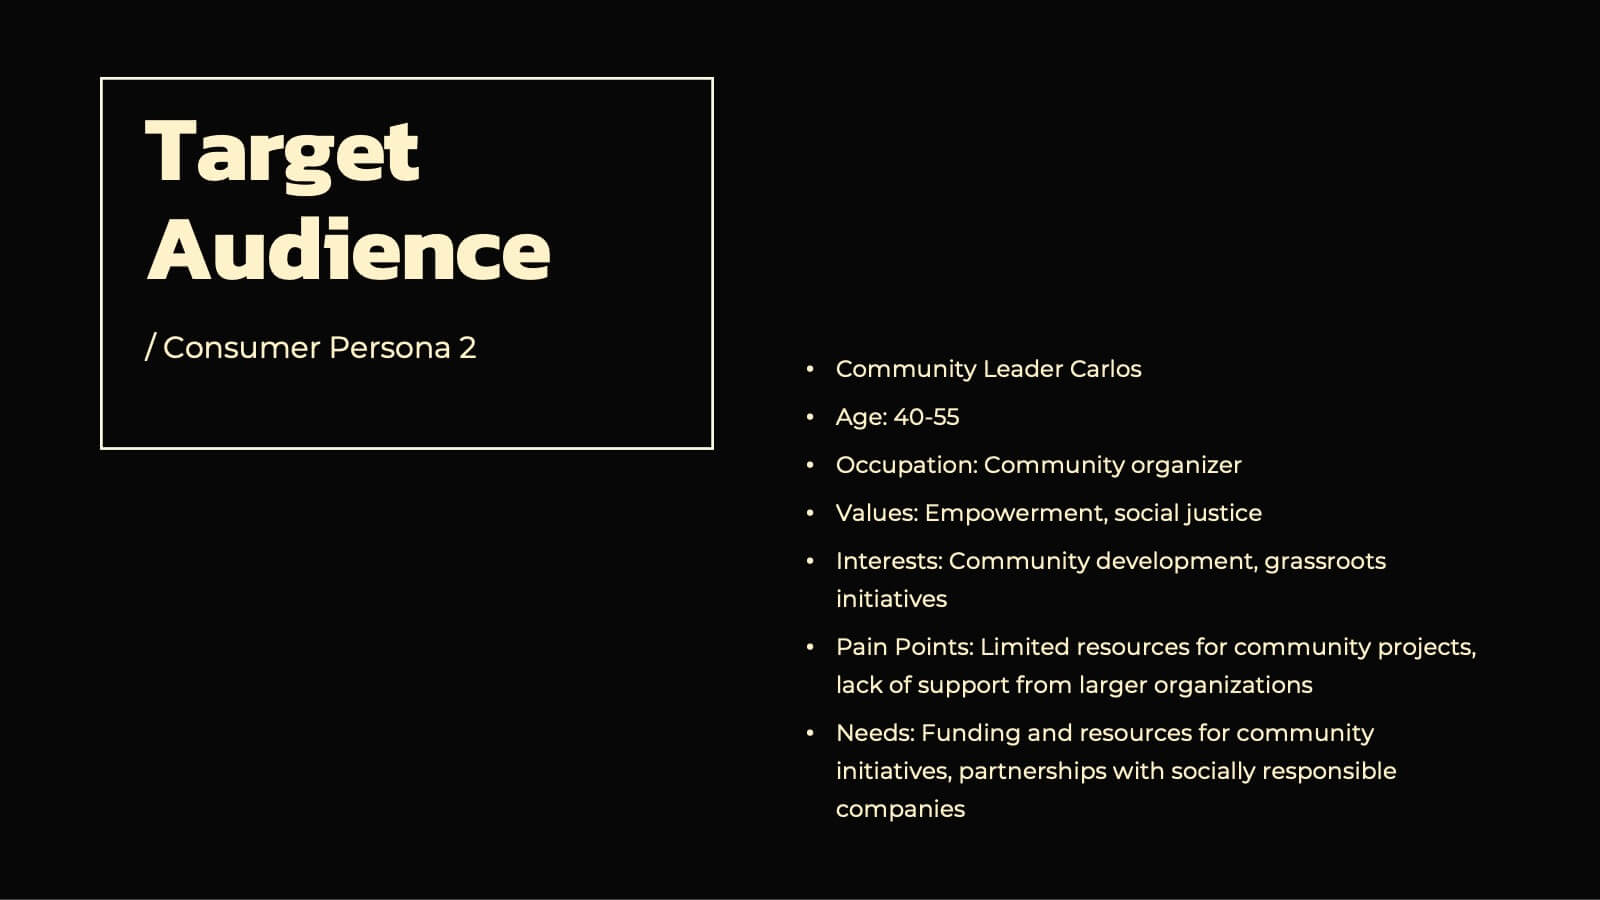
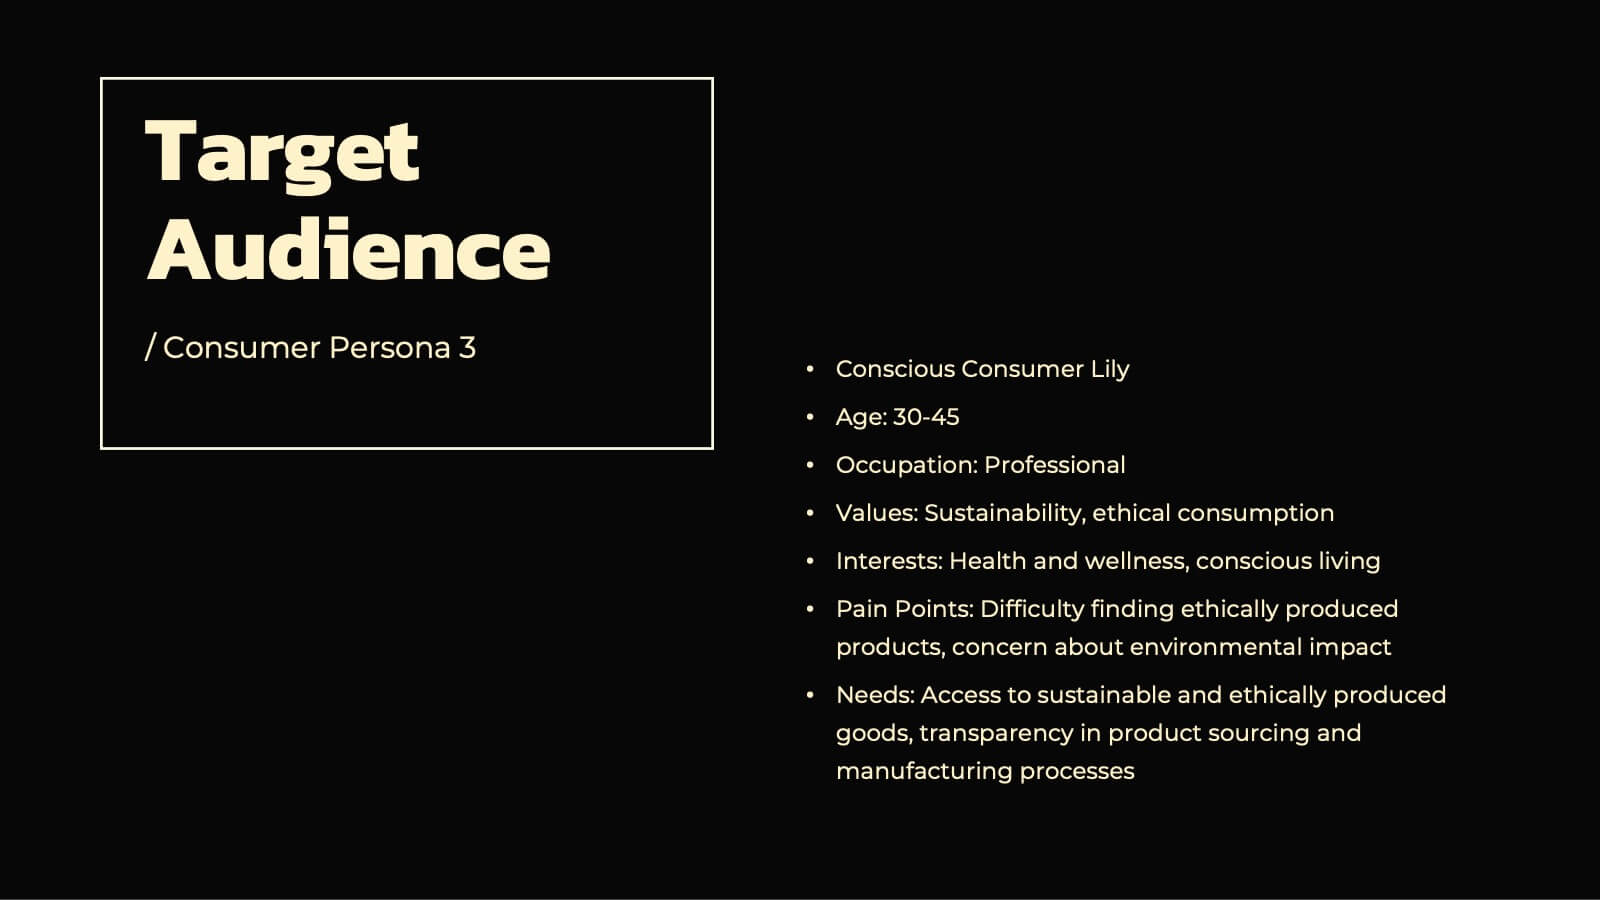
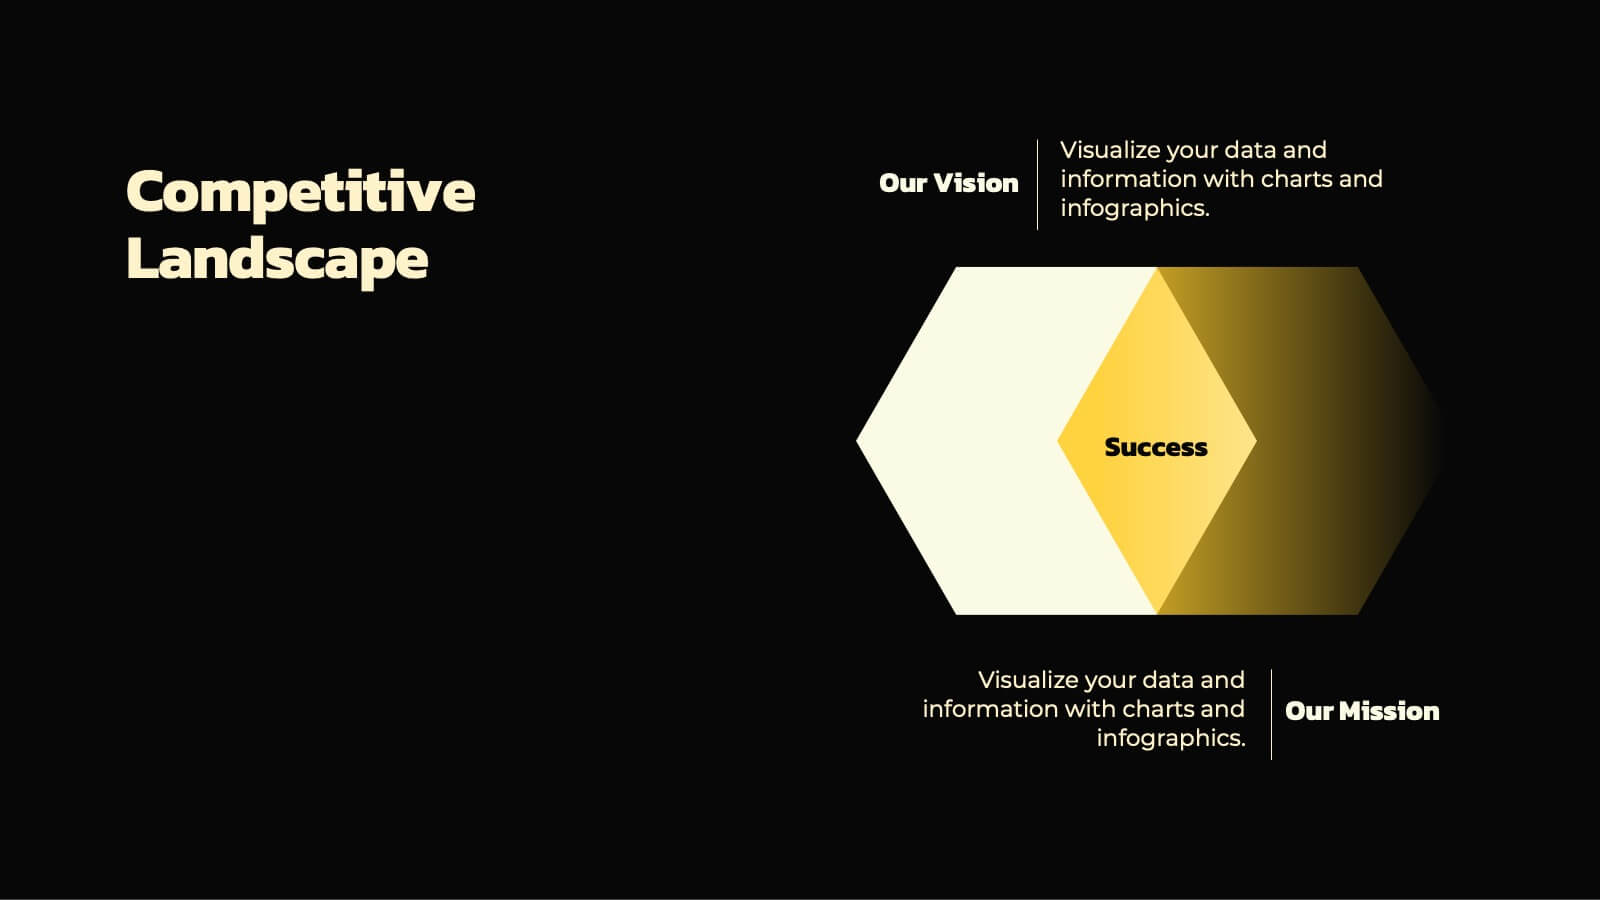
The Startup Pitch Deck Presentation Template provides a modern and professional design with 23 fully customizable slides, ideal for startups seeking funding or presenting their business idea. Key sections include company overview, problem statement, solution, market opportunity, business model, and unique selling proposition (USP). It also covers competitive landscape, product features, financials, milestones, and funding requirements, ensuring a comprehensive pitch. The vibrant orange and gray color scheme adds energy and creativity to the presentation. Compatible with PowerPoint, Keynote, and Google Slides, this template is perfect for impactful startup pitches.


7 slides
Food Infographic Presentation Template
A Food Infographic is a visual representation of information and data related to food. It can be used to educate people on various aspects of food such as its nutritional value, cooking methods, and recipes. This template can be presented in a variety of ways, including charts, graphs, illustrations, and images you can customize with your information. The goal of this Food Infographic is to make complex information about food more accessible and easy to understand for the general public. This template works with Powerpoint, Keynote, and Google Slides, so you can use it on any device.


8 slides
Construction Project Planning Presentation
Streamline project timelines with the Construction Project Planning template. This visually structured design helps organize key phases, tasks, and milestones for efficient workflow management. Ideal for project managers and construction professionals, it enhances clarity in presentations. Fully customizable and compatible with PowerPoint, Keynote, and Google Slides for seamless integration.


5 slides
Company Vision and Operations Overview Presentation
Present your company’s mission and structure with this Company Vision and Operations Overview Presentation. Designed around a central eye graphic, it highlights four strategic pillars or core values. Ideal for executive summaries, leadership decks, or internal briefings. Fully editable in Canva, PowerPoint, or Google Slides.


5 slides
Business Meeting Agenda and Planning Presentation
Make every meeting count with this clean and professional agenda timeline. Featuring five circular stages connected in a fluid path, this layout is ideal for breaking down meeting objectives, planning steps, or stakeholder discussions. Fully customizable and compatible with PowerPoint, Keynote, and Google Slides.


6 slides
Creative Interior Design Portfolio Showcase Presentation
Showcase your creativity with the Creative Design Portfolio Showcase presentation. This template is perfect for graphic designers, architects, and creative professionals looking to display their work in a visually compelling format. Featuring modern layouts, high-quality image placeholders, and structured text sections, it allows for easy customization to highlight key insights. Fully compatible with PowerPoint, Keynote, and Google Slides.