


Features
- 6 Unique slides
- Fully editable and easy to edit in Microsoft Powerpoint, Keynote and Google Slides
- 16:9 widescreen layout
- Clean and professional designs
- Export to JPG, PDF or send by email


Do you have any questions?
Recommend


6 slides
Global Transportation & Logistics Infographics
The "Global Transportation and Logistics" infographic template, suitable for PowerPoint, Keynote, and Google Slides, is an invaluable tool for professionals in the logistics, shipping, and supply chain industries. This comprehensive template is designed to effectively communicate the complexities and scope of global transportation and logistics. This template features key elements such as global shipping routes, logistics management, and supply chain operations. Its detailed and informative design is perfect for presentations that need to illustrate the intricacies of global logistics, from transportation networks to logistical challenges. This is especially useful for strategic planning, educational purposes, or corporate presentations in the logistics sector. The color scheme of the template reflects global connectivity and efficiency, incorporating shades of blue, green, and earth tones. This professional and visually appealing design not only enhances the clarity of the information but also adds a global perspective to your presentation. Whether used for training, client meetings, or industry conferences, this template ensures your insights into global transportation and logistics are presented with precision and professionalism.


5 slides
Project Task Management Presentation
Stay on top of your workflow with this visually organized project task management slide. It features a clear table layout with editable fields for subject, priority level, due date, task status, progress percentage, and last modified date. Ideal for teams managing multiple tasks and deadlines. Use color-coded status bars and icons to communicate task progress at a glance. Perfect for project managers and team leaders. Compatible with PowerPoint, Keynote, and Google Slides.


6 slides
Data Visualization Pie Chart Presentation
Present data with clarity using the Data Visualization Pie Chart Presentation template. This professional and fully customizable slide deck is designed for business analysts, marketers, and data scientists to showcase key insights in an engaging and visually impactful way. Featuring a modern pie chart layout, it simplifies complex information for clear communication. Compatible with PowerPoint, Keynote, and Google Slides.


6 slides
Five Key Pillars of Organizational Strength Presentation
Highlight the foundational strengths of your business with the Five Key Pillars of Organizational Strength presentation. This visual framework uses classical column structures to represent five core principles, ideal for showcasing leadership values, corporate strategy, operational focus, or departmental roles. Each pillar is clearly labeled and customizable, making it easy to align with your organization’s unique message. Fully editable in PowerPoint, Keynote, and Google Slides, this template is perfect for board meetings, company culture decks, or executive planning sessions.


21 slides
Cerberus Project Timeline Presentation
Bring your project vision to life with a well-structured plan that flows effortlessly. This presentation covers everything from objectives and timelines to budget breakdowns, team introductions, and next steps, helping you communicate key details with clarity. Perfect for internal or client presentations, and fully compatible with PowerPoint, Keynote, and Google Slides.


7 slides
Customer Question for Support Infographic
Step into the spotlight with our vibrant Infographic Template, where every inquiry is a star! Designed to dazzle, this template offers a show-stopping way to address customer queries with flair and precision. Imagine vibrant backdrops and playful fonts that turn ordinary support interactions into captivating visual stories.Tailor-made for businesses eager to shine in customer service, this template transforms FAQs into eye-popping, memorable visuals. Whether it’s tech glitches, product how-tos, or service details, your answers will not only be seen—they’ll be remembered. Customize to fit your brand’s personality, deploying colors and styles that resonate with your audience.Ideal for help centers, product support pages, or digital kiosks, it makes customer support not just helpful, but spectacularly engaging. Ready for use with popular graphic design tools, it’s your backstage pass to standing ovations in customer care.


6 slides
North America Market Map Infographic
North America is the third largest continent in the world and home to over 50 countries, with a population of over 400 million. This infographic template is designed to show you where each country is located within North America, as well as its population, annual GDP per capita, and other important data points that make it unique. This template is the perfect tool for navigating the international market. This infographic map allows you to get a bird's eye view of how your business is performing across the region, and what areas need more attention. Fully customizable and compatible with Powerpoint, Keynote, and Google Slides.


6 slides
Key Points Overview Presentation
Bring your message to life with a slide that makes every key point feel clear, organized, and easy to follow. This presentation helps you highlight essential ideas, compare insights, and simplify complex information for any audience. Perfect for meetings, reports, or strategy updates. Fully compatible with PowerPoint, Keynote, and Google Slides.


21 slides
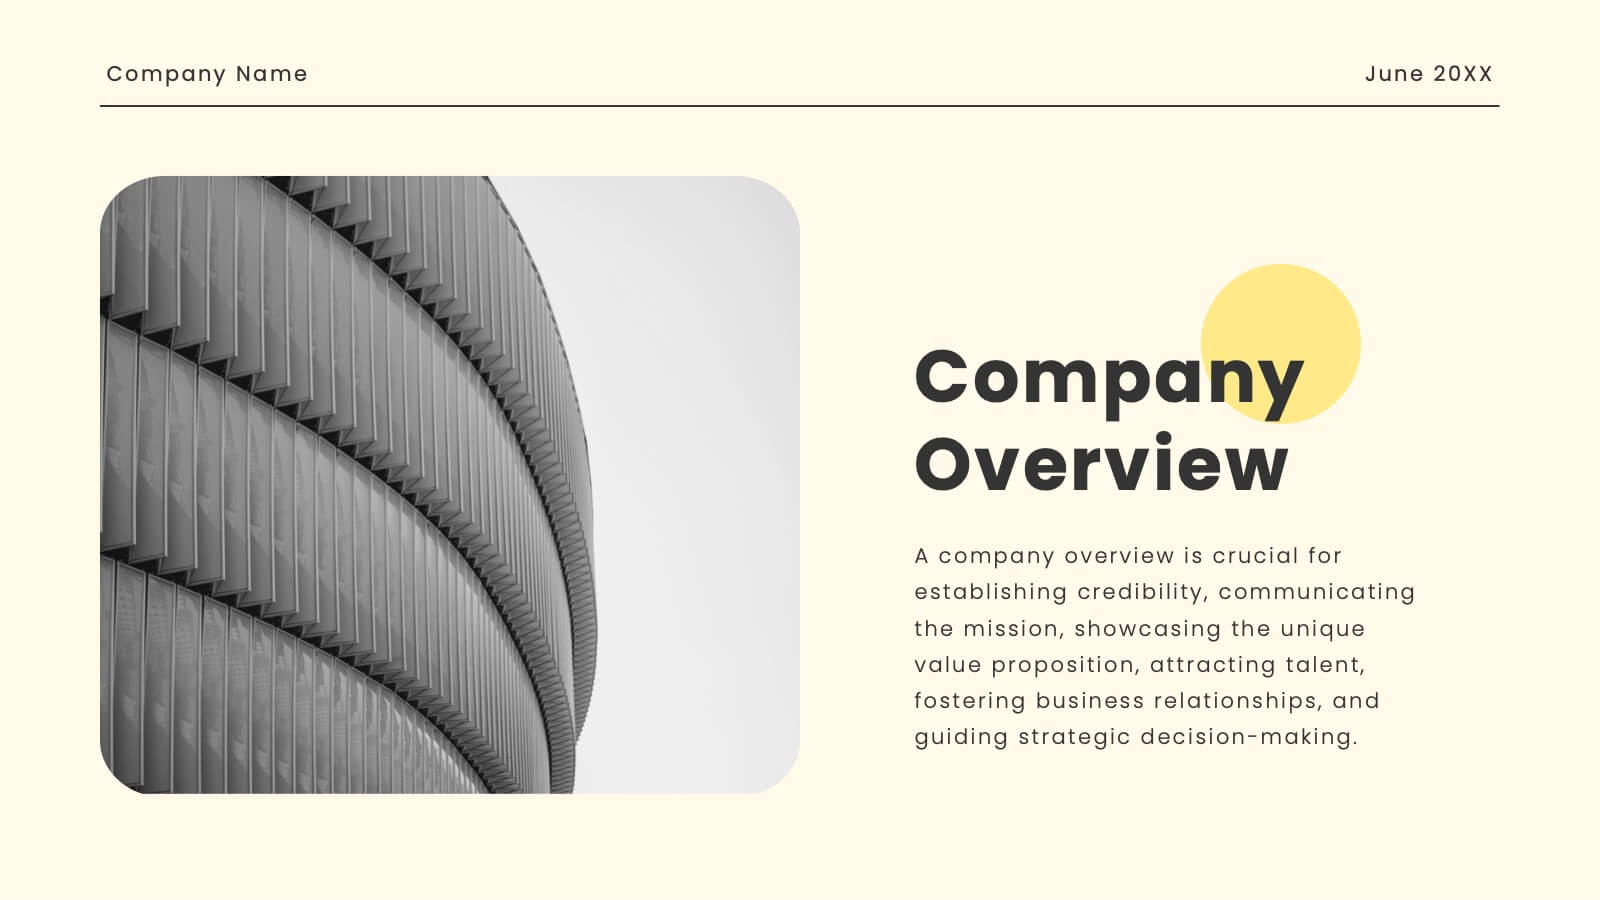
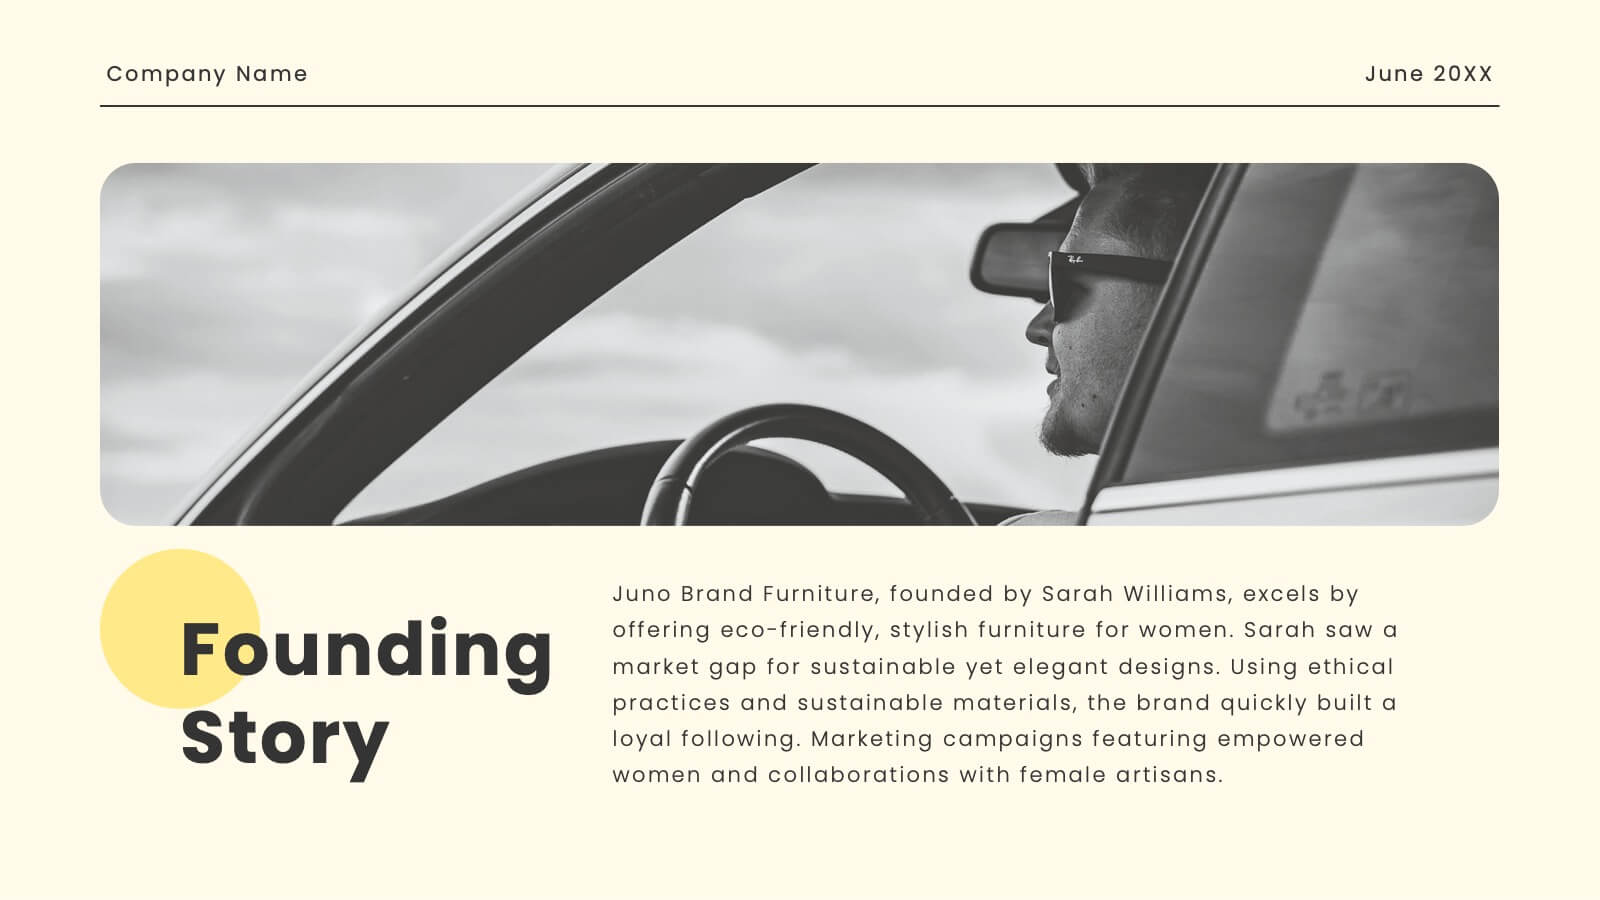
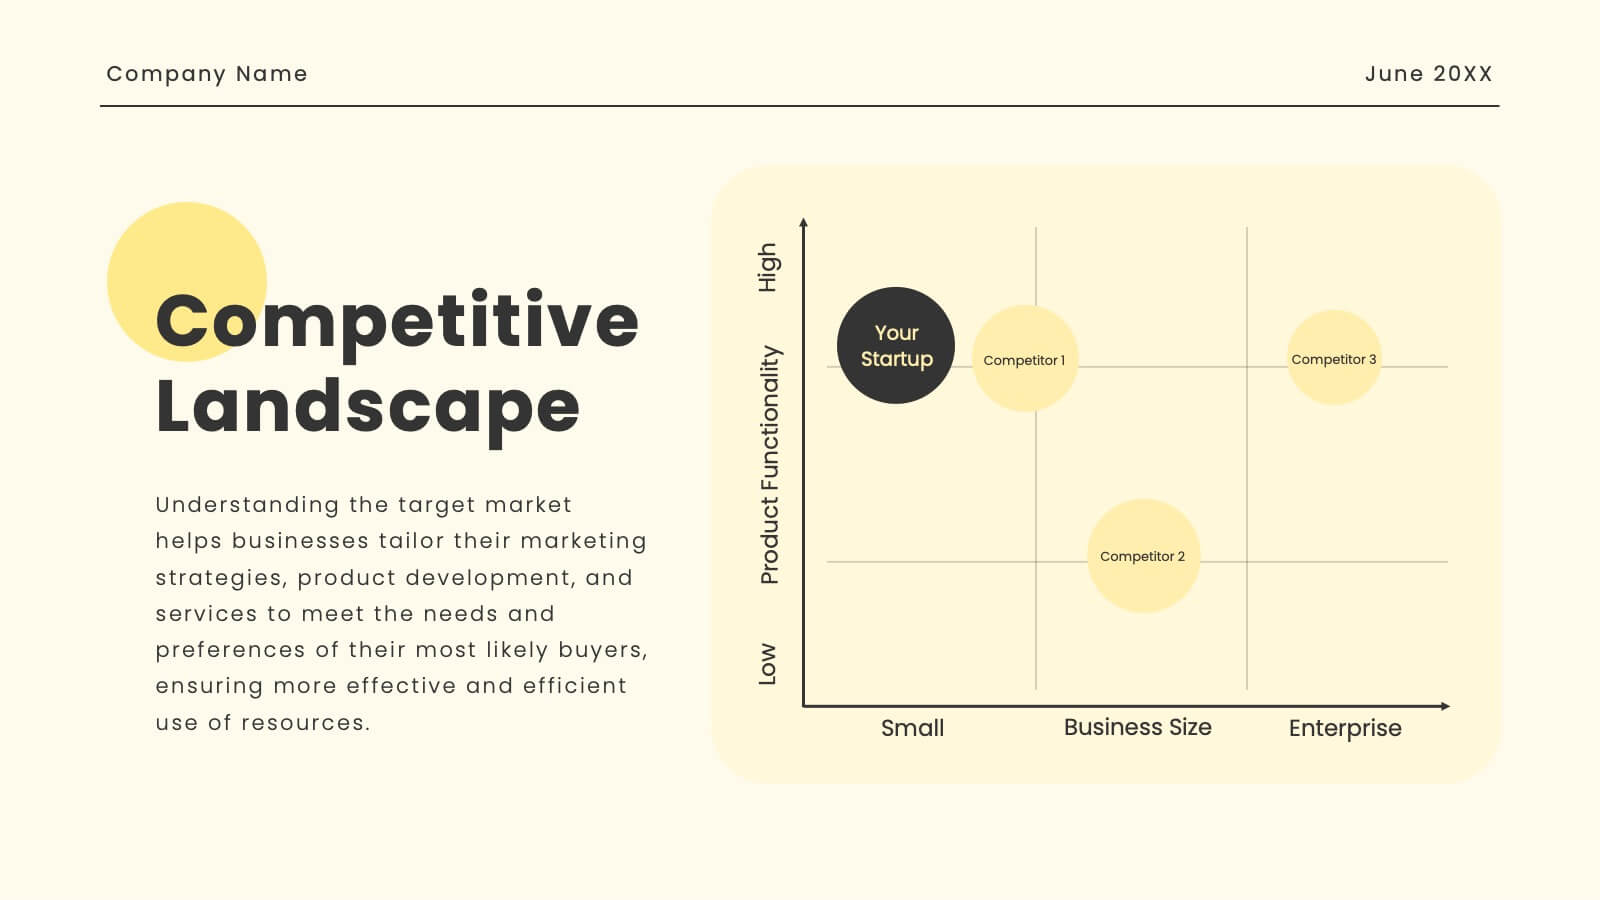
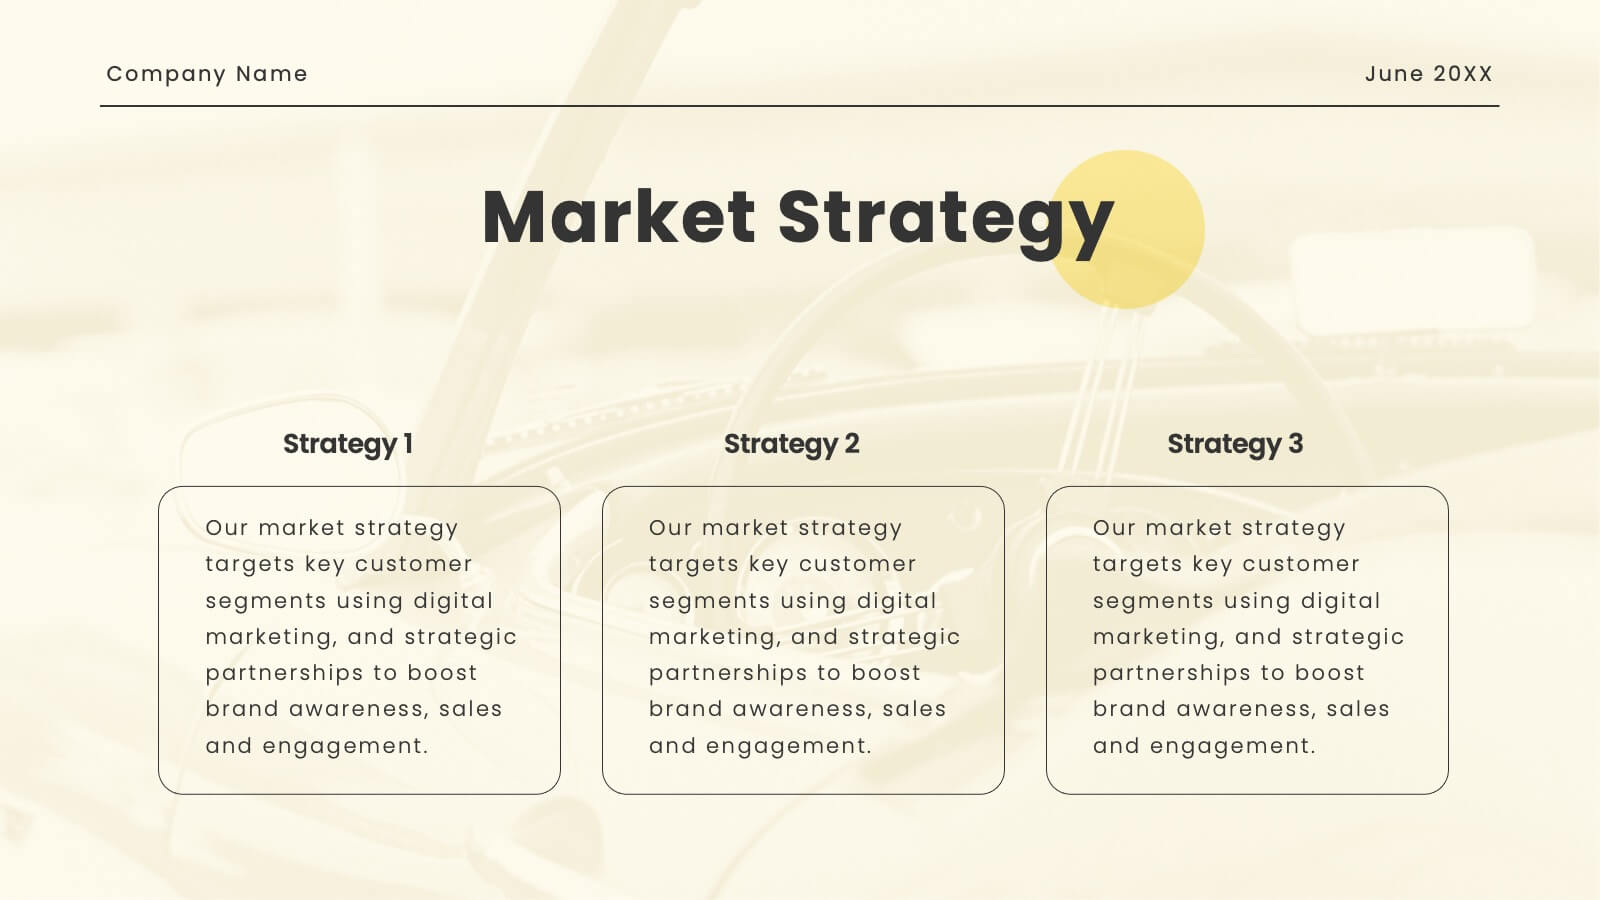
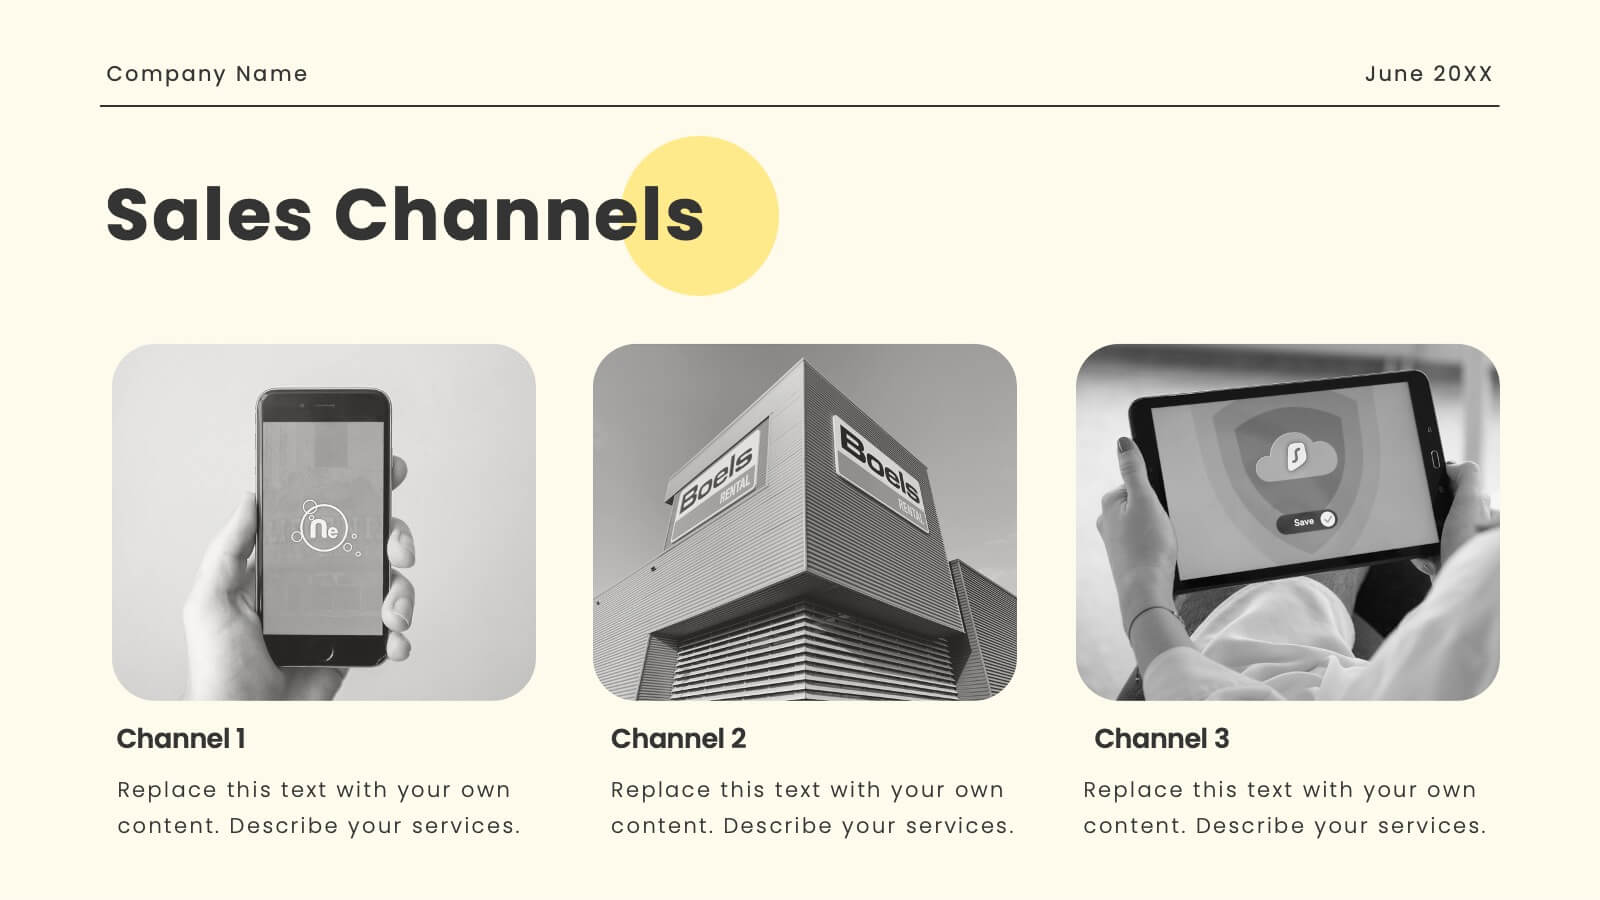
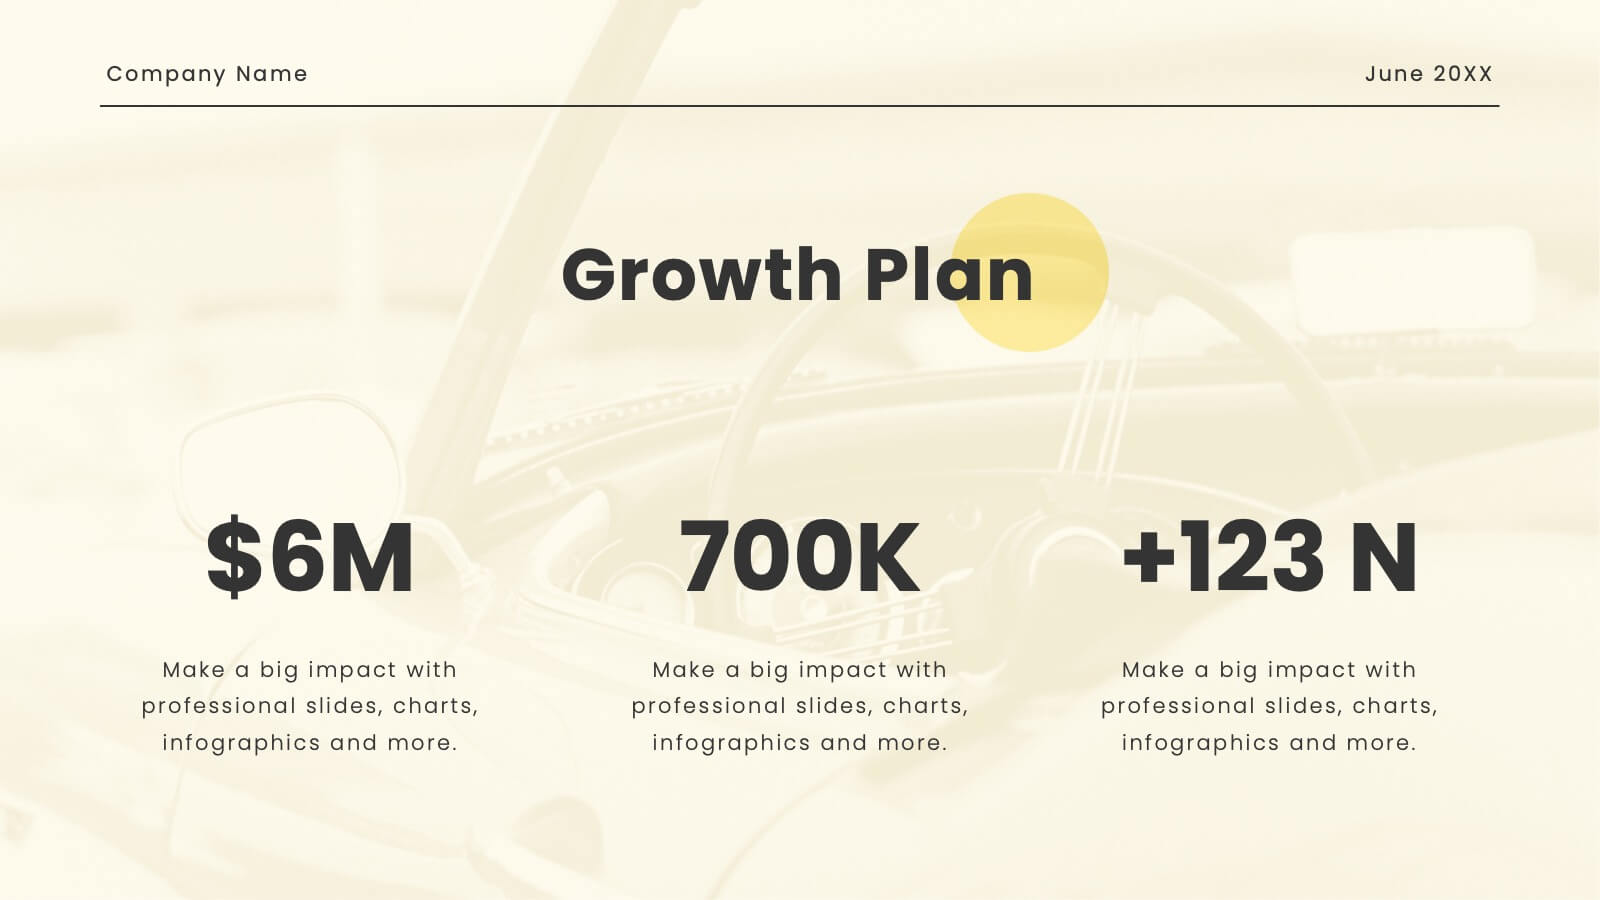
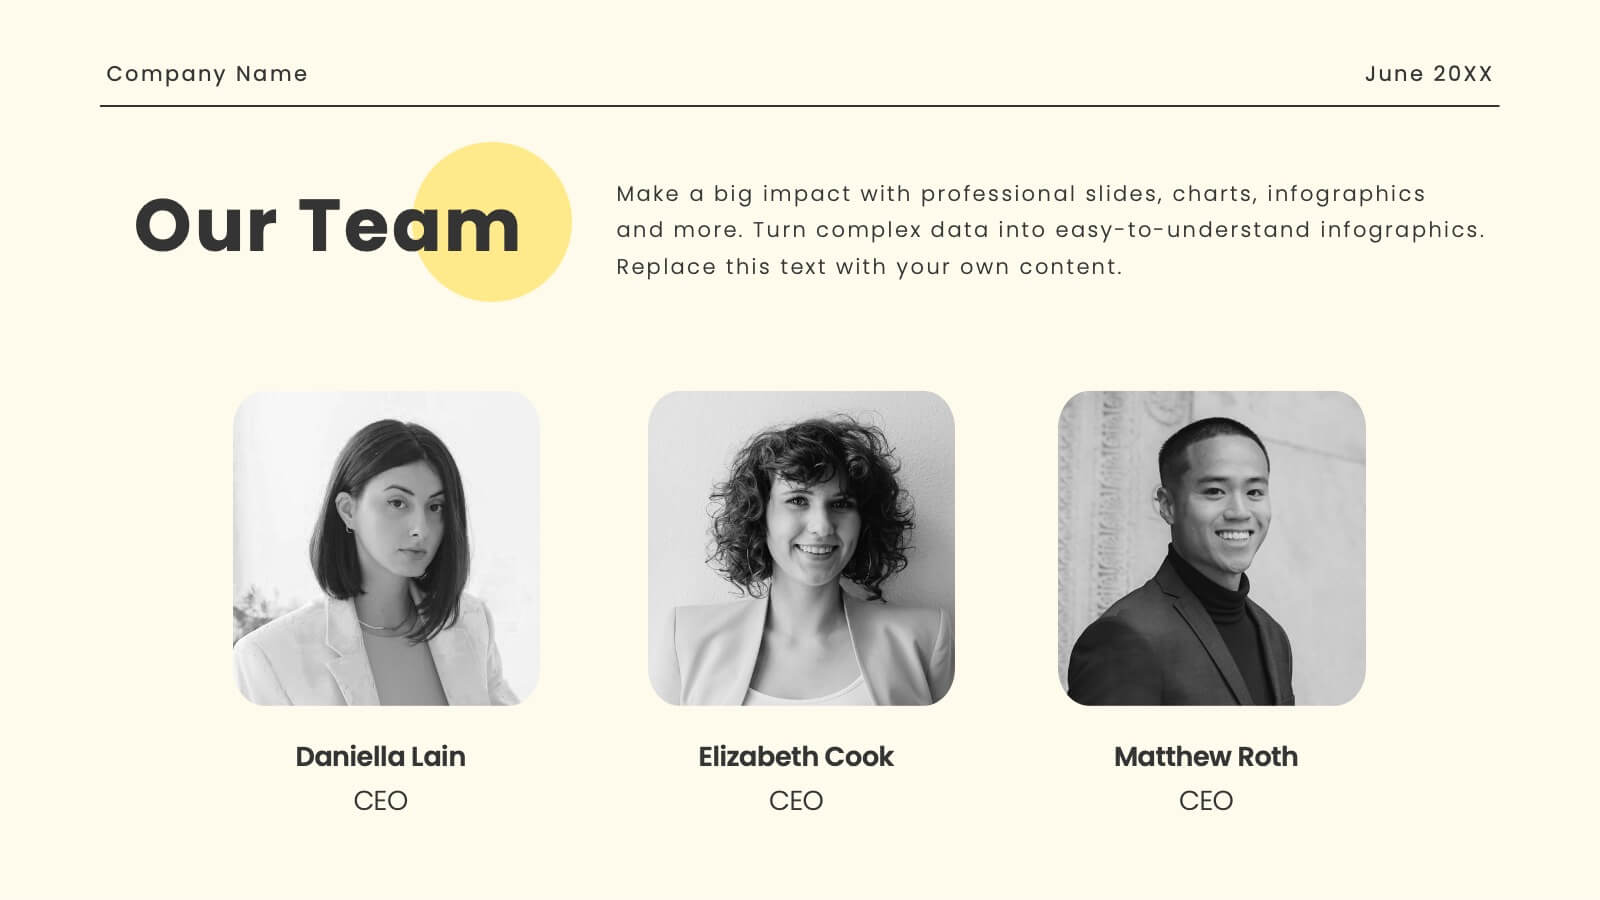
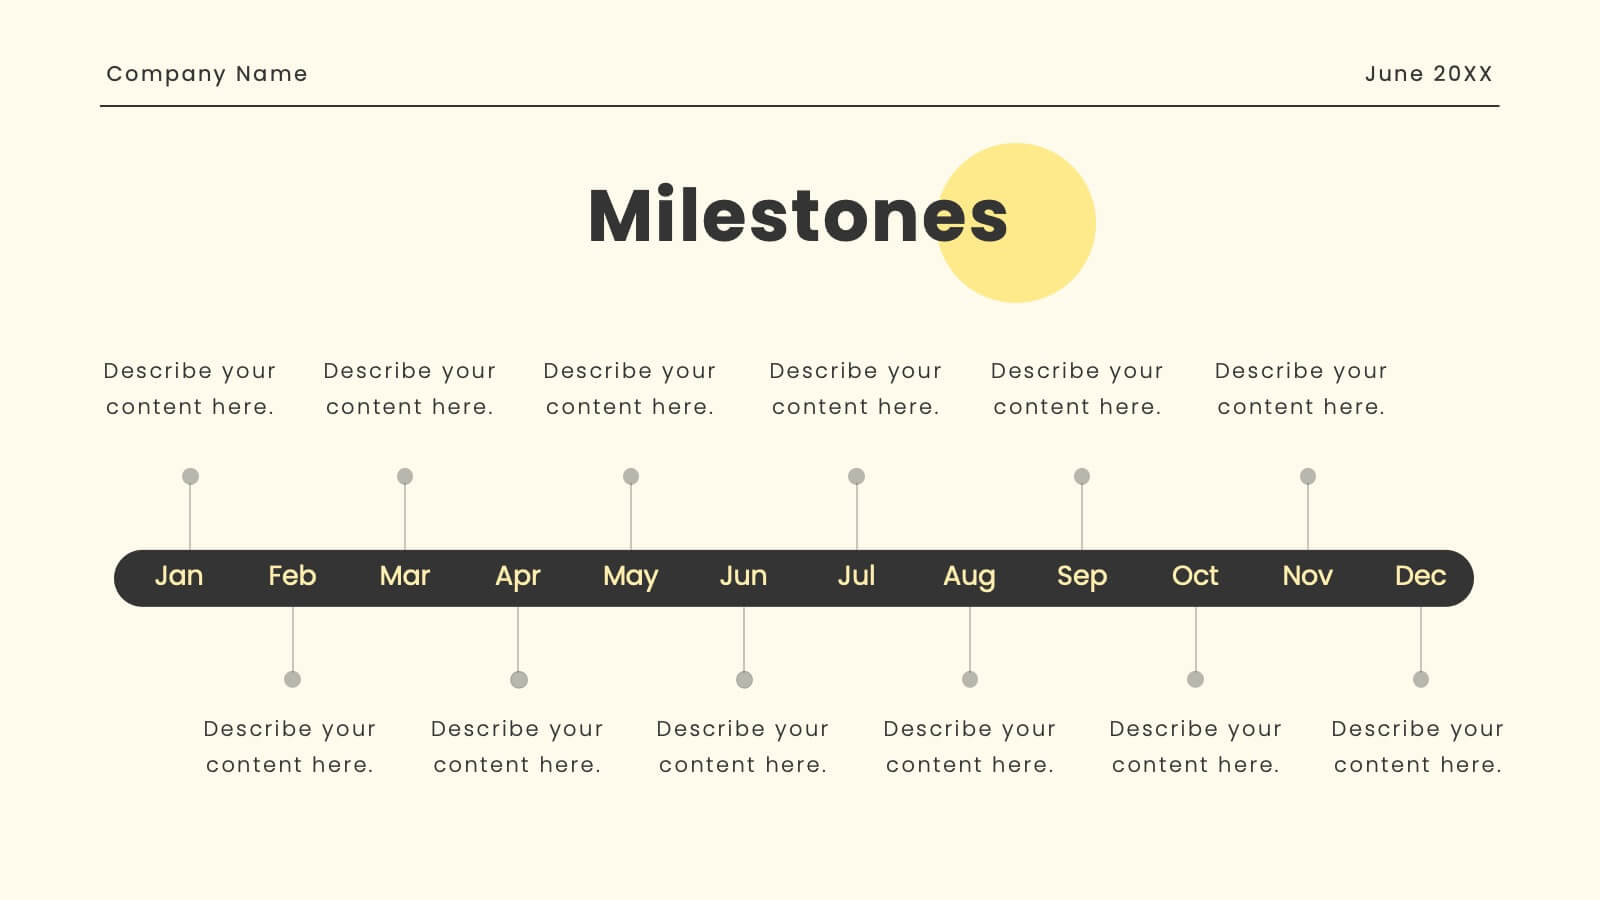
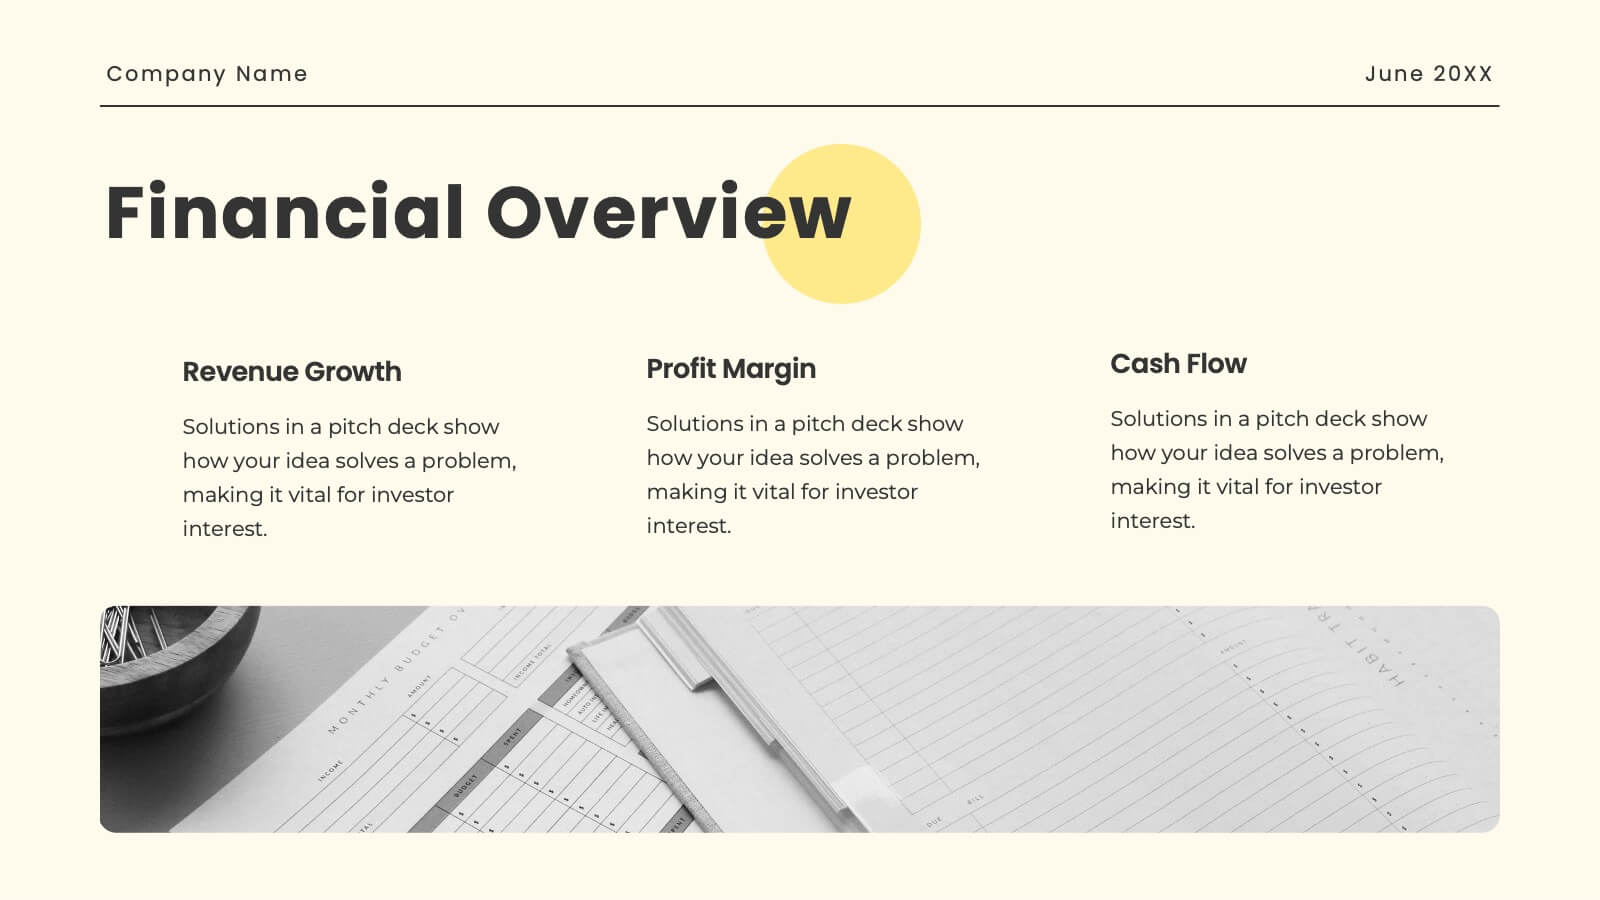
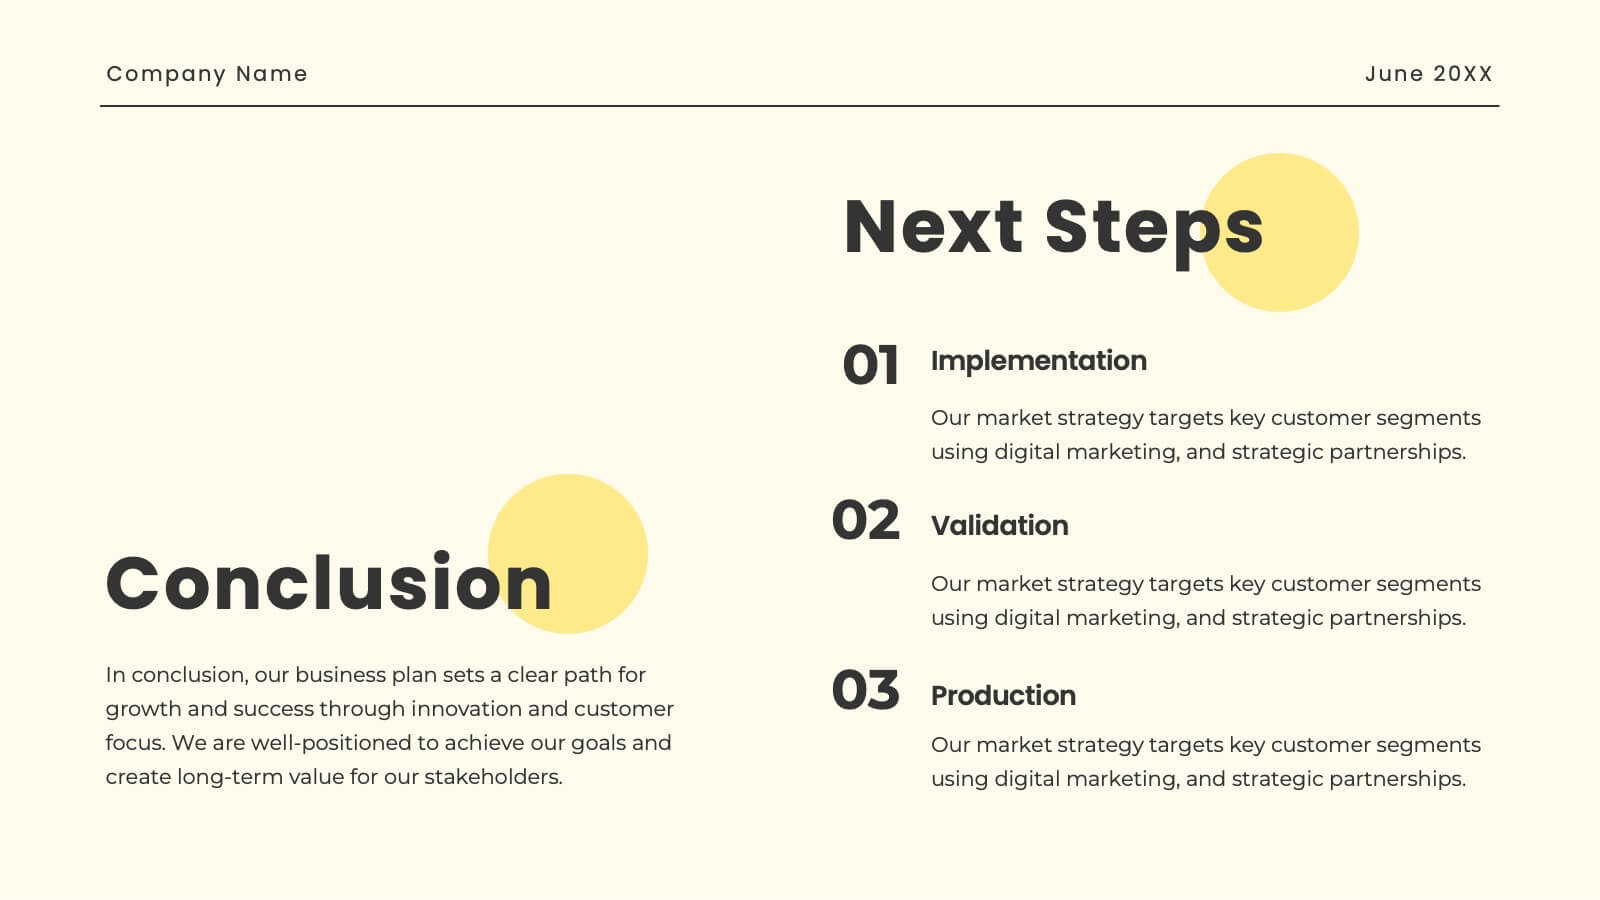
Oasis Startup Business Plan Presentation
Present your corporate business plan with confidence! This template includes sections for company overview, mission, vision, services, target market, and more. Showcase your market strategy, sales channels, growth plan, and financial overview. Perfect for conveying a professional and comprehensive business plan. Compatible with PowerPoint, Keynote, and Google Slides. Impress your audience today!


5 slides
Behavioral Psychology in the Workplace Presentation
Boost employee engagement and team dynamics with the Behavioral Psychology in the Workplace Presentation. This slide deck is designed to help HR leaders, managers, and consultants visualize psychological insights that shape workplace behavior. Use it to present motivation theories, behavioral models, or communication styles. Fully editable in Canva, PowerPoint, Google Slides, and Keynote.


26 slides
Business Research and Development Presentation
Business Research and Development refers to the process of investigating new ideas and methods with the goal of developing new services or processes that can help a company stay competitive in the market. This template is a tool that organizations can use to communicate their research findings and new developments. You can include information on market research, product development, and other aspects of your organization's research and development efforts. Compatible with PowerPoint, Keynote, and Google Slides. It features customizable layouts, charts, and graphs, as well as icons and illustrations that can be modified to fit your brand and message.


2 slides
Online Course Structure and Syllabus Deck Presentation
Welcome students with a vibrant and modern course intro slide. This template is perfect for online educators outlining course objectives and syllabus details. Features an image placeholder and text sections for clear communication. Fully editable in PowerPoint, Keynote, and Google Slides—ideal for virtual learning environments and eLearning programs.


5 slides
Business Influence Stakeholder Analysis Presentation
Enhance your project's success with our Business Influence Stakeholder Analysis Presentation template, designed to identify and prioritize stakeholders based on their influence and impact. This template is ideal for strategic planning and ensuring all key stakeholders are considered. Compatible with PowerPoint, Keynote, and Google Slides."


12 slides
Corporate Sustainability Strategy Presentation
Achieve your sustainability goals with the Corporate Sustainability Strategy Presentation template. This modern, visually engaging layout helps businesses showcase their environmental, social, and governance (ESG) initiatives, sustainability roadmaps, and corporate responsibility plans. Featuring clear, structured sections, this fully customizable design is perfect for corporate leaders, consultants, and eco-conscious organizations. Compatible with PowerPoint, Keynote, and Google Slides for effortless editing and presentation.


7 slides
Investment Management Infographic
Investment management, also known as asset management or fund management, involves the professional management of various securities and assets with the goal of achieving specific investment objectives for individuals, institutions, or entities. This infographic will encourage your audience to start or enhance their investment journey for financial prosperity. Customize the content, design, and visuals to craft an engaging and informative infographic that educates about investment management. This infographic should serve as a useful guide for both beginners and those looking to refine their investment strategies.


7 slides
Standard Process Infographic
Streamline operations with clarity with our standard process infographic. This template is your ultimate tool for presenting complex processes in a clear, easy-to-understand manner. This infographic is designed to break down intricate procedures into visual, digestible segments. This includes a step-by-step diagram presenting each step clearly. Compatible with Powerpoint, Keynote, and Google Slides. Include a versatile color palette to choose from, matching your brand or adding visual interest. With this template you'll make even the most complicated processes understandable and actionable. Start streamlining your operations today!


7 slides
Watercolor Plan Infographic
A watercolor plan infographic refers to an infographic design or style that incorporates elements of watercolor painting. Dive into the world of dreams and aspirations with our watercolor plan infographic template. This artistic and visually captivating infographic guides you through your plans and goals with the fluidity and creativity of watercolors. This infographic is a visually stunning and inspiring template that transforms the process of goal setting into an artistic masterpiece, encouraging individuals to paint their dreams with vivid hues of determination and creativity.