


Features
- 10 Unique slides
- Fully editable and easy to edit in Microsoft Powerpoint, Keynote and Google Slides
- 16:9 widescreen layout
- Clean and professional designs
- Export to JPG, PDF or send by email


Do you have any questions?
Recommend


7 slides
Marketing Infographic Presentation Template
A marketing infographic is a visual representation of information or data related to marketing, advertising, or business strategy. The purpose of this marketing infographic is to make all your ideas and data easily understandable and memorable by using graphics, images, charts, and other visual elements. This template can be used to explain a brand's target audience and important information. The aim of this marketing infographic is to make marketing content more engaging and impactful, which can help to reach target audience, convey their message effectively and increase brand awareness.


4 slides
Environmental Sustainability Strategy Presentation
The "Environmental Sustainability Strategy" presentation template is a visually engaging tool designed to outline an organization's approach to integrating sustainable practices into its operations. The template illustrates the journey from social to environmental and corporate sustainability, represented by seedlings growing into mature plants, symbolizing development and growth in sustainable practices. This template is perfect for businesses aiming to communicate their commitment to sustainability, detailing specific strategies and milestones in social, environmental, and corporate domains. It encourages viewers to think about the progressive stages of implementing sustainable actions within a corporate framework.


21 slides
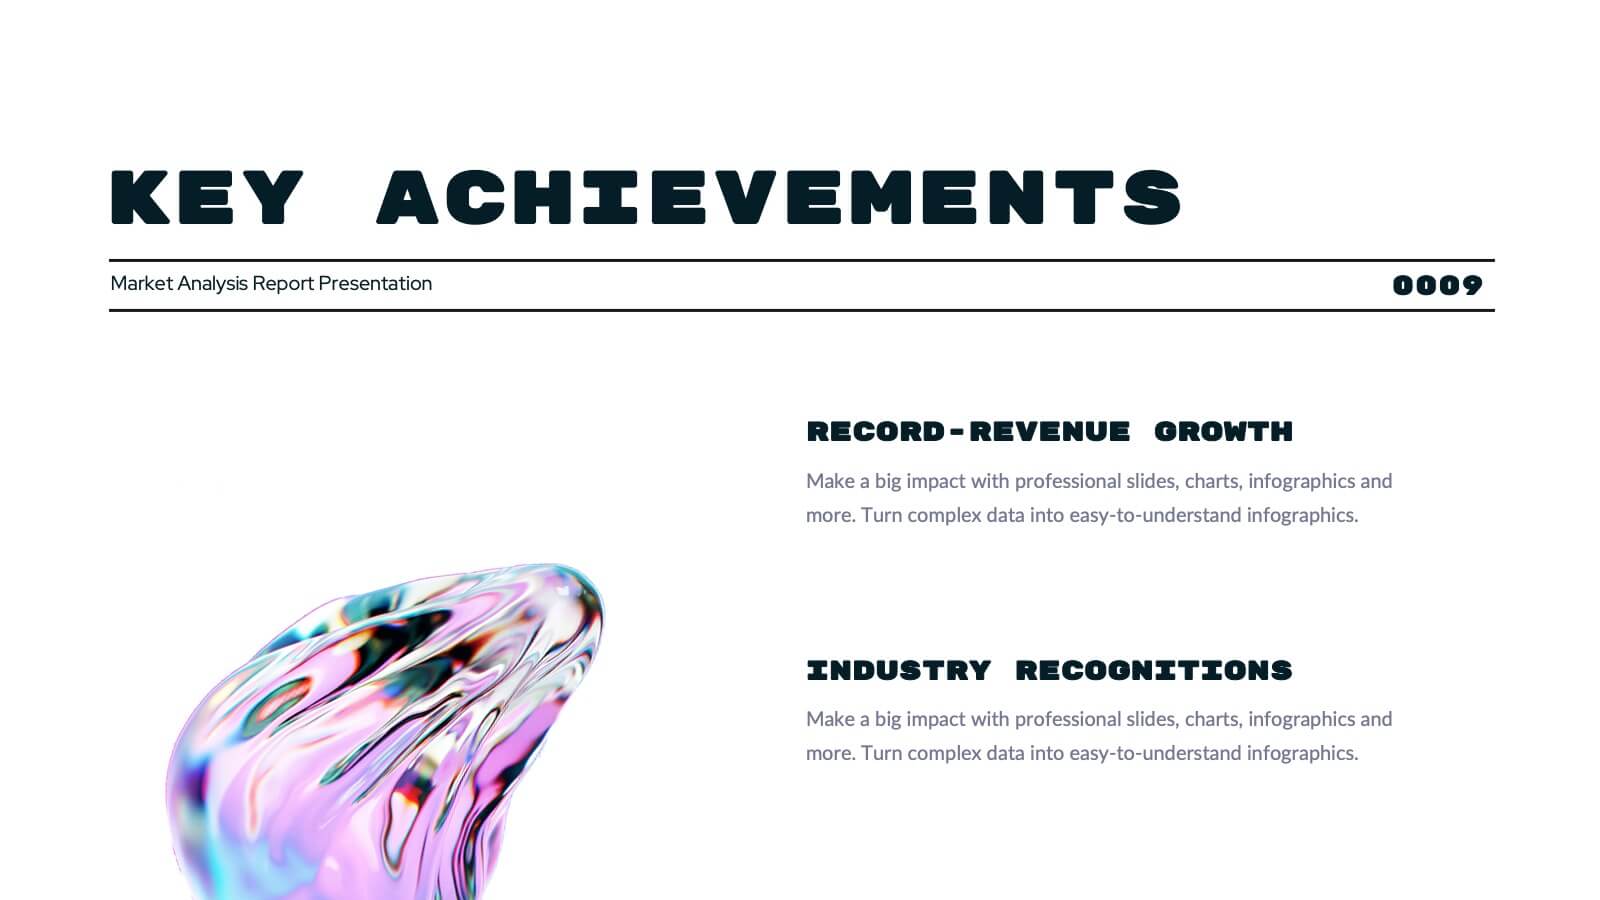
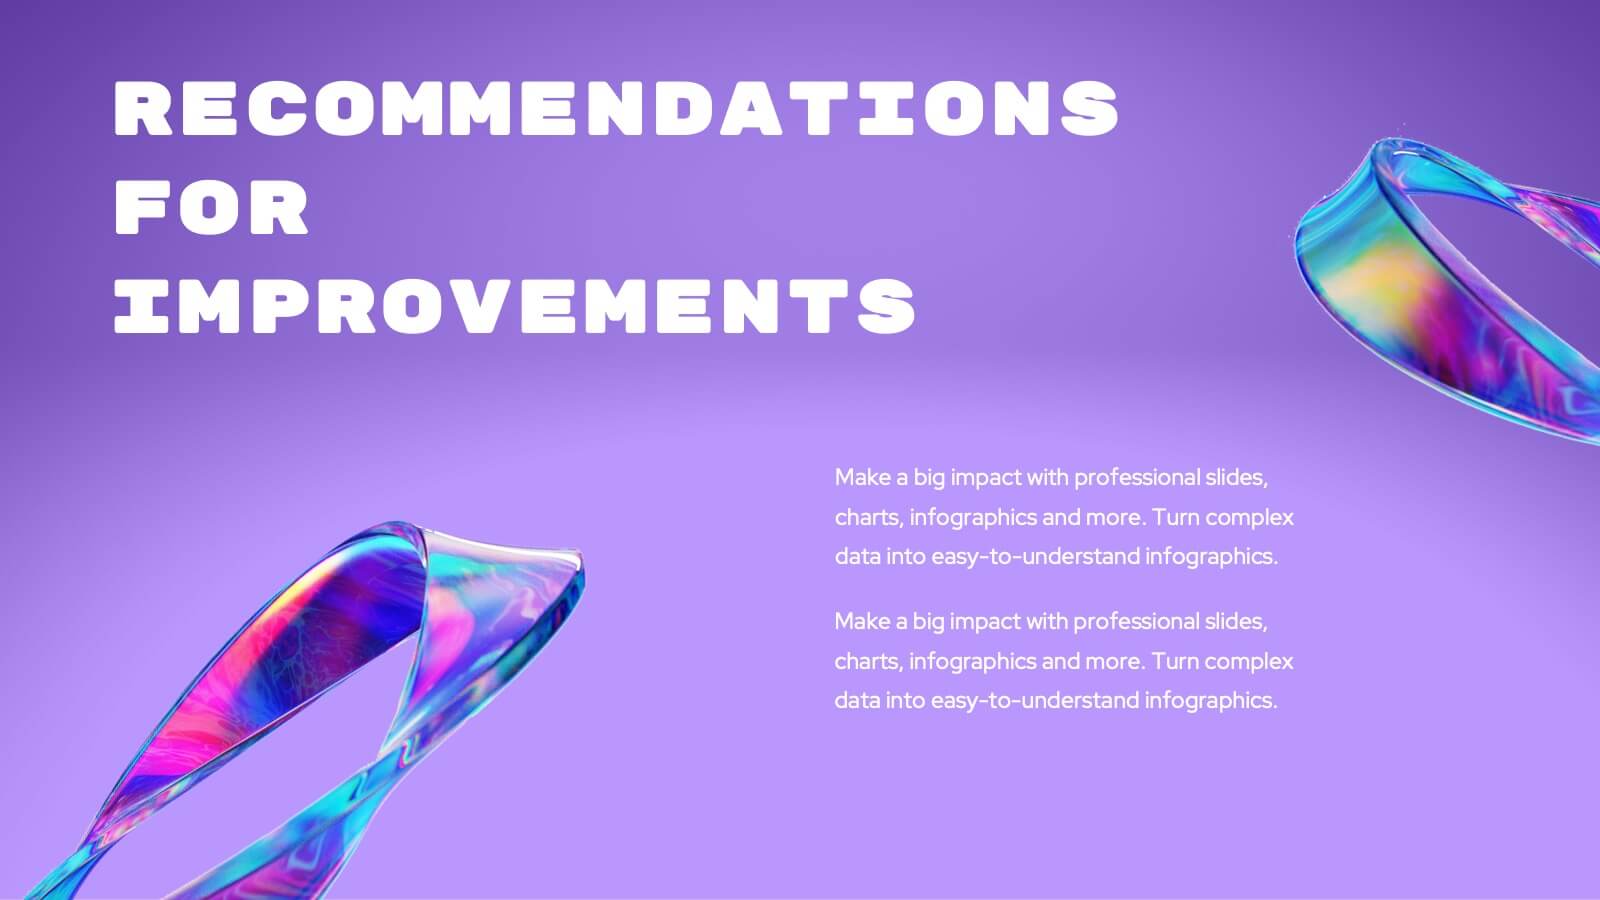
Turquoise Market Analysis Report Presentation
This sleek report presentation template covers essential sections like key performance metrics, market analysis, and strategic initiatives. It’s designed for a professional yet modern look, perfect for showcasing updates and insights. Compatible with PowerPoint, Keynote, and Google Slides, it’s ideal for delivering engaging and impactful business reports.


7 slides
PESTEL Chart Infographic Presentation
A PESTEL Chart is a strategic planning tool used to analyze and identify the key external factors that could affect an organization's performance and its ability to achieve its objectives. Create epic pestel charts in no time using this template. All you need to do is enter your data and the template will do the rest. Use this template as an introduction to your most important points. It is completely editable change the fonts, sizes and shapes and it can be used for any type of business or academic project. This template is available in PowerPoint, Keynote and Google Slides formats.


5 slides
Cost Analysis and Budgeting
Visualize financial shifts with clarity using the Cost Analysis and Budgeting Presentation. This slide template uses a dual-stack design to contrast cost reductions against budget increases, supported by percentage change labels and layered visual elements. Ideal for finance teams, operations reviews, or executive summaries, this layout highlights five customizable categories per stack. Compatible with PowerPoint, Keynote, and Google Slides, it's fully editable to match your company branding and color palette.


7 slides
Digital Marketing Infographic
Digital marketing refers to the use of digital channels, such as the internet, social media, search engines, email, and mobile devices, to promote products, services, and brands. This infographic showcases key concepts and strategies in the field of digital marketing. It is designed to help businesses and marketers effectively communicate and educate their audience about the various aspects of digital marketing. This template can be used to cover a wide range of digital marketing topics, including social media marketing, search engine optimization, content marketing, email marketing, paid advertising, analytics, and more.


5 slides
Geometric Design Elements
Make your message stand out with this bold, 3D geometric infographic layout. Ideal for visualizing layered concepts, structural data, or multi-dimensional strategies. Each triangular section is color-coded and fully editable to align with your brand or topic. Compatible with PowerPoint, Keynote, and Google Slides.


16 slides
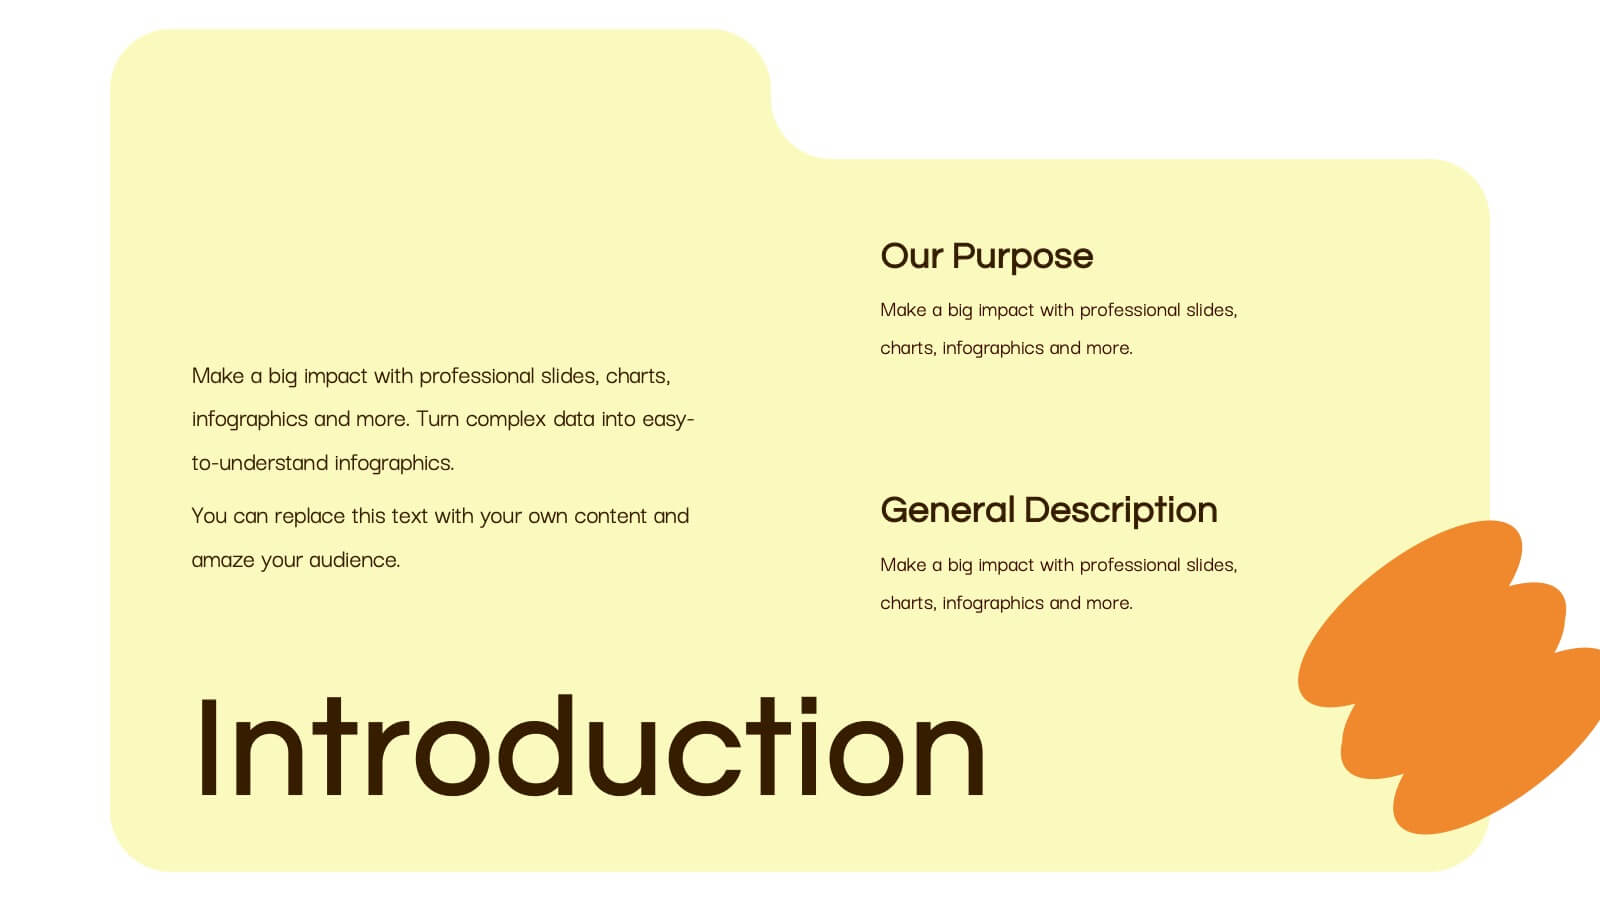
Professional Presentation
Streamline your project presentations with our Professional Template, meticulously designed to bring your content to life. This template is ideal for professionals looking to present a structured and detailed overview of their projects. Starting with a compelling cover slide, it guides you through defining your problem statement, setting clear objectives, and laying out comprehensive strategies and recommendations. The slides are curated to facilitate a logical flow from an introduction of your project to a detailed implementation plan, visual graphics, and outcome analysis. The key objectives slide is engineered to present your goals with impact, while the strategies and implementation plan slides help articulate the steps towards achieving success. The template concludes with a neat summary slide, a cordial 'Thank You' slide with contact information, and a credits section for source attribution. Fully compatible with PowerPoint, Keynote, and Google Slides, this template is a reliable choice for professionals seeking to convey their message with clarity and confidence.

20 slides
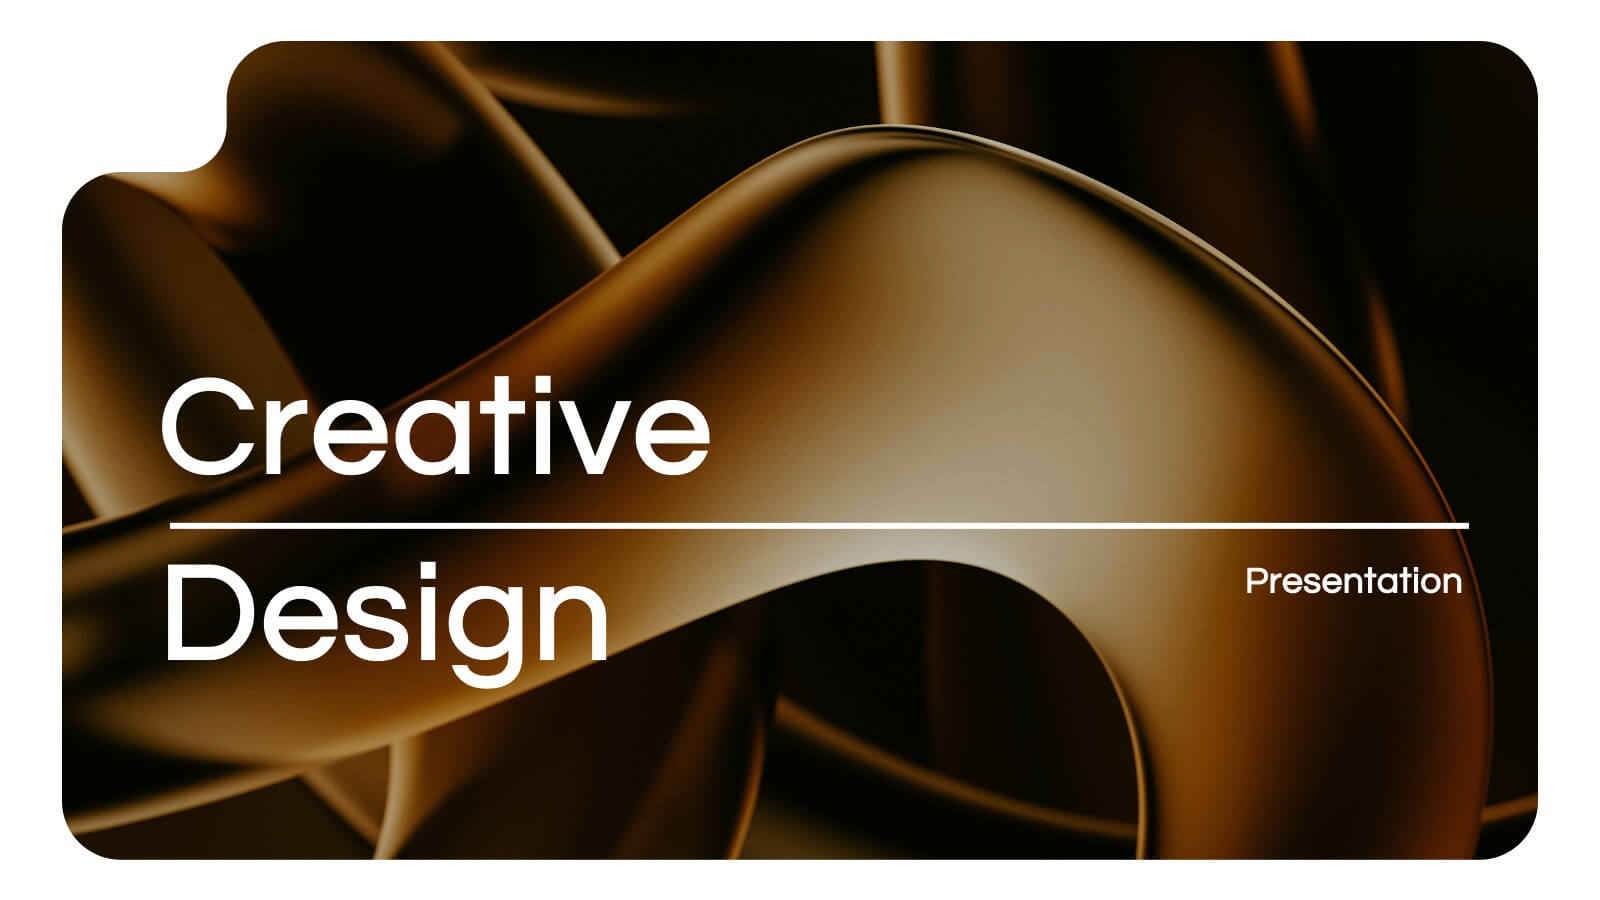
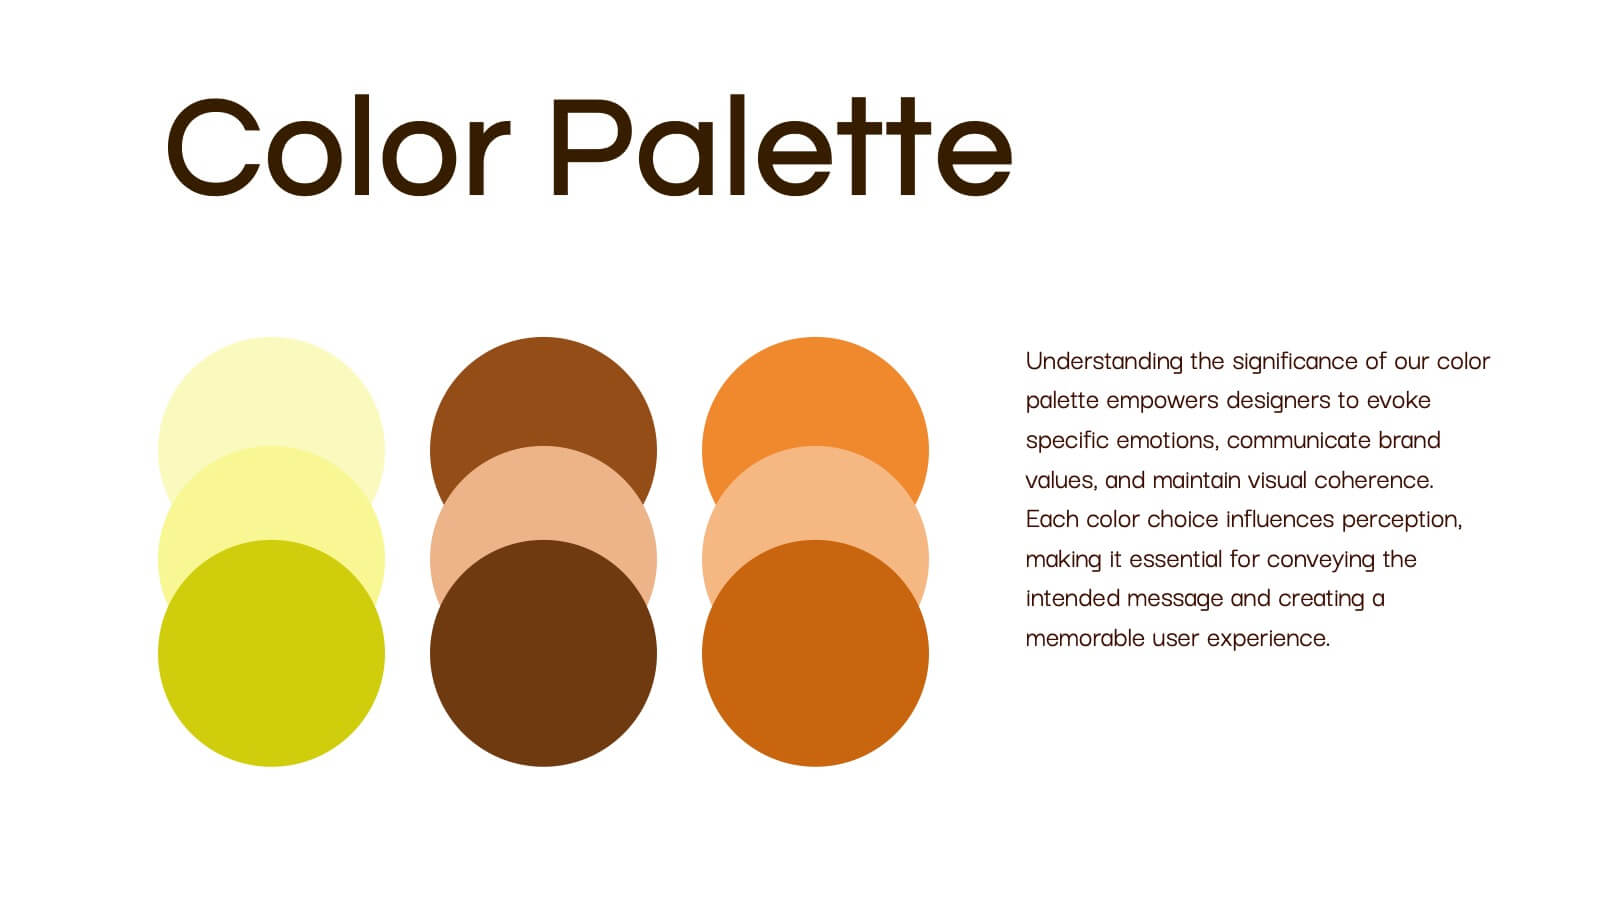
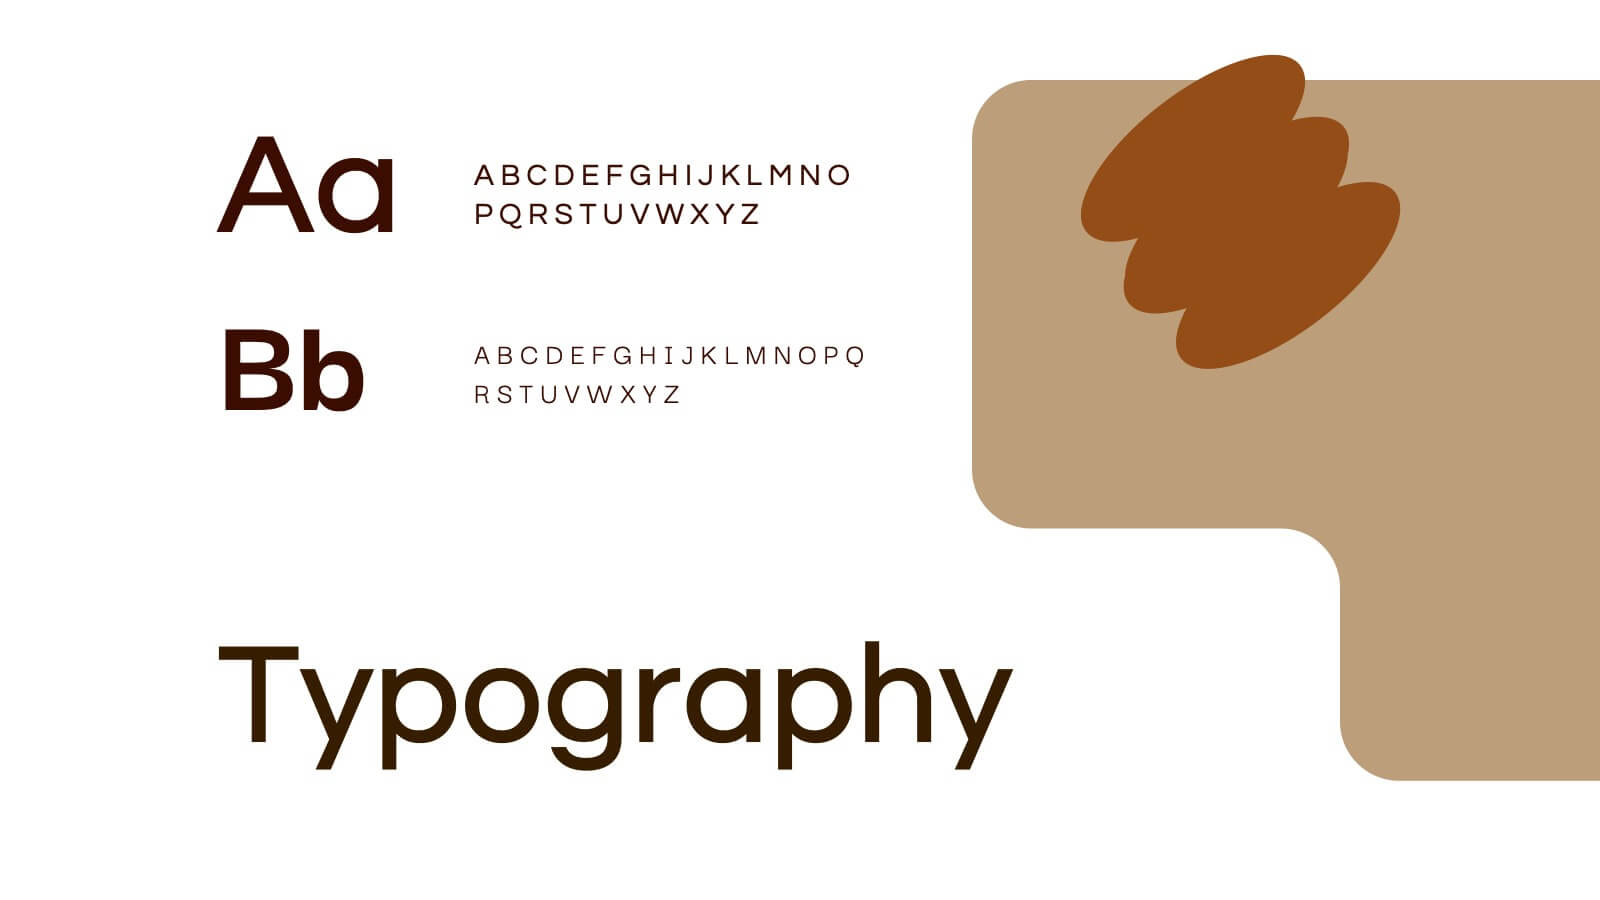
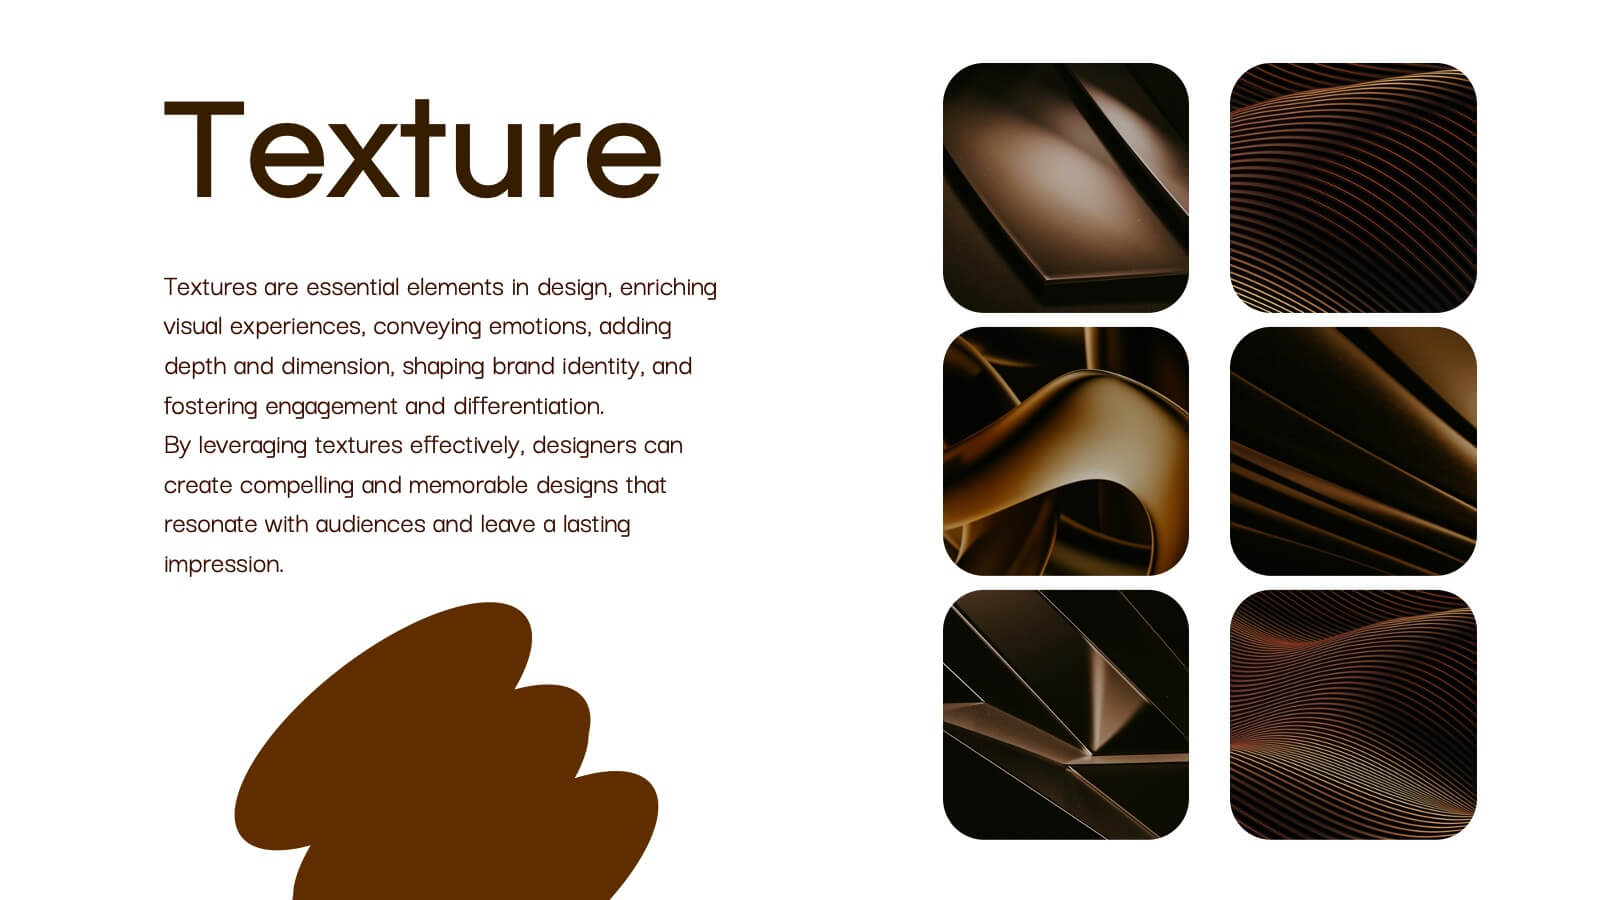
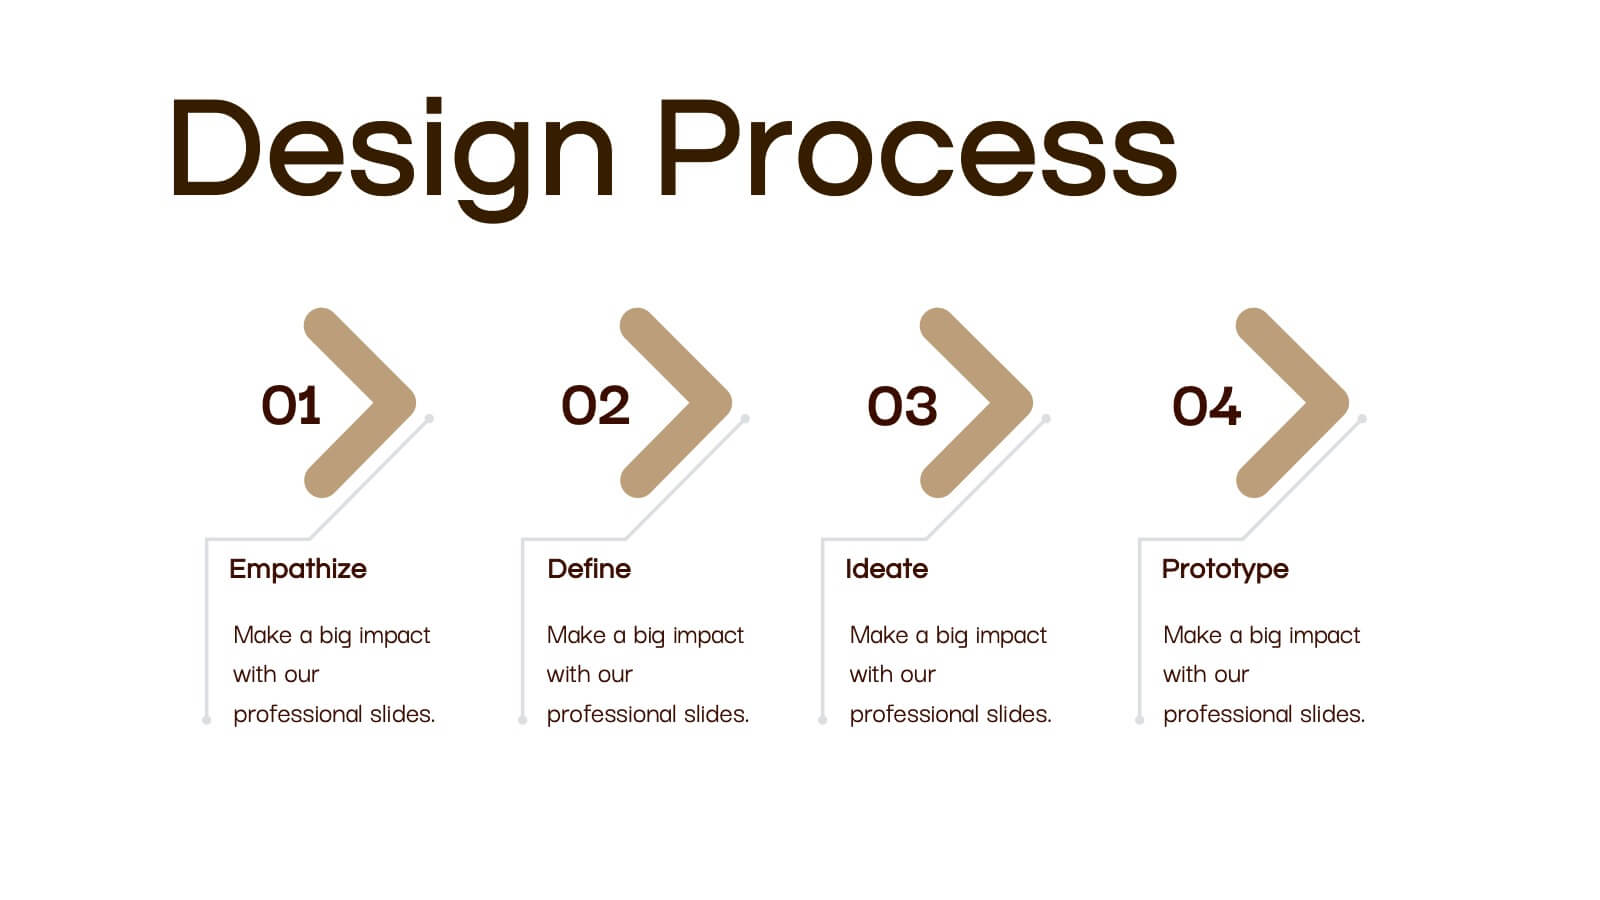
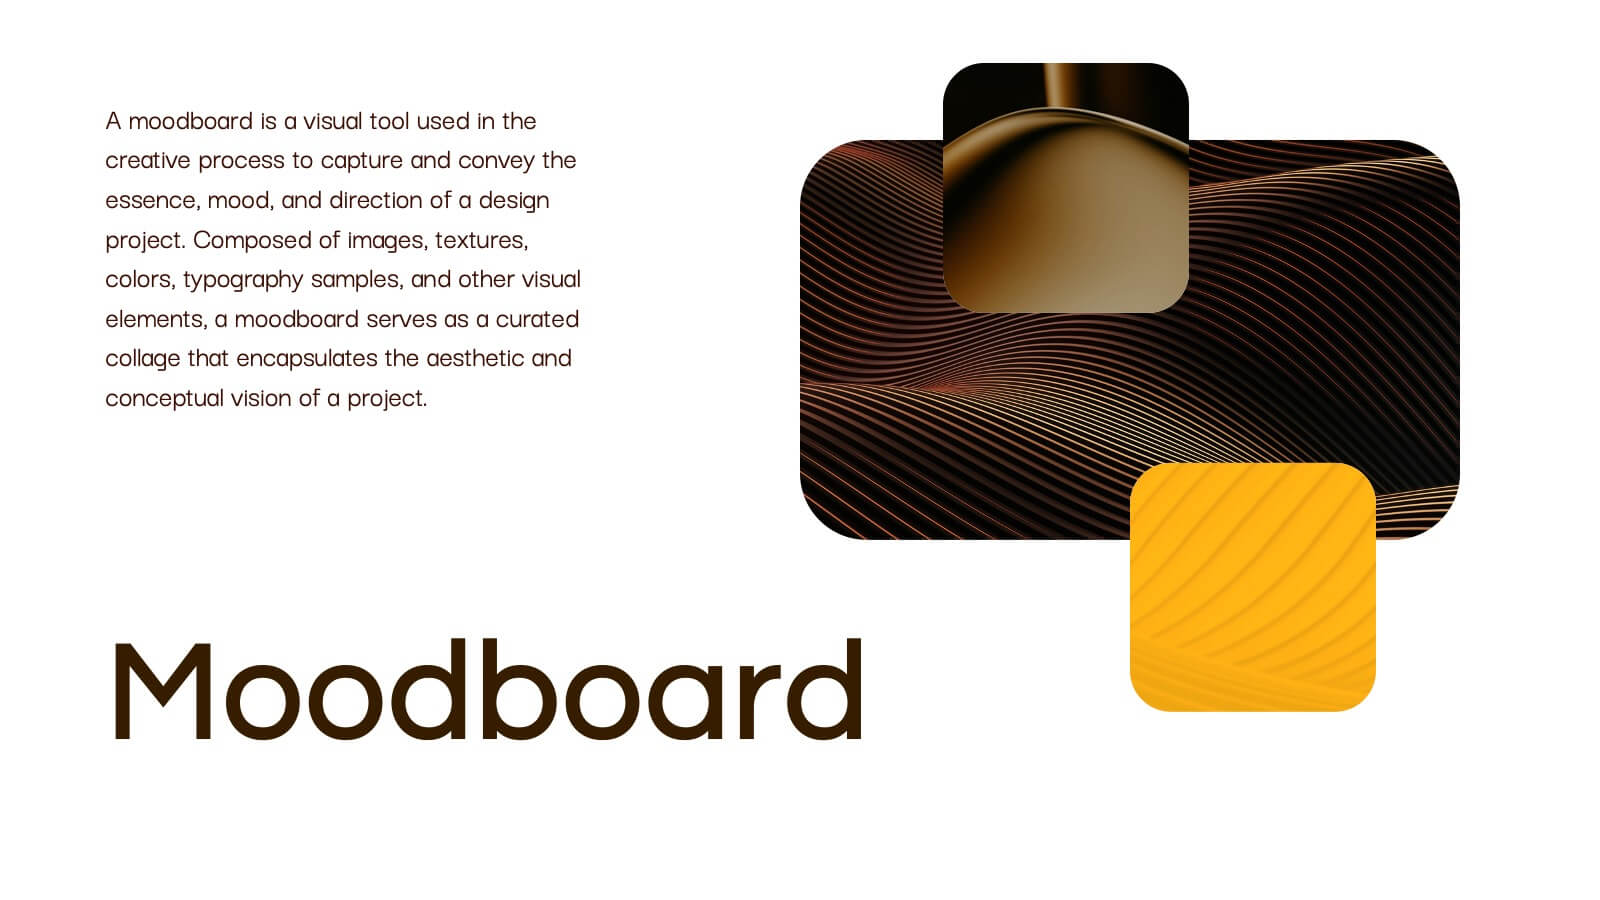
Obsidian Creative Design Report Presentation
Bring your creative vision to life with this stunning design presentation template! Perfect for showcasing your design process, from concept development and mood boards to typography and final assets. Ideal for creative professionals, this template offers clarity and style at every step. Compatible with PowerPoint, Keynote, and Google Slides, it’s your ultimate tool for design presentations.


21 slides
Eldritch Product Roadmap Presentation
The Product Roadmap Presentation Template features 21 modern slides, including product overviews, features, pain points, technical specs, and marketing strategies. Its sleek gray-yellow design ensures professionalism. Perfect for startups or businesses, it’s fully customizable and compatible with PowerPoint, Keynote, and Google Slides, ideal for impactful product-focused presentations.


7 slides
Europe Map Infographic Presentation Template
Europe is a continent located in the northern part of the globe and surrounded by water on three sides. It is bordered by the Atlantic Ocean to the west, the Arctic Ocean to the north, and the Mediterranean Sea to the south. Europe is divided into roughly forty four countries and dependent territories, each one with its own unique identity, cuisine and culture. This European map template is a vector map of an outline of Europe, with color-coded and labeled countries and a legend. This map template can be used for presentations, reports and blogs about tourism it's a simple and clean style map.


7 slides
Europe Population Infographic Presentation
A Europe Map infographic is a visual representation of the European continent, highlighting its geographic features, population, culture, history, and other relevant information. This template is a perfect graphic representation of Europe that combines text, data, and images in a fun and engaging way. This pre-designed template allows users to modify or customize the map to suit their specific needs. This includes a map of Europe with its countries, major cities, and geographic features, along with additional information and visuals related to the topic or purpose of the infographic.


6 slides
RAPID Roles and Responsibilities Slide Presentation
Make teamwork crystal clear with a structured chart that defines who does what and when. This organized layout helps map decision-making roles, streamline collaboration, and prevent confusion in complex projects. Easy to edit and ready to use, it’s fully compatible with PowerPoint, Keynote, and Google Slides for smooth customization.


5 slides
Progress and Performance Yearly Review Presentation
Highlight key milestones along your business journey with this winding roadmap-style slide. Designed for annual reviews, it features five flag markers for progress tracking, goals, or achievements. Ideal for reports or team updates. Fully customizable in PowerPoint, Keynote, and Google Slides for seamless adaptation to your yearly metrics.


21 slides
Illume Detailed Project Execution Plan Presentation
Get ready to wow your audience with this dynamic Project Execution Plan template! Bursting with sleek design, it transforms your project timelines, deliverables, and stakeholder analysis into a stunning visual journey. Keep everyone engaged while you showcase your strategy with flair and finesse. Perfect for PowerPoint, Keynote, and Google Slides!


7 slides
Design Mockup Infographic
Present your creative projects with precision and style using this collection of design mockup templates. Each template is expertly crafted to showcase your graphic designs, digital art, or branding projects across multiple devices and settings, emphasizing both detail and context. Featuring sleek, modern layouts, these mockups integrate vibrant color schemes and dynamic typography to make your designs pop. Ideal for graphic designers, marketers, and creative agencies, these templates provide a professional setting for presenting web designs, app interfaces, and other digital products to clients and stakeholders. Customize these templates with ease, adding your own images and text to tailor the mockups to your specific project needs. Whether you're creating a portfolio, client presentation, or marketing materials, these mockups will help you display your work in the most effective and engaging way.


10 slides
SEO and Content Marketing Plan
Highlight your SEO and content strategy with a modern magnifying glass-themed design. This slide makes it easy to break down key phases like keyword research, content creation, optimization, and analytics. Fully customizable and compatible with PowerPoint, Keynote, and Google Slides.