


Features
- 4 Unique slides
- Fully editable and easy to edit in Microsoft Powerpoint, Keynote and Google Slides
- 16:9 widescreen layout
- Clean and professional designs
- Export to JPG, PDF or send by email


Do you have any questions?
Recommend


5 slides
IT Security and Data Protection Presentation
Communicate your cybersecurity objectives with impact using this clean, shield-based visual layout. This presentation slide features five distinct steps with matching icons, perfect for detailing protocols like data governance, firewall strategies, or access control measures. Ideal for IT professionals, network admins, or compliance teams. Fully customizable and compatible with PowerPoint, Keynote, and Google Slides.


5 slides
Leadership and Team Management
Showcase roles, responsibilities, and the structure of your team with this clear and engaging leadership diagram. Ideal for HR professionals, team leads, and project managers to explain reporting lines and team composition. Easily editable in PowerPoint, Keynote, and Google Slides—customize colors, icons, and content in minutes.


4 slides
Organizational Mission Strategy Presentation
Stand tall with this mountain-themed layout—perfect for showcasing the pillars of your organizational mission strategy. Each peak represents a strategic objective or core value, guiding your team toward a shared goal. Fully compatible with PowerPoint, Keynote, and Google Slides.


6 slides
Detailed Case Analysis Report Presentation
Turn complex findings into a clear and engaging story with this modern, data-focused layout. Ideal for professionals presenting research, performance reviews, or audit results, it helps you organize insights with precision and clarity. Fully editable and compatible with PowerPoint, Keynote, and Google Slides for effortless customization and presentation delivery.


4 slides
Minimal Company Profile Deck Presentation
Make a bold first impression with this sleek, minimal layout designed to showcase your company’s vision, services, and team with clarity and style. Perfect for startups or established brands, it balances professionalism and creativity effortlessly. Fully editable and compatible with PowerPoint, Keynote, and Google Slides for seamless customization.


8 slides
Market Expansion Strategies in North America Map Presentation
Visualize your market growth plans with this strategic North America map slide. Highlight four regional expansion points with vibrant markers and customizable labels. Perfect for showcasing entry strategies, regional goals, or sales plans. Fully editable in PowerPoint, Keynote, and Google Slides—ideal for professional business and marketing presentations.


6 slides
Creative Alphabetic Infographic
Bring your message to life with a bright, alphabet-inspired layout that turns simple letters into eye-catching storytelling elements. This presentation is perfect for organizing steps, categories, or key ideas in a memorable way while keeping everything clear and structured. Fully editable and compatible with PowerPoint, Keynote, and Google Slides.


4 slides
Comparison Tables Slide Presentation
Make your insights instantly comparable with a clean layout designed to highlight differences and advantages with ease. This presentation helps you break down options, features, or plans in a clear visual table your audience can understand at a glance. Fully compatible with PowerPoint, Keynote, and Google Slides.


6 slides
Cloud Computing Infographic
Cloud Computing refers to the delivery of computing services over the internet, allowing users to access and use resources such as storage, applications, and processing power on-demand. This infographic template is designed to provide an overview of cloud computing technology. It aims to explain the concept of cloud computing, its benefits, and its impact on various industries and everyday life. This can be used as valuable resource for individuals and organizations seeking to understand the fundamentals and benefits of cloud computing. Compatible with Powerpoint, Keynote, and Google Slide.


6 slides
Business Logic Flow Chart
Streamline complex processes with the Business Logic Flow Chart Presentation. This modern, curved connector design helps you visually outline up to five sequential steps or logic paths, using colorful icons and editable text fields. Ideal for business workflows, strategic plans, or data flow maps. Fully compatible with PowerPoint, Keynote, and Google Slides.


4 slides
Preventive Health Services Layout Presentation
Make health data more human with this modern infographic layout for service-based reporting. This preventive health slide design clearly maps wellness categories to body parts, making it easy to communicate medical insights and early intervention strategies. Fully editable and compatible with PowerPoint, Keynote, and Google Slides for smooth integration into any deck.


21 slides
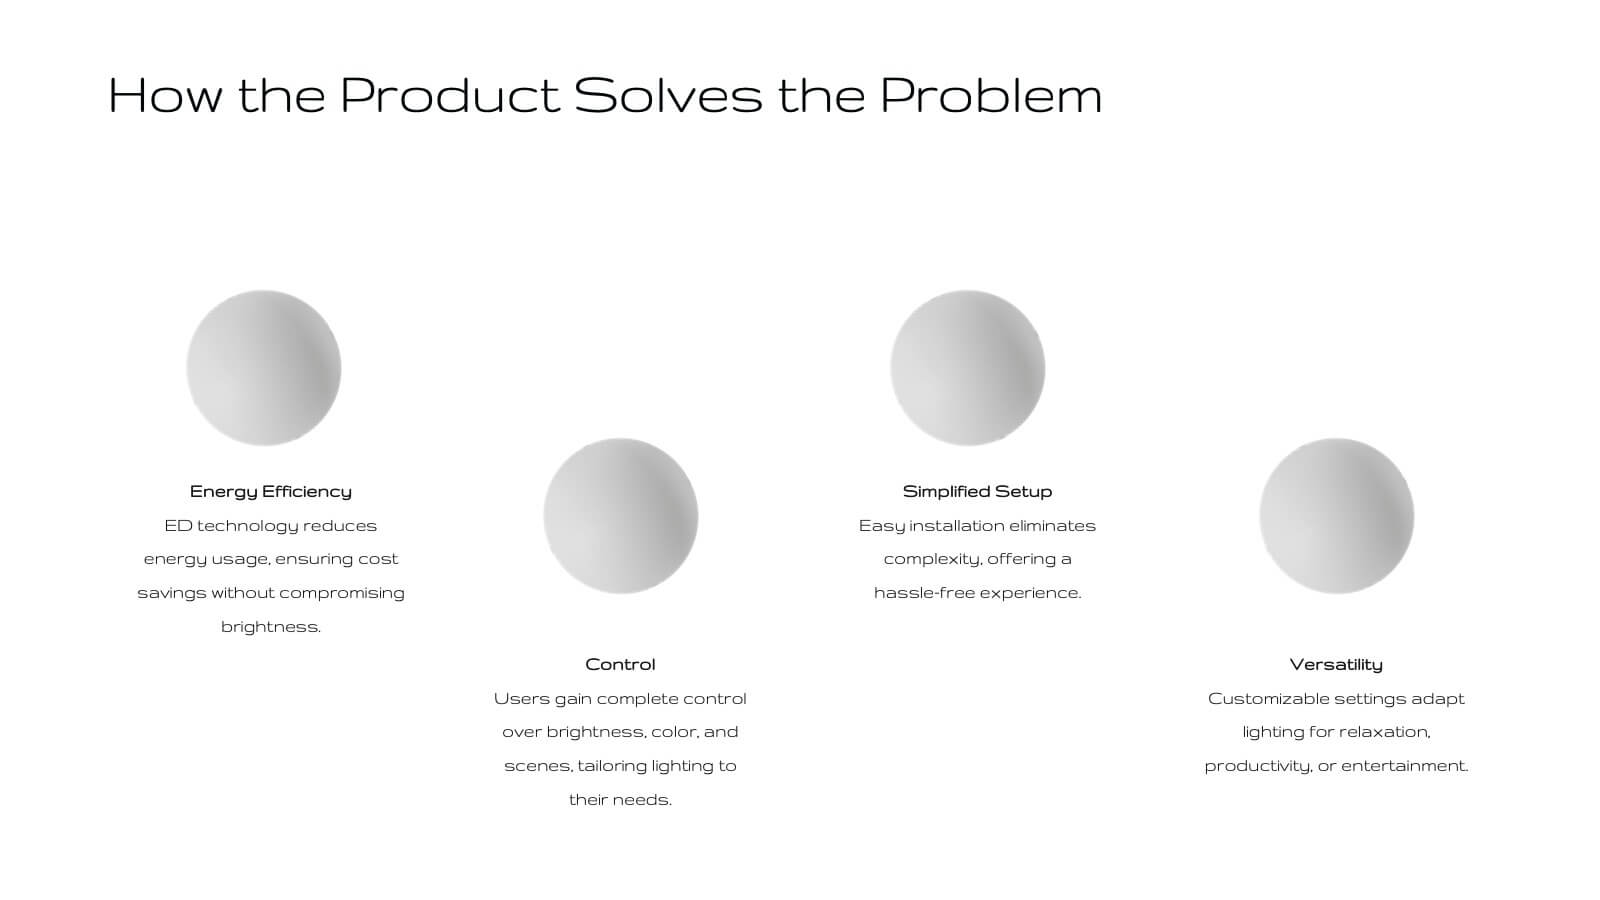
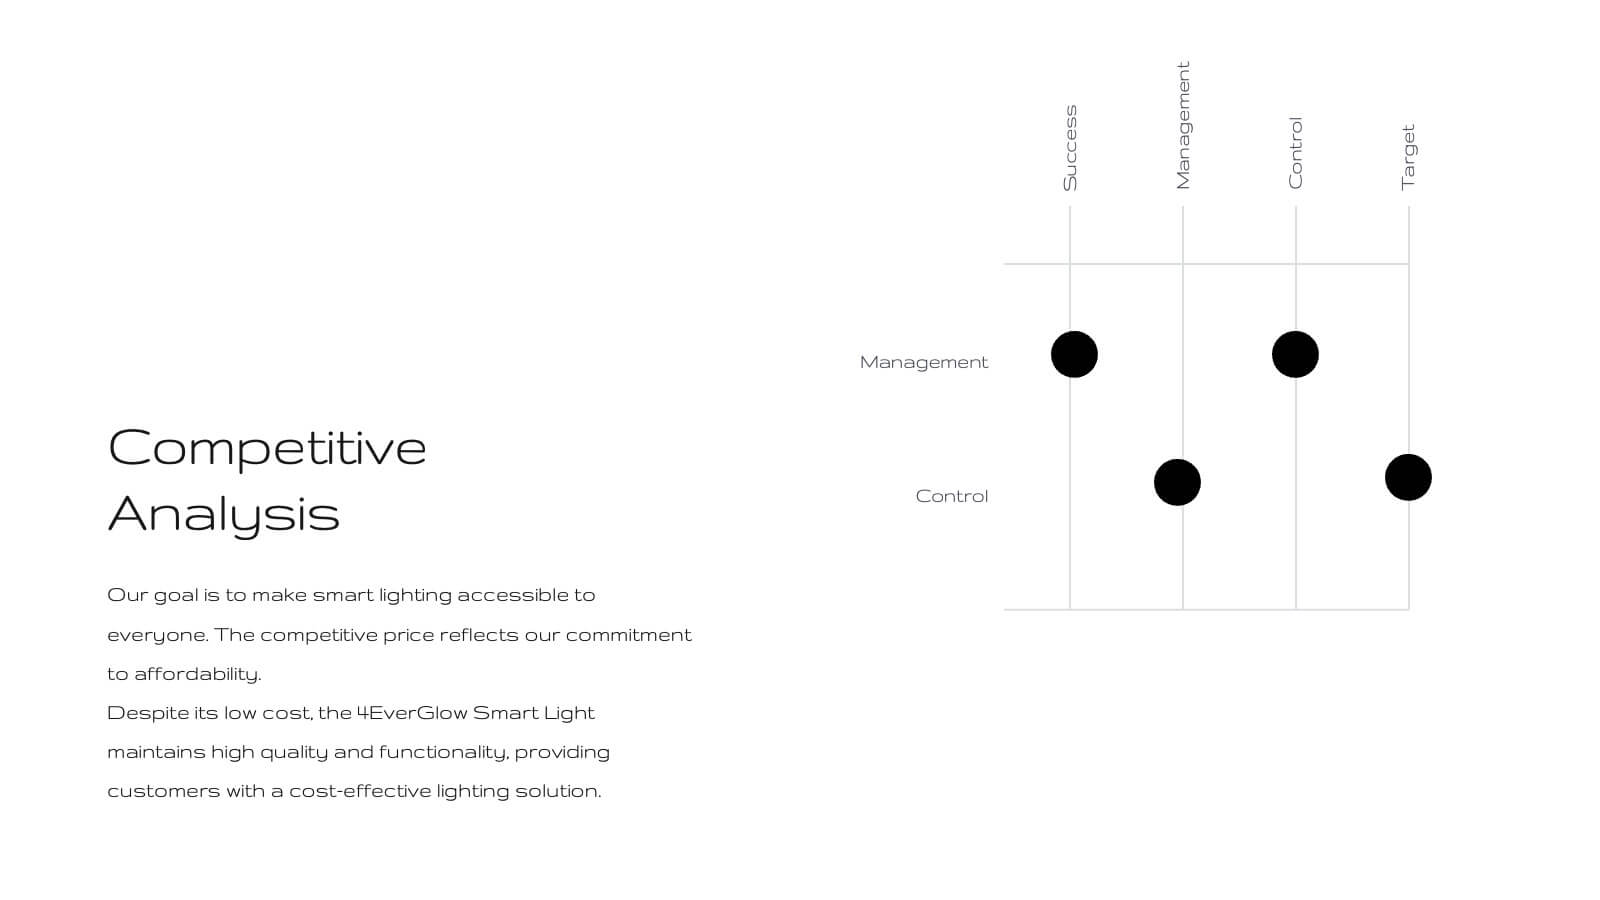
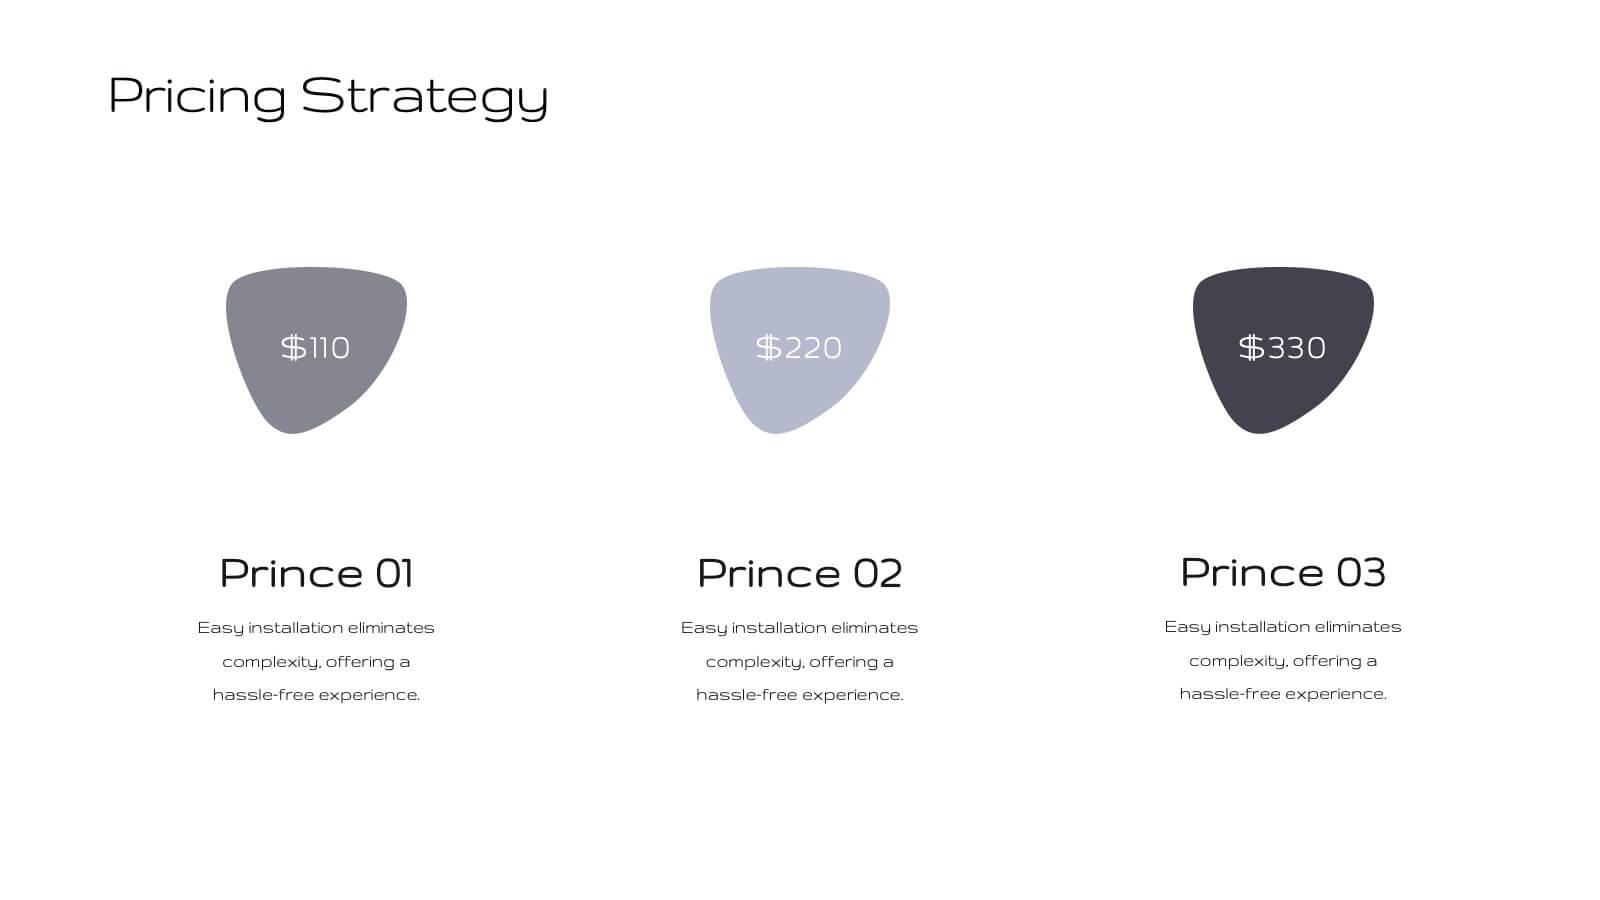
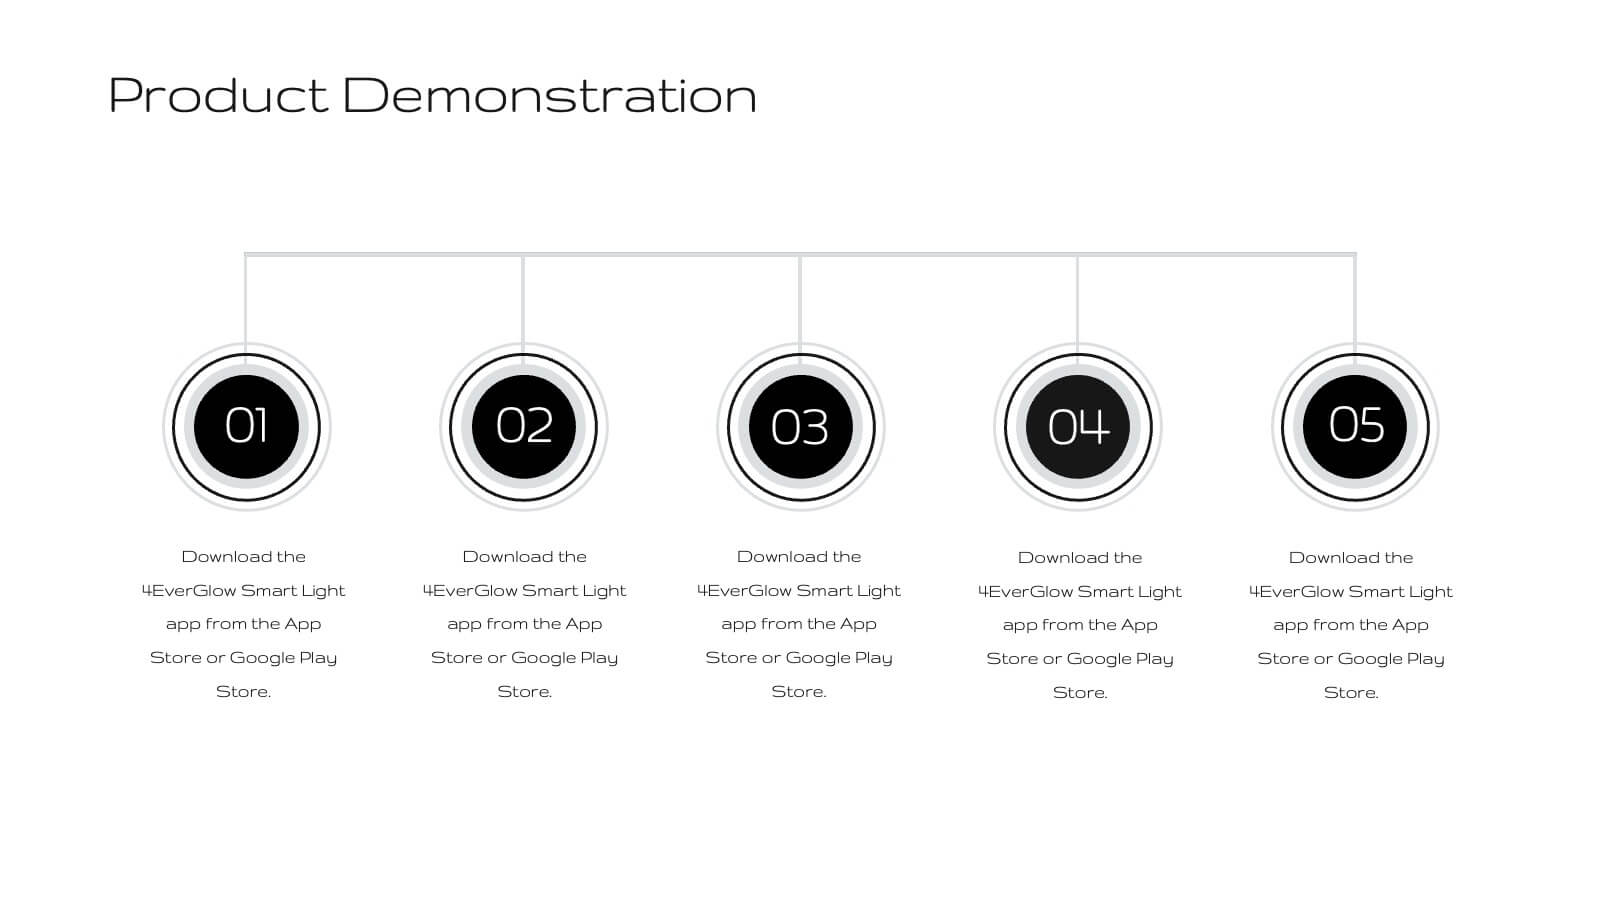
Fortuna Product Development Plan Presentation
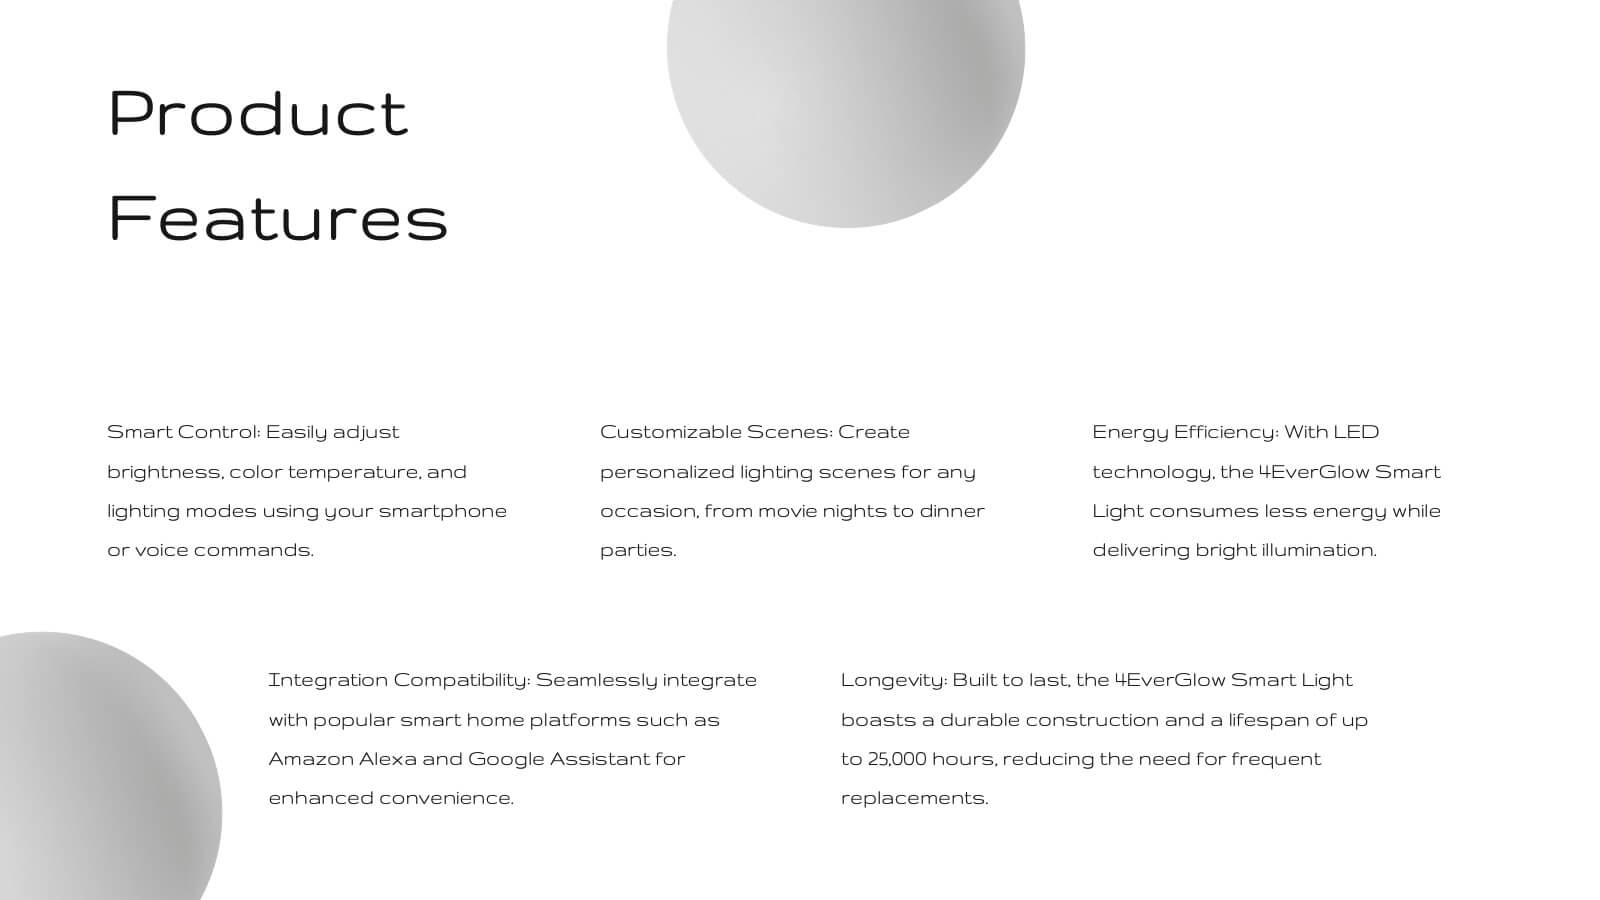
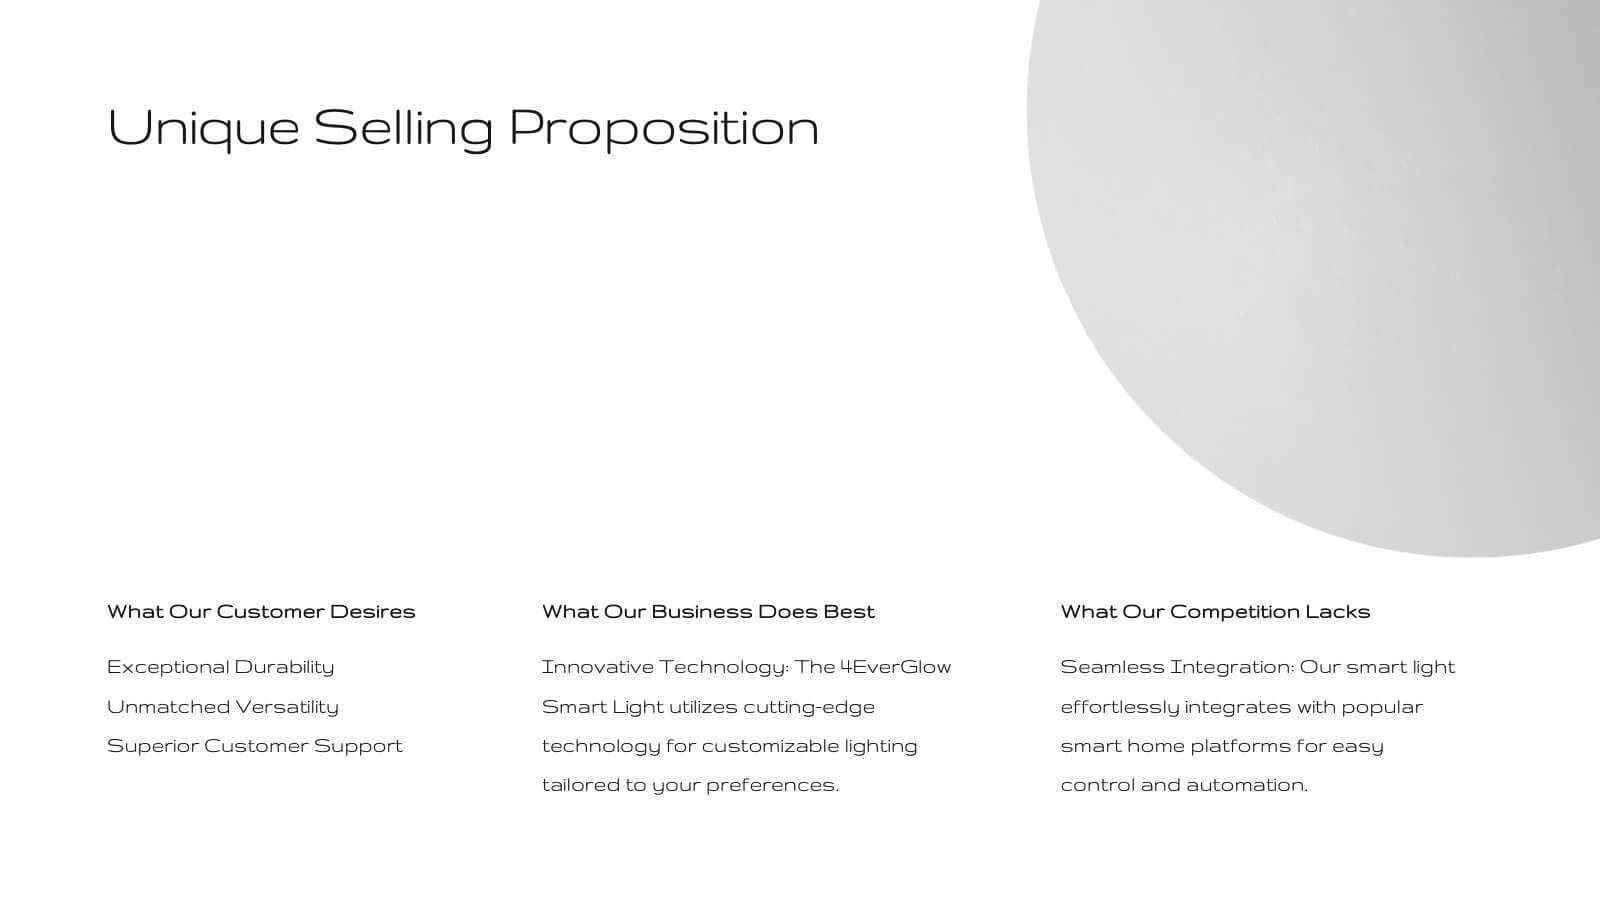
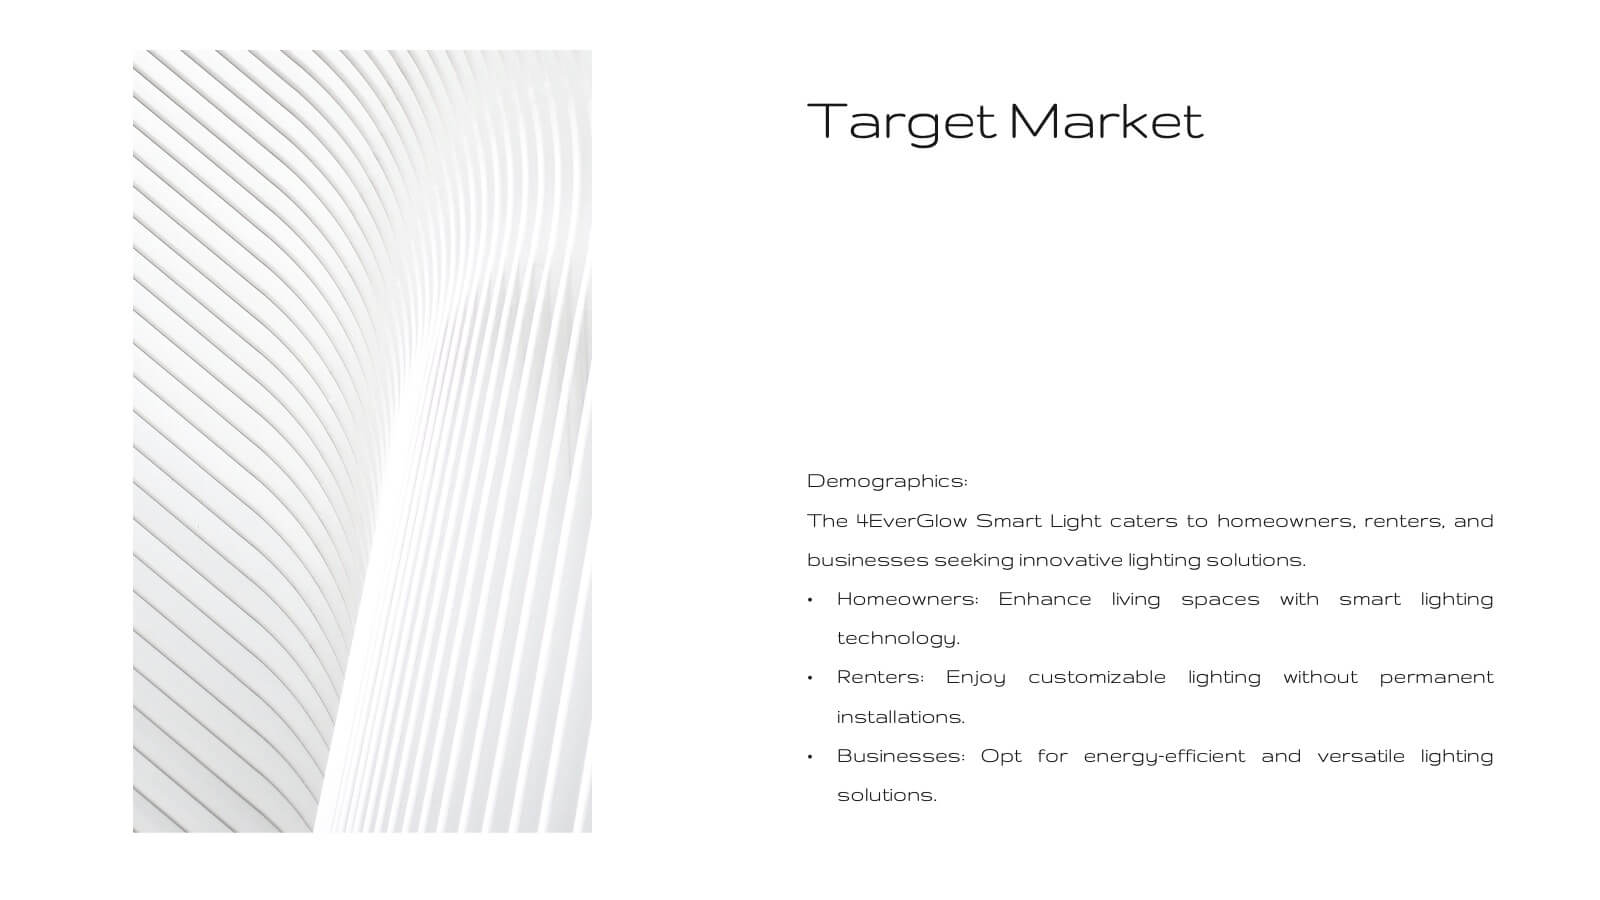
Unveil your product's potential with this elegant, minimalist presentation template. Perfect for detailing product development, features, and market strategies, it features a clean design that emphasizes clarity and professionalism. Highlight key aspects like customer pain points, competitive analysis, and pricing strategies to captivate your audience. Compatible with PowerPoint, Keynote, and Google Slides, it ensures seamless presentations on any platform.


7 slides
Company Structure Infographic
Company structure, often referred to as organizational structure, outlines how a company is organized in terms of hierarchy, roles, responsibilities, and the flow of information. Discover the inner workings of your organization with our Company Structure Infographic. This visually captivating and informative infographic serves as a guide to understanding the hierarchical layout, roles, and relationships within your company. Compatible with Powerpoint, Keynote, and Google Slides. Illustrate the structure levels within the company, showcasing the roles and responsibilities at each level and how they contribute to the company's success.


8 slides
Lean Business Model Canvas Framework Presentation
Visualize your entire business strategy on a single slide with this Lean Business Model Canvas. Ideal for startups or strategic planning, each editable block represents a key area: value propositions, customer segments, revenue, and more. Streamlined and clear, it's perfect for team alignment or investor-ready business model pitches.


6 slides
Pricing Table Infographic
Present your pricing structures clearly with our Pricing Table Infographic, compatible with Powerpoint, Google Slides, and Keynote. This template is designed for businesses of all sizes to display different pricing tiers and package options. Color-coded for ease of comparison, each column provides a visual breakdown of features, costs, and benefits, making it perfect for sales presentations and marketing materials. With customizable rows and icons, you can tailor the information to match your services or products, ensuring your audience understands the value at each price point.


23 slides
Bracken Small Business Pitch Deck Presentation
This clean and professional presentation template is perfect for showcasing your business ideas, market opportunities, and growth strategies. It includes essential sections such as company background, SWOT analysis, financial performance, marketing plan, and revenue models. Key highlights like competitive advantages, investment opportunities, and milestones ensure a comprehensive and organized pitch to captivate investors and stakeholders. Fully customizable and compatible with PowerPoint, Keynote, and Google Slides.


5 slides
SMART Objective Planning for Success Presentation
Turn your goal-setting process into a clear, actionable strategy with this SMART Objective Planning slide. Designed around the SMART framework—Specific, Measurable, Achievable, Relevant, Time-bound—this layout helps you articulate objectives with clarity and focus. Each segment features a bold letter with icons and editable descriptions beneath. Ideal for planning sessions, strategic reviews, and team alignment meetings. Compatible with PowerPoint, Keynote, and Google Slides.