


Features
- 6 Unique slides
- Fully editable and easy to edit in Microsoft Powerpoint, Keynote and Google Slides
- 16:9 widescreen layout
- Clean and professional designs
- Export to JPG, PDF or send by email


Do you have any questions?
Recommend


20 slides
Chordstream Professional Portfolio Showcase Presentation
The Portfolio Presentation Template offers a modern and creative design, perfect for showcasing your projects, philosophy, and services. With 20 customizable slides, it includes sections for project highlights, pricing, client testimonials, and contact information. Compatible with PowerPoint, Keynote, and Google Slides, this template ensures professional impact for creatives.


4 slides
Technology Device Mockup Presentation
Bring your ideas to life with a sleek, modern slide that showcases your digital product in a clean smartphone mockup. This presentation explains key features or app benefits with clear, structured text that keeps your message focused and professional. Fully compatible with PowerPoint, Keynote, and Google Slides for easy editing and use.
21 slides
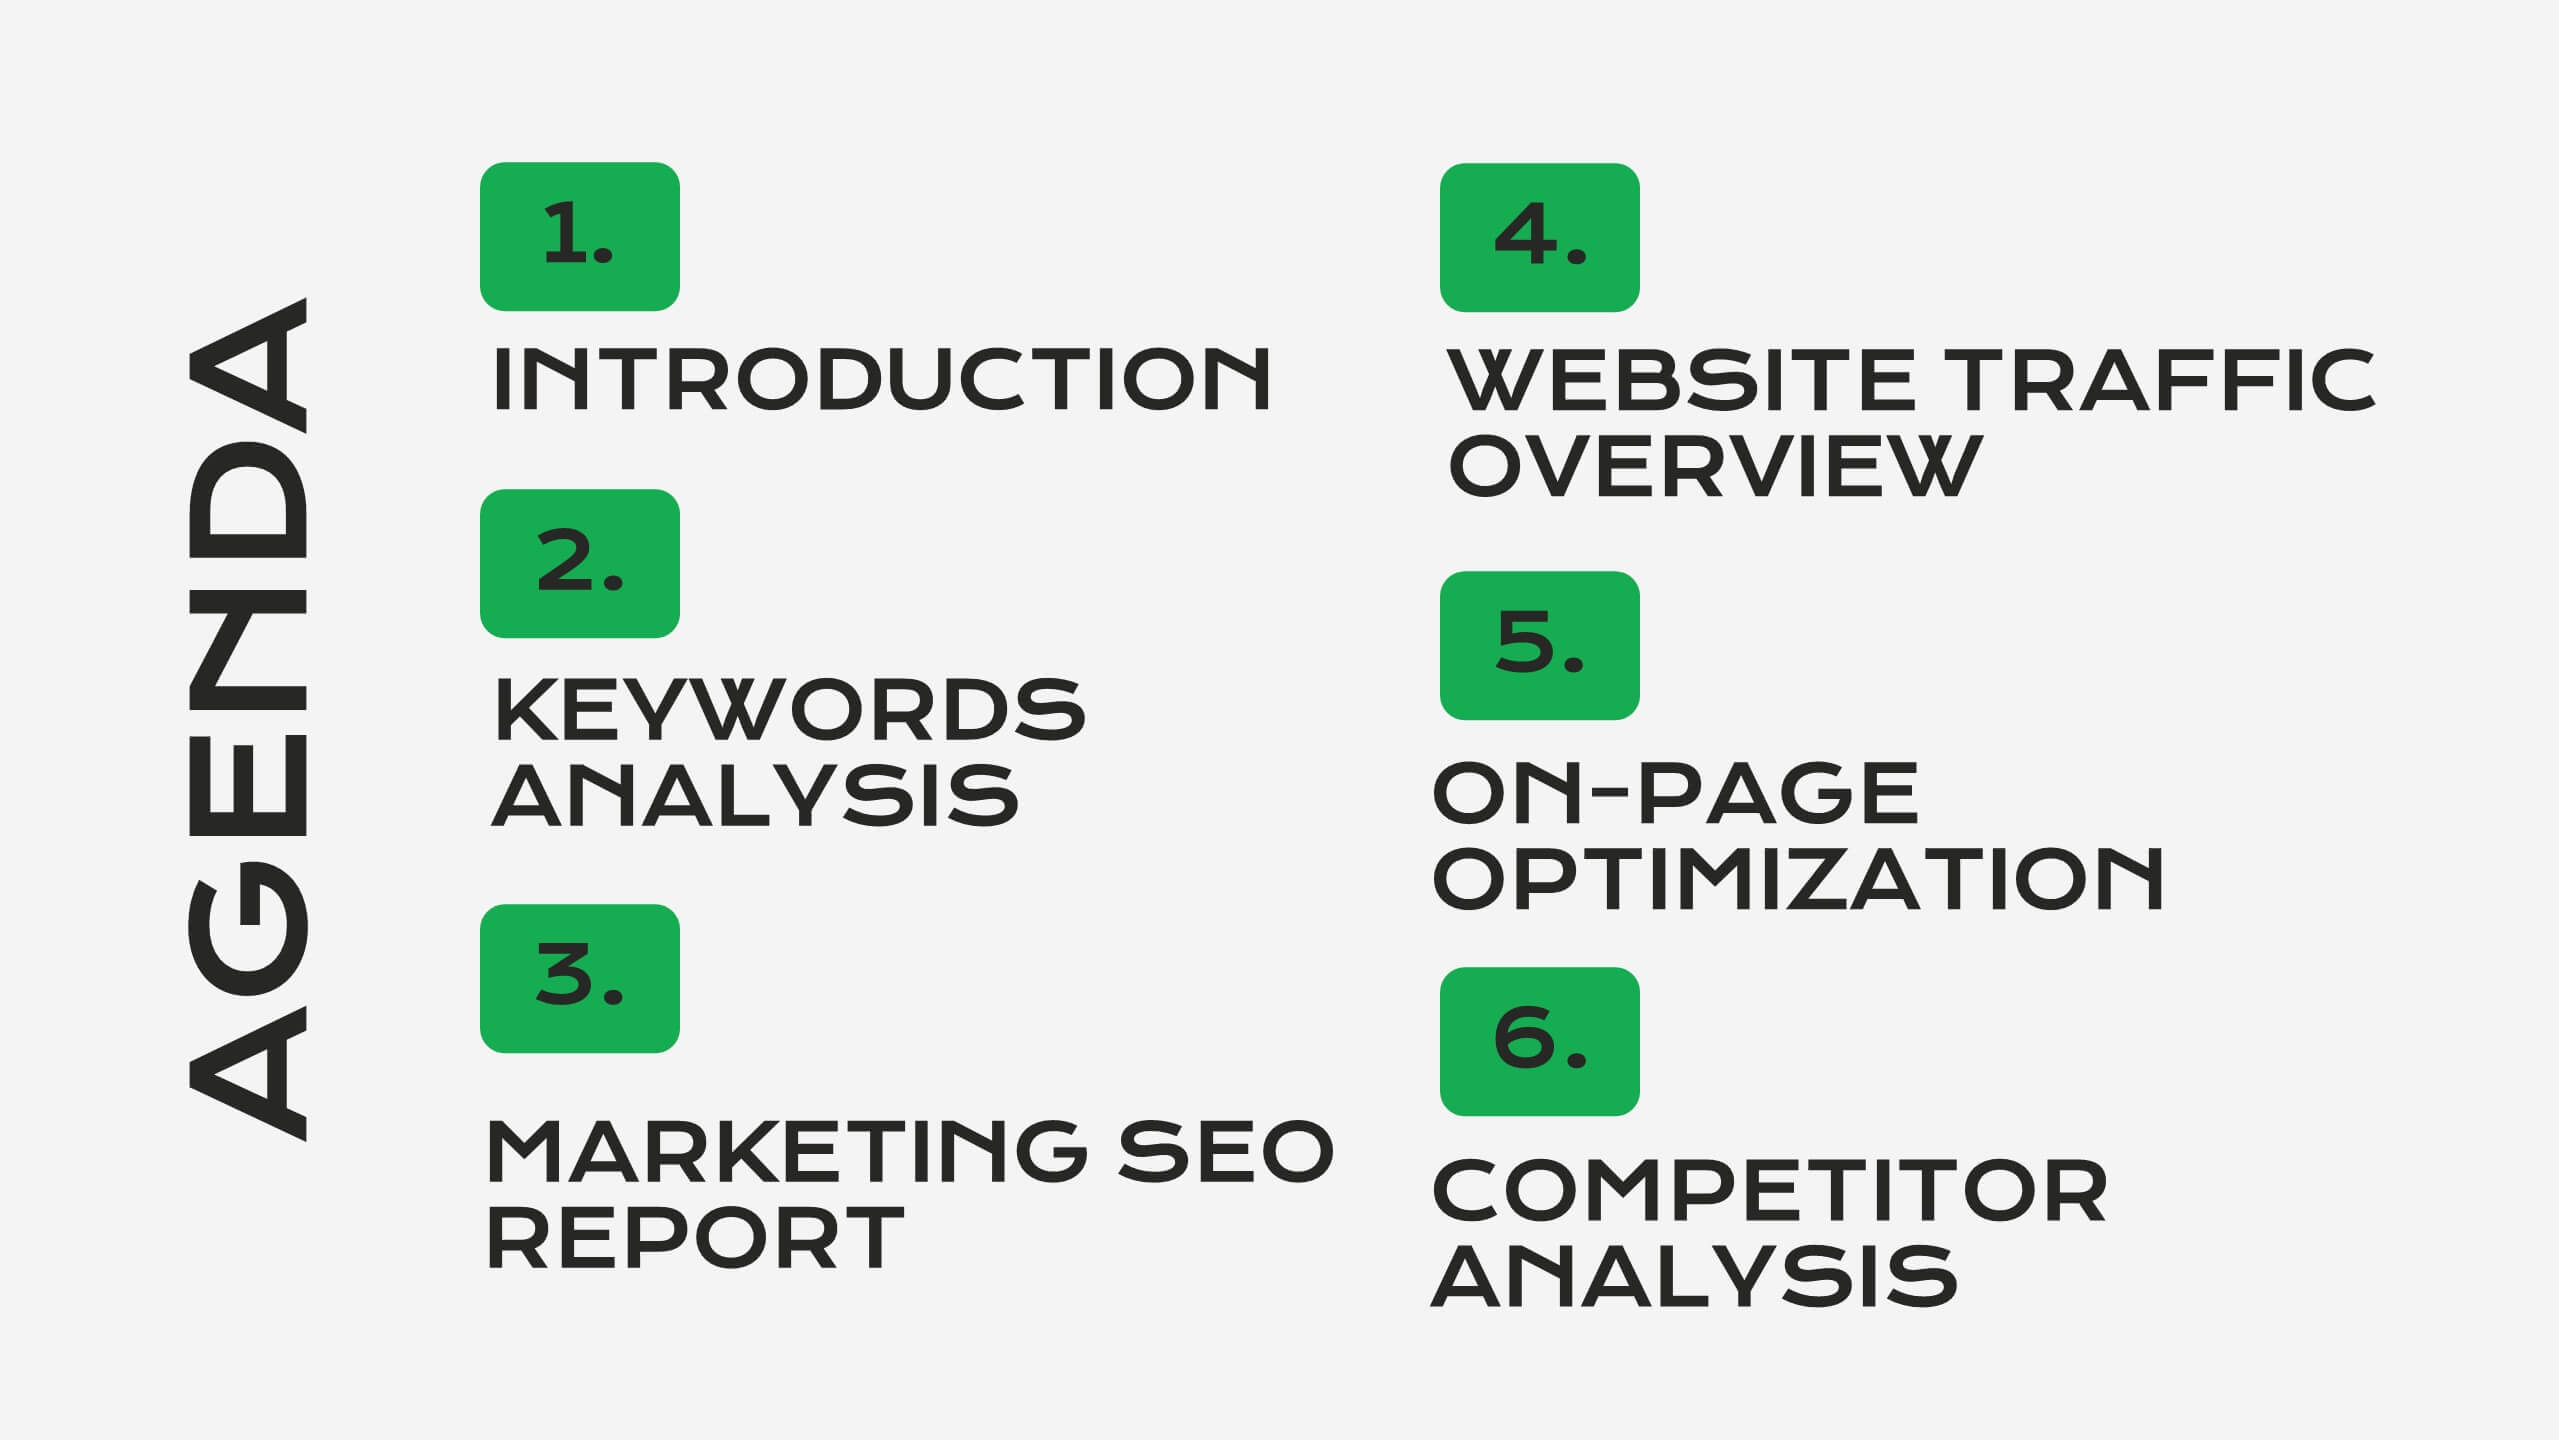
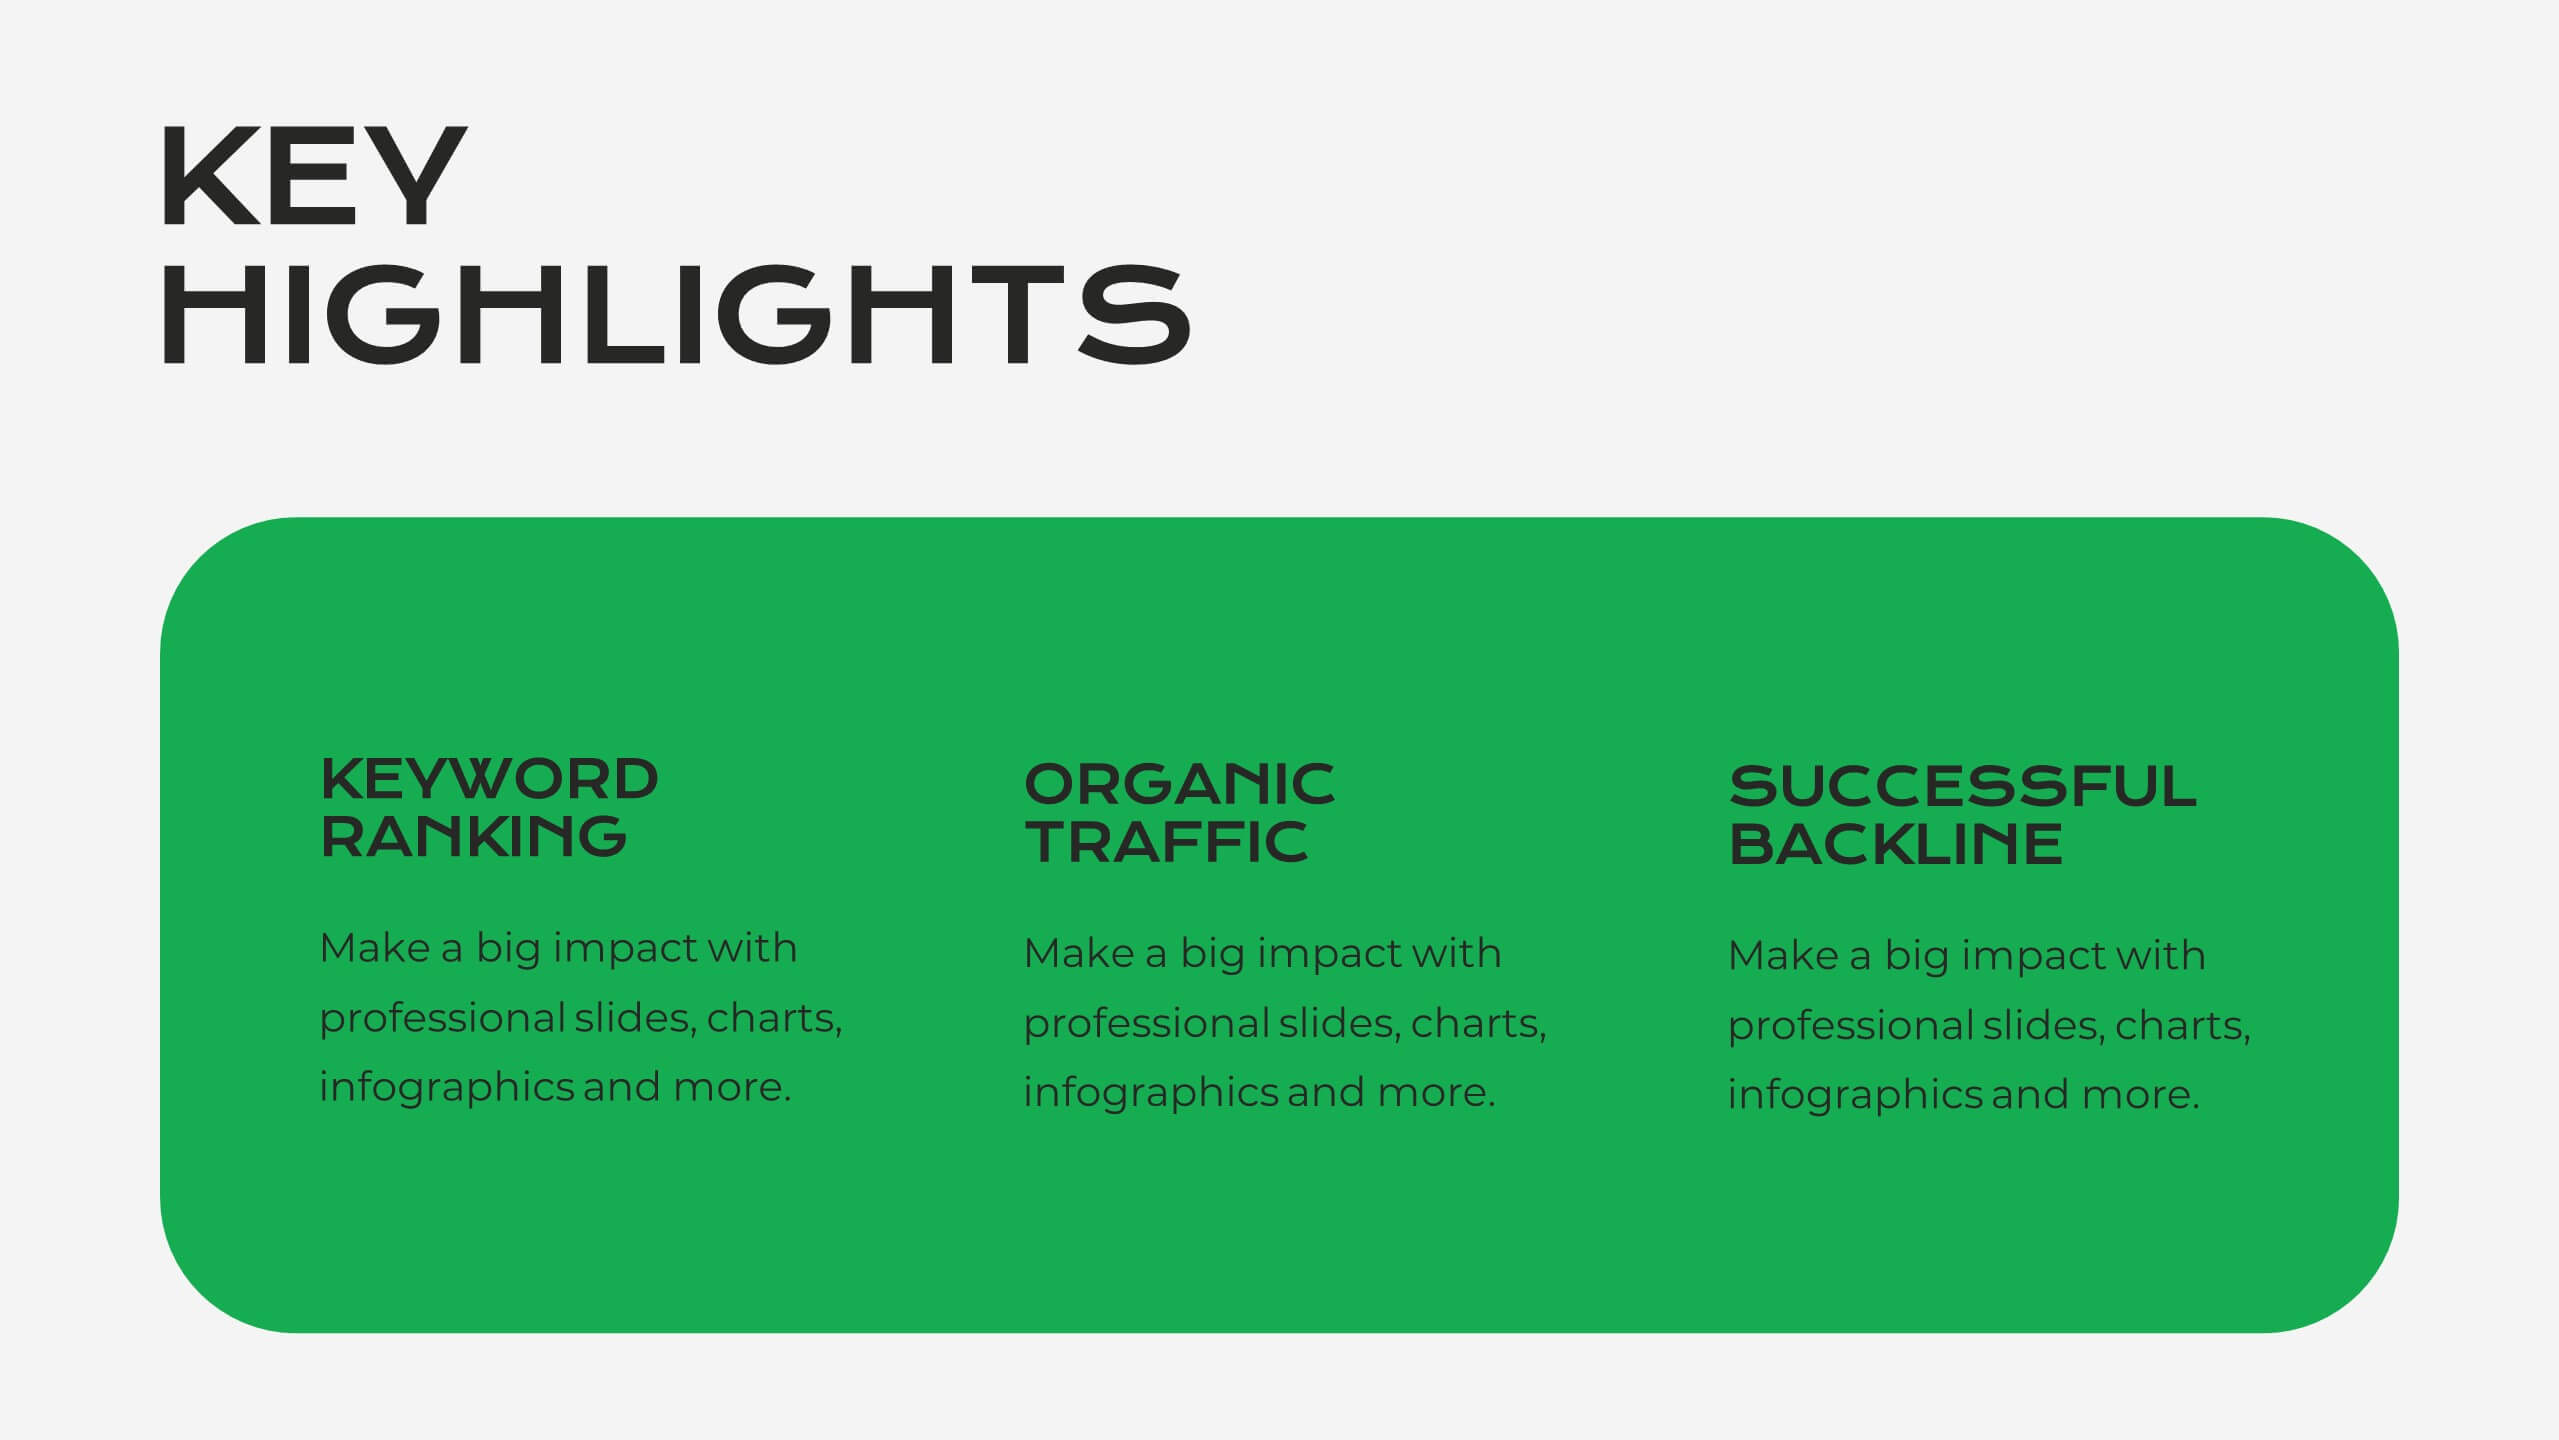
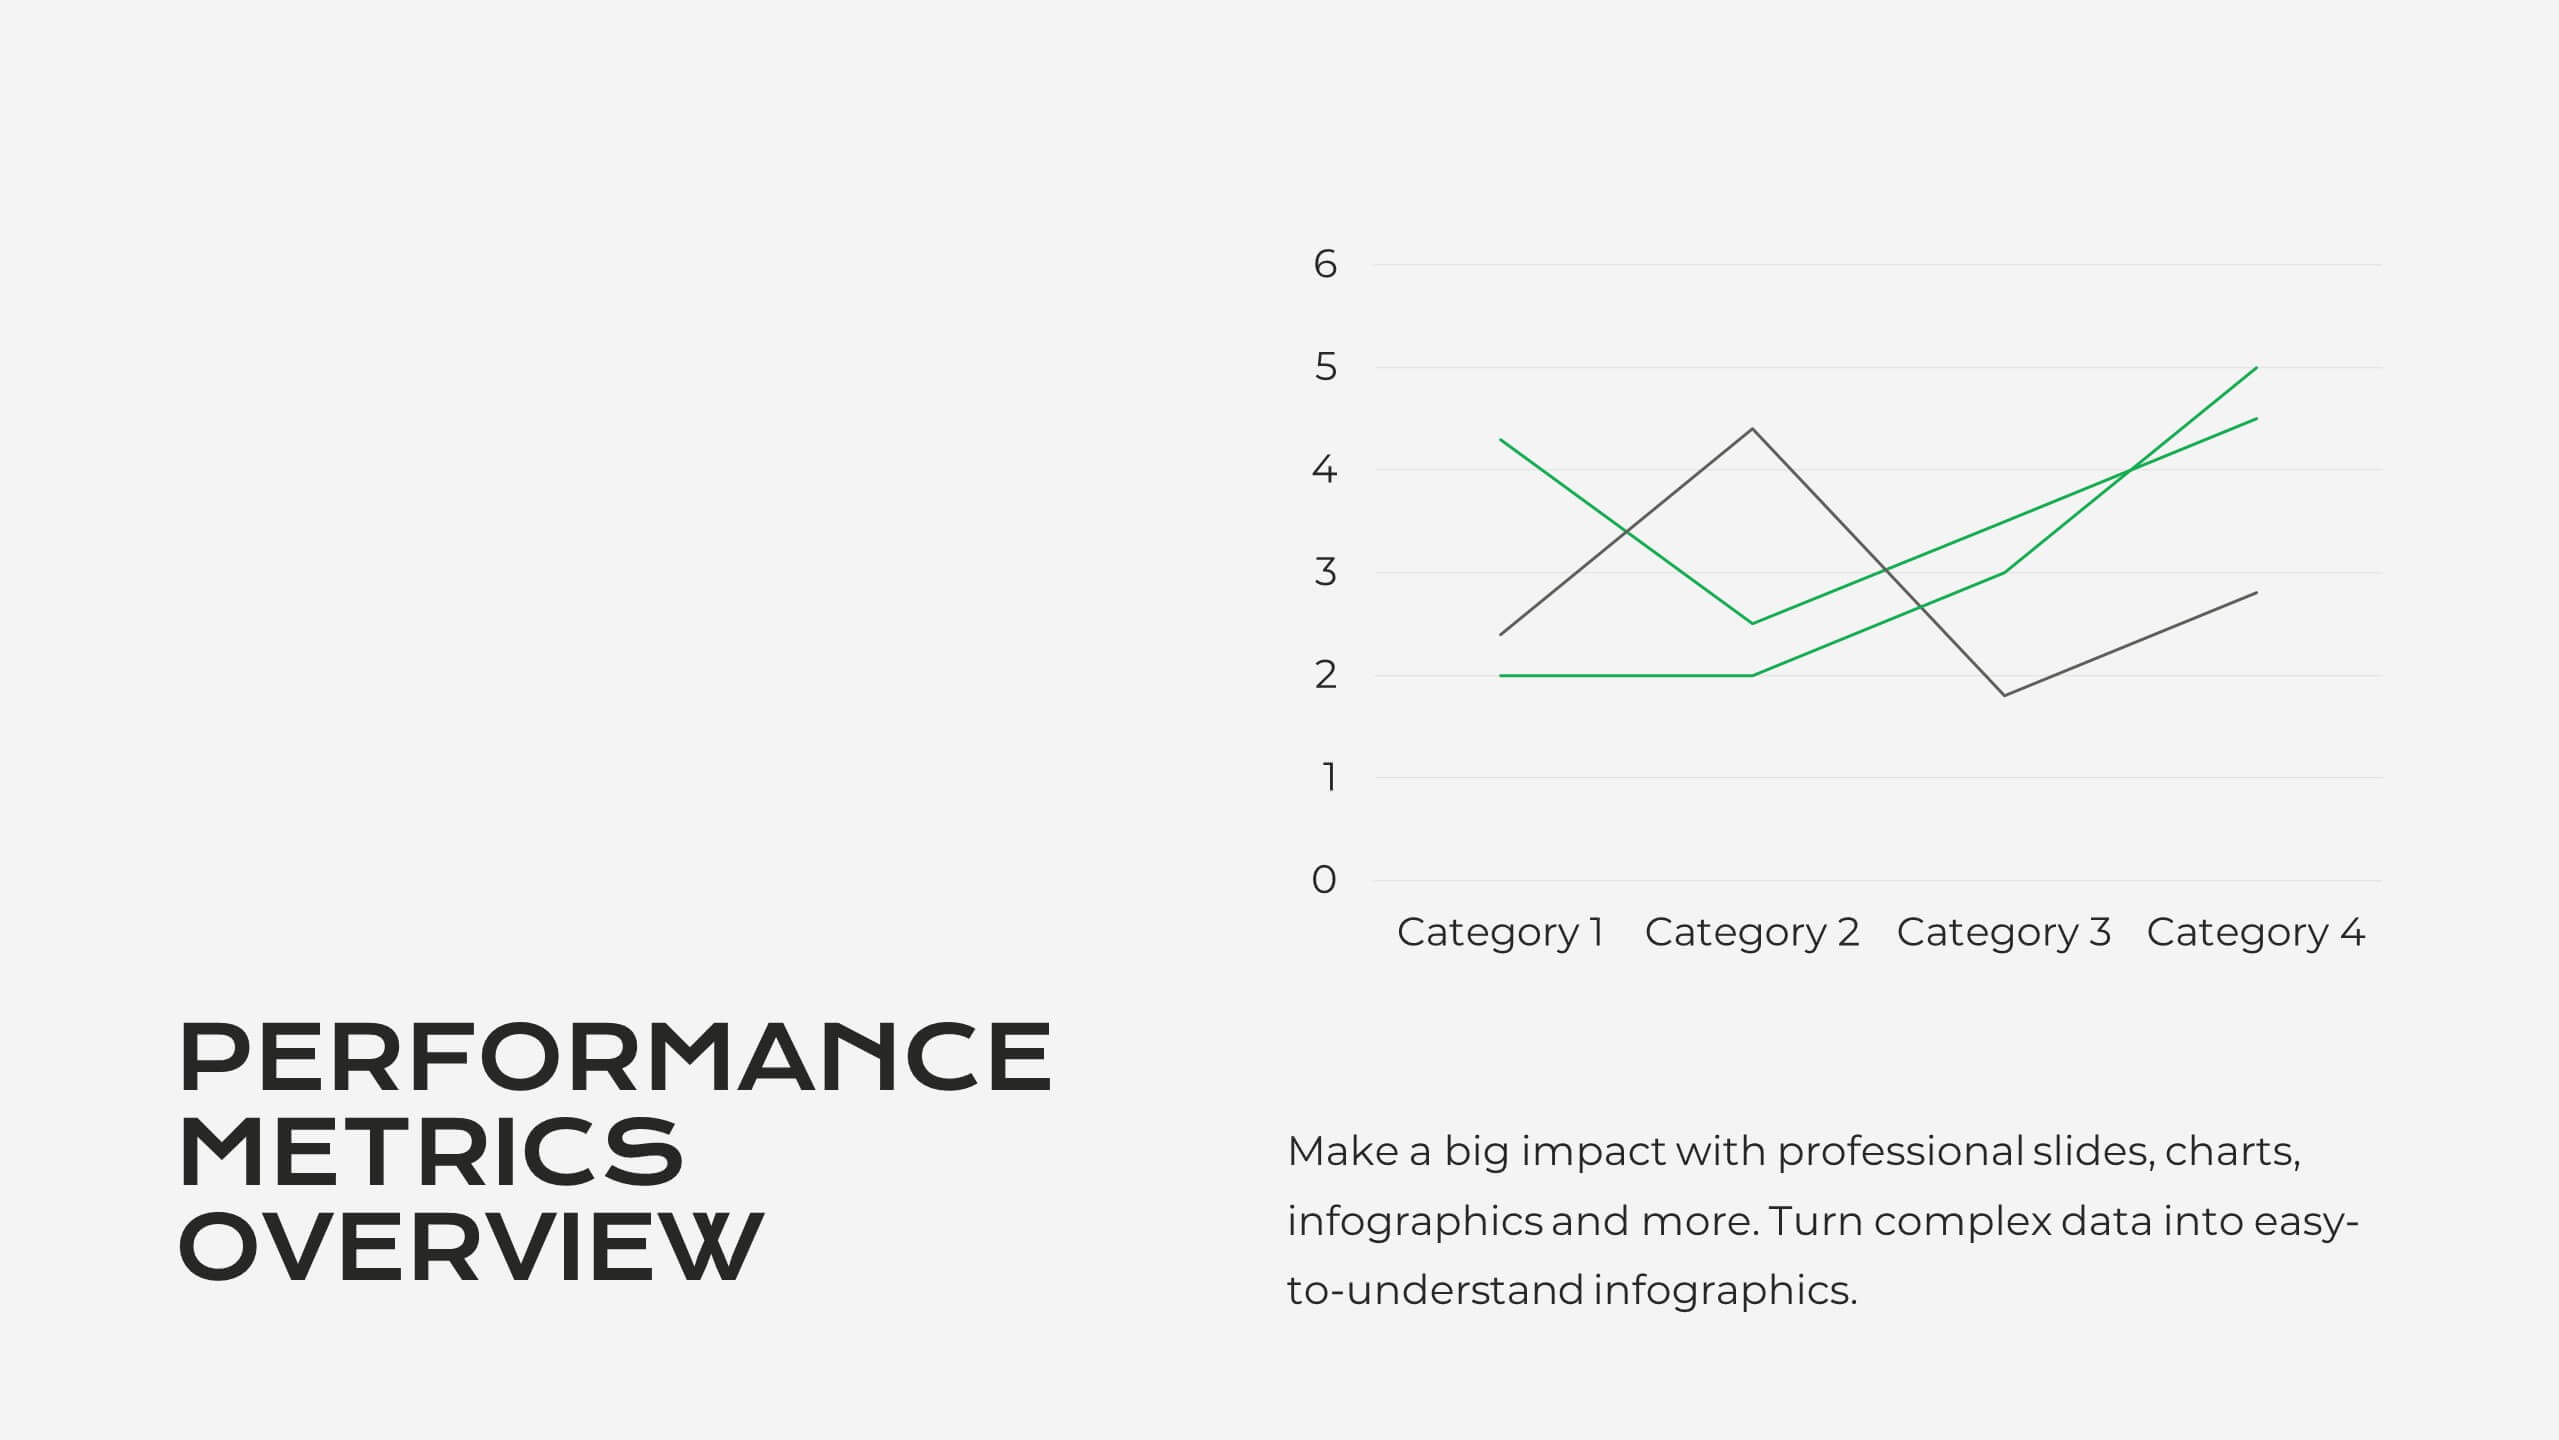
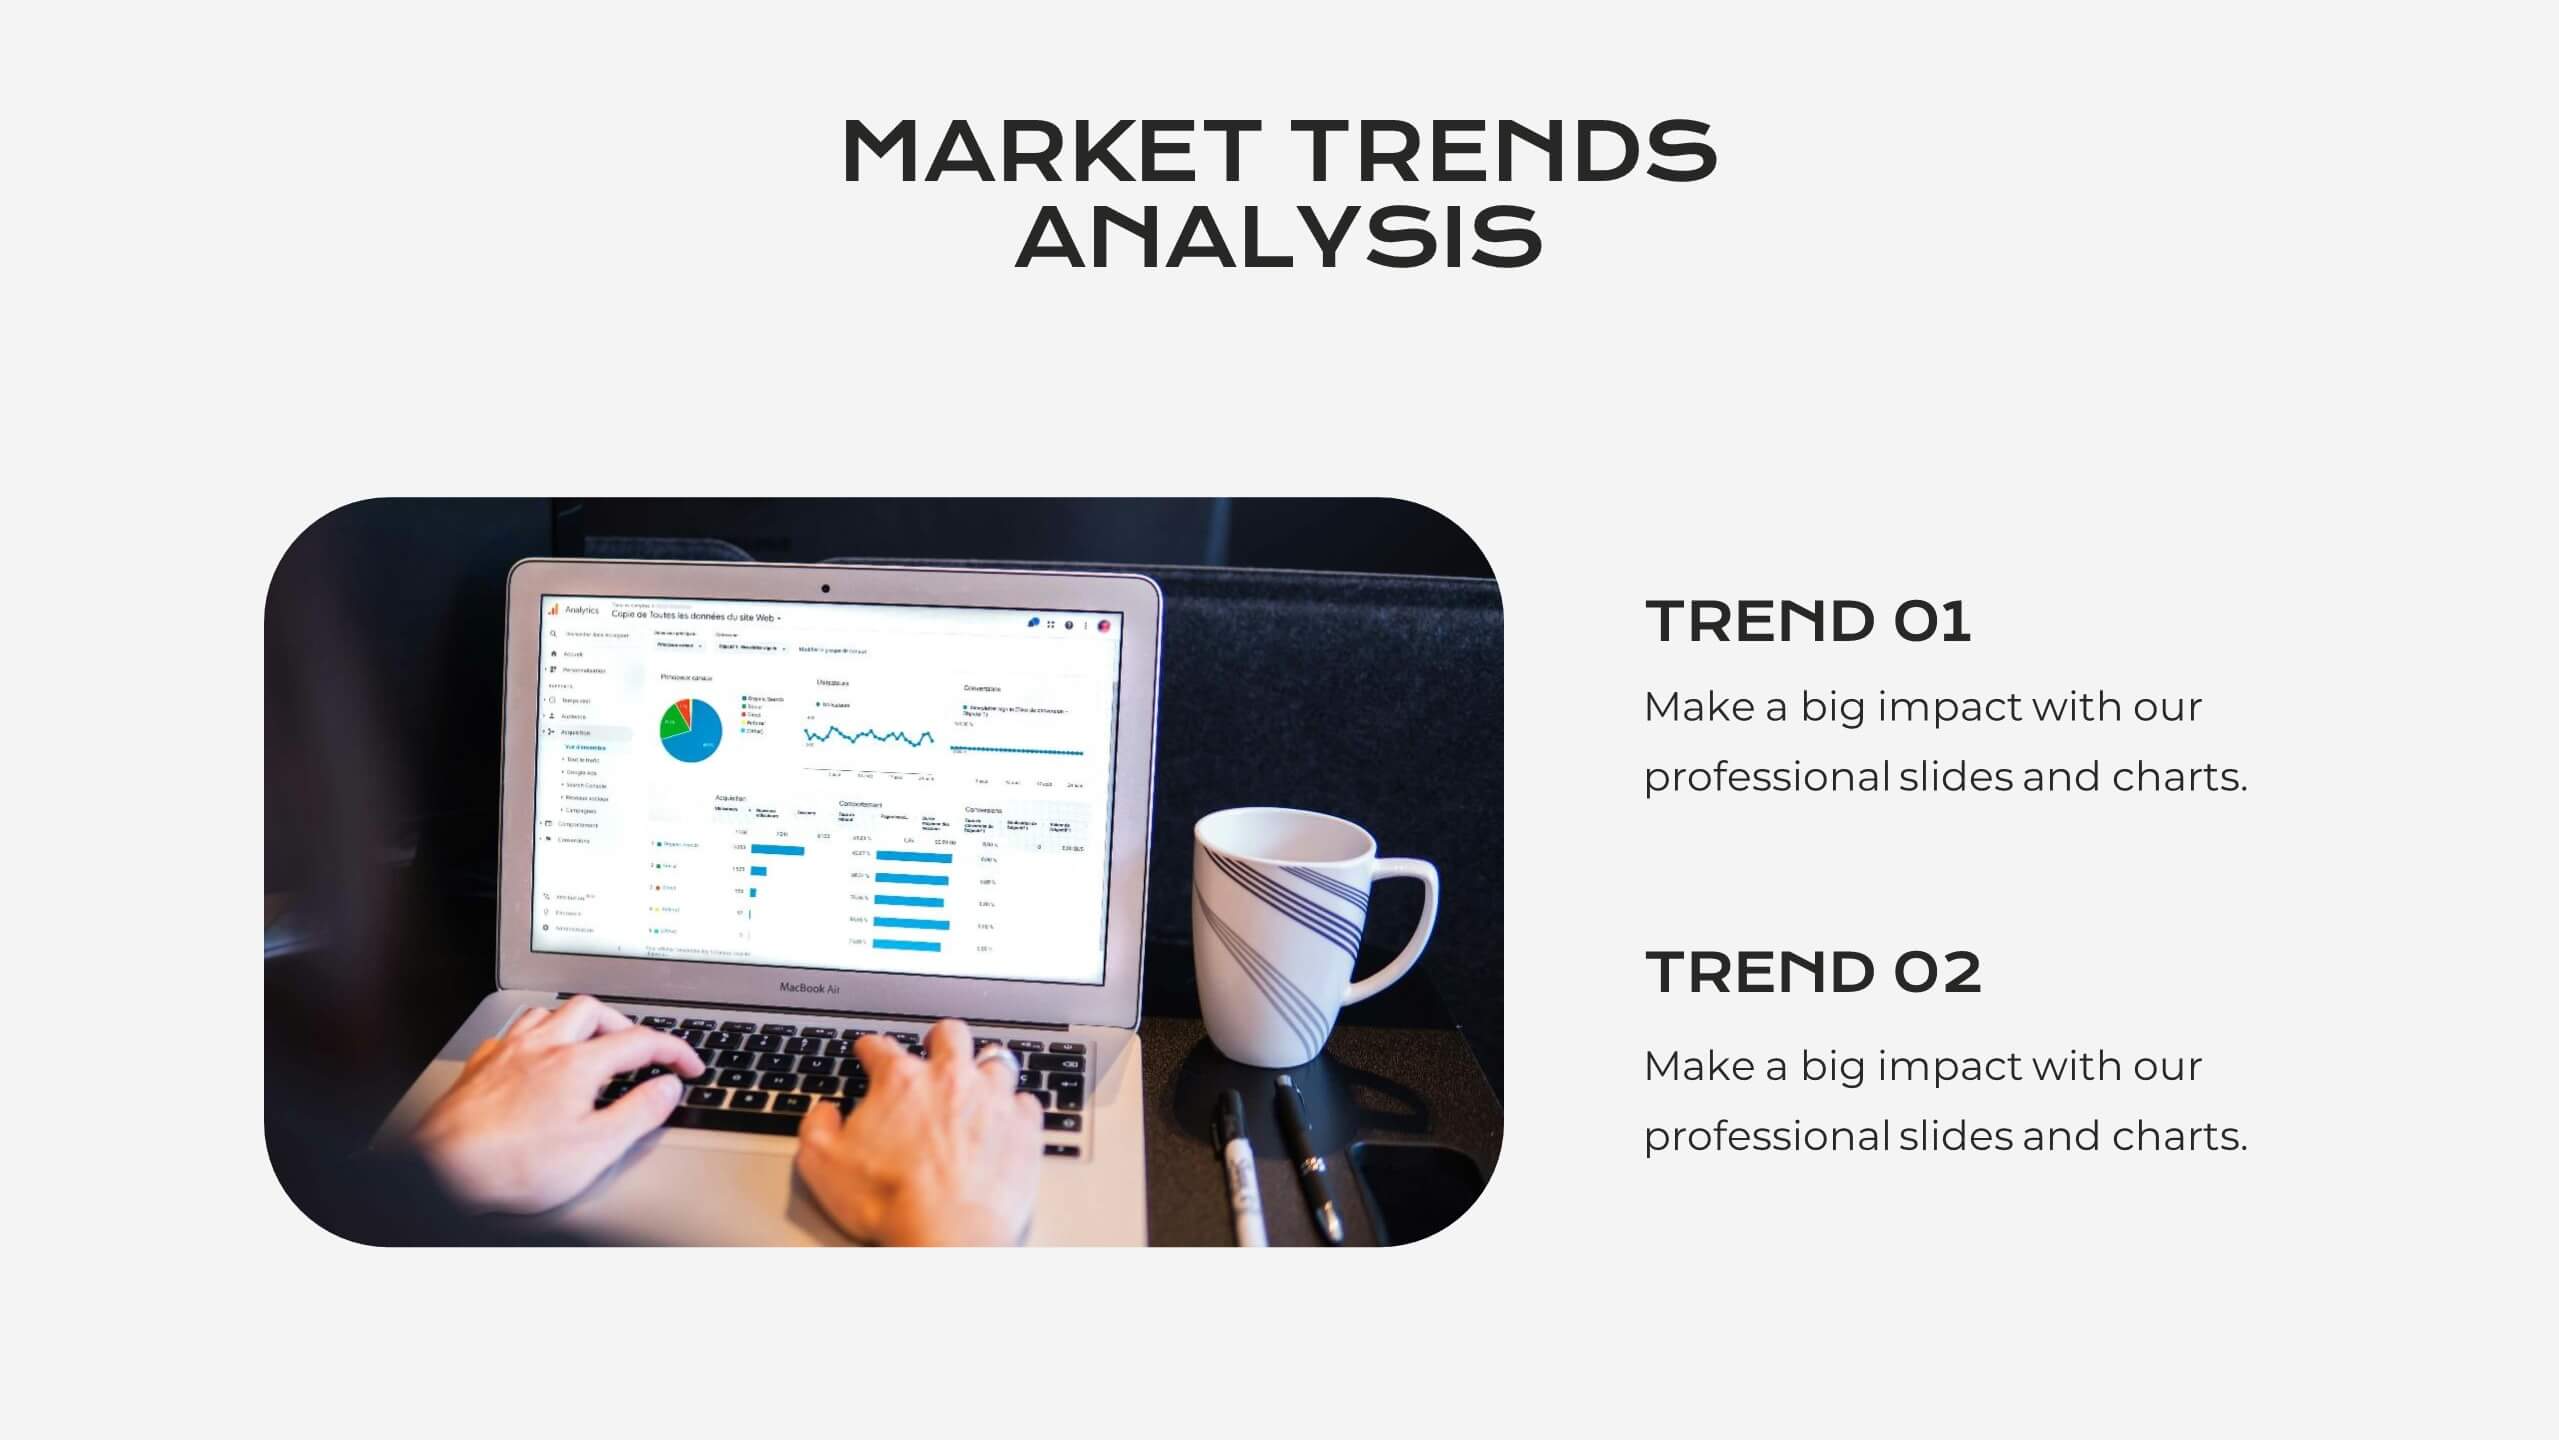
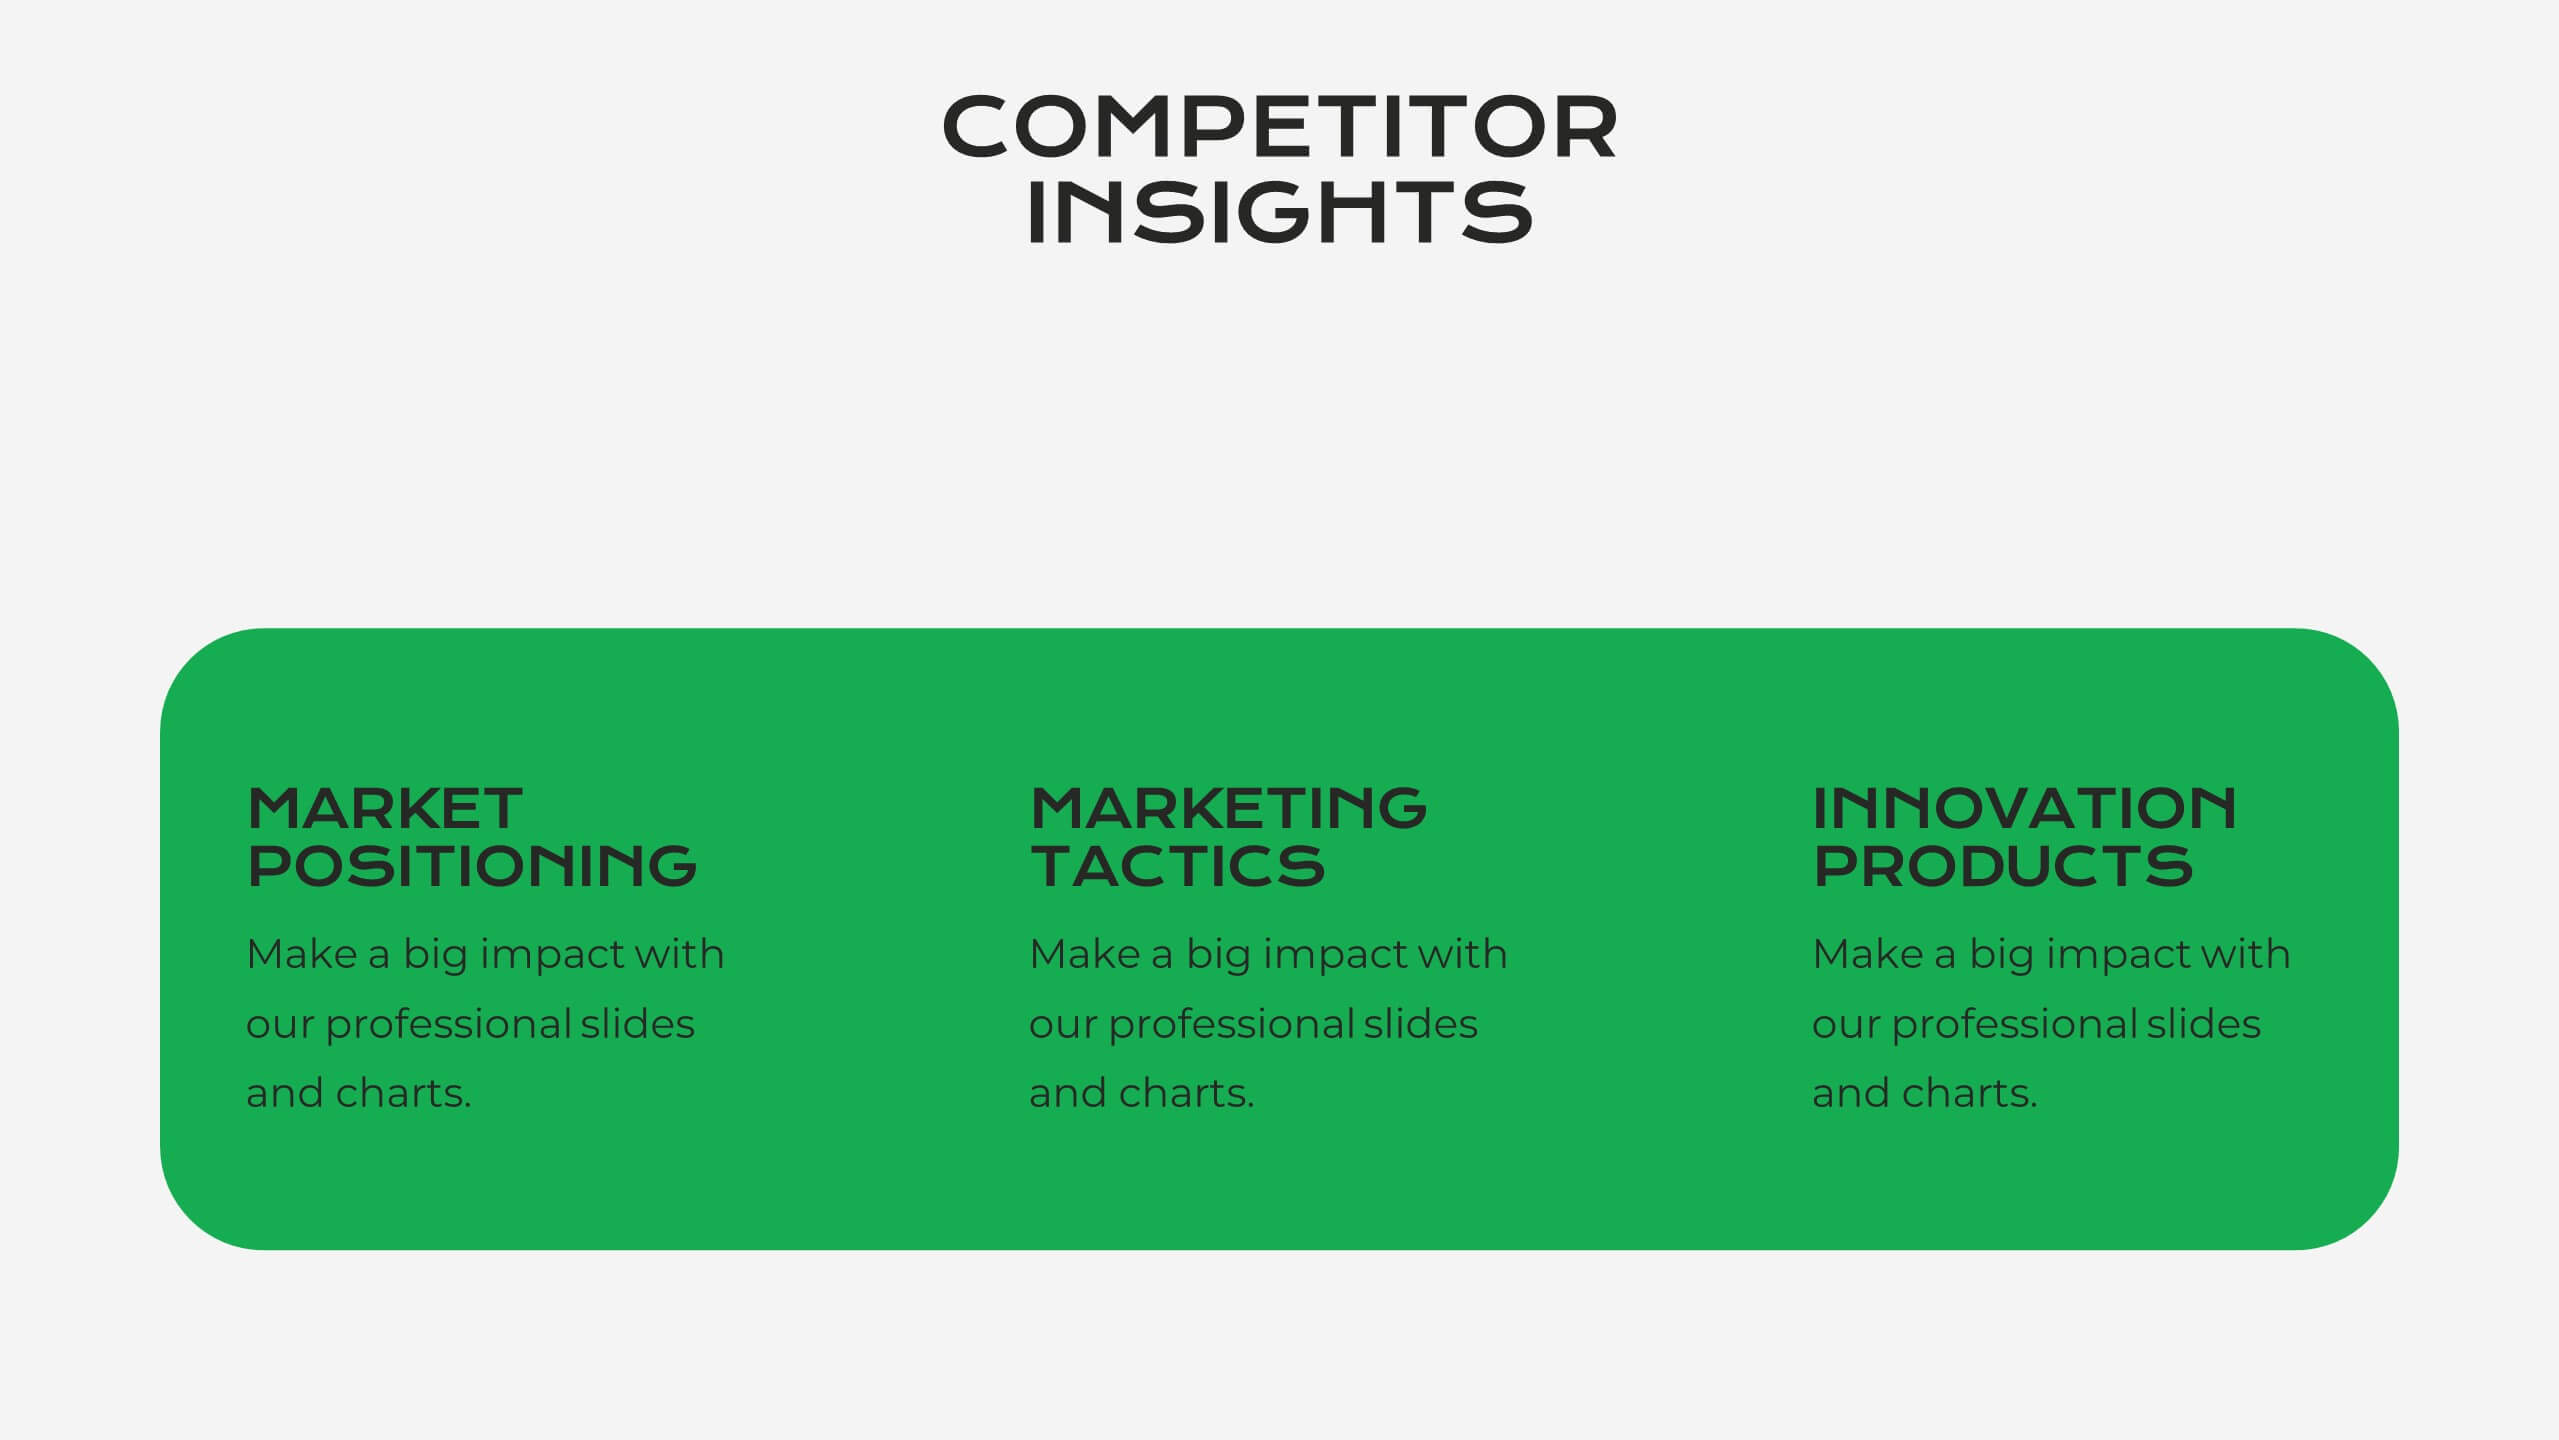
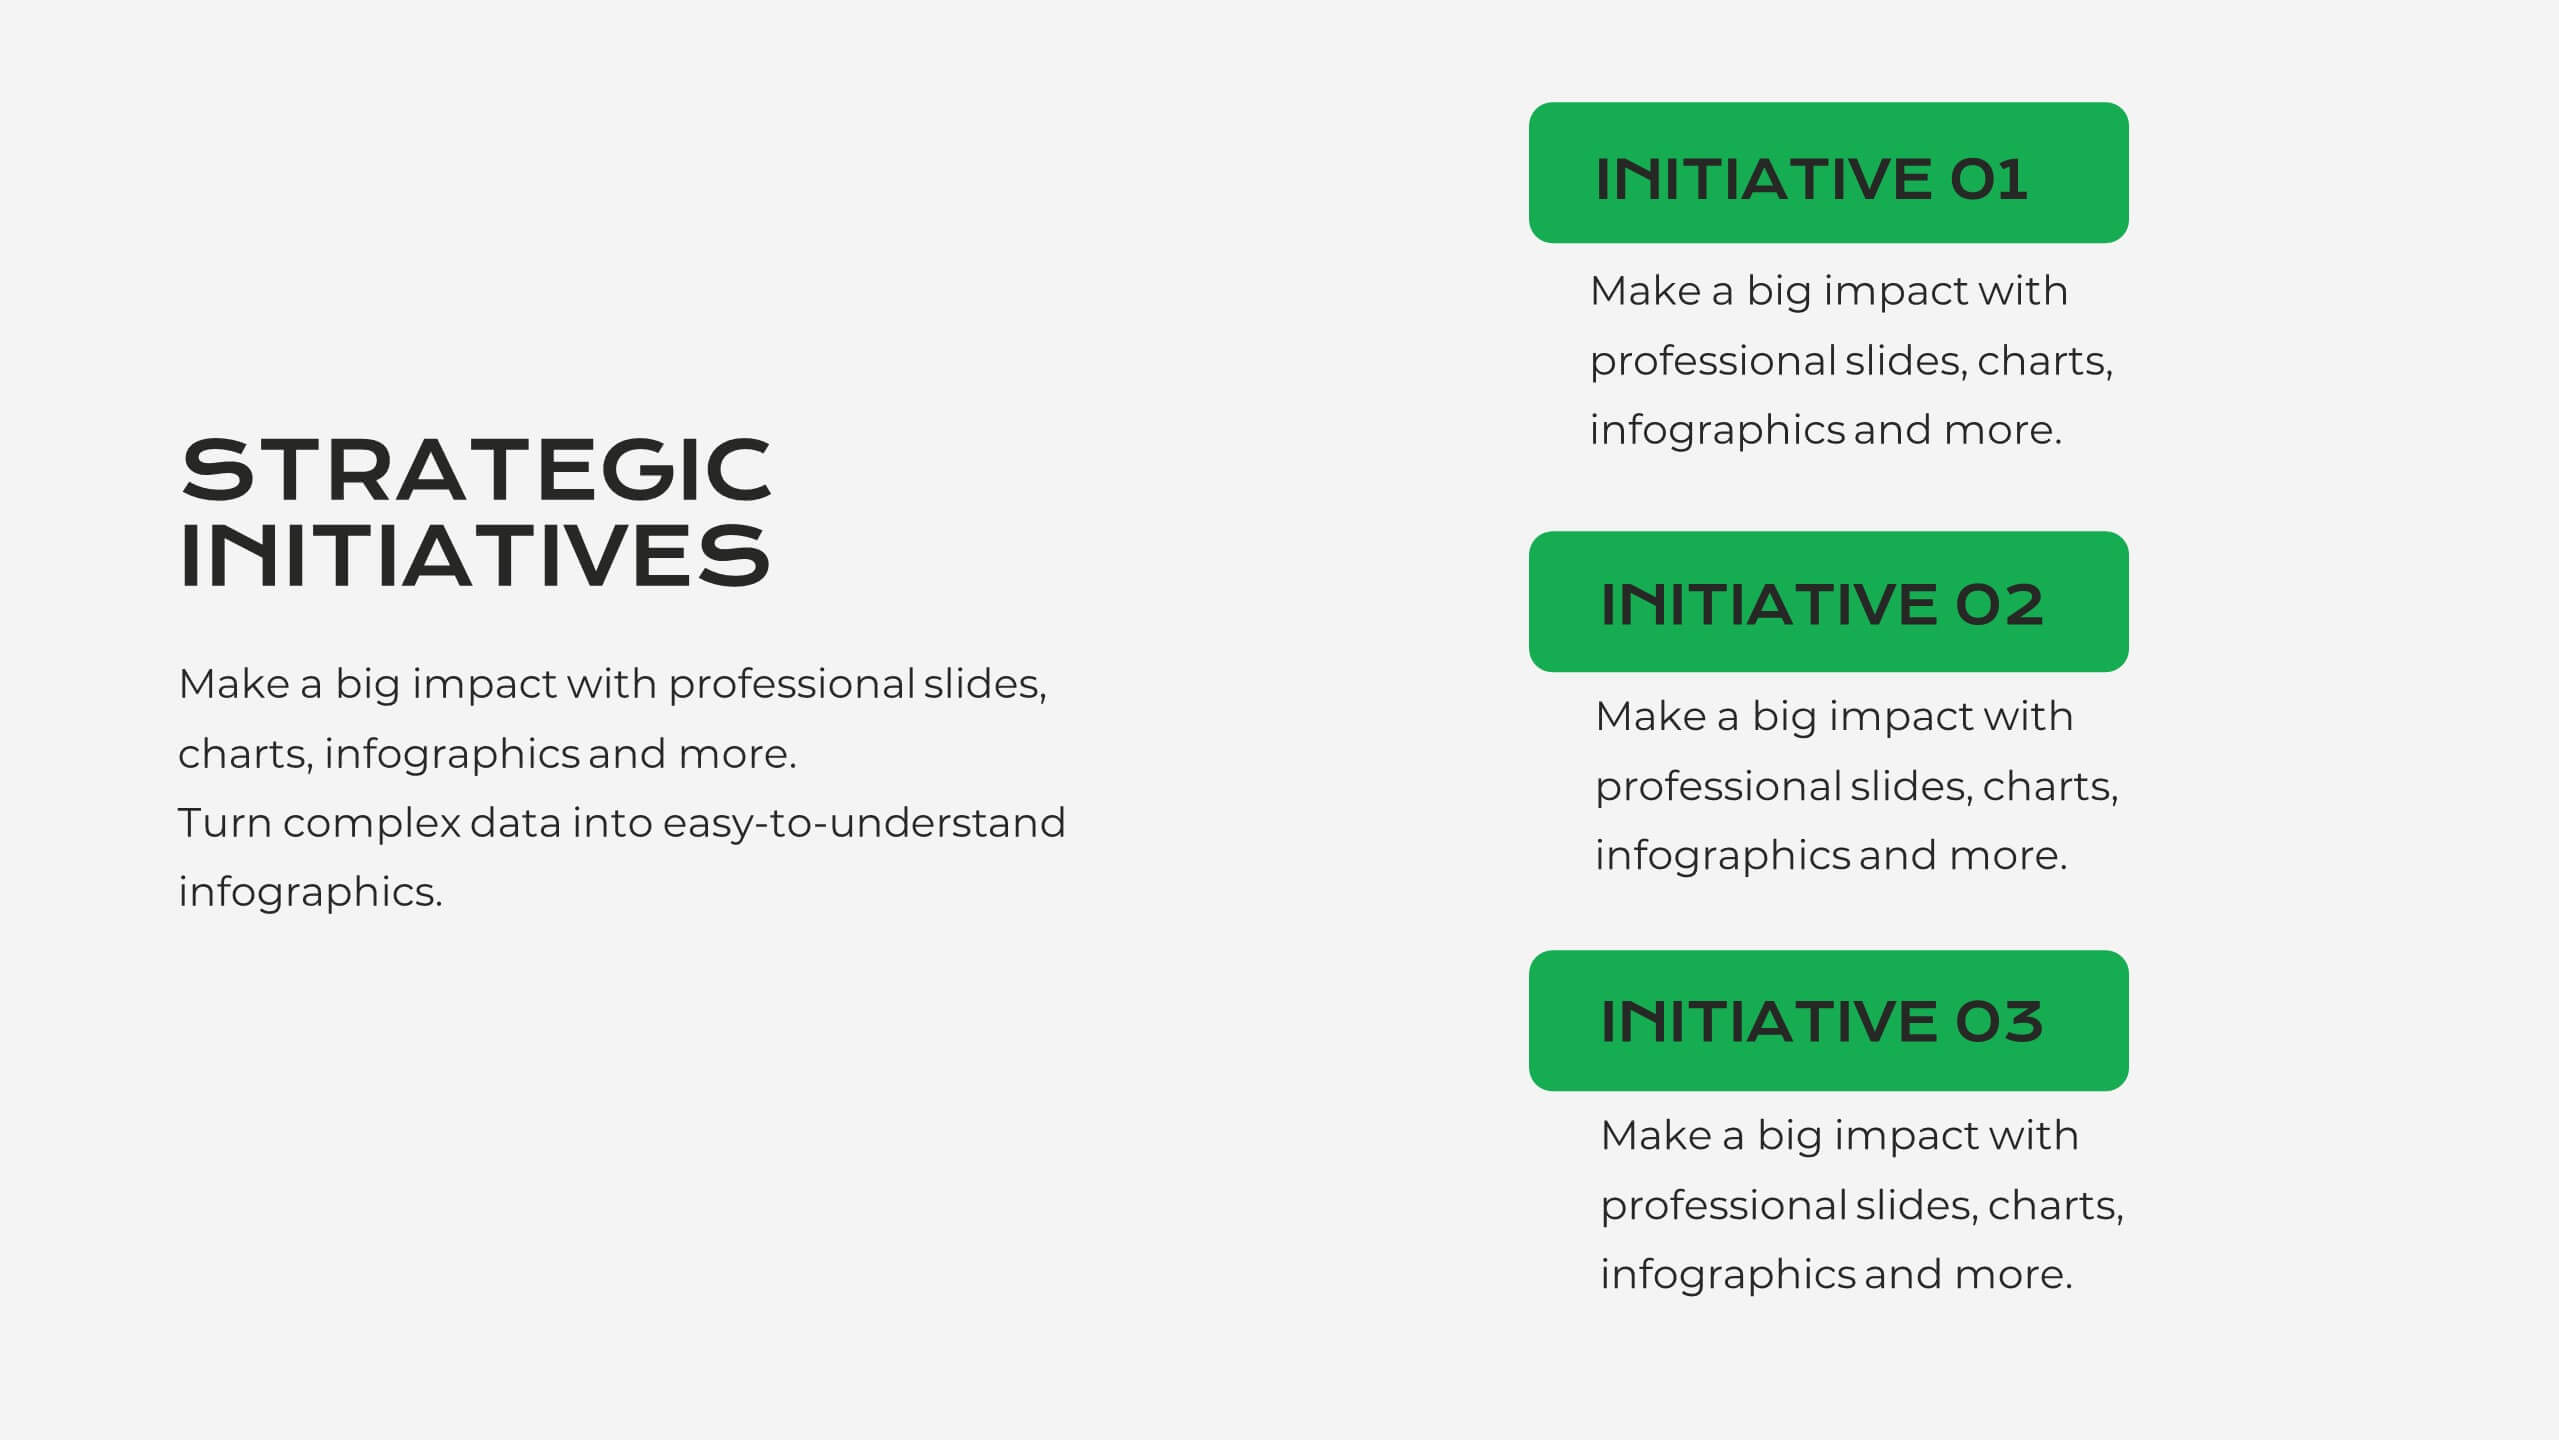
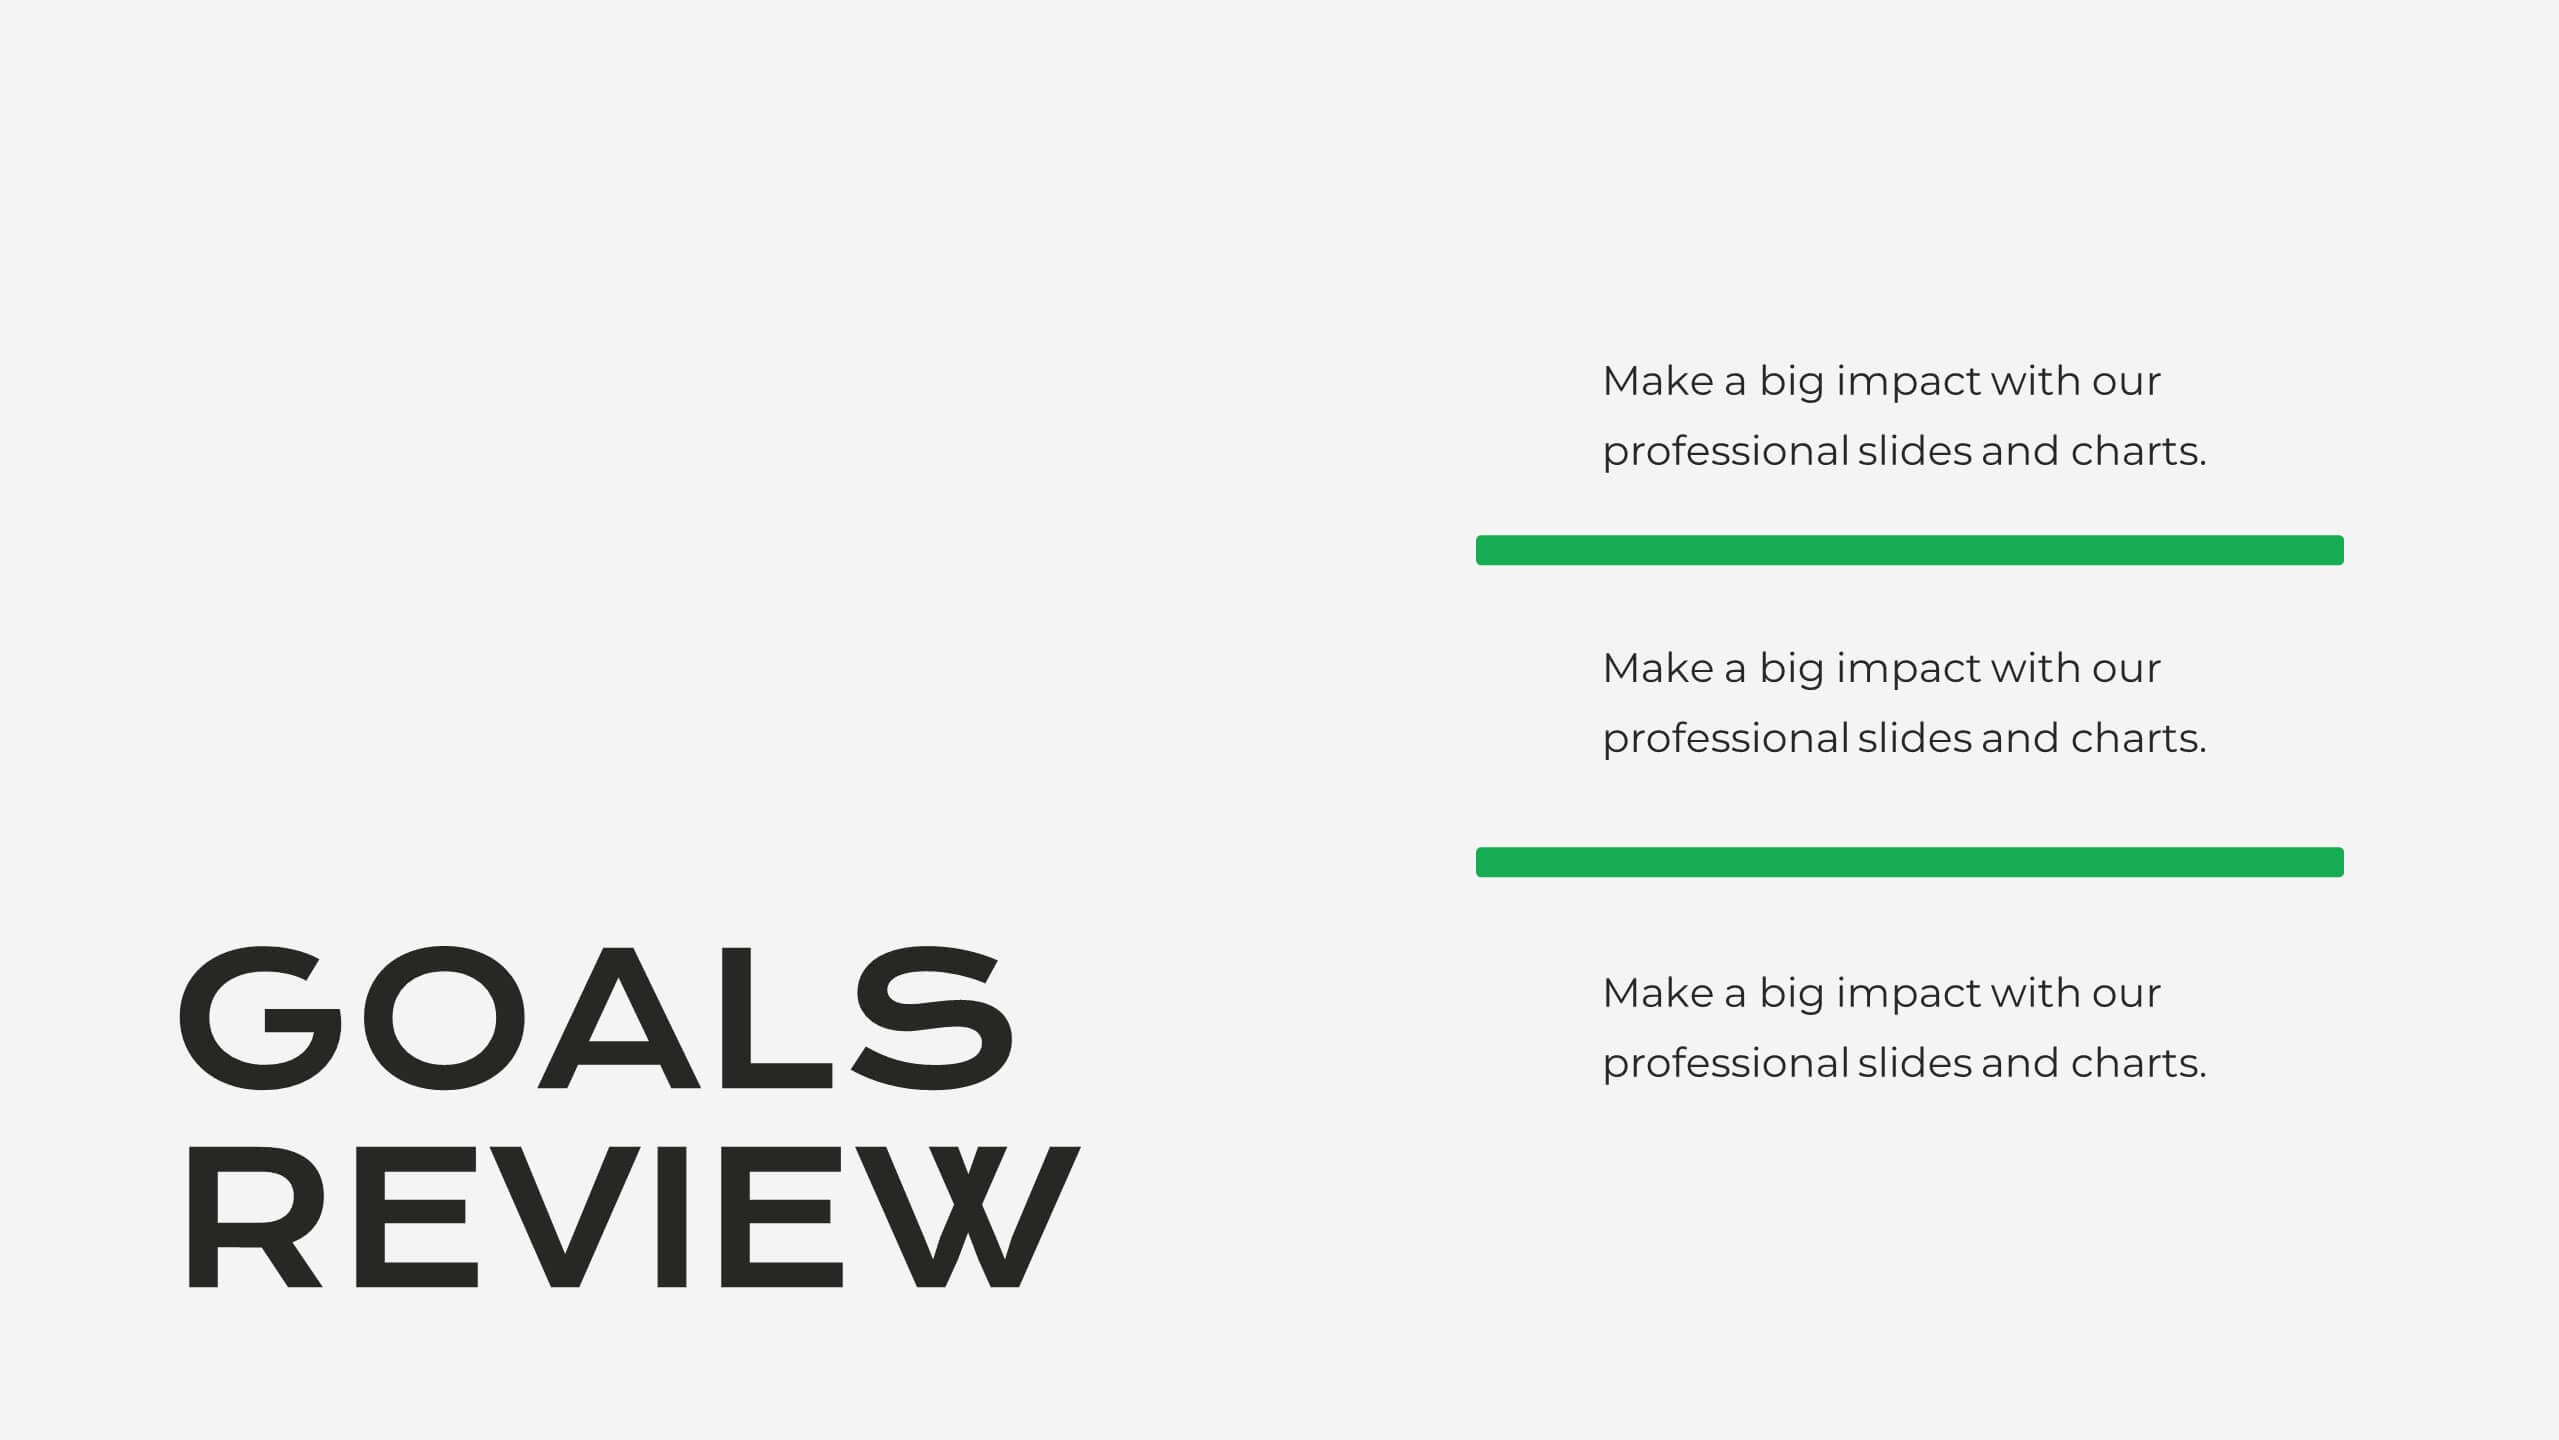
Serene Market Analysis Report Presentation
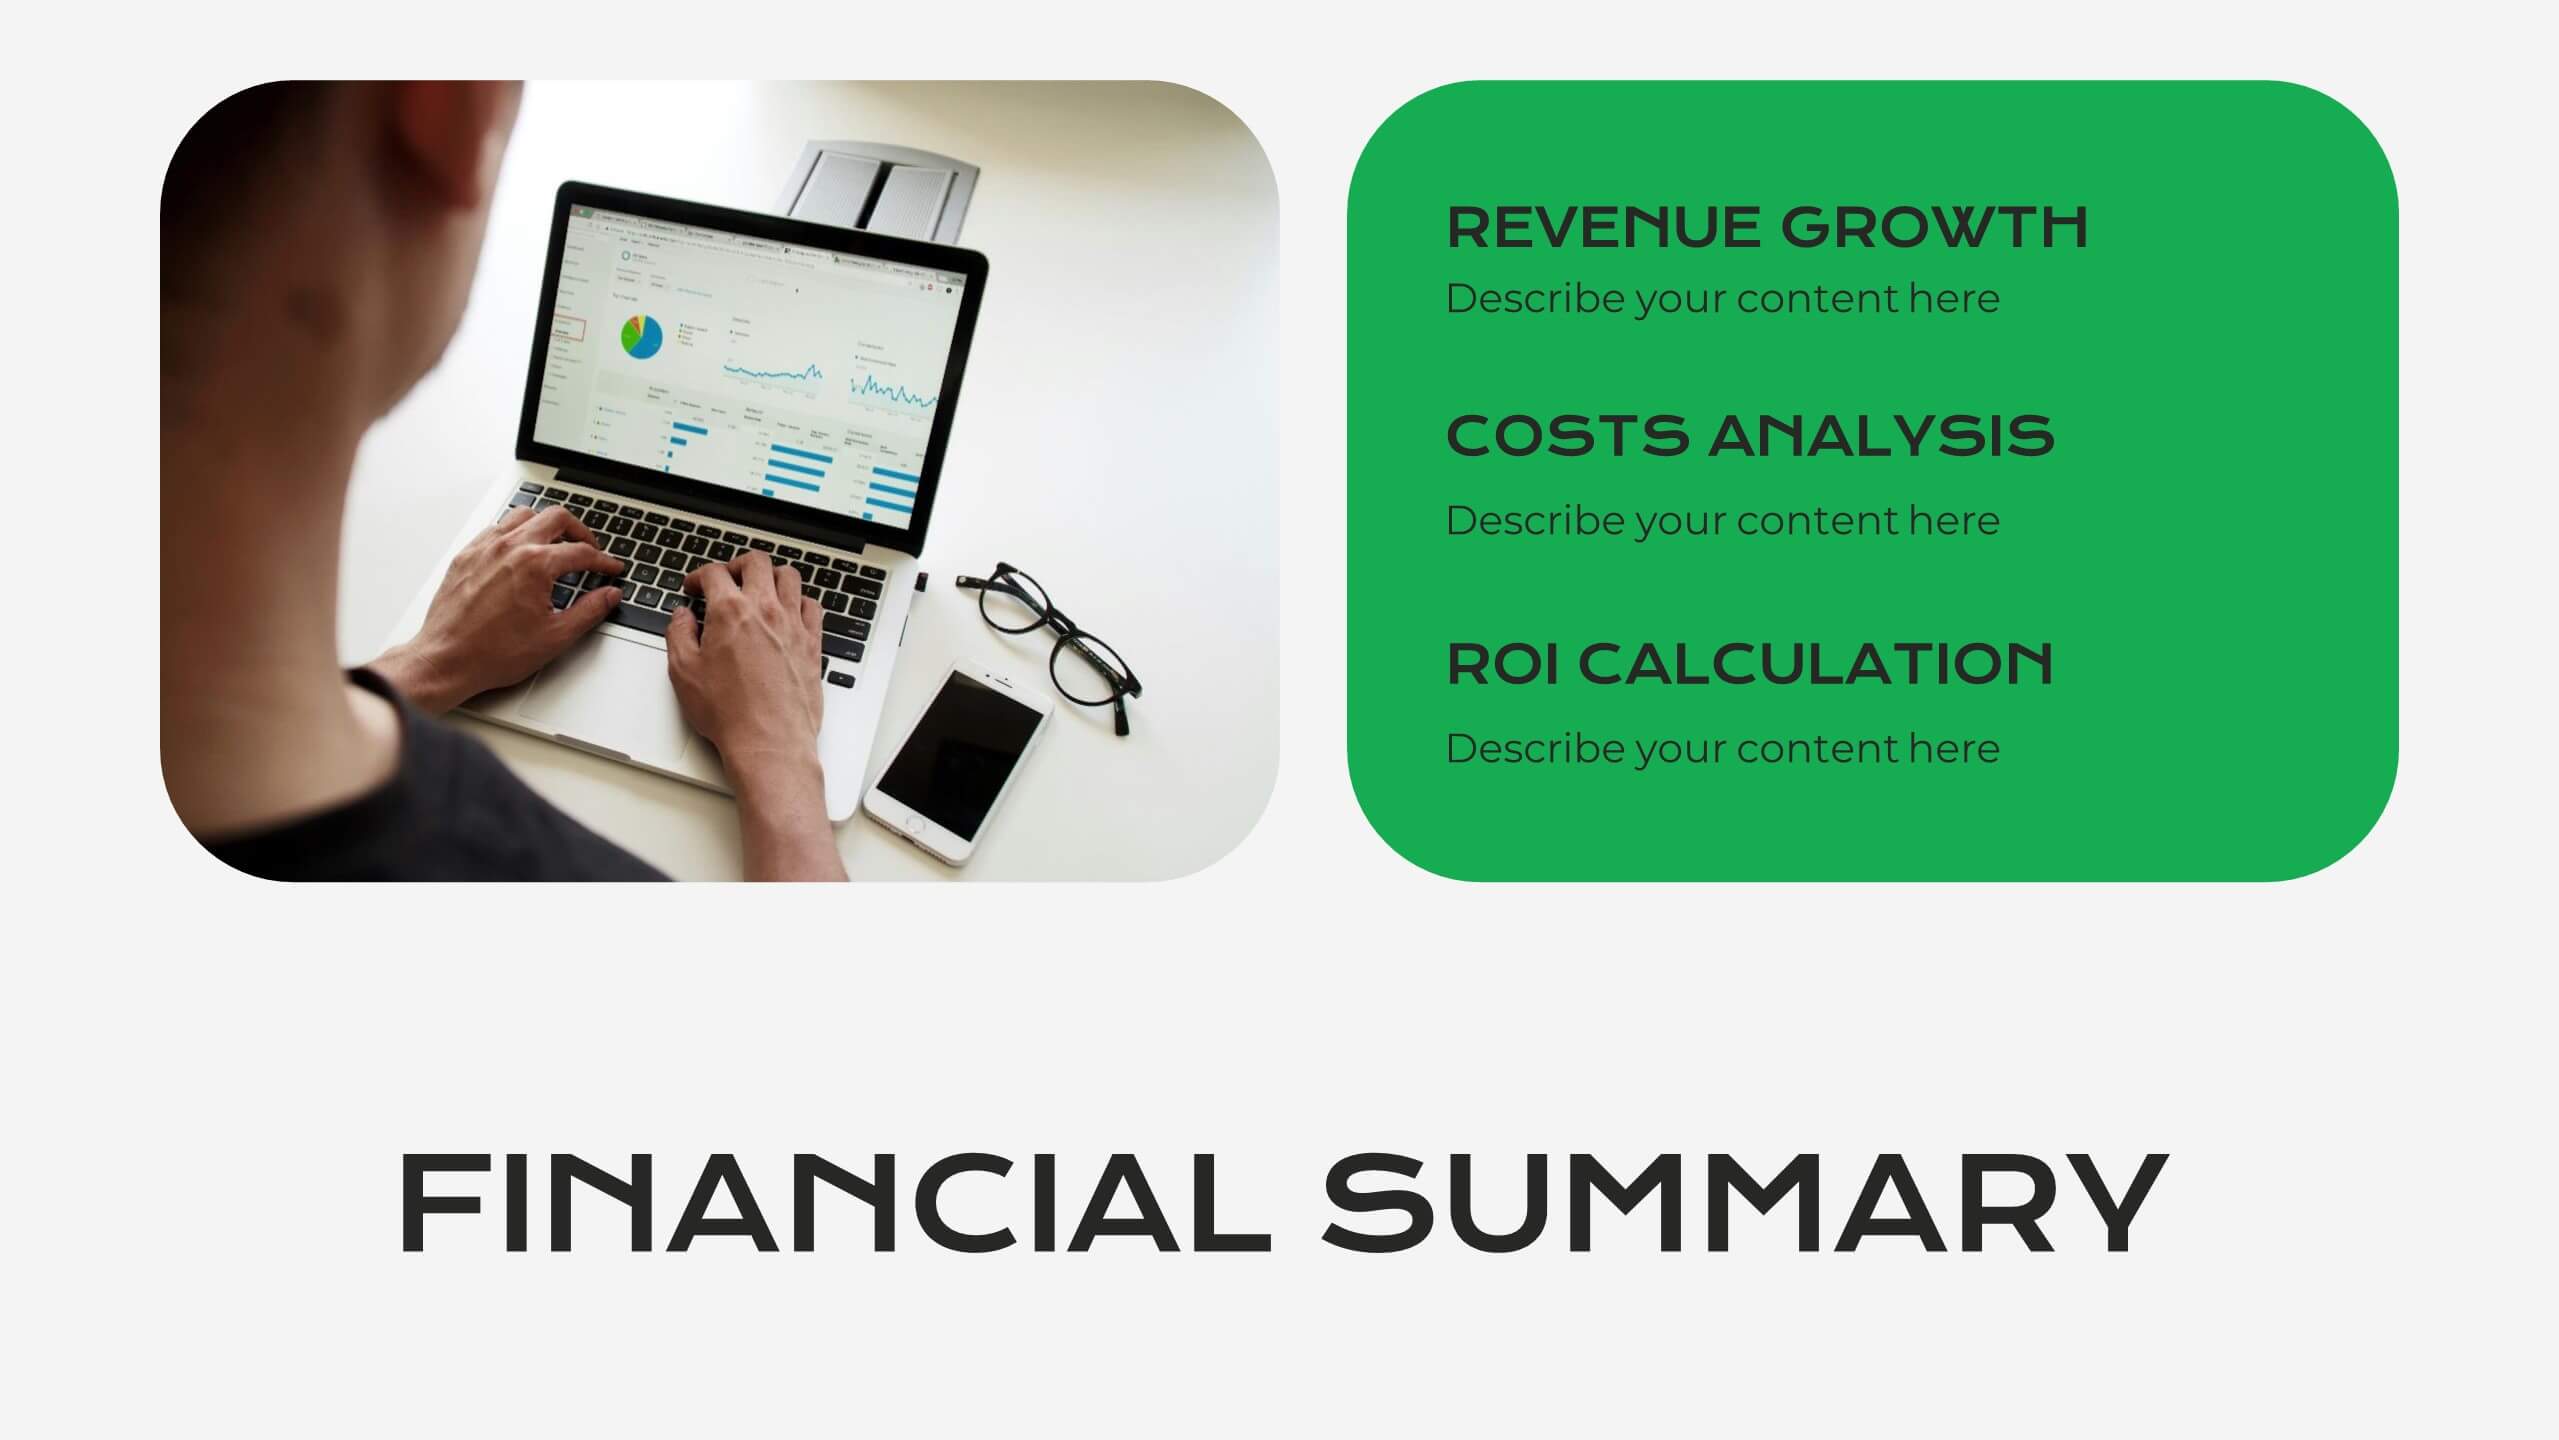
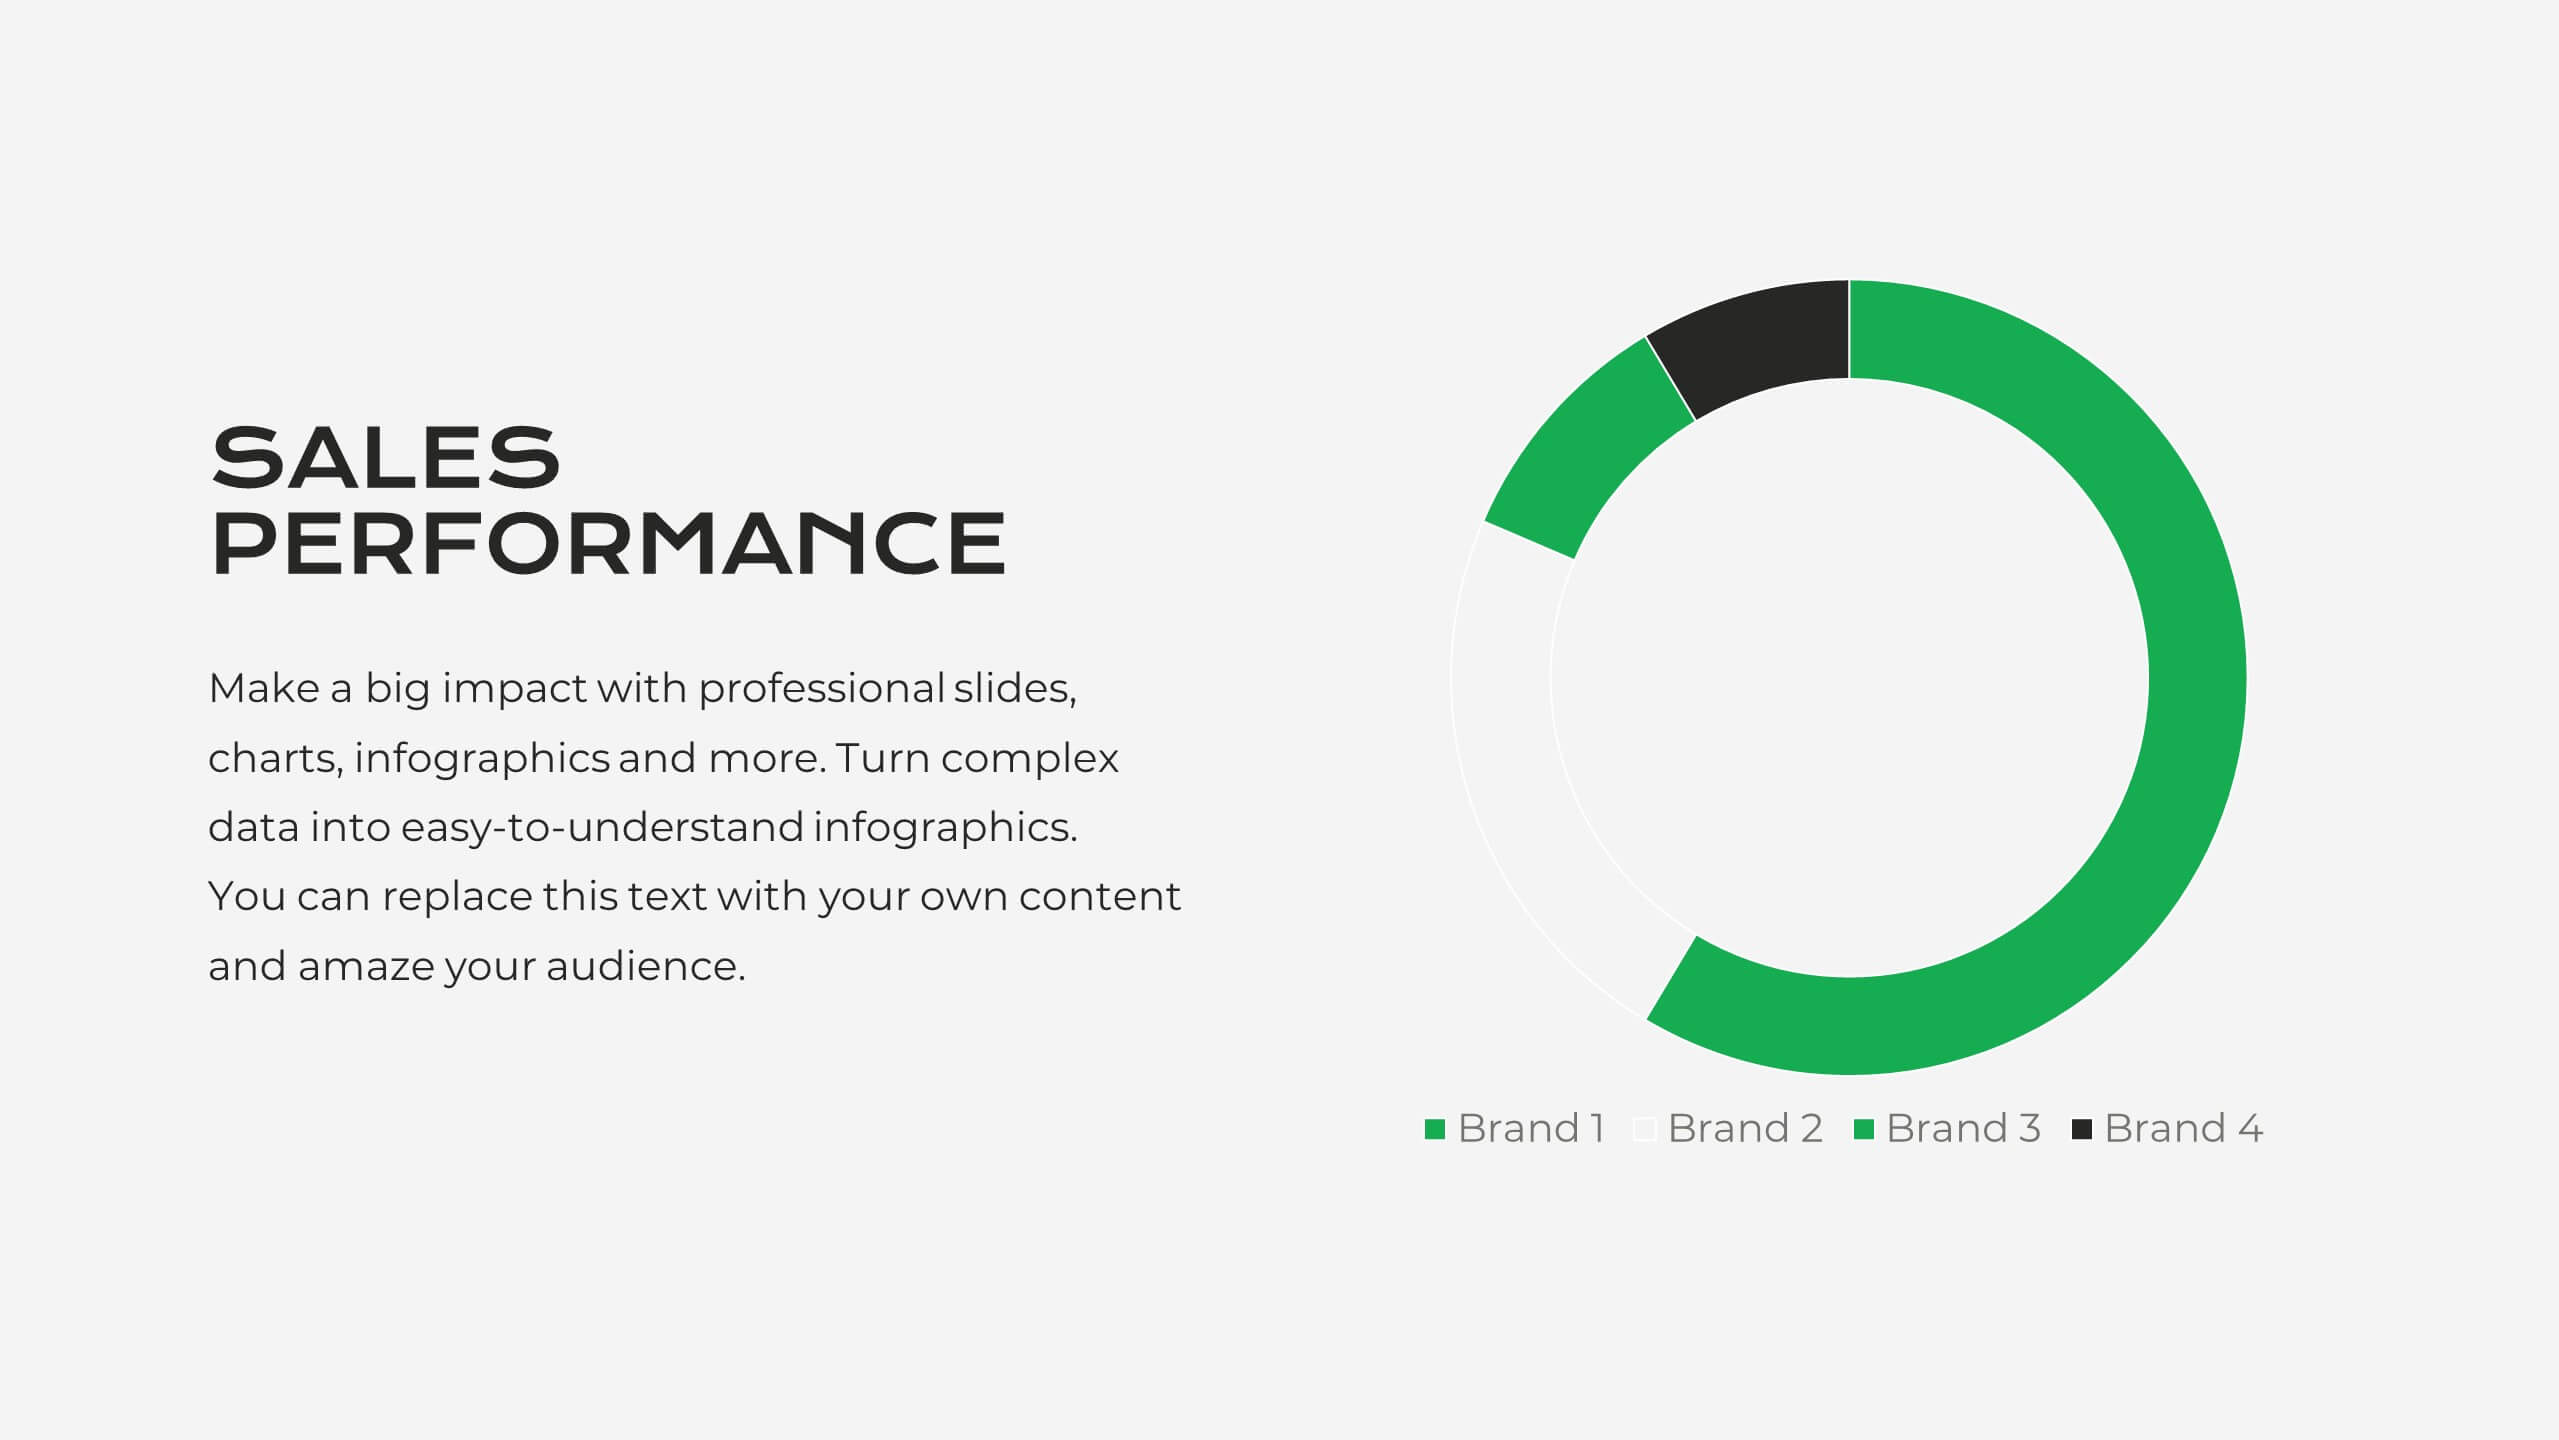
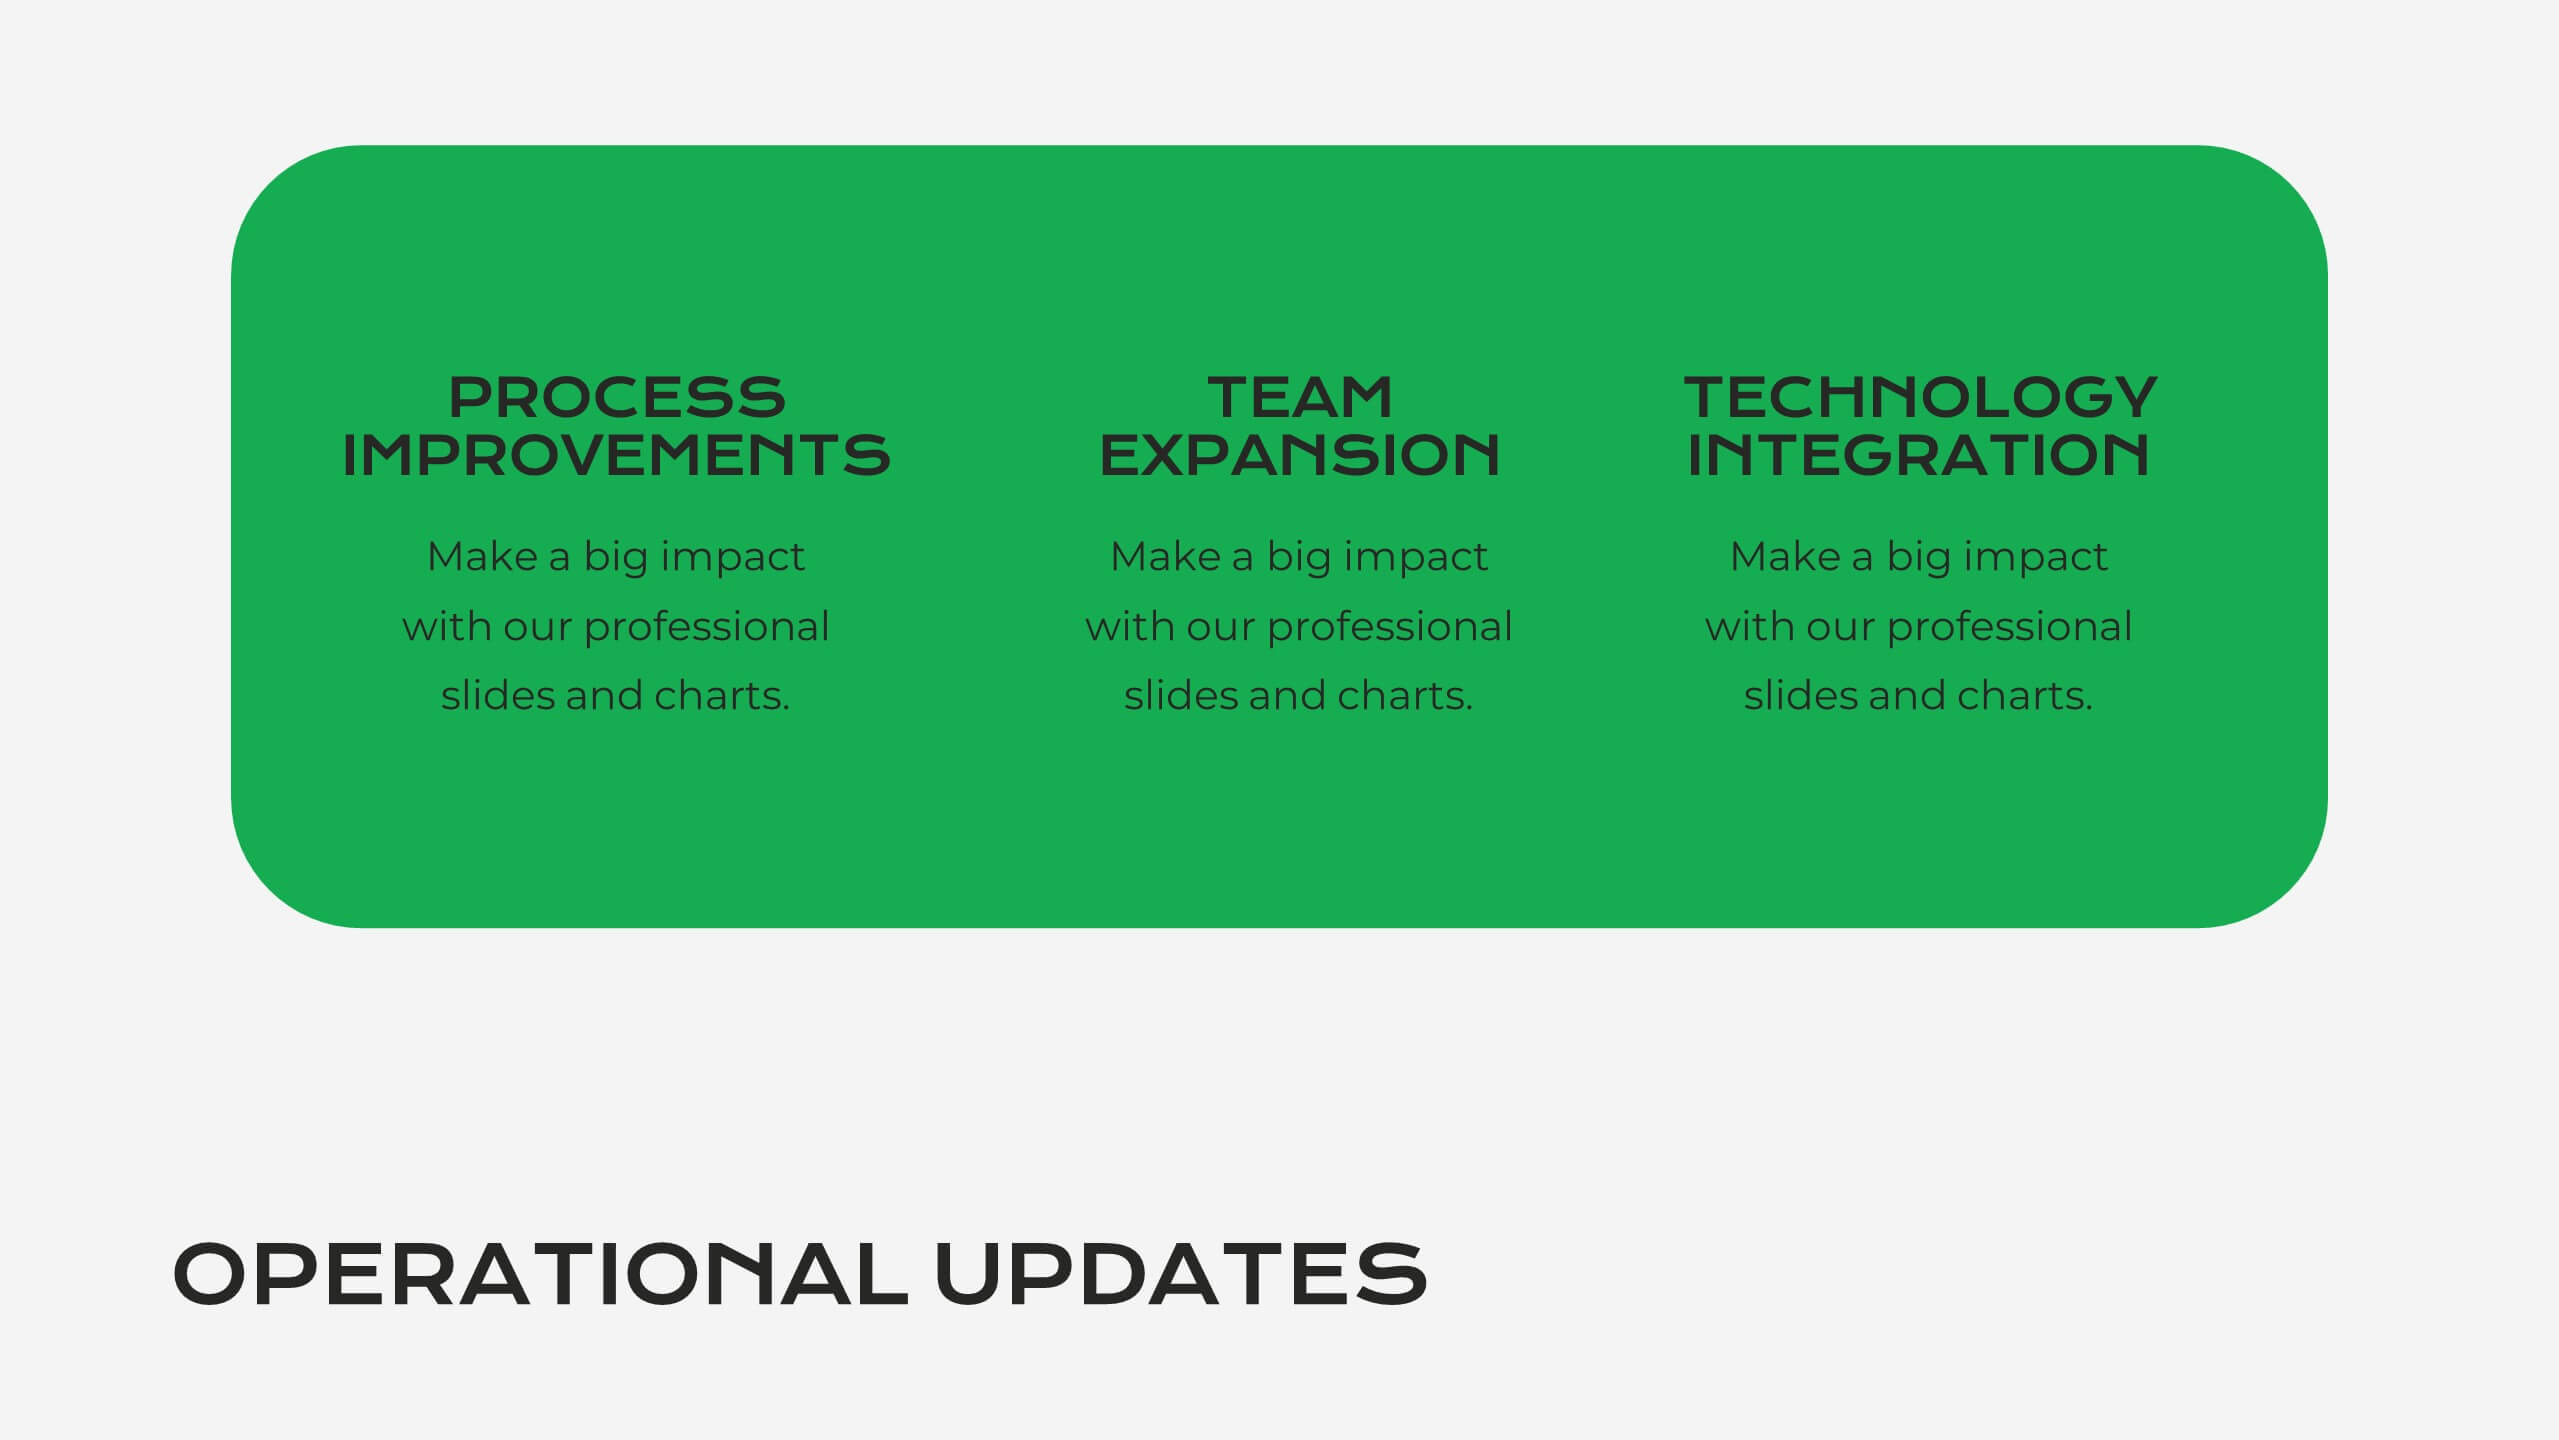
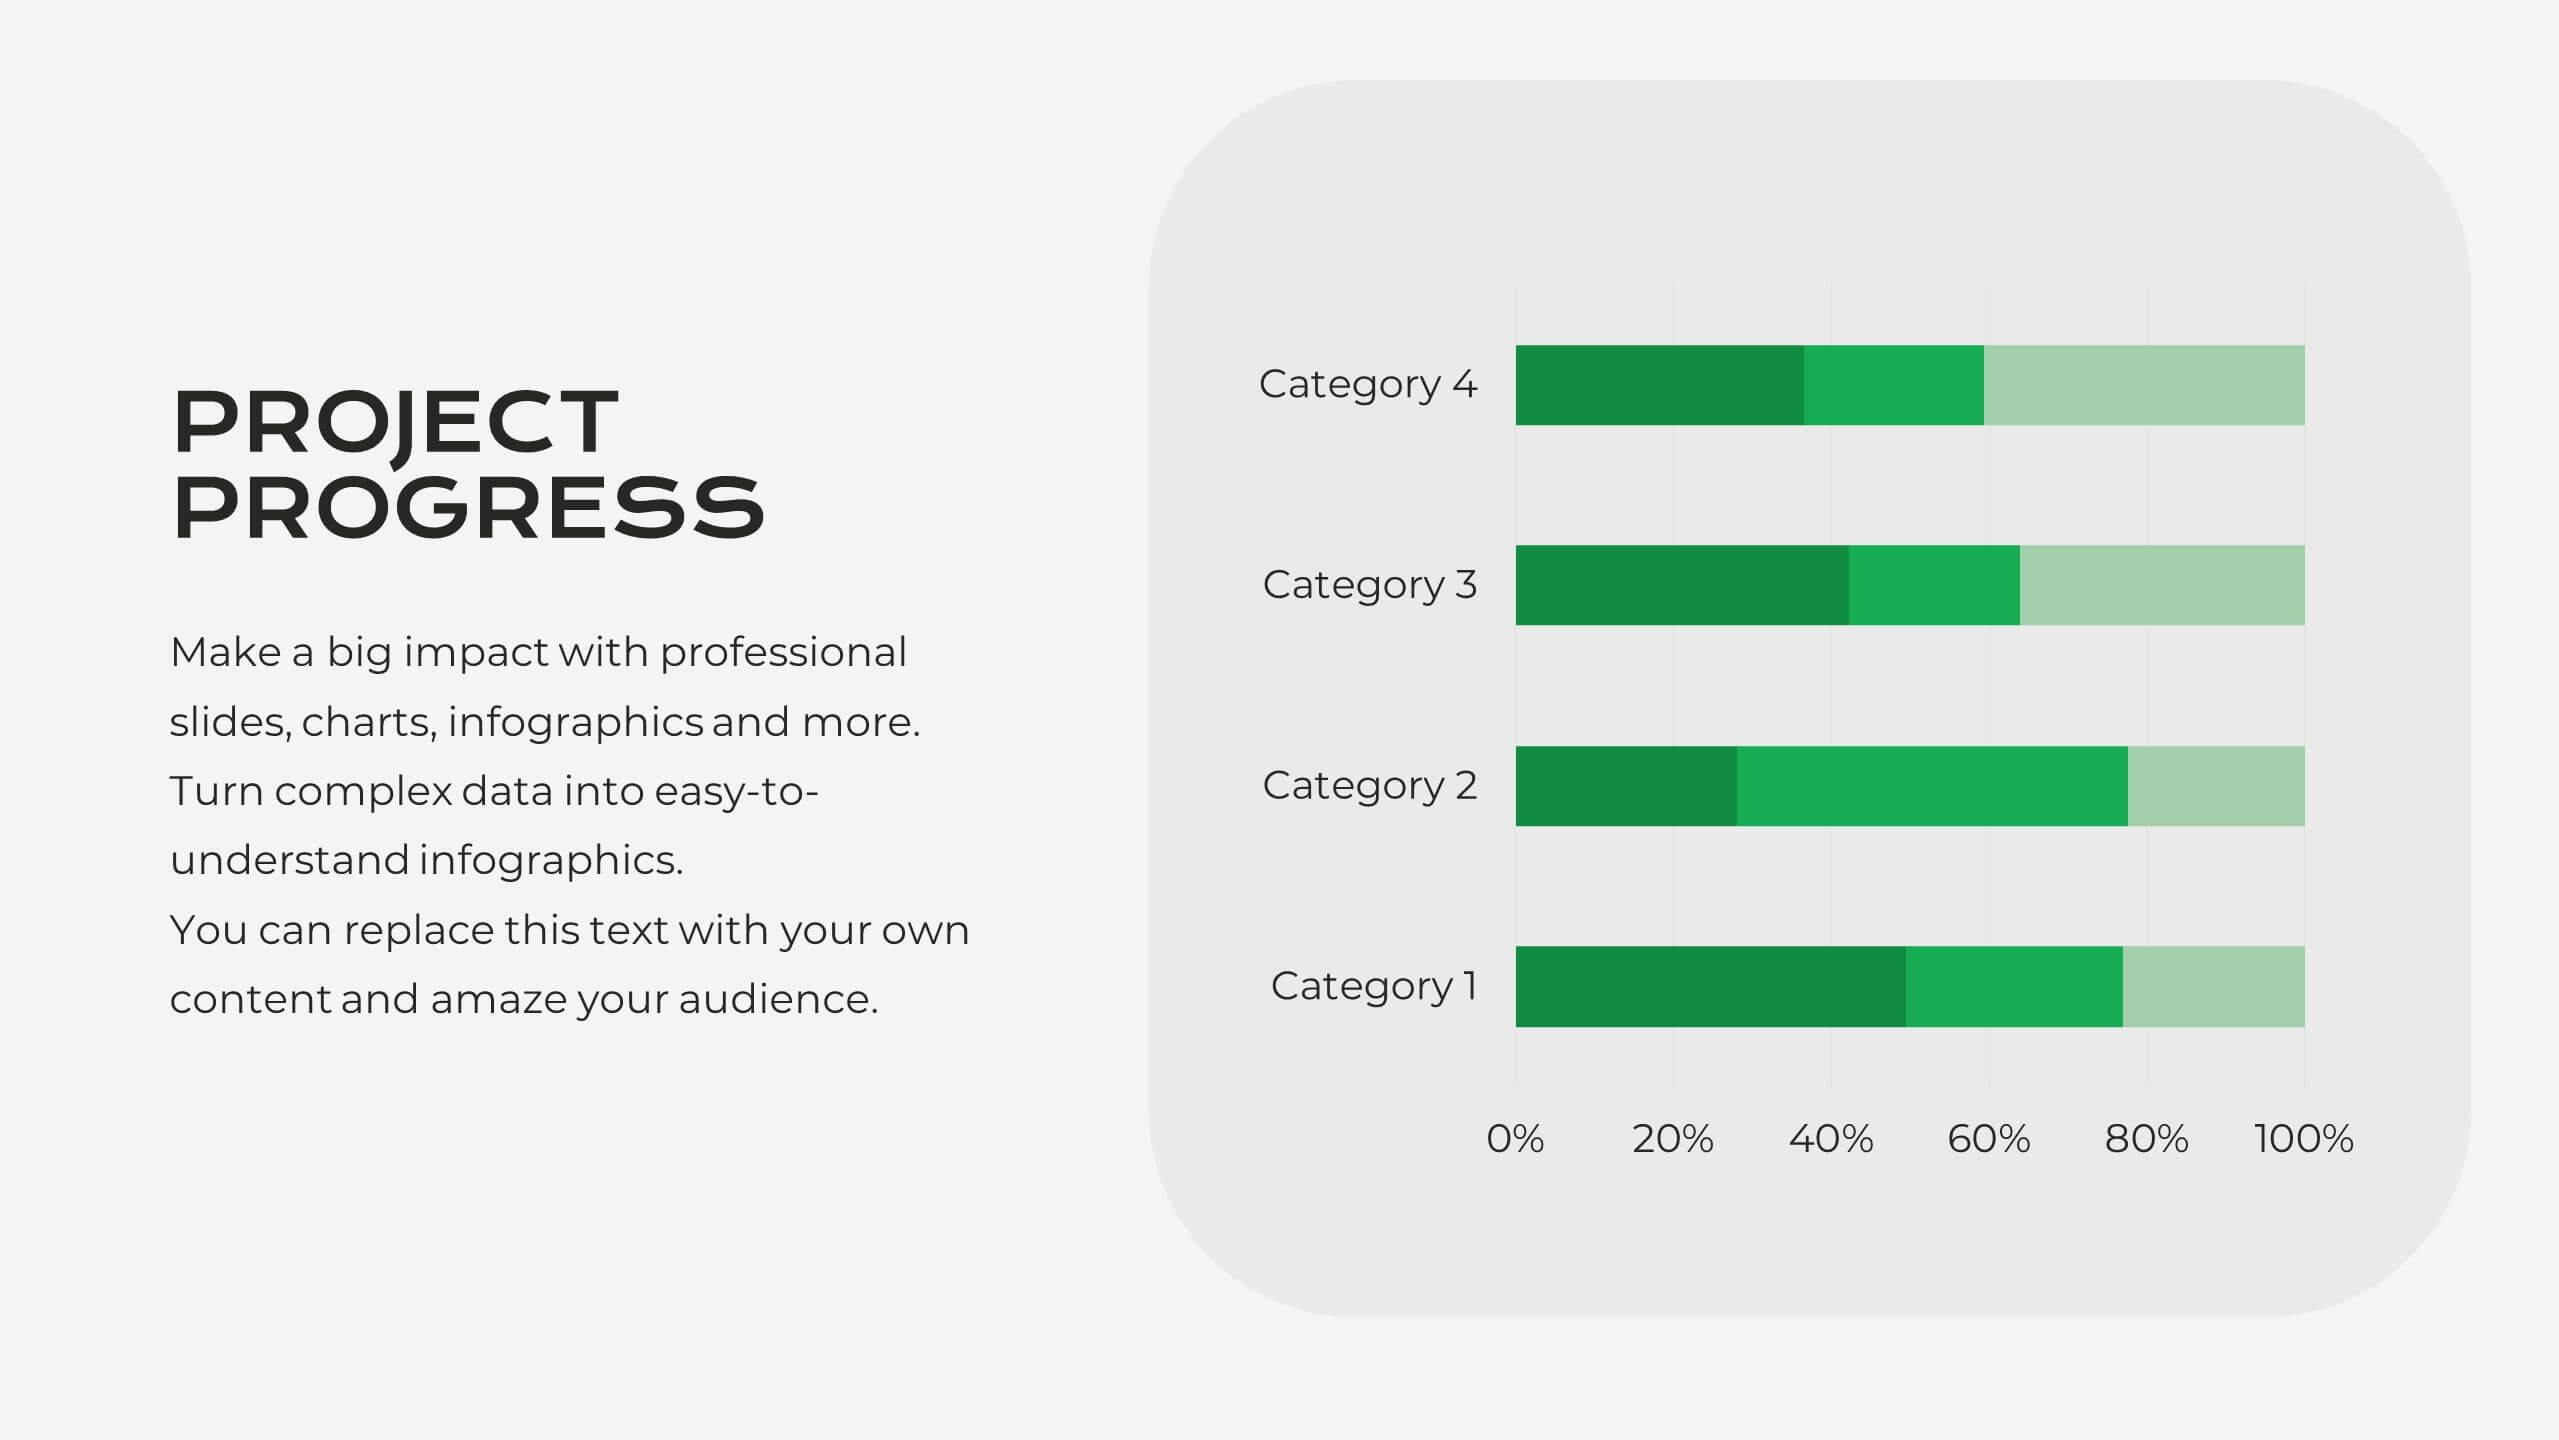
This modern and clean Market Analysis Report template is designed to help you present key data and insights with clarity and impact. Ideal for business professionals and analysts, it includes slides for key highlights, performance metrics, financial summaries, competitor insights, and strategic initiatives. The template's sleek layout ensures that your data is easy to understand and visually appealing, making it perfect for internal reports or client presentations. Customize it effortlessly in PowerPoint, Keynote, or Google Slides, and impress your audience with a polished and professional report.


6 slides
SEO Ads and Social Media Planning Presentation
Boost your online presence with the SEO, Ads, and Social Media Planning Presentation. This layout features engaging iconography and a central post mockup to highlight content strategy, paid advertising, engagement metrics, and platform-specific insights. Ideal for marketing teams and campaign proposals. Fully editable in PowerPoint, Keynote, and Google Slides.


3 slides
Persona Mapping for Target Audience Presentation
Get clear on who you're speaking to with this visual persona mapping slide. Ideal for marketing plans, customer research, or segmentation strategies, this layout helps you define and compare target audience types with clean icons and text space. Fully editable and works with PowerPoint, Keynote, and Google Slides.


10 slides
Abstract Geometric Pattern Presentation
Energize your message with a bold, modern pattern that instantly grabs attention and gives your content a polished creative edge. This presentation transforms abstract shapes into a clean visual structure that supports clear talking points and smooth storytelling. Fully editable and compatible with PowerPoint, Keynote, and Google Slides.


4 slides
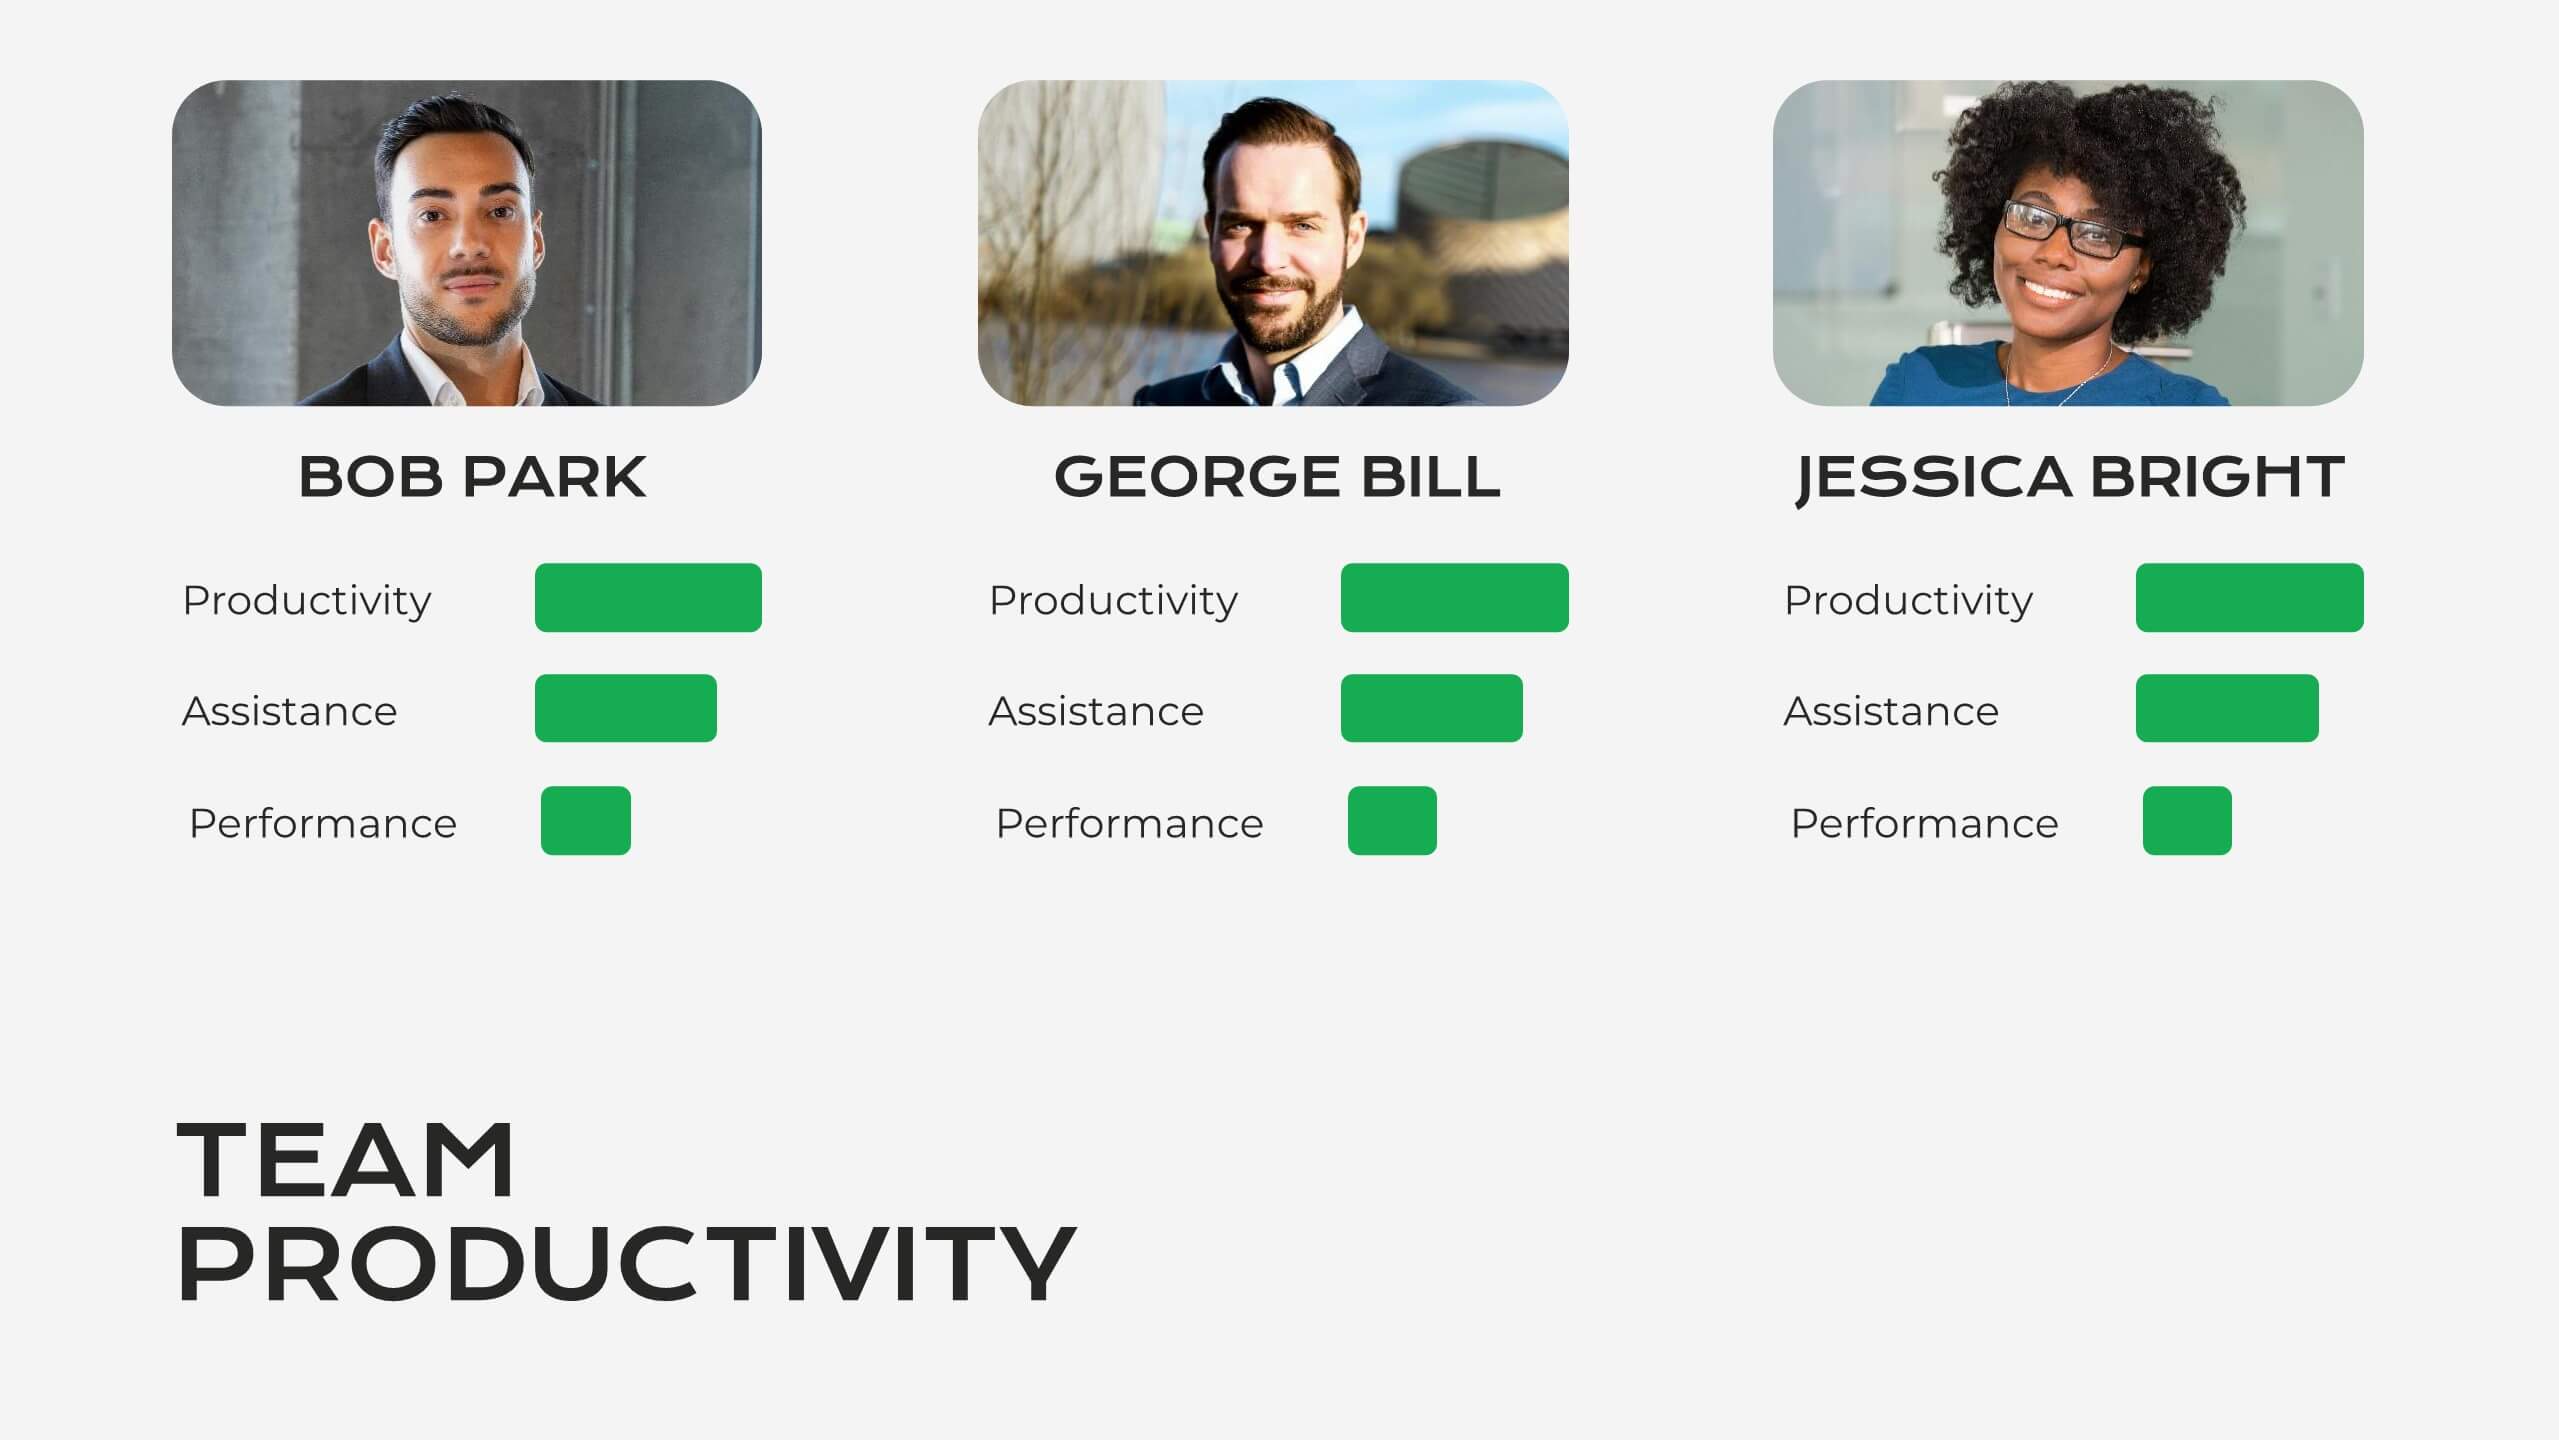
Core Company Value Mapping Presentation
Spotlight your business strengths with the Core Company Value Mapping Presentation. This slide design helps you break down and compare key value drivers using a structured visual format—ideal for internal strategy discussions, executive briefings, or stakeholder updates. Highlight metrics, priorities, or departments with side-by-side percentage comparisons and icon indicators. Fully editable in PowerPoint, Keynote, and Google Slides. A must-have for operations teams, consultants, and leadership presentations.


21 slides
Illume Detailed Project Execution Plan Presentation
Get ready to wow your audience with this dynamic Project Execution Plan template! Bursting with sleek design, it transforms your project timelines, deliverables, and stakeholder analysis into a stunning visual journey. Keep everyone engaged while you showcase your strategy with flair and finesse. Perfect for PowerPoint, Keynote, and Google Slides!


6 slides
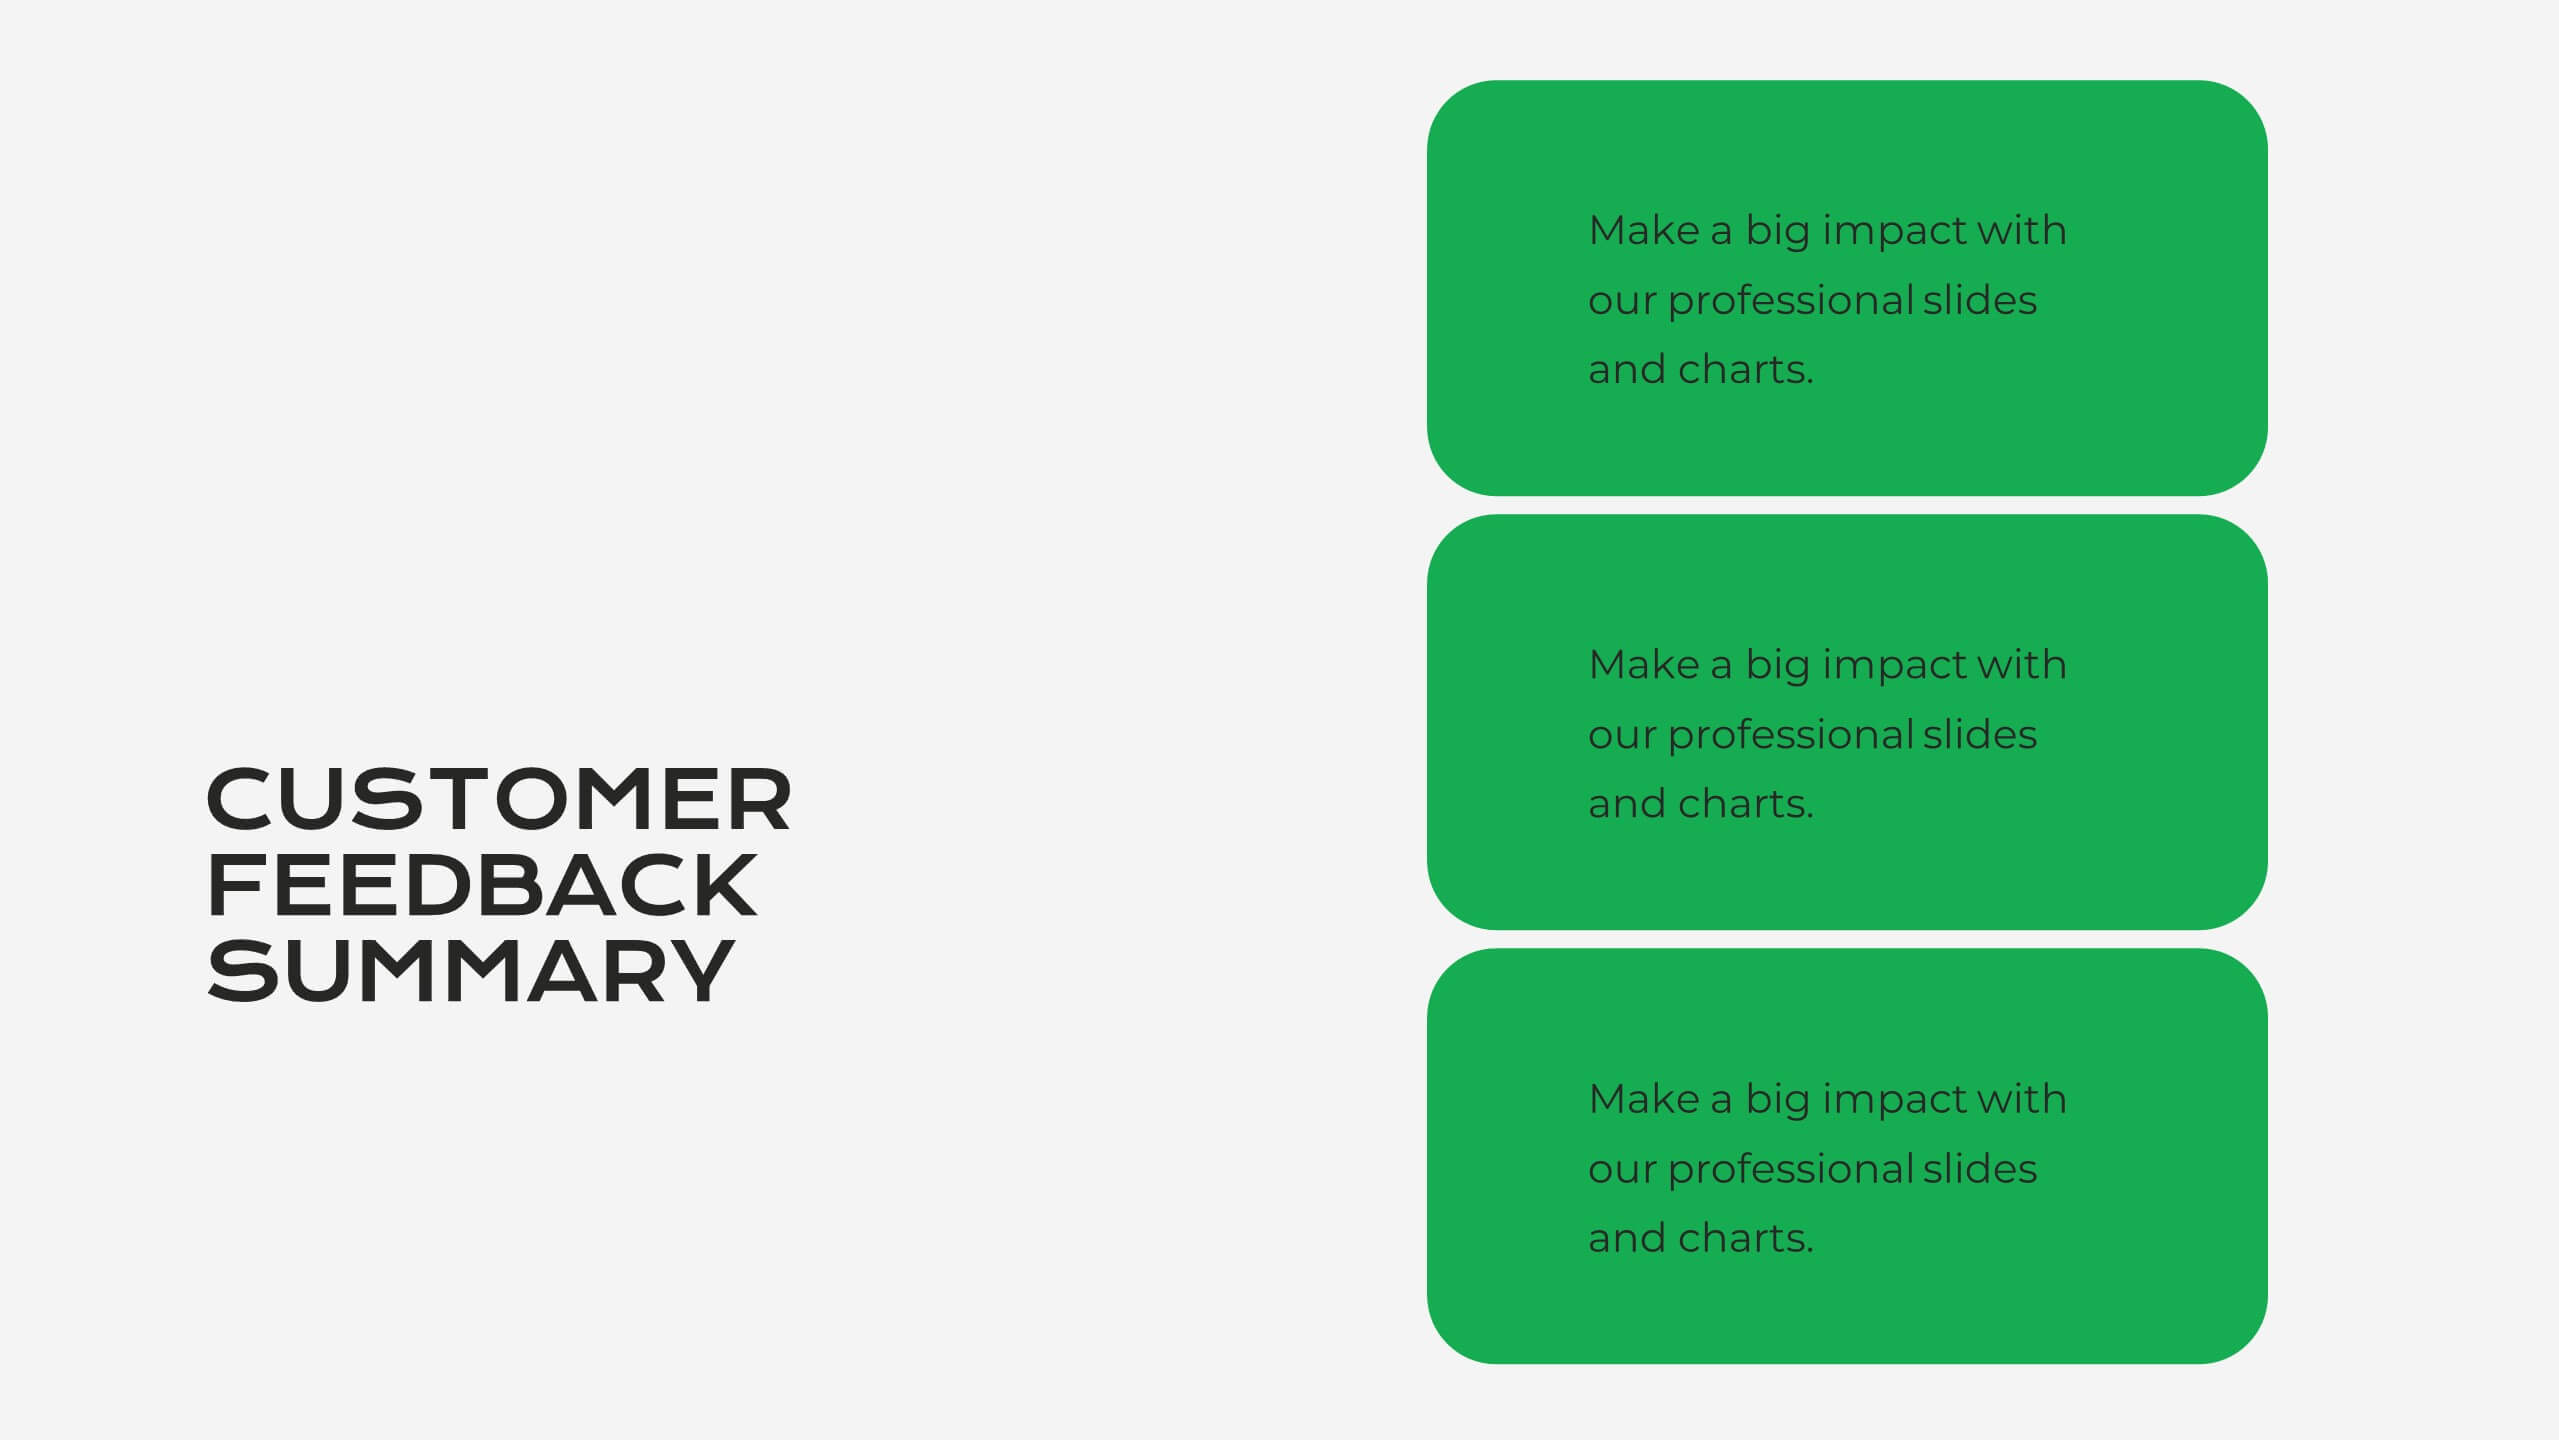
Checklist and To-Do List Presentation
Bring order and elegance to your presentation with this sleek, easy-to-edit layout perfect for summarizing ideas, listing features, or outlining processes. Its balanced design ensures clarity and flow while keeping your slides visually engaging. Fully compatible with PowerPoint, Keynote, and Google Slides for effortless customization and professional results.


6 slides
Organizational Change Management Presentation
Visualize transformation with clarity using this structured slide, perfect for outlining your change roadmap, initiatives, or strategic phases. The layout features six labeled steps with icons and editable text for seamless communication of your process—from awareness to adoption. Ideal for HR leaders, consultants, and operations managers. Fully editable in PowerPoint, Keynote, and Google Slides.


4 slides
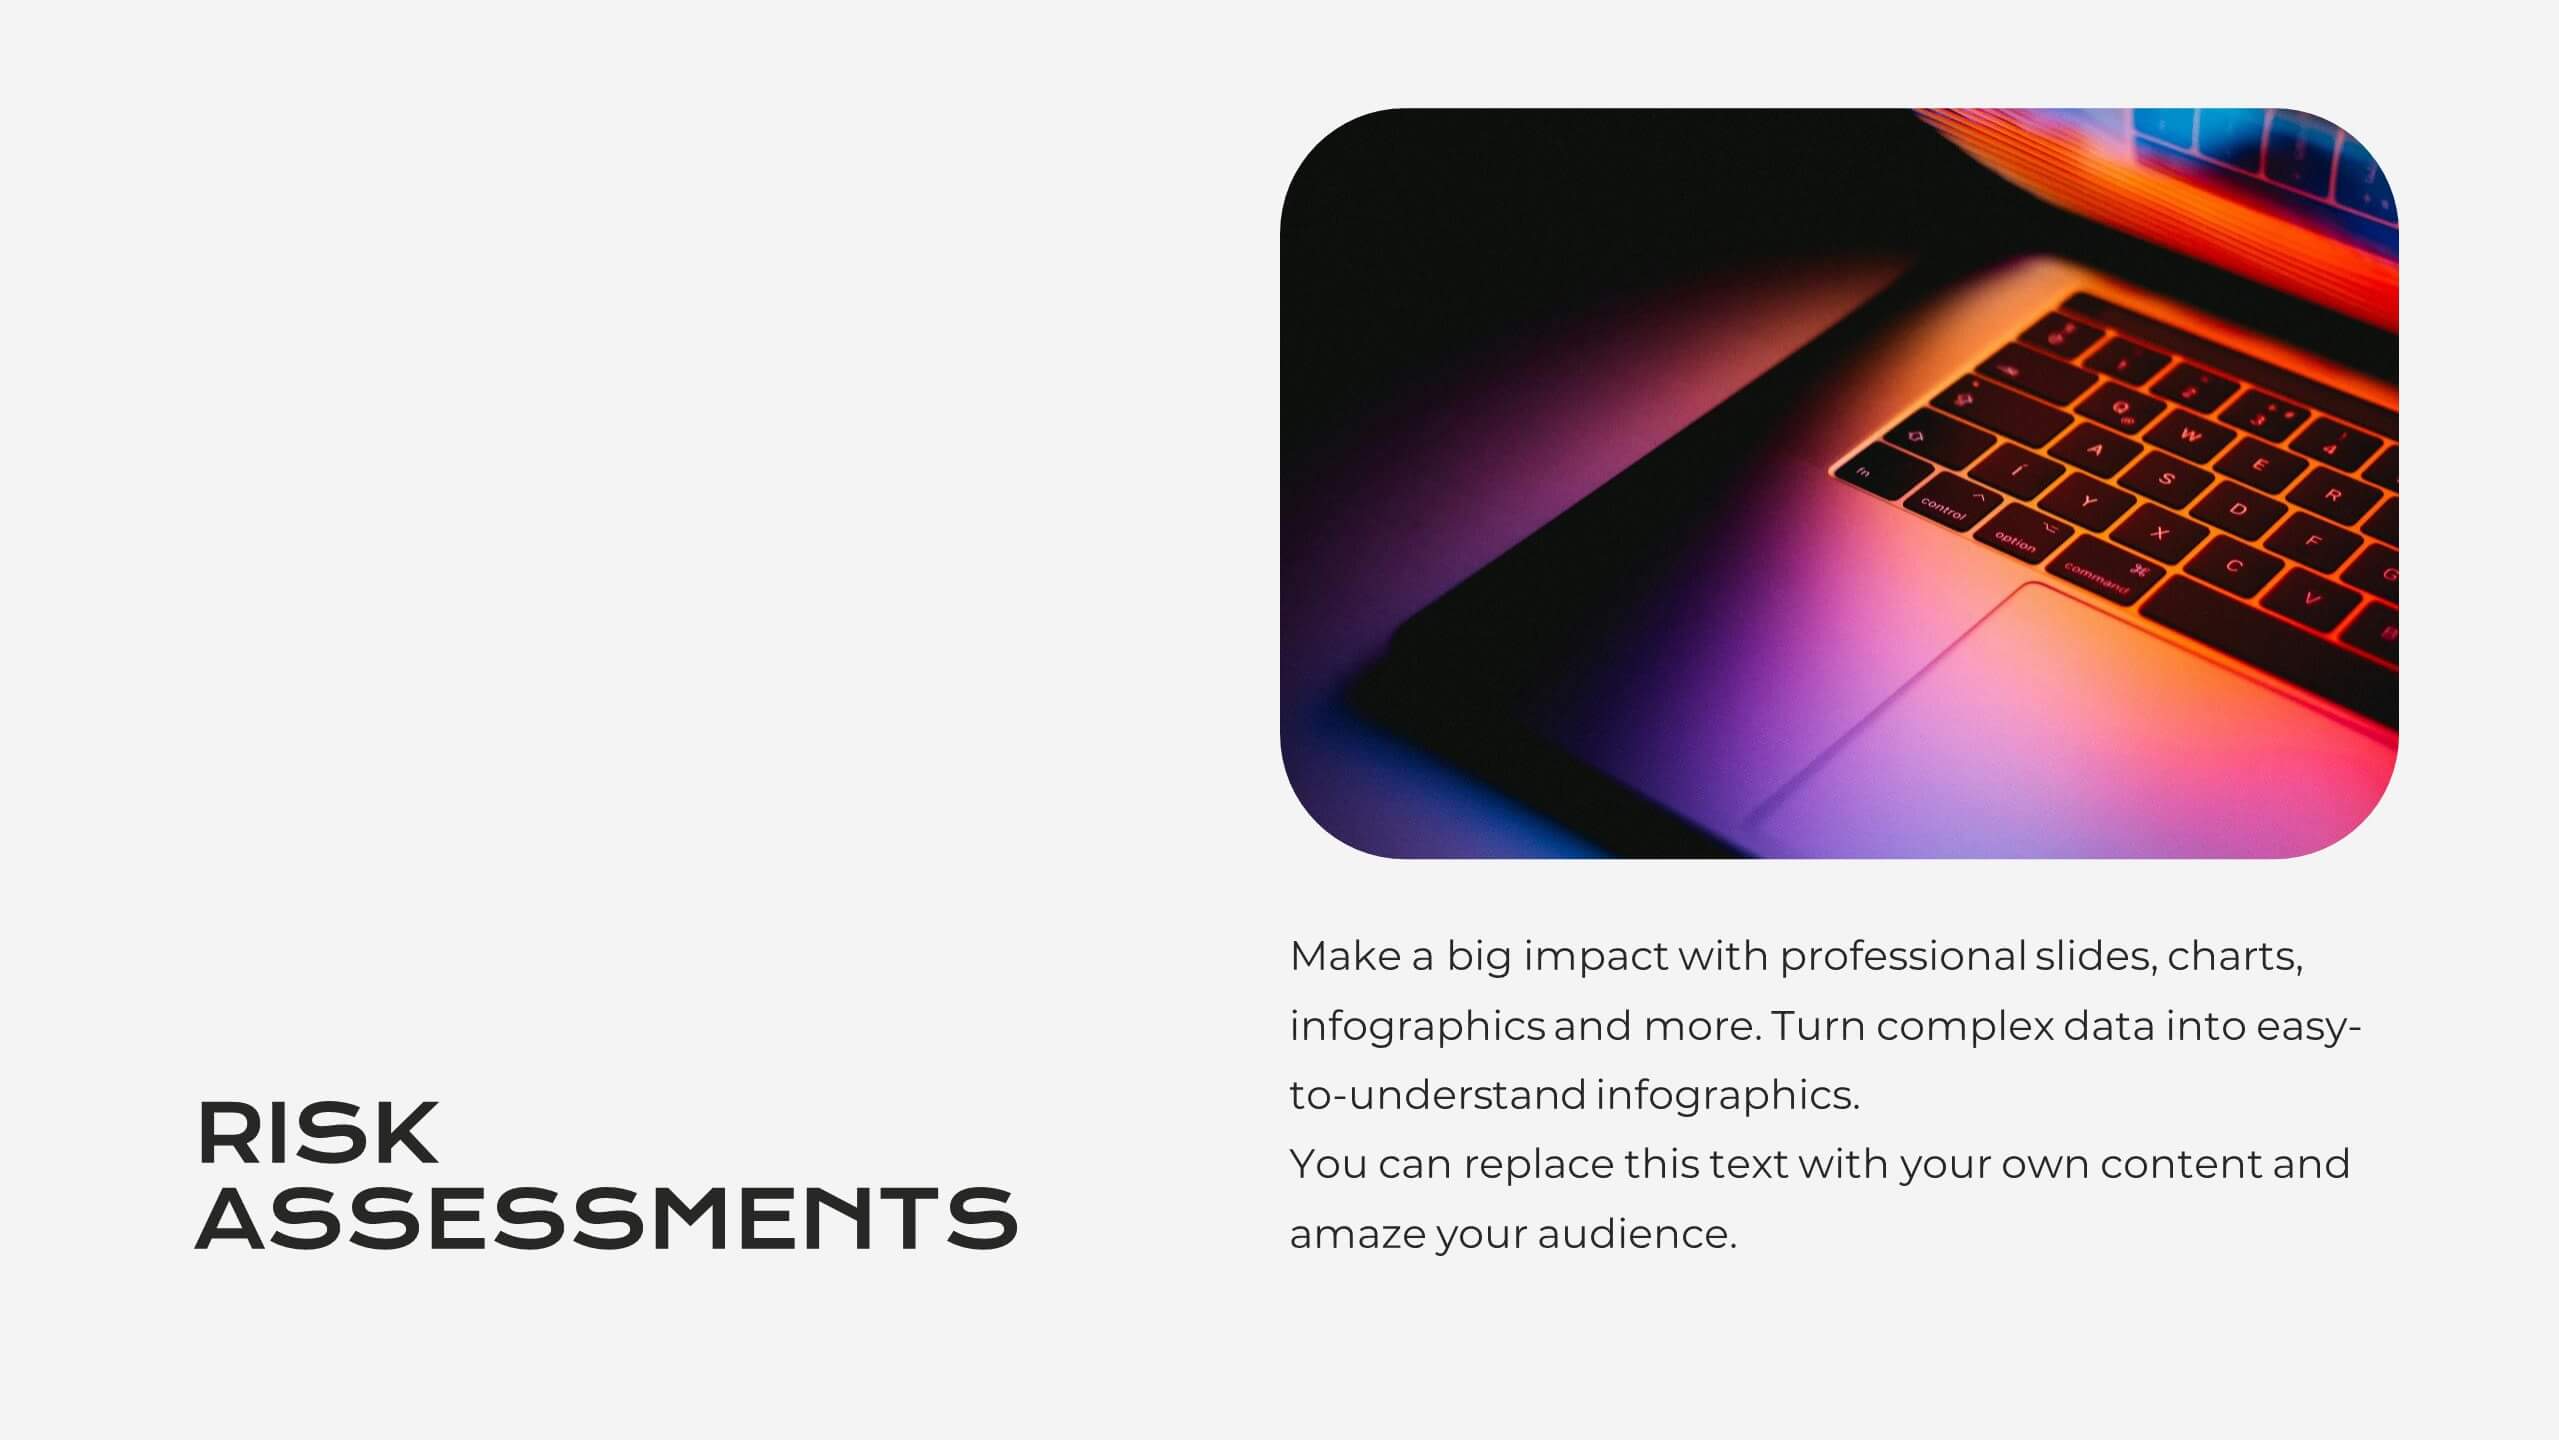
Risk Assessments Matrix Presentation
Bring clarity to complex decisions with this bold, color-coded layout designed to pinpoint threats, compare impact levels, and communicate risks with confidence. This presentation makes evaluation simple, structured, and visually clear for any audience. Fully editable and ready for professional use. Compatible with PowerPoint, Keynote, and Google Slides.


3 slides
Company Vision Roadmap Presentation
Bring your future story to life with a clear, inspiring layout that guides viewers through your long-term direction and strategic milestones. This presentation helps teams communicate purpose, goals, and planned progress in a simple, structured format that’s easy to follow. Compatible with PowerPoint, Keynote, and Google Slides.


10 slides
HR Management Presentation
The HR Management Presentation template is expertly designed to communicate crucial aspects of human resource management. It features a visually engaging layout that systematically breaks down important HR elements such as recruitment, training, employee engagement, and performance metrics. Each section is clearly labeled and accompanied by intuitive icons that aid in quick comprehension, making it an ideal choice for HR professionals aiming to present complex data in an accessible format. This template enhances audience engagement through its structured presentation of information, focusing on strategic management within HR. It is perfectly suited for showcasing HR strategies, policy updates, or organizational improvements in a clear and effective manner.


6 slides
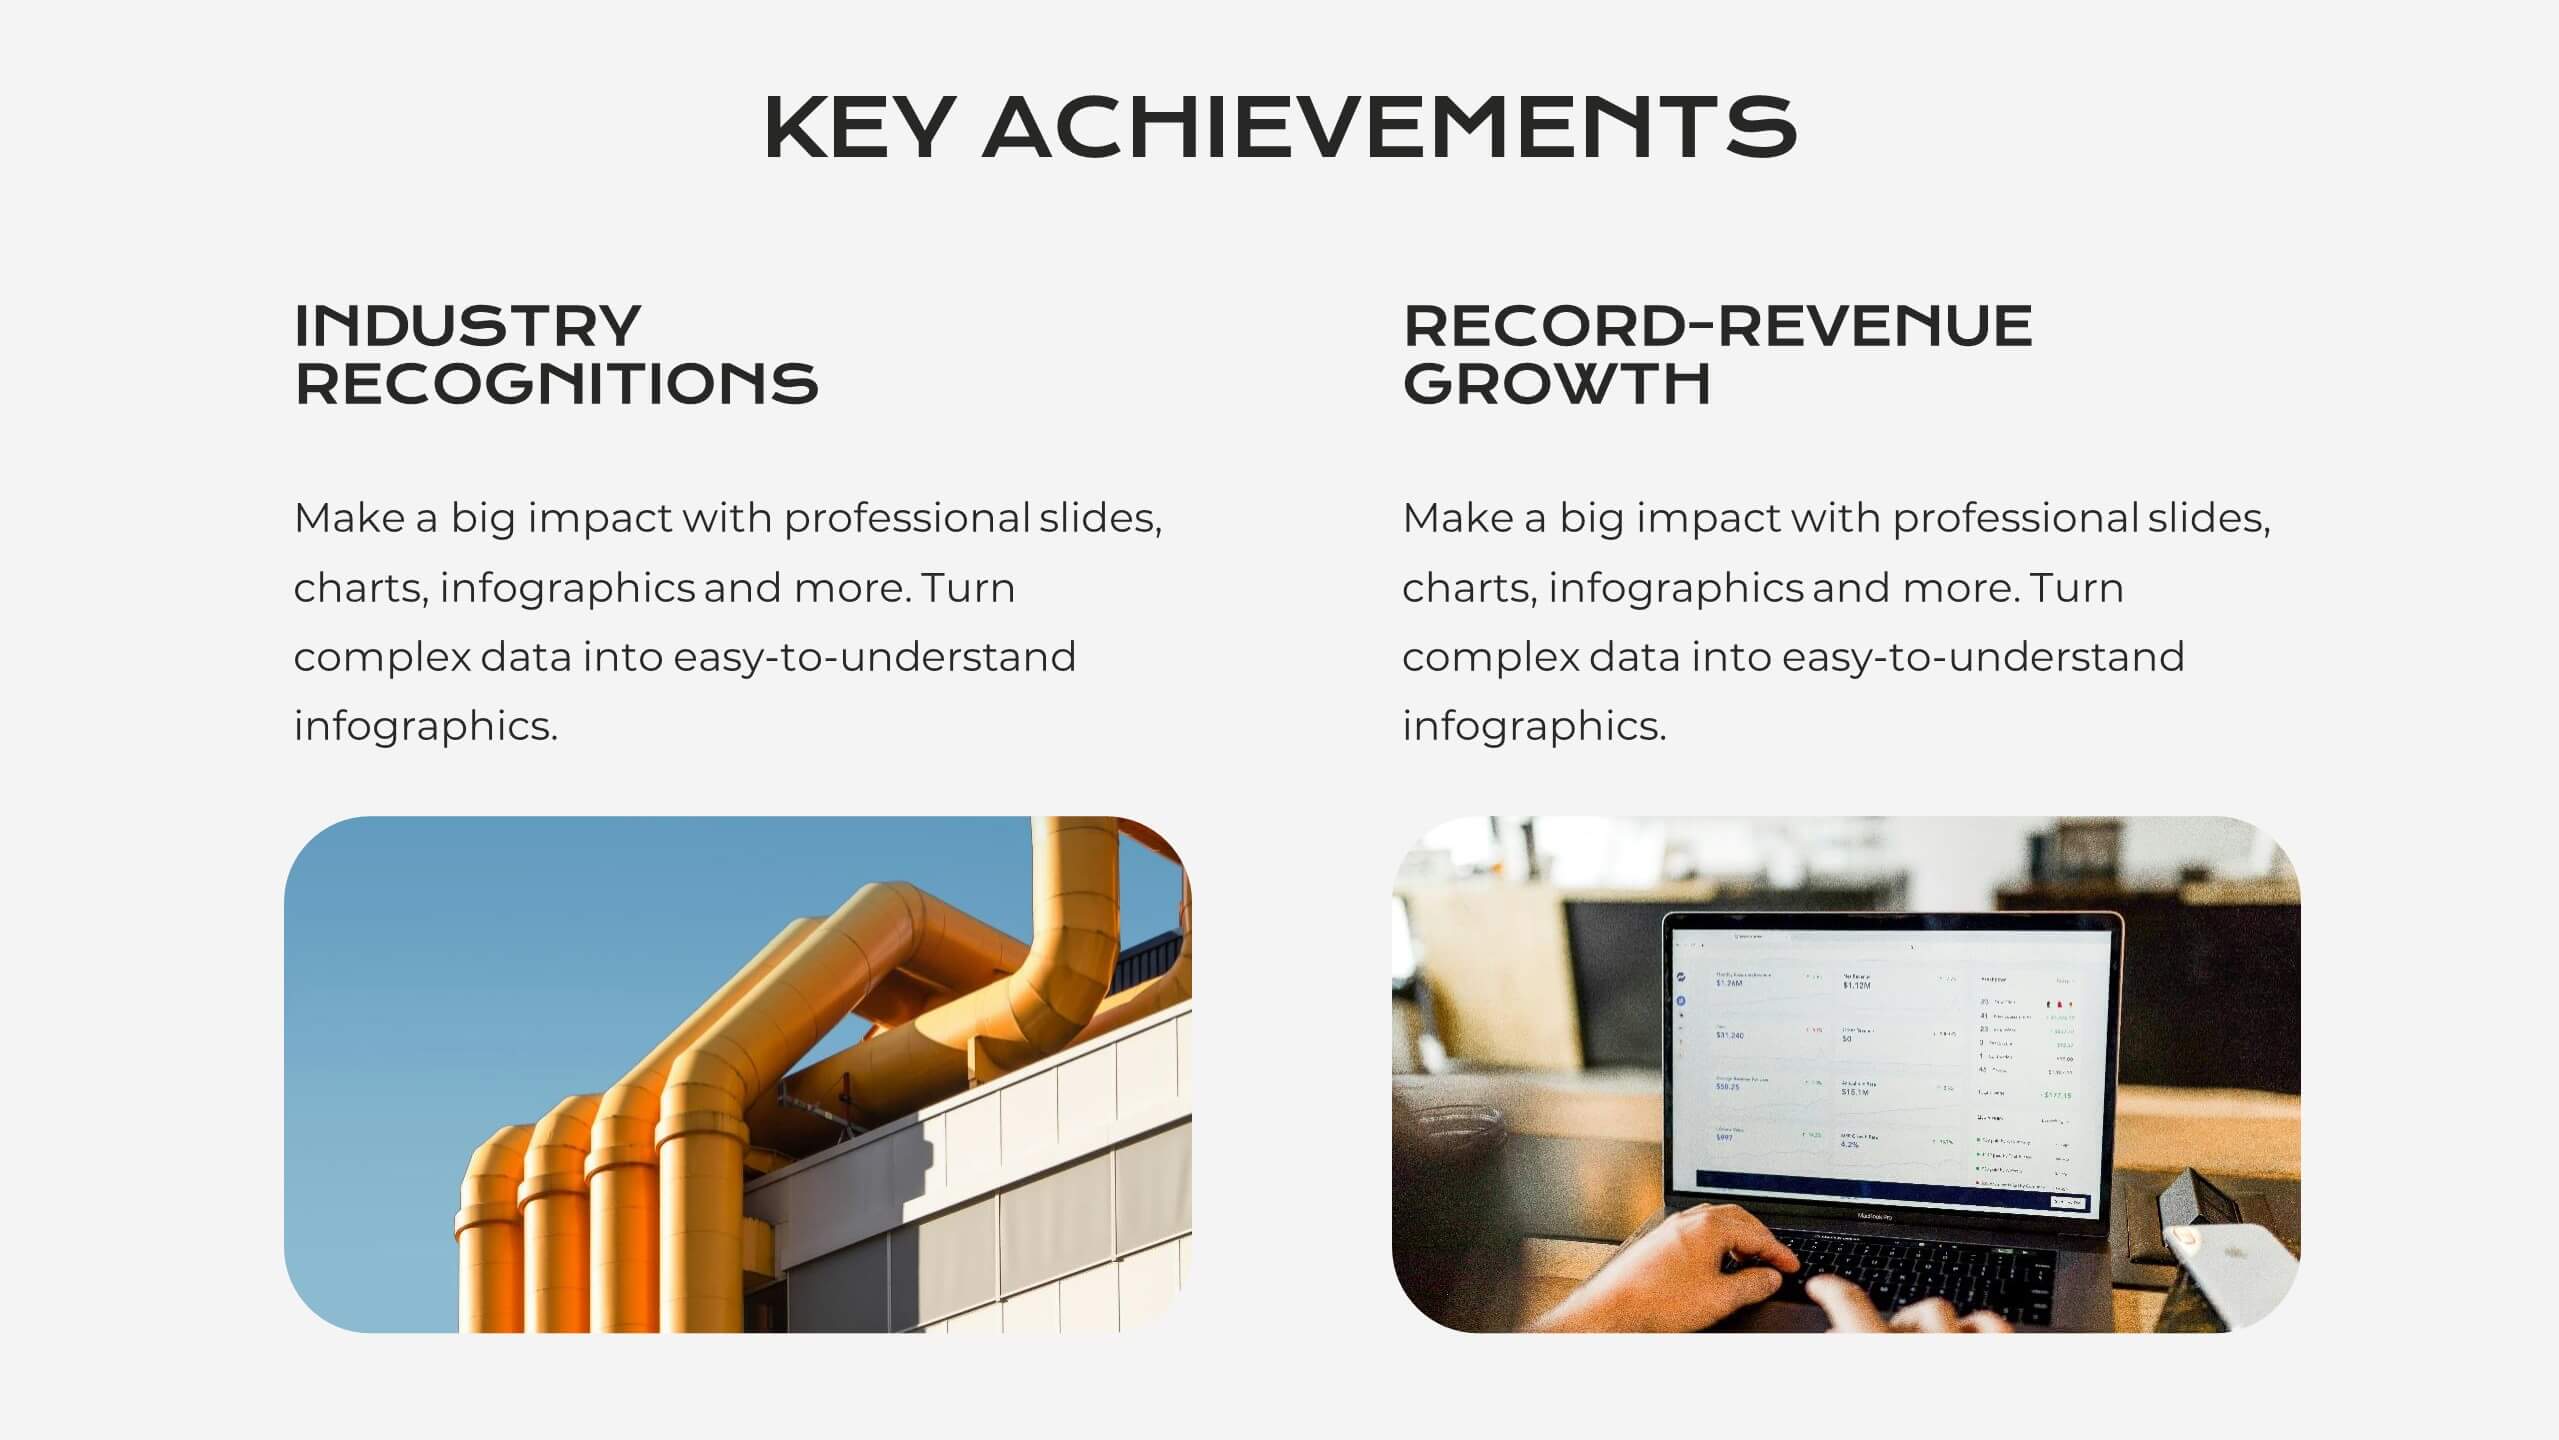
Business Performance Metric Presentation
Give your metrics a breath of fresh air with this modern, nature-inspired design. Perfect for presenting business KPIs, performance tracking, or growth data, this infographic layout uses vibrant pinwheel visuals to guide the viewer through key stats and insights. Fully compatible with PowerPoint, Keynote, and Google Slides for easy editing.


4 slides
Mind Mapping for Idea Expansion Presentation
Visualize your concepts clearly with this Mind Mapping for Idea Expansion presentation. Designed to help structure brainstorming sessions or strategic planning, this template organizes ideas around a central theme with clean, radial layouts. Ideal for creative teams and professionals. Fully editable in Canva, PowerPoint, and Google Slides.


26 slides
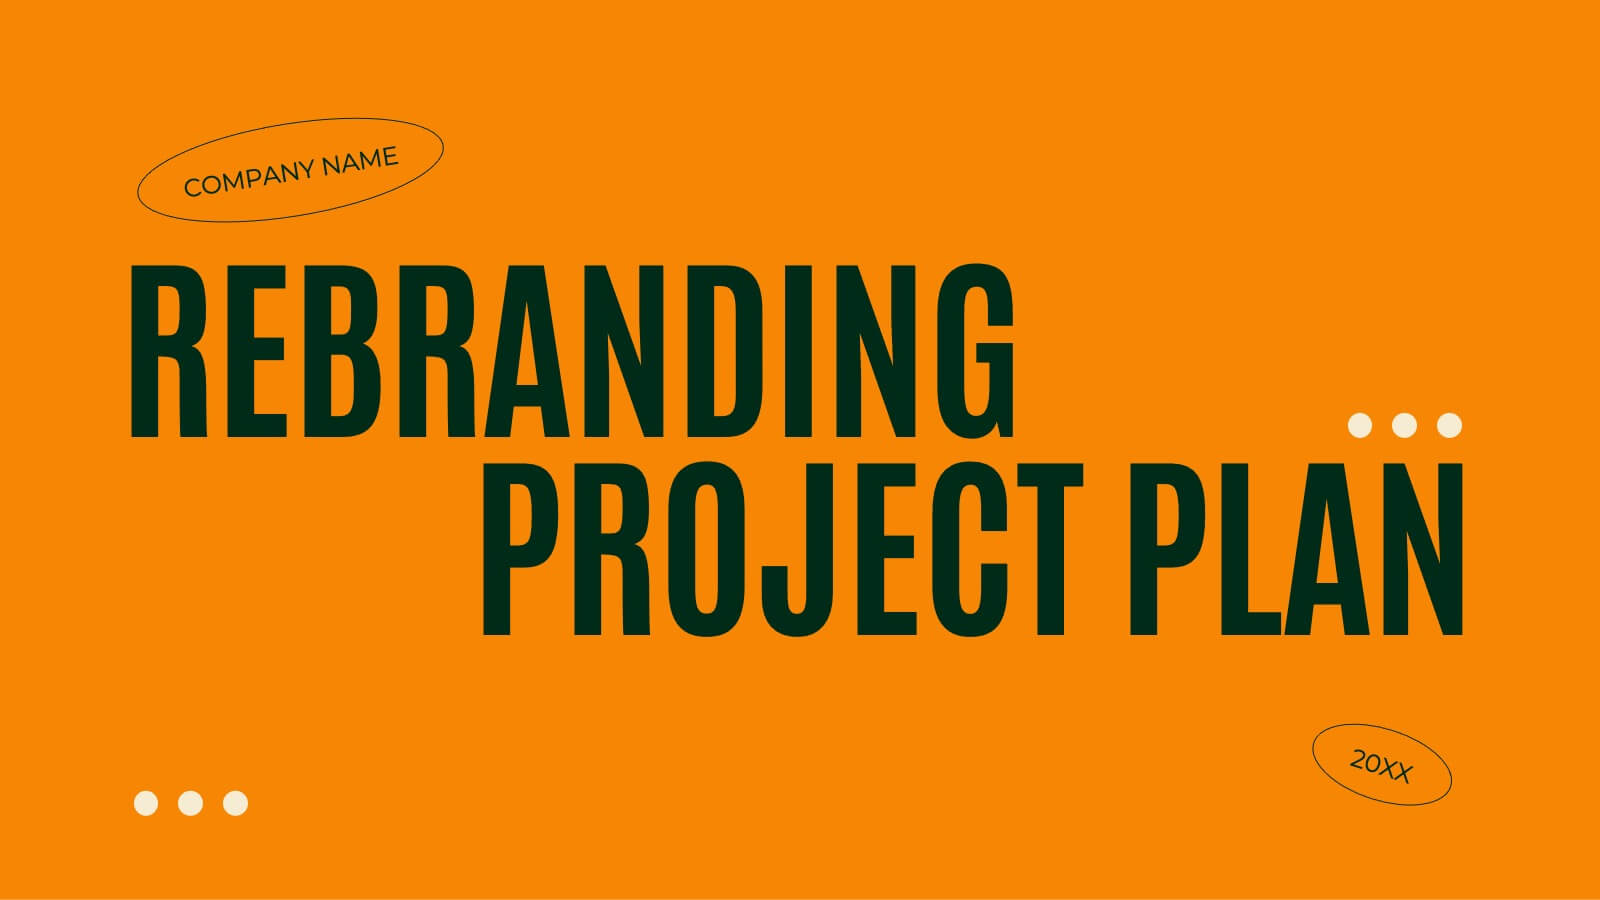
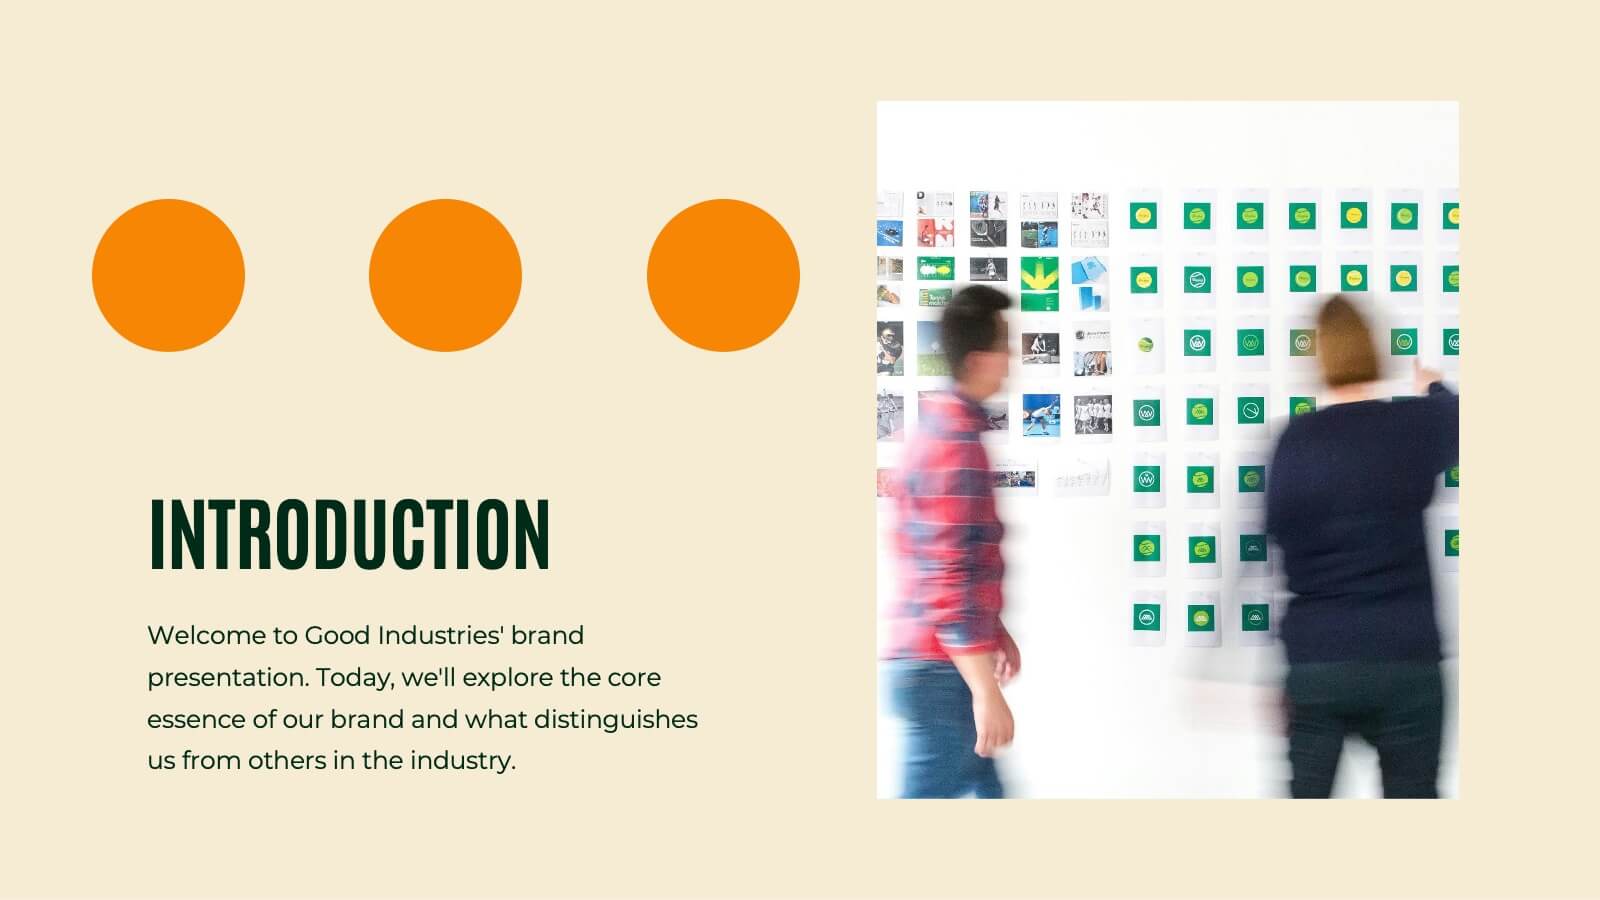
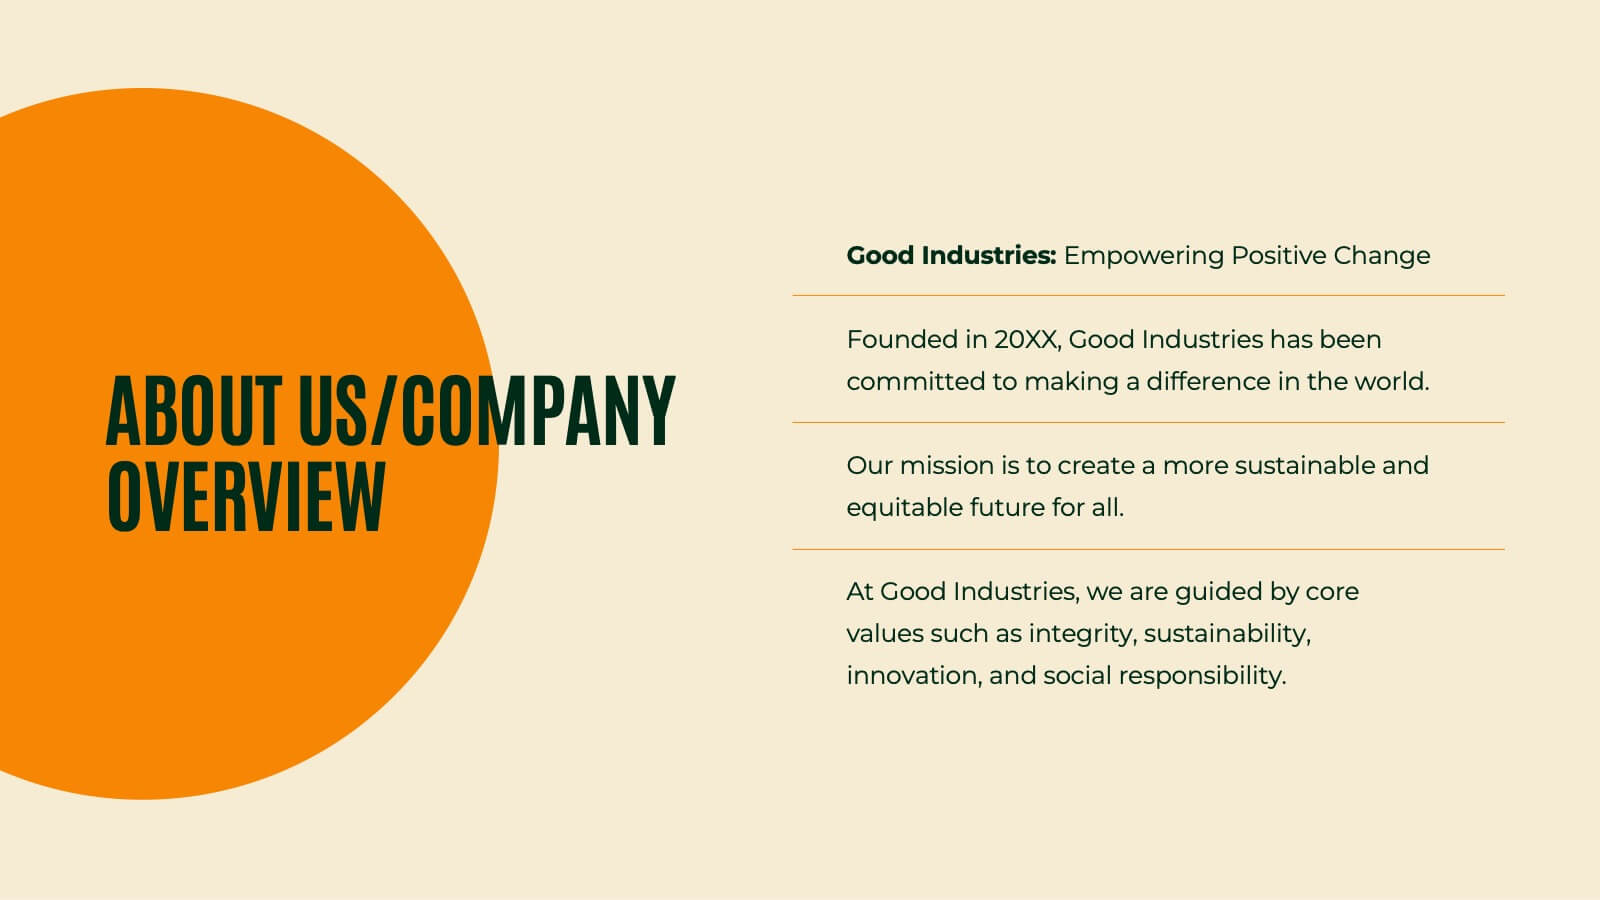
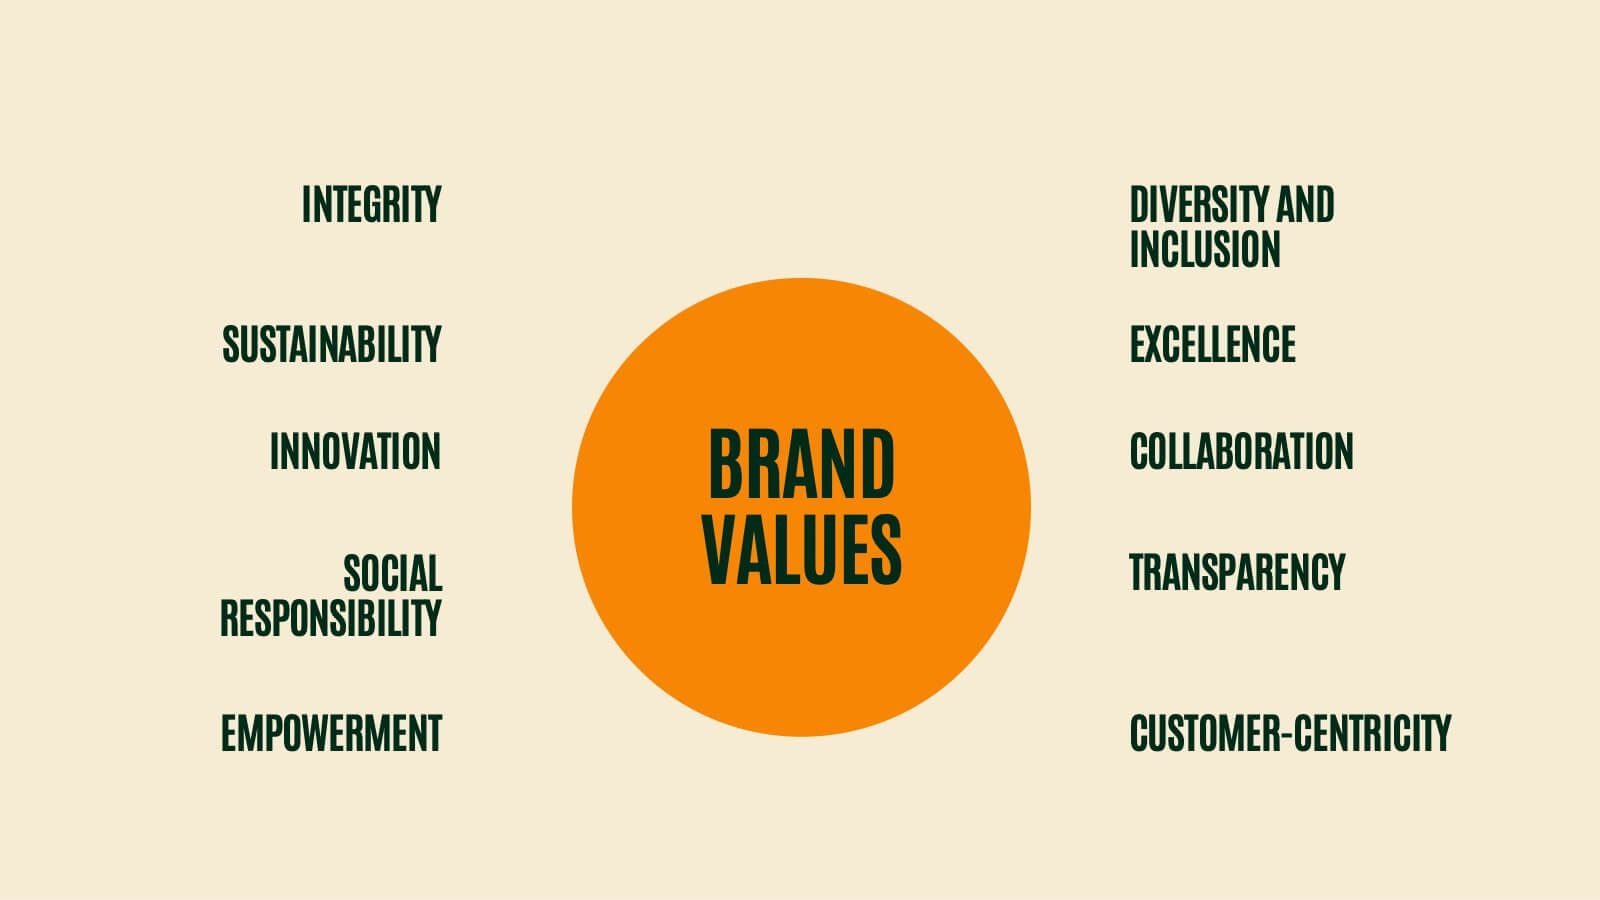
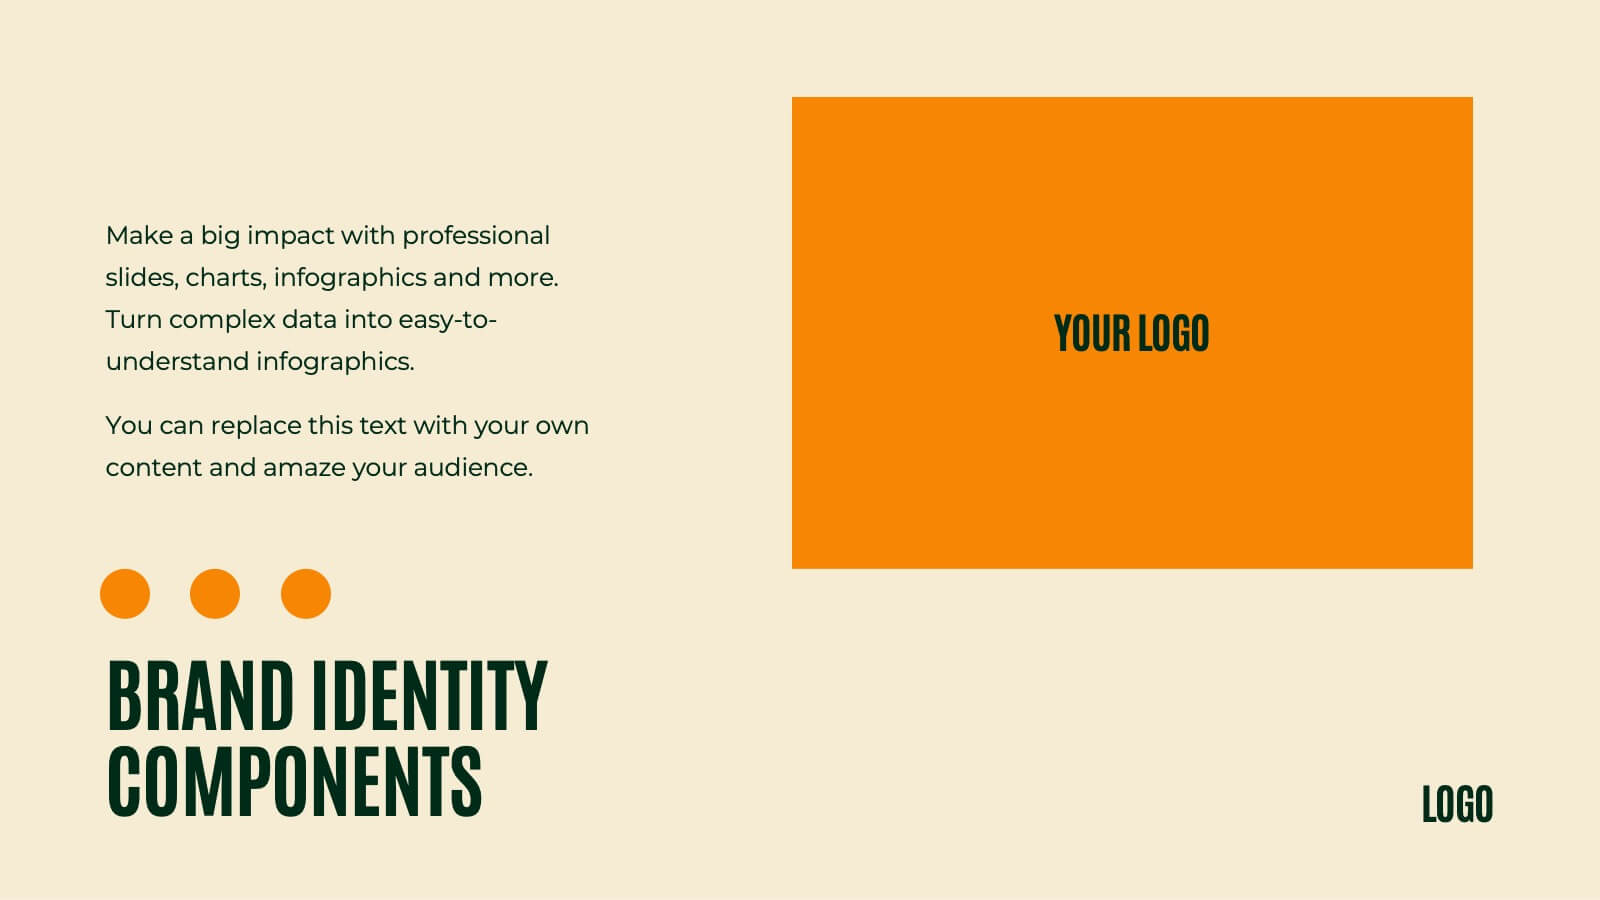
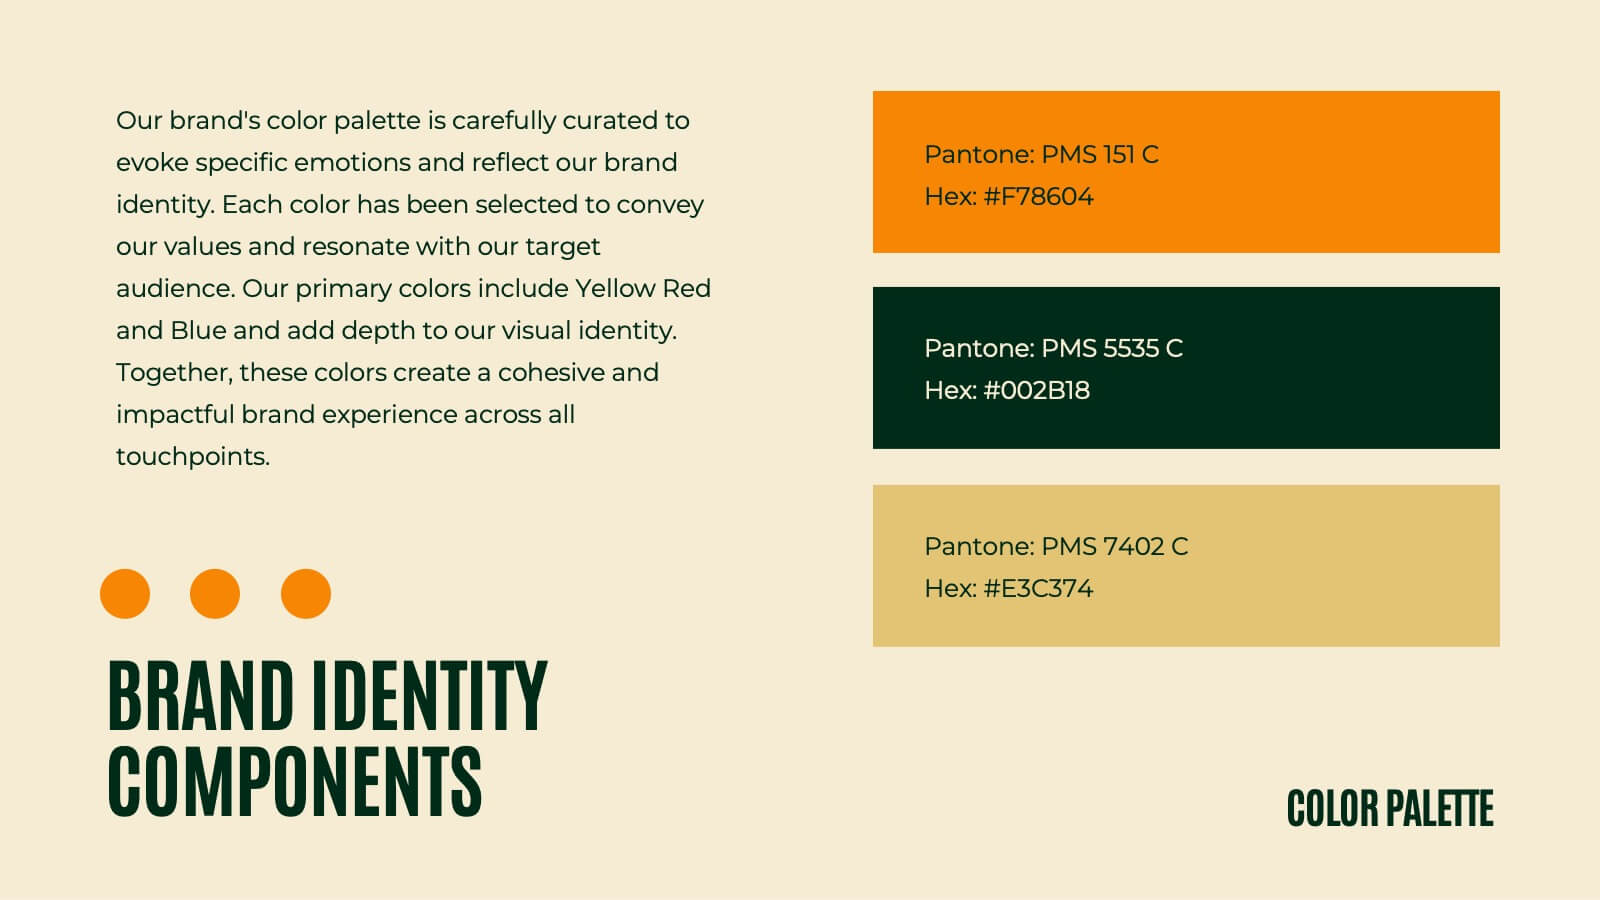
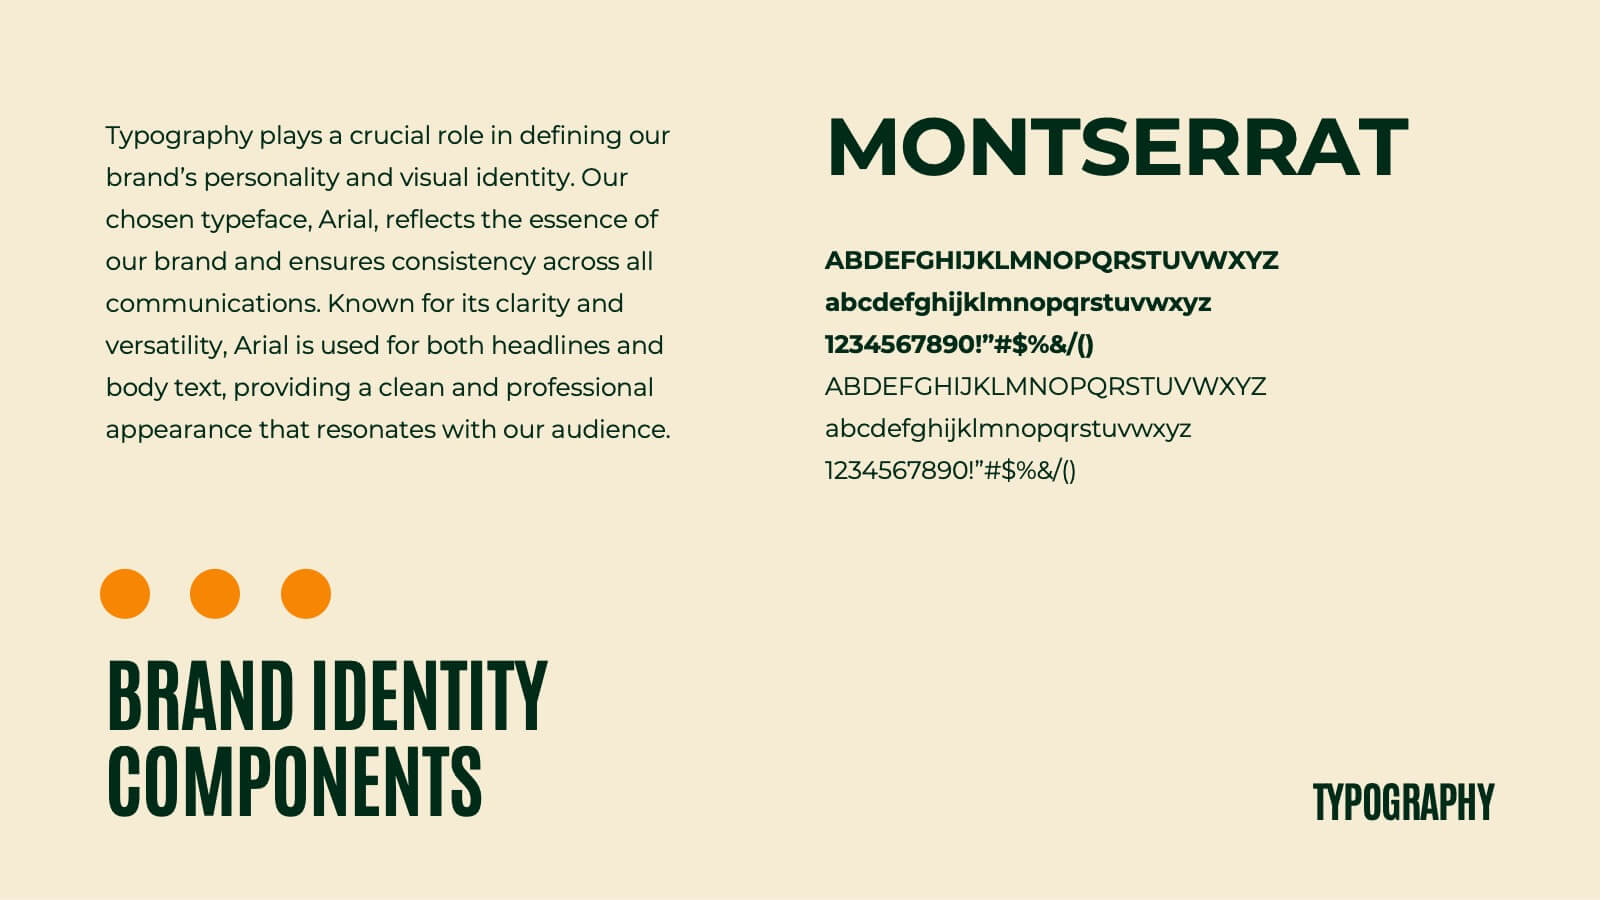
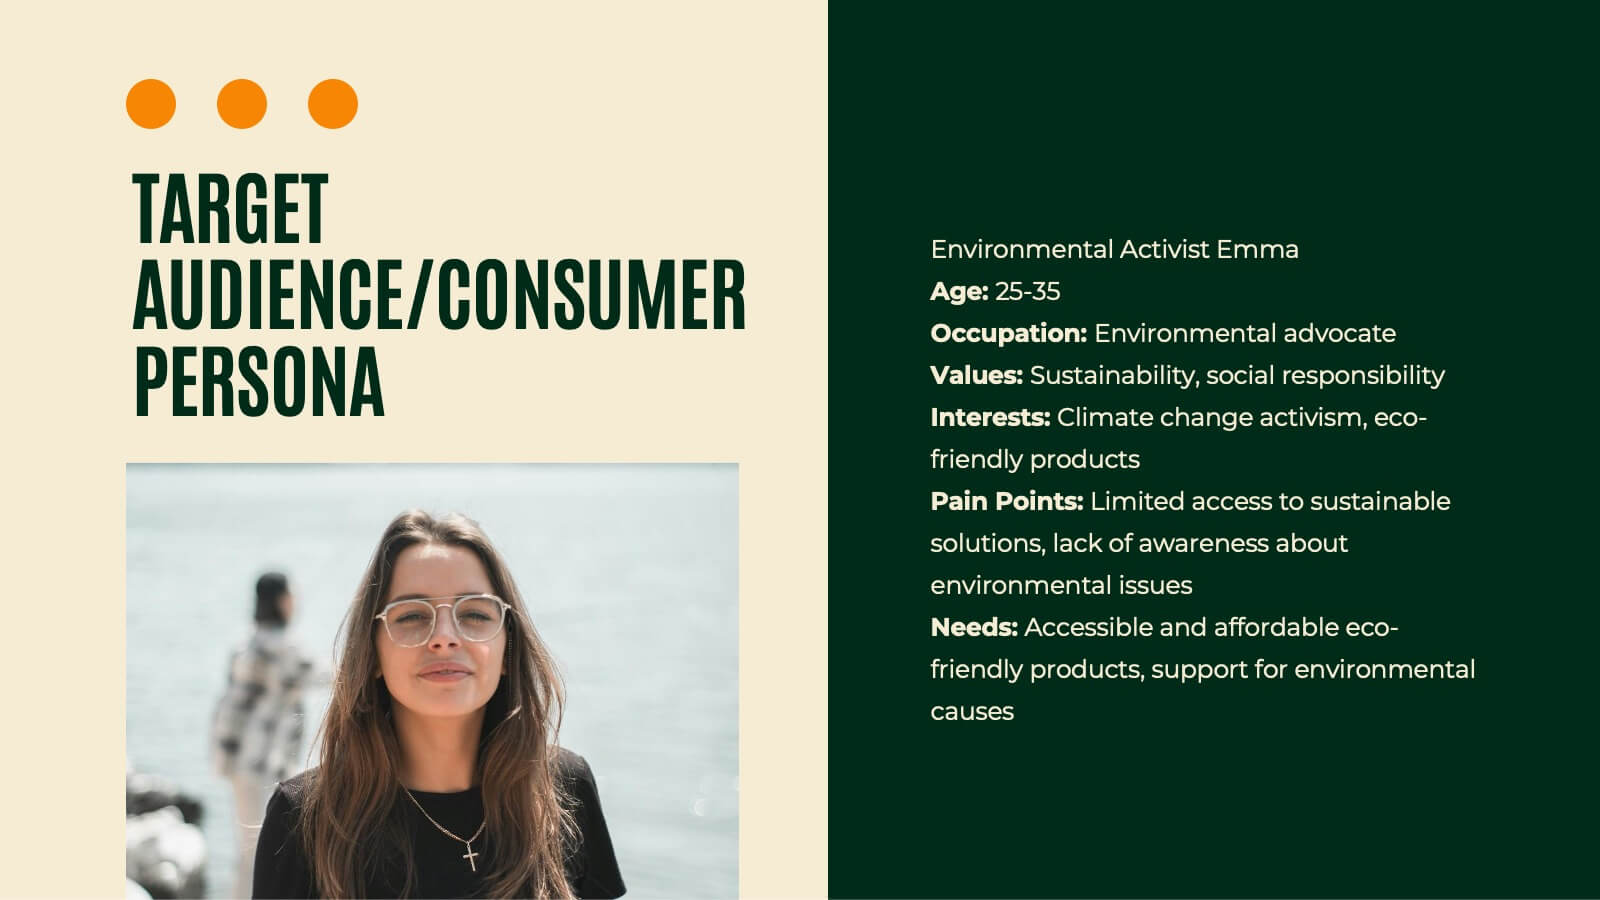
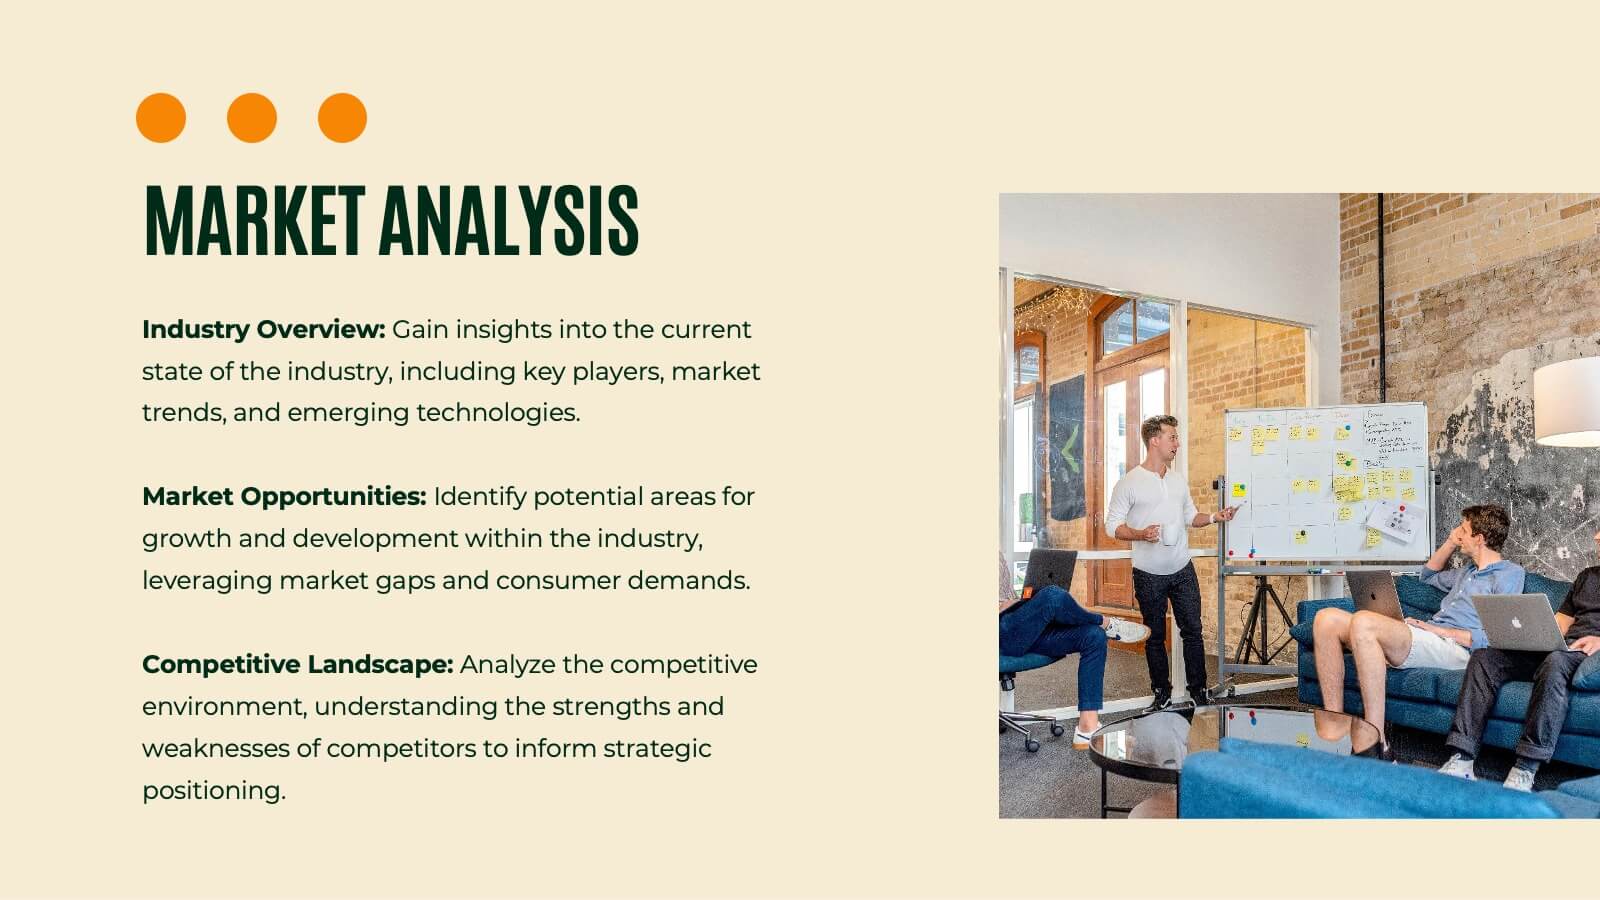
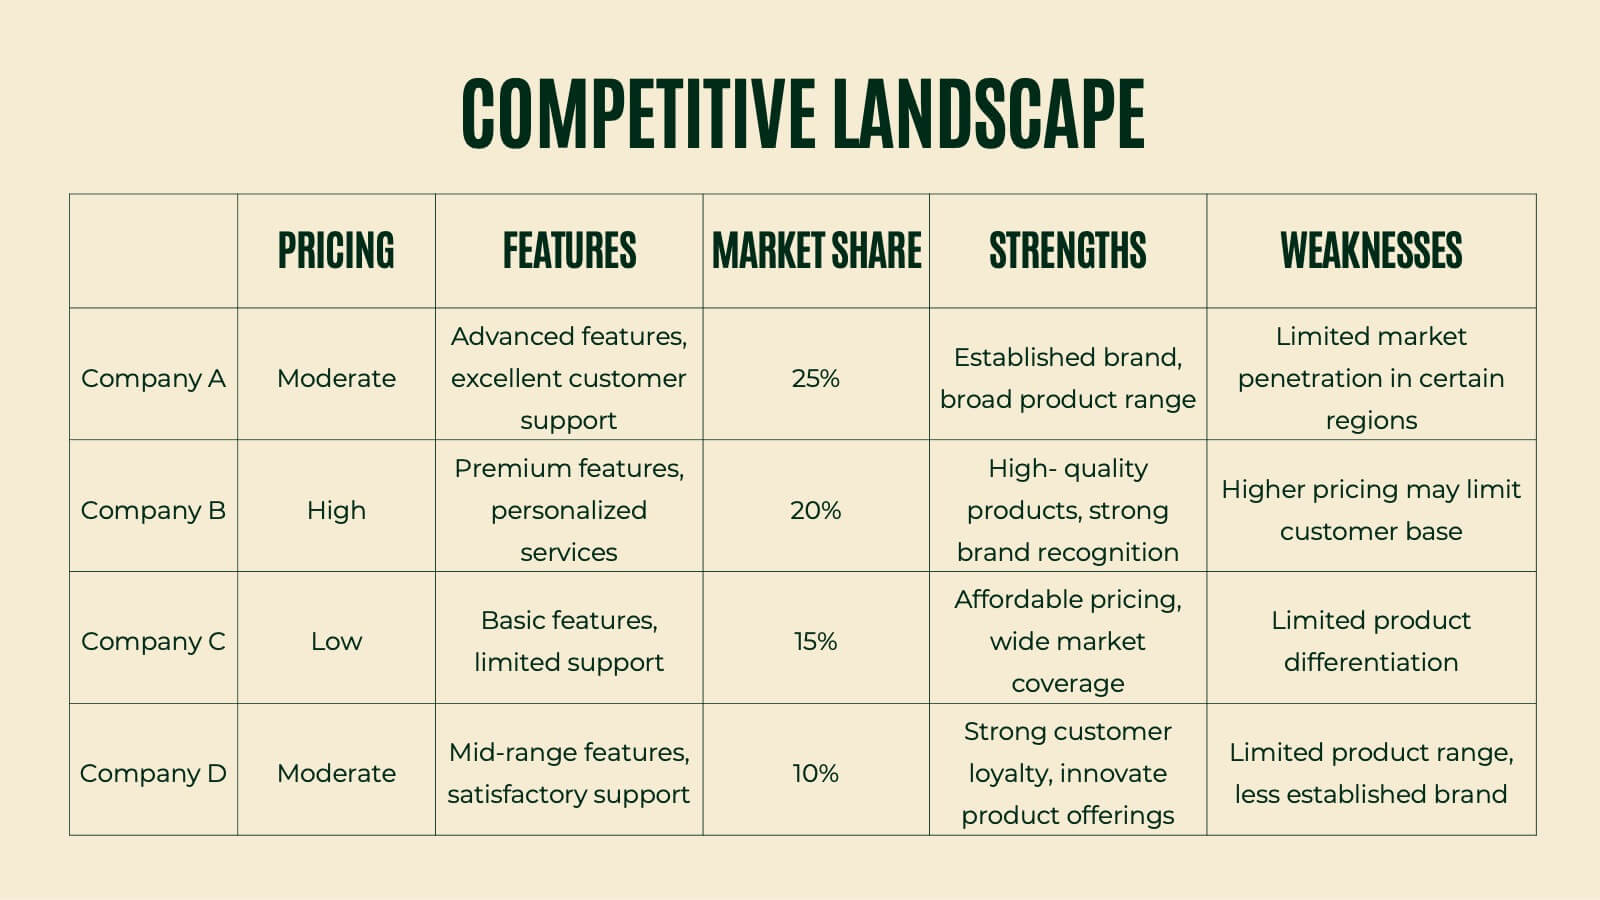
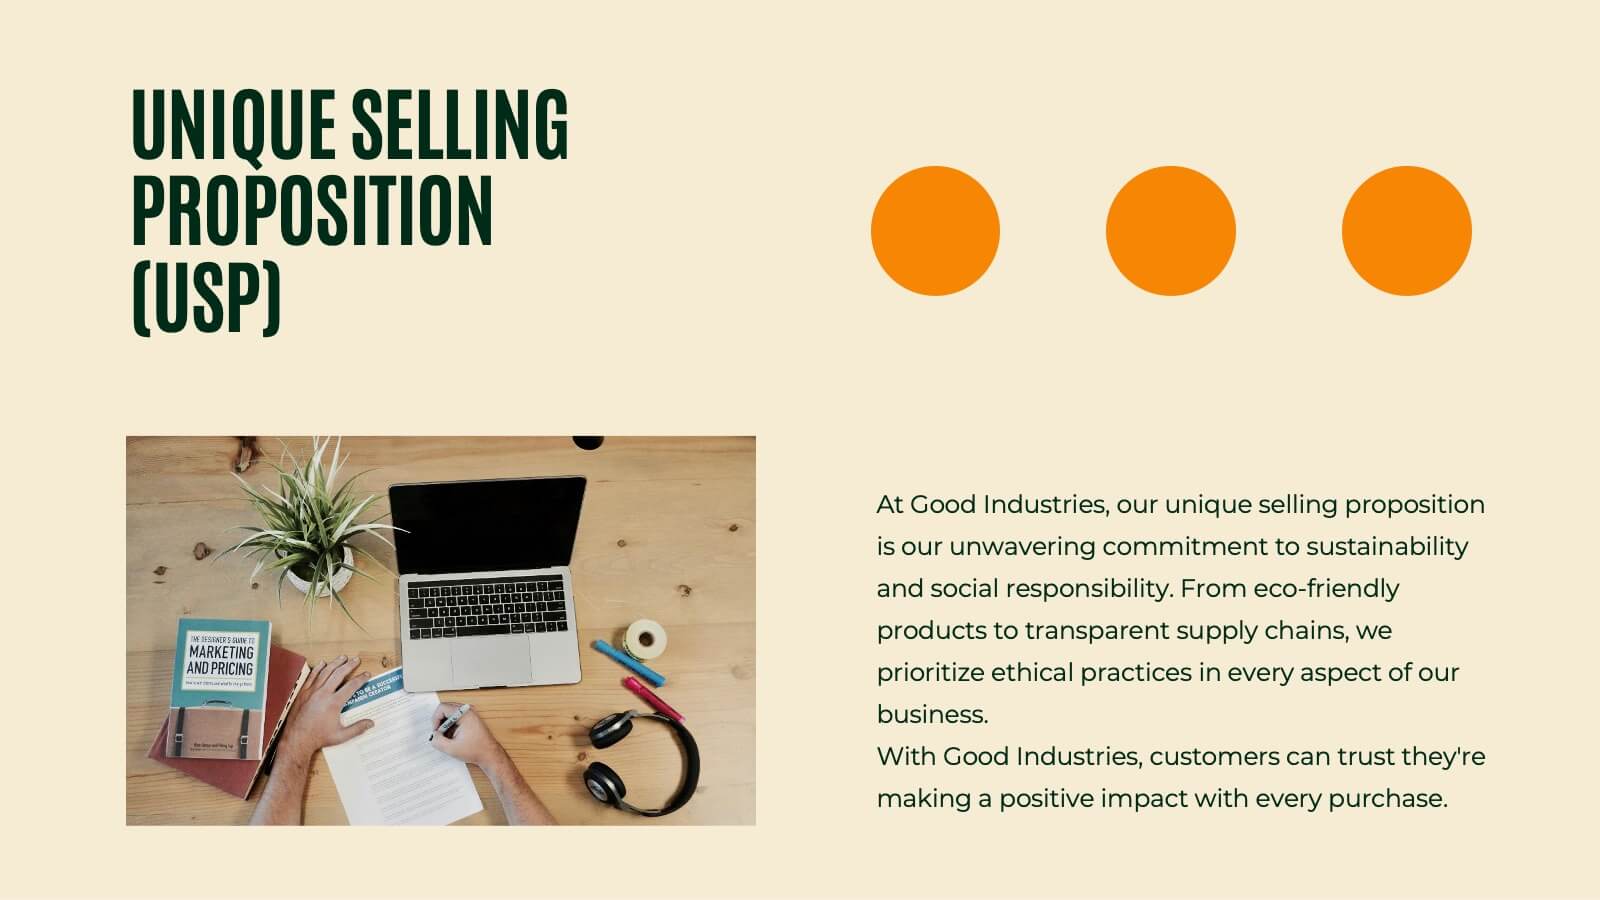
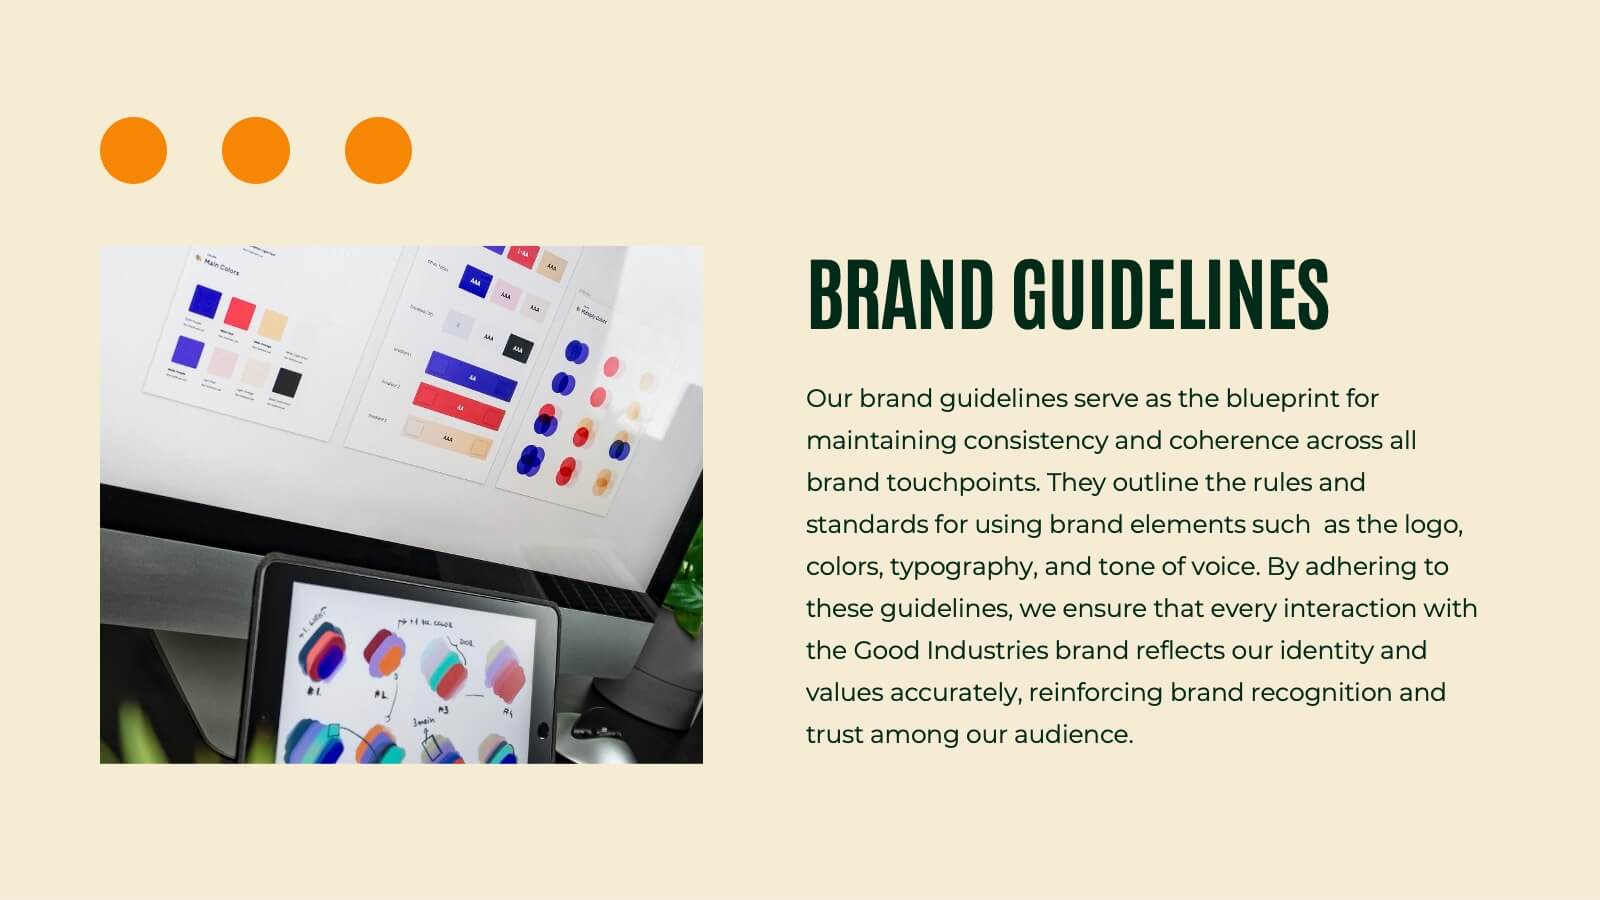
Griffin Rebranding Project Plan Presentation
Unleash the power of branding with this vibrant presentation template! This tool guides you through essential brand elements like identity, voice, and strategy. Perfect for marketers and brand managers aiming to make a memorable impact. Compatible with PowerPoint, Keynote, and Google Slides, it's a must-have for any branding project.


26 slides
Saam Presentation Template
Are you looking for a way to make your food presentation more fun and yummy-looking? Well, look no further! Our Saam food presentation template is just what you need. It's packed full of fun graphics and pictures of your food that will make your presentation look super tasty. And the best part? You can customize the photo layouts and charts to make your presentation look exactly how you want it with all the important information. So whether you're presenting your new restaurant to your investor, or showing your friends what you cooked for dinner this week, this template has got you covered.