


Features
- 6 Unique slides
- Fully editable and easy to edit in Microsoft Powerpoint, Keynote and Google Slides
- 16:9 widescreen layout
- Clean and professional designs
- Export to JPG, PDF or send by email


Do you have any questions?
Recommend


6 slides
Project Proposal Slide Deck Presentation
Make your next pitch unforgettable with a clean, structured layout that turns complex project ideas into a clear visual story. Ideal for presenting timelines, goals, or performance metrics, it helps you communicate your proposal with confidence and precision. Fully compatible with PowerPoint, Keynote, and Google Slides for effortless editing.


7 slides
Service Finance Infographic
Service finance refers to the management of financial resources, transactions, and strategies within the service industry. This infographic template ensures that the services provided are financially sustainable, meet customer needs, and contribute to the overall growth and success of the organization. Fully customizable and compatible with Powerpoint, Keynote, and Google Slides. Showcase the dynamics that drive the financial world, uncovering the core elements of the ecosystem. This infographic will encourage action and invite your audience to embrace a financial renaissance, soaring towards their prosperous future.


6 slides
Project Management Responsibility Assignment Matrix Infographics
Effectively assign responsibilities in your projects with our Project Management Responsibility Assignment Matrix (RAM) infographic template. This template is fully compatible with popular presentation software like PowerPoint, Keynote, and Google Slides, allowing you to easily customize it to illustrate and communicate the roles and responsibilities of team members in your project. The Project Management RAM infographic template offers a visually engaging platform to outline the key tasks, deliverables, and responsibilities of project team members. Whether you're a project manager, team leader, or involved in project planning, this template provides a user-friendly canvas to create informative presentations and project management materials. Optimize your project management processes with this SEO-optimized Project Management RAM infographic template, thoughtfully designed for clarity and ease of use. Customize it to showcase the matrix structure, define roles (RACI), and ensure that everyone on the team understands their responsibilities, ensuring efficient project execution. Start crafting your personalized infographic today to excel in project management responsibility assignment.


5 slides
Teenage Suicide Awareness Infographics
Teenage suicide is a serious public health concern that requires awareness and attention. These vertical infographics are designed to raise awareness about teenage suicide, its risk factors, and prevention strategies. The goal of these infographics is to educate the audience, including parents, educators, and community members, about the importance of early intervention, mental health support, and creating a supportive environment for teenagers. The design elements included are carefully chosen to evoke empathy, compassion, and understanding. Fully customizable and compatible with Powerpoint, Keynote, and Google Slides.


26 slides
Ioel Presentation Template
Here's the perfect kickstart to your business with a presentation template that you’ve been dreaming of! Ioel's crisp, bold font and a clean aesthetic that is engaging to any audience. This template will give your business a bolder and more professional image that you need. Ioel's bold blue background is eye-catching, making this template perfect for businesses seeking to make a great impression. This template will make it easy for you to create an attractive and professional-looking deck. Any business owner wishing to make an impression on their audience will want to use this presentation.


5 slides
Business Growth Cycle Presentation
Illustrate your company’s journey with the Business Growth Cycle slide. This dynamic layout features four sleek arrow segments that represent each phase of growth—from initiation to expansion. Color-coded steps and minimalist icons help guide the audience through your strategy clearly and efficiently. Ideal for outlining roadmaps, business stages, or workflow transitions. Fully editable and compatible with PowerPoint, Keynote, and Google Slides.


7 slides
Sustainability Risk Management Infographic
Elevate your presentations with our Sustainability Risk Management infographic, compatible with Powerpoint, Keynote, and Google Slides. This infographic is a vital tool for professionals dedicated to showcasing the importance of sustainable practices and risk mitigation in their organizations. It's crafted to display the interconnectivity between environmental, social, and governance (ESG) factors and business operations. Our Sustainability Risk Management infographic effectively breaks down complex sustainability challenges into digestible parts. It's an invaluable resource for corporate strategists, environmental consultants, and policy makers. By simplifying the communication of sustainability data, it encourages stakeholder engagement and facilitates strategic planning sessions. The design of the infographic ensures that sustainability goals and risk assessments are presented in an engaging and memorable manner. It supports your narrative by visually guiding your audience through the elements of sustainability that are pivotal for risk management. By integrating this infographic into your slide decks, you can confidently convey the message that responsible management is key to long-term success.


26 slides
Financial Planning Essentials Presentation
Take control of your financial destiny with our Financial Planning Essentials presentation template, suitable for PowerPoint, Keynote, and Google Slides. This template is meticulously designed for financial advisors, planners, and anyone seeking to educate on the principles of sound financial management. Our Financial Planning Essentials template is a rich resource that provides an extensive range of slides to explain the basics of financial planning, investment strategies, and wealth management. It allows you to break down financial concepts into easy-to-understand elements, making it perfect for client presentations, financial workshops, and educational seminars. Featuring customizable diagrams, charts, and financial models, the template enables a personalized approach to presenting financial data and strategies. Whether you're outlining budgeting techniques, investment plans, or retirement strategies, this template helps you communicate complex information in a clear and professional manner. Optimize your financial planning presentations with our SEO-friendly template to become a trusted resource in financial education and planning. Lead your audience toward financial freedom with a comprehensive and engaging presentation that simplifies the path to financial success.


23 slides
Quest Qualitative Research Findings Presentation
This dynamic and sleek research template presents qualitative findings with style and clarity. Dive into research objectives, data collection, key findings, and future directions, all showcased with a minimalist black-and-white design. Perfect for impactful presentations, this template is compatible with PowerPoint, Keynote, and Google Slides, making it versatile for any audience!


7 slides
Product Life Cycle Management Infographic
The Product Life Cycle is a widely recognized marketing and business model that describes the typical stages a product goes through from its introduction to the market to its decline. This infographic template is an illustrative journey through the stages of product evolution. This visually appealing infographic is your guide to understanding the life cycle of a product and the strategic management required at each phase. Compatible with Powerpoint, Keynote, and Google Slides. This template explores the phases of product life, understand the strategies needed at each stage, and navigating the landscape of product management.


4 slides
Scrum & Agile Sprint Presentation
Bring movement and clarity to your workflow with a dynamic loop-and-sprint visual that makes progress feel intuitive and easy to track. This presentation helps you outline iterations, refine tasks, and communicate team priorities with confidence. Fully editable and compatible with PowerPoint, Keynote, and Google Slides.


5 slides
Health Awareness Campaign Presentation
Bright and uplifting, this slide brings awareness to important health causes through a clean ribbon-focused layout that’s easy to read and visually engaging. It helps present key messages, statistics, or campaign steps clearly while keeping the design calm and supportive. Fully compatible with PowerPoint, Keynote, and Google Slides.


21 slides
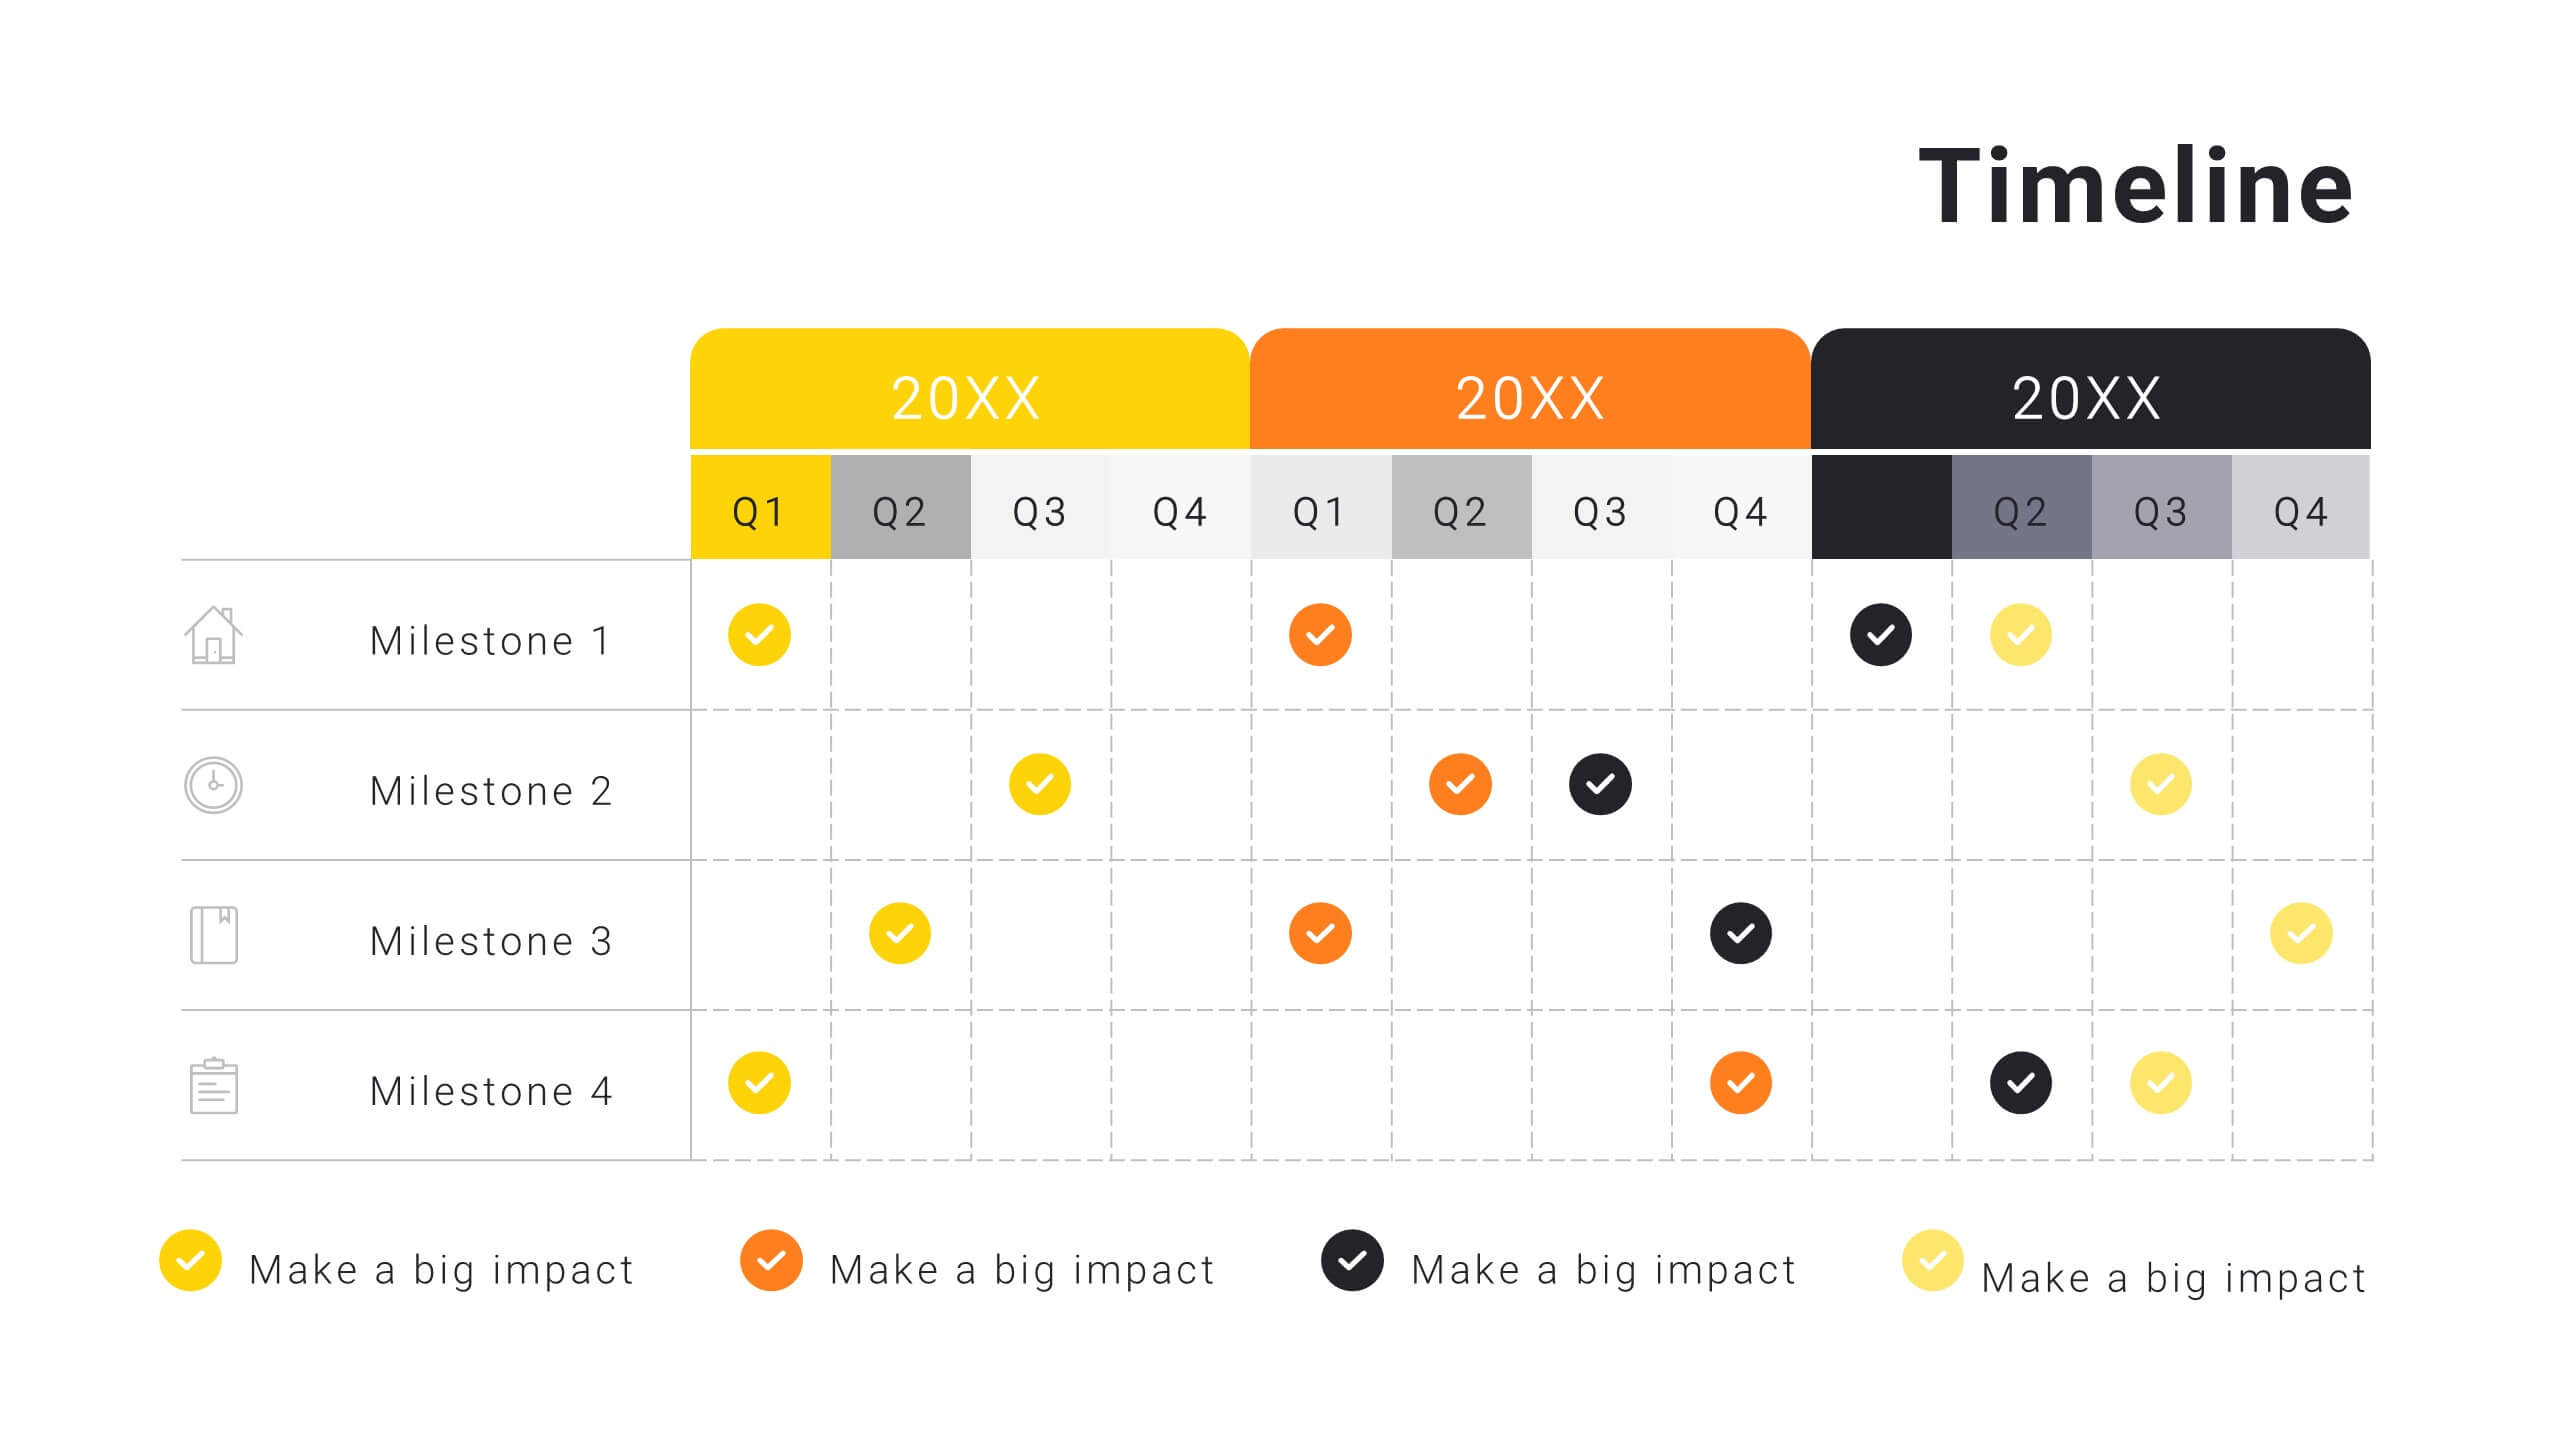
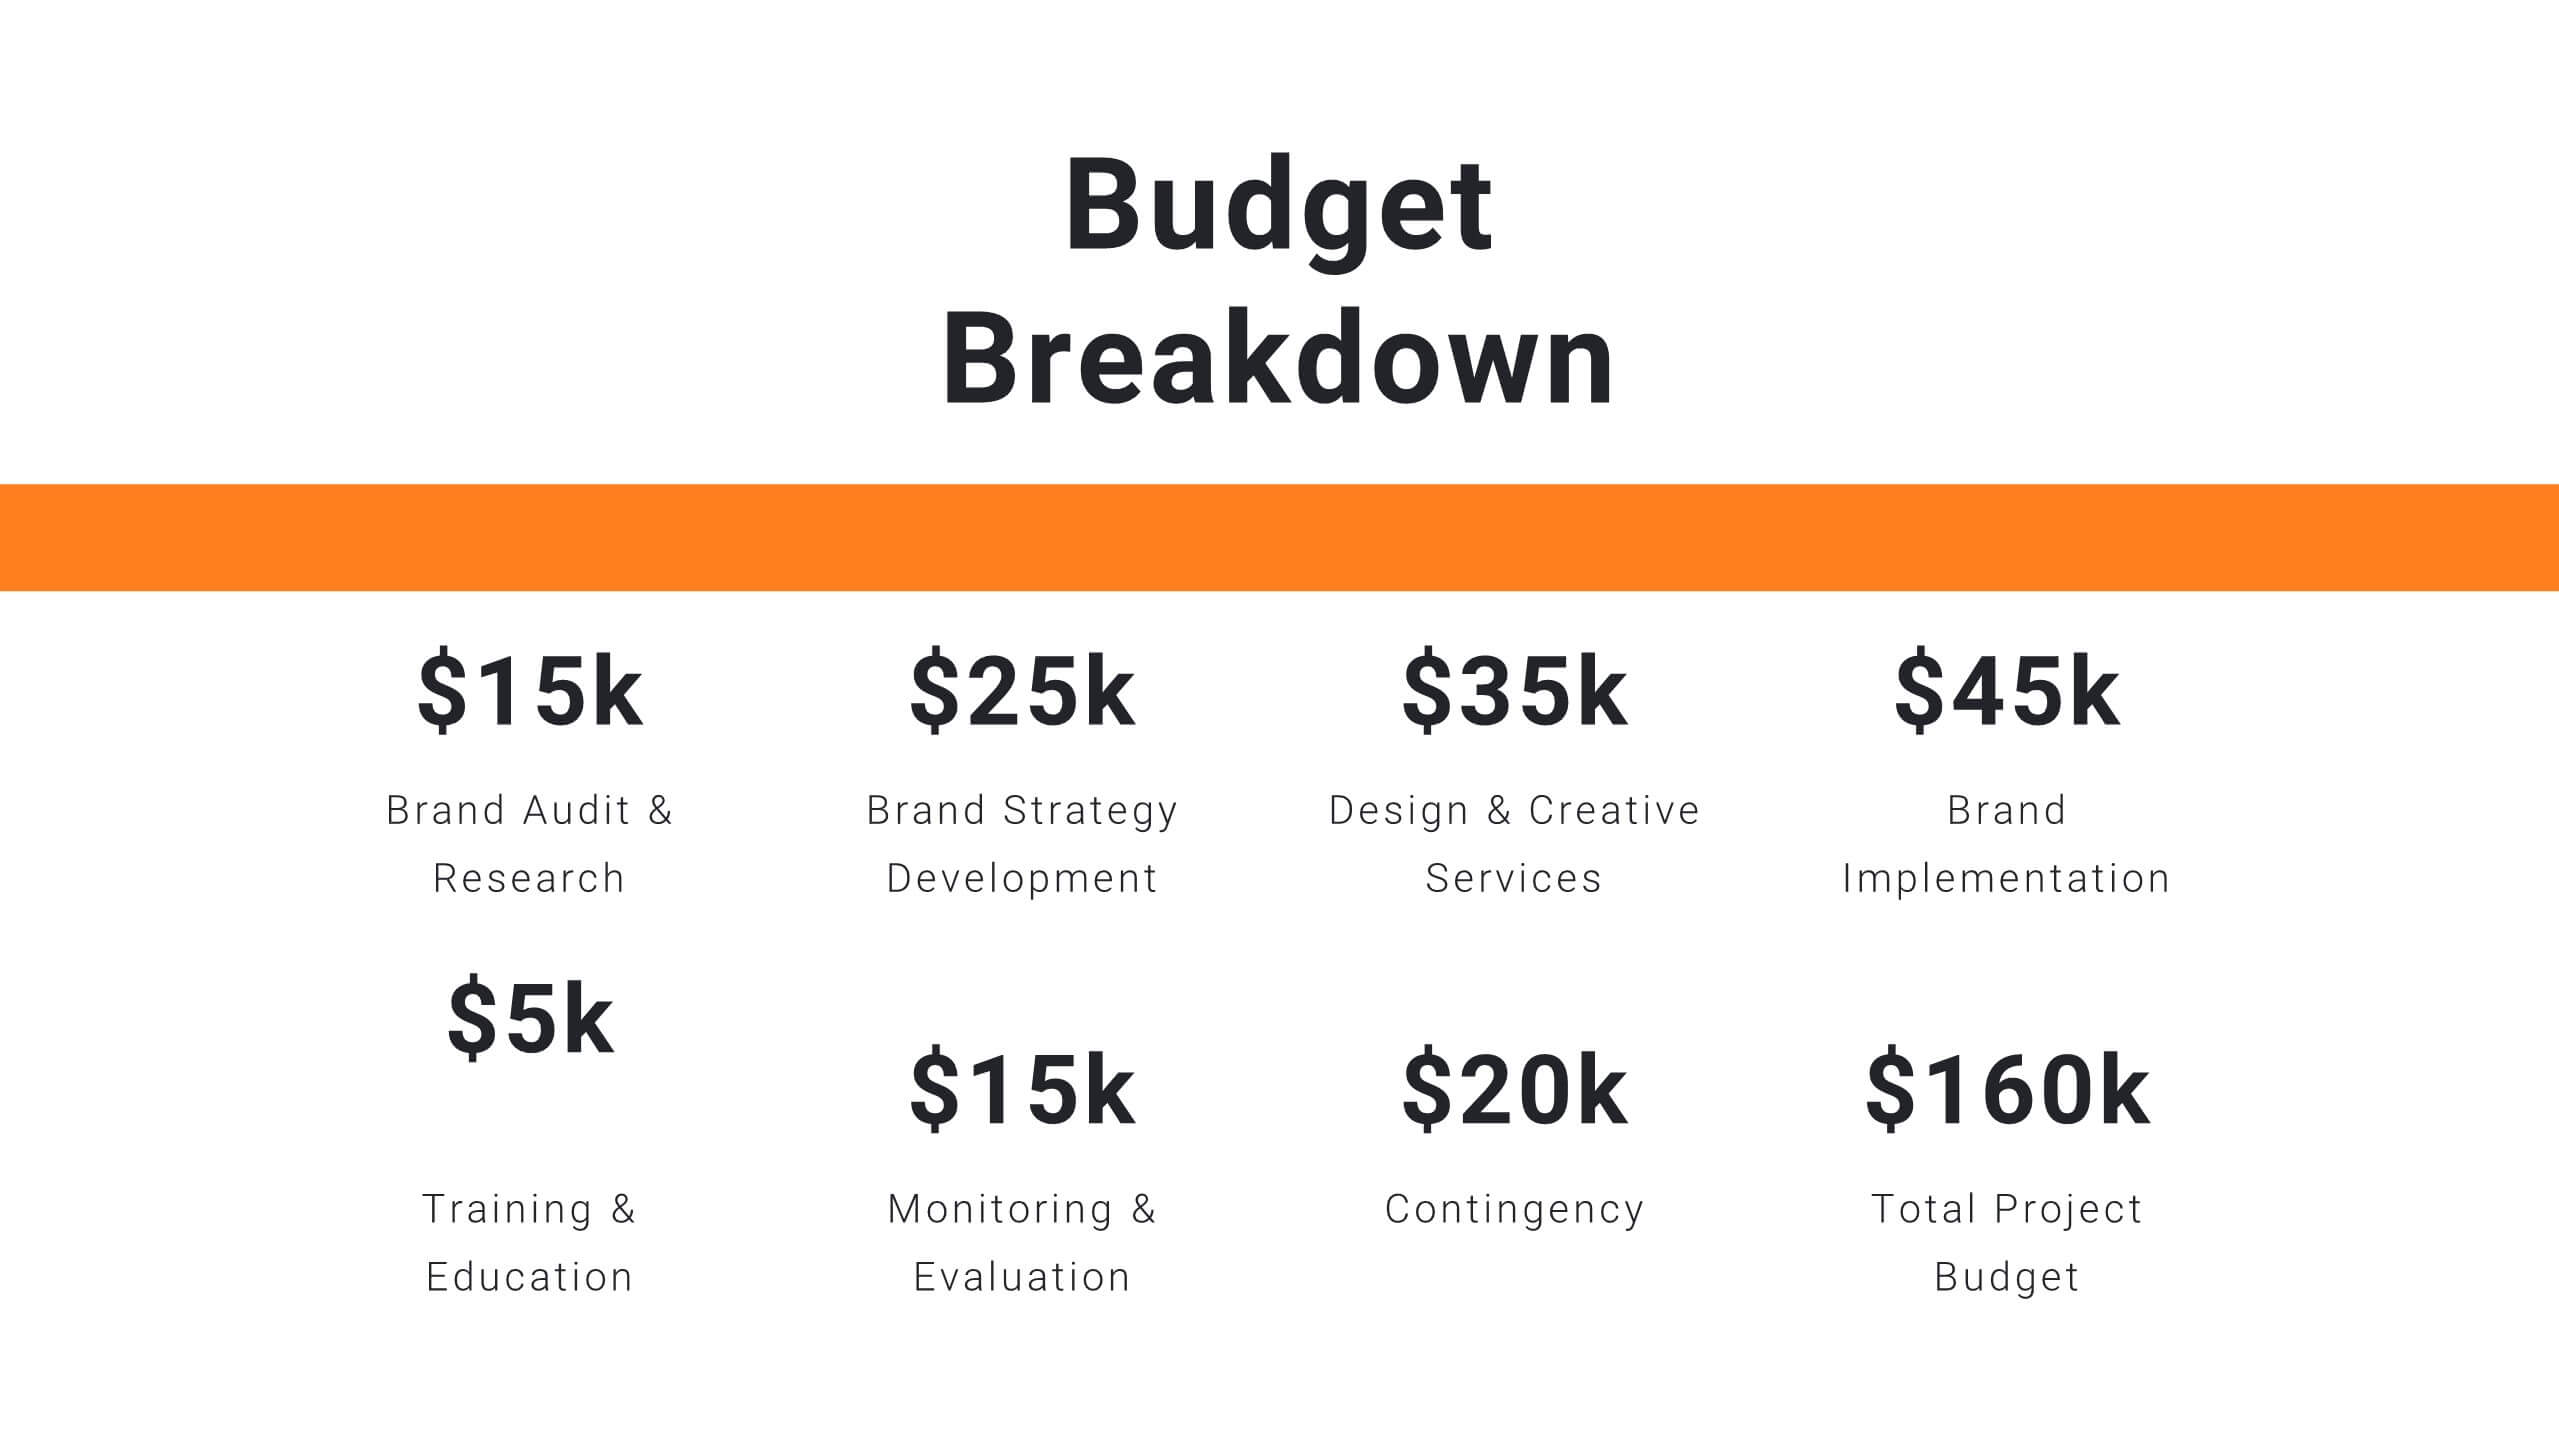
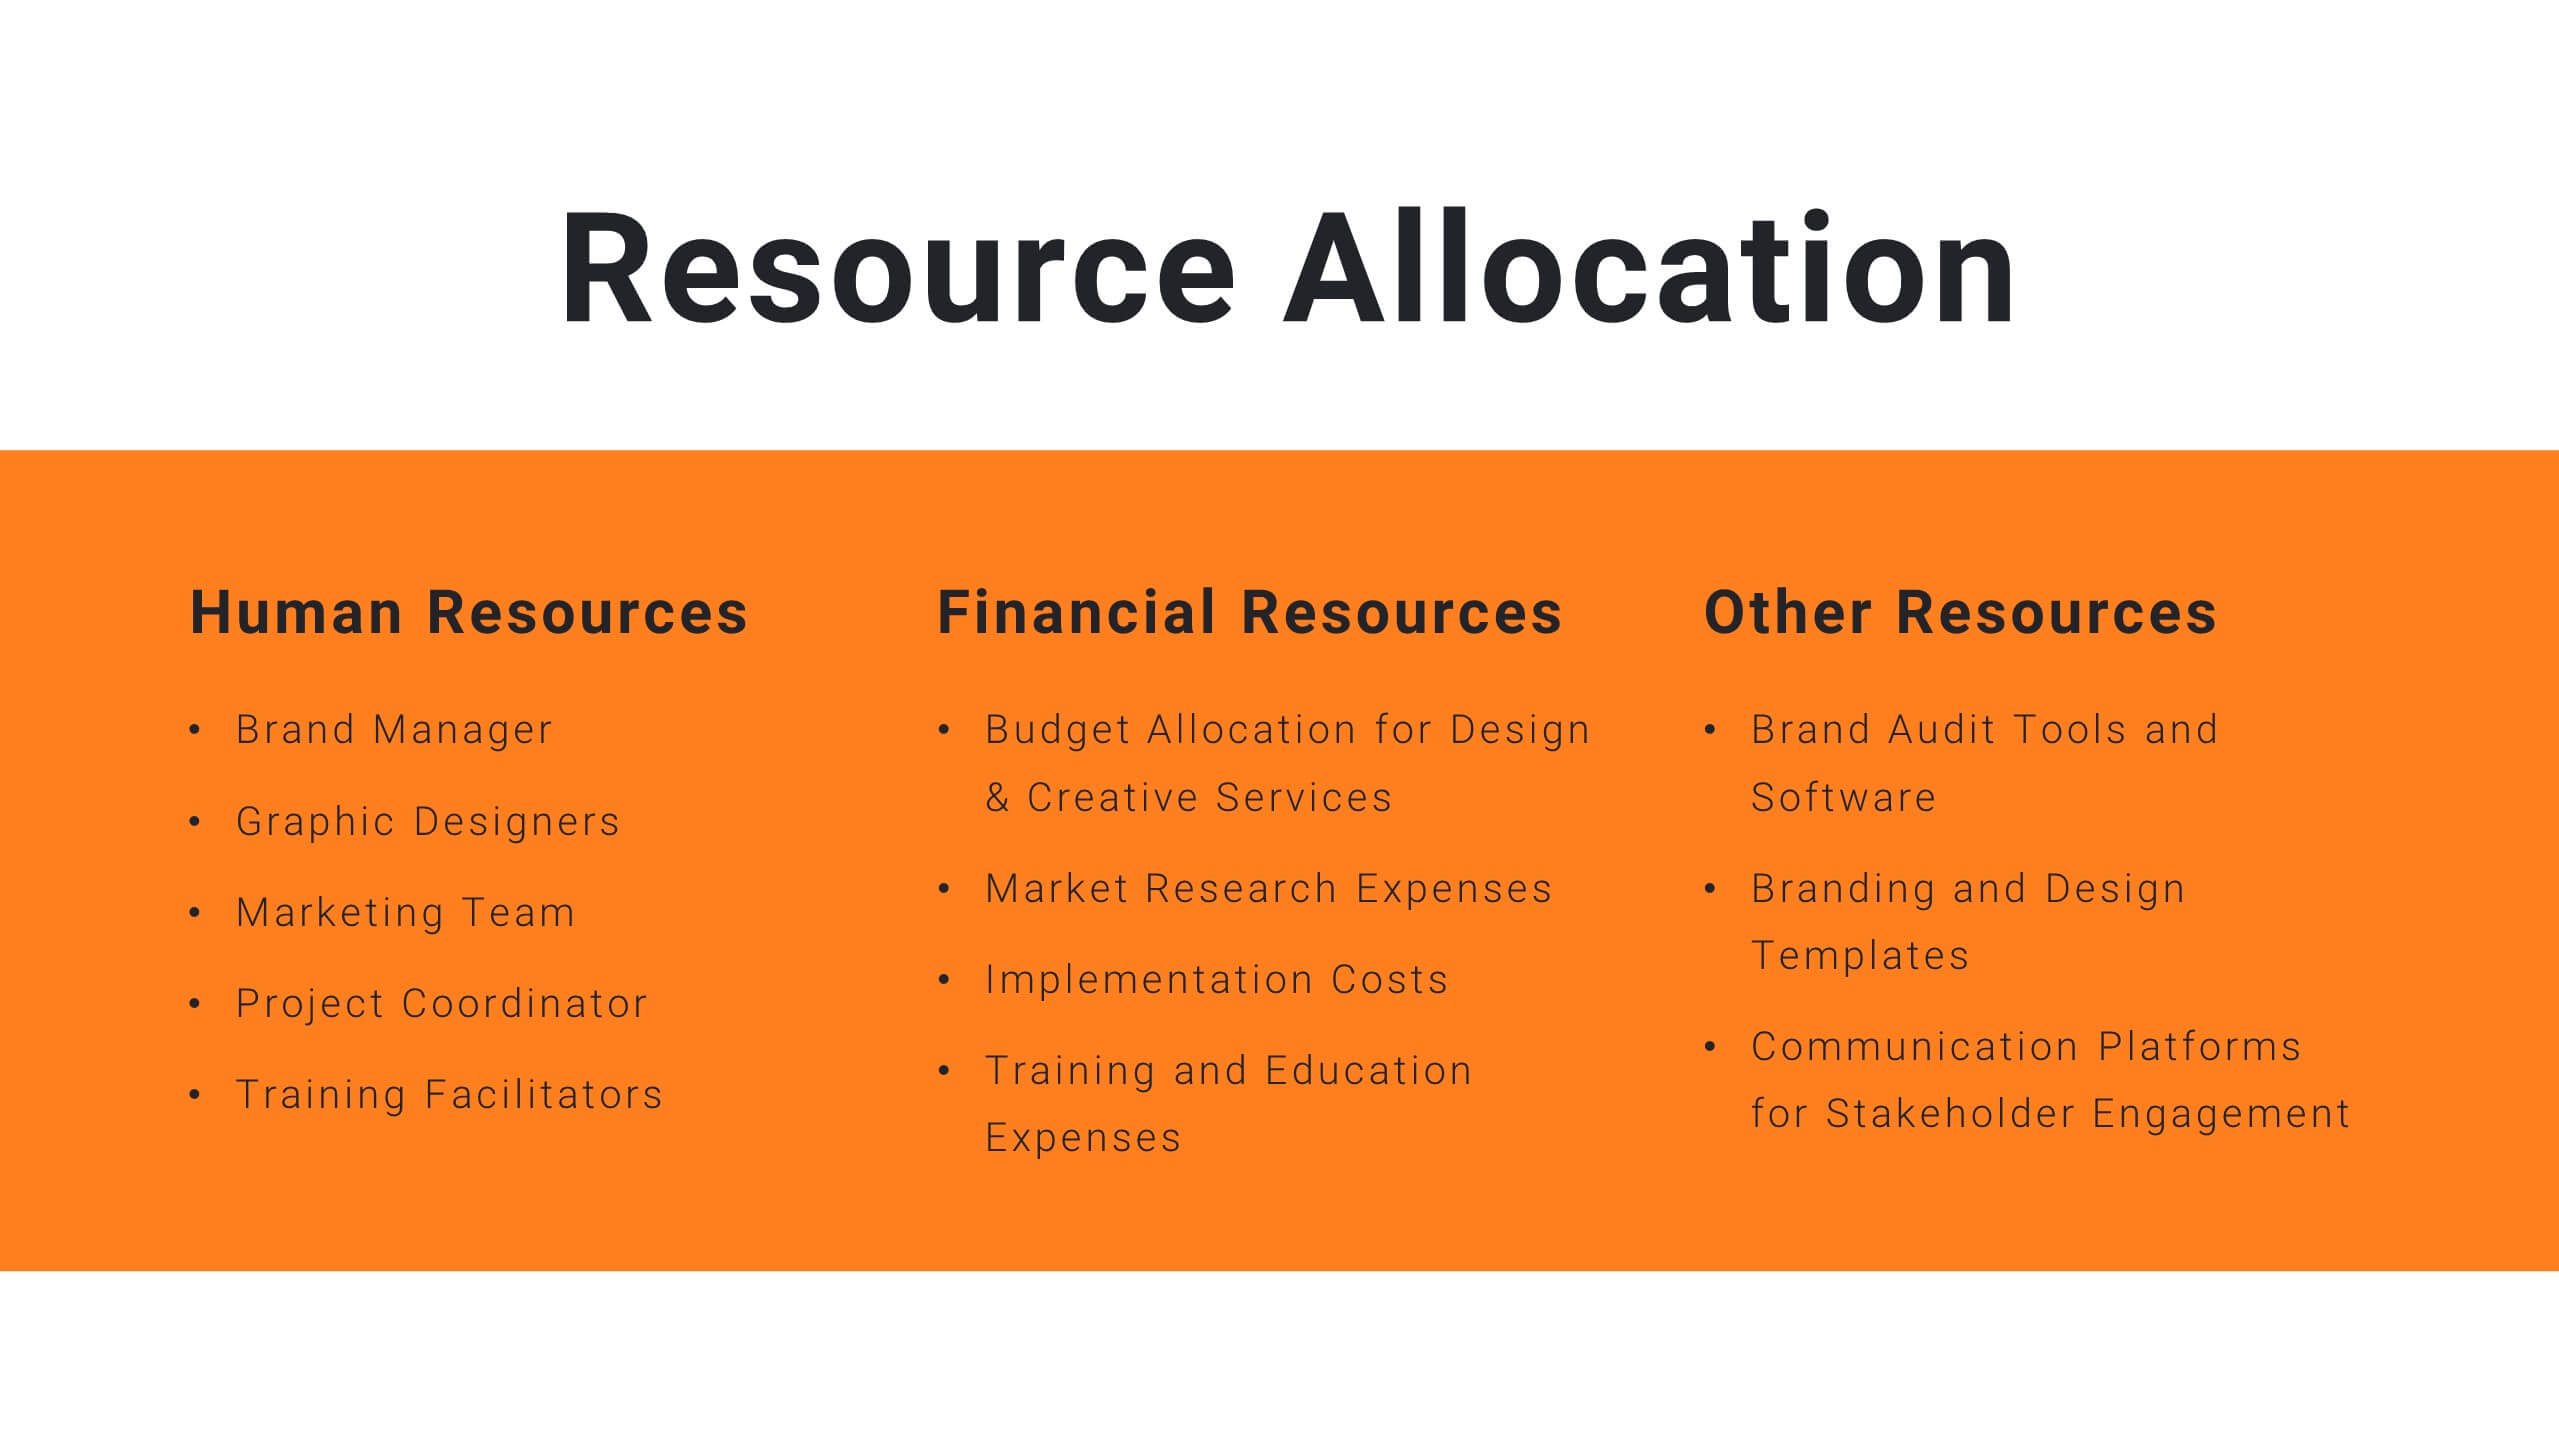
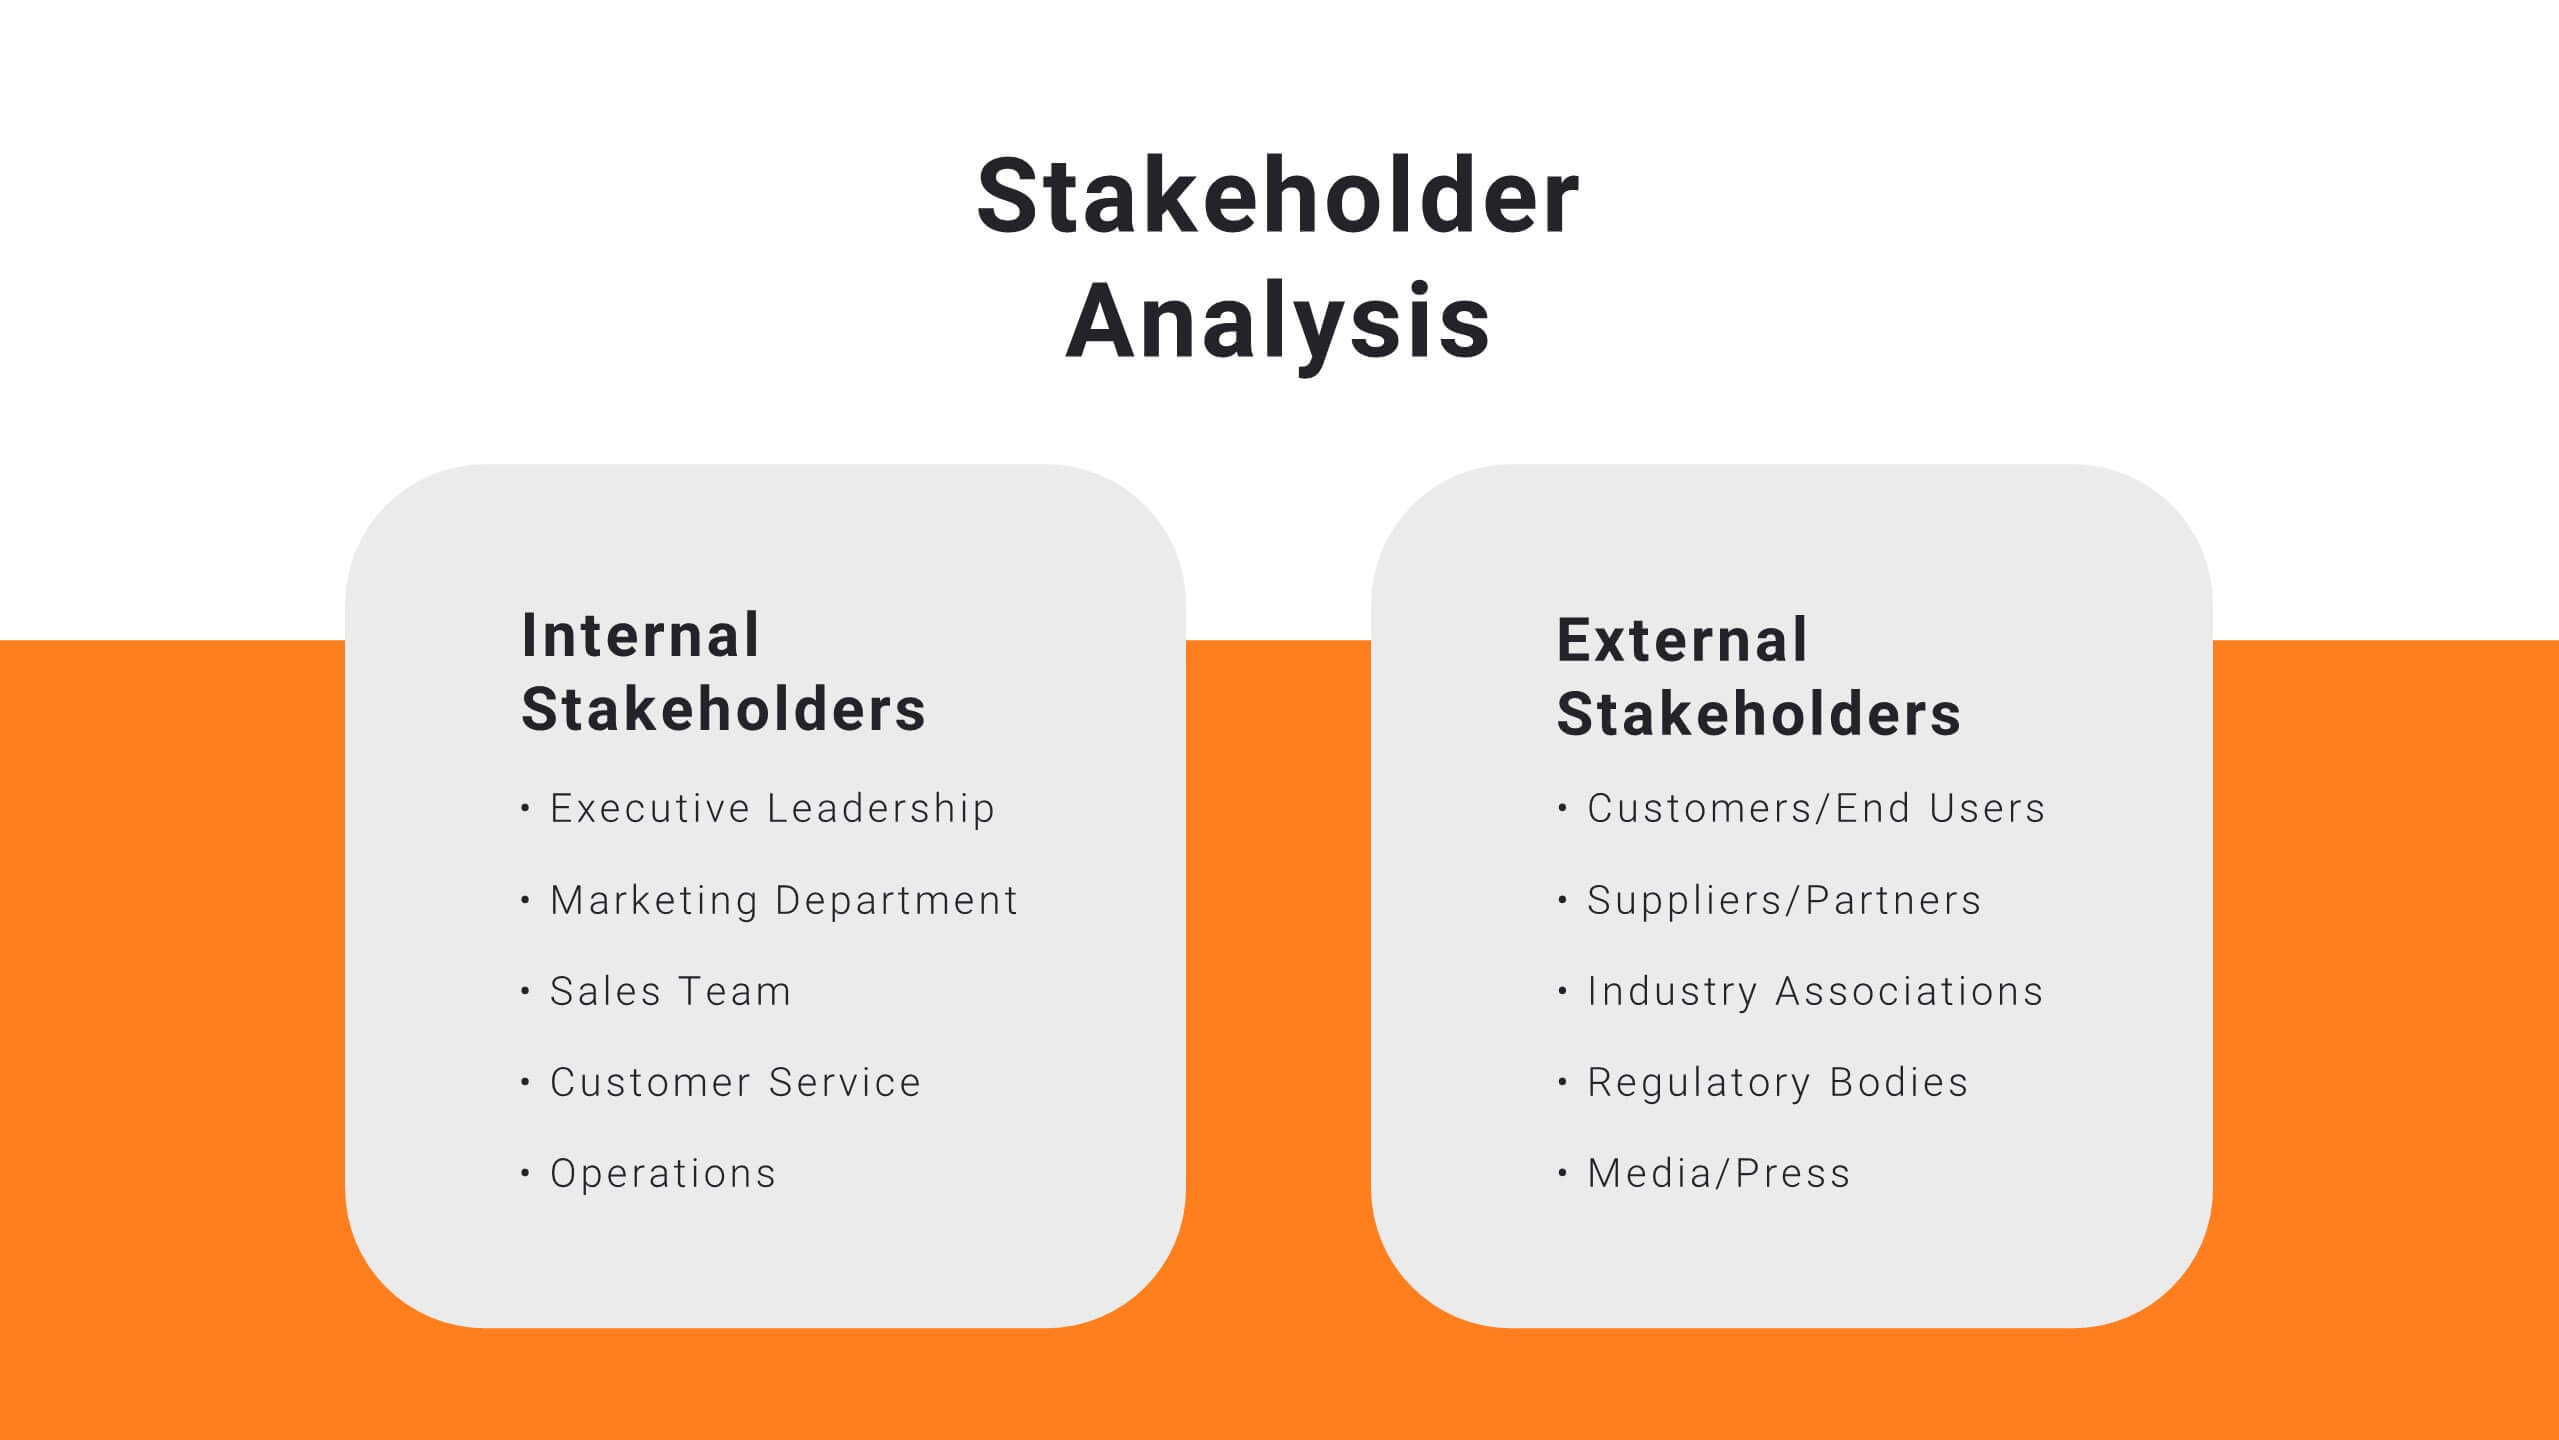
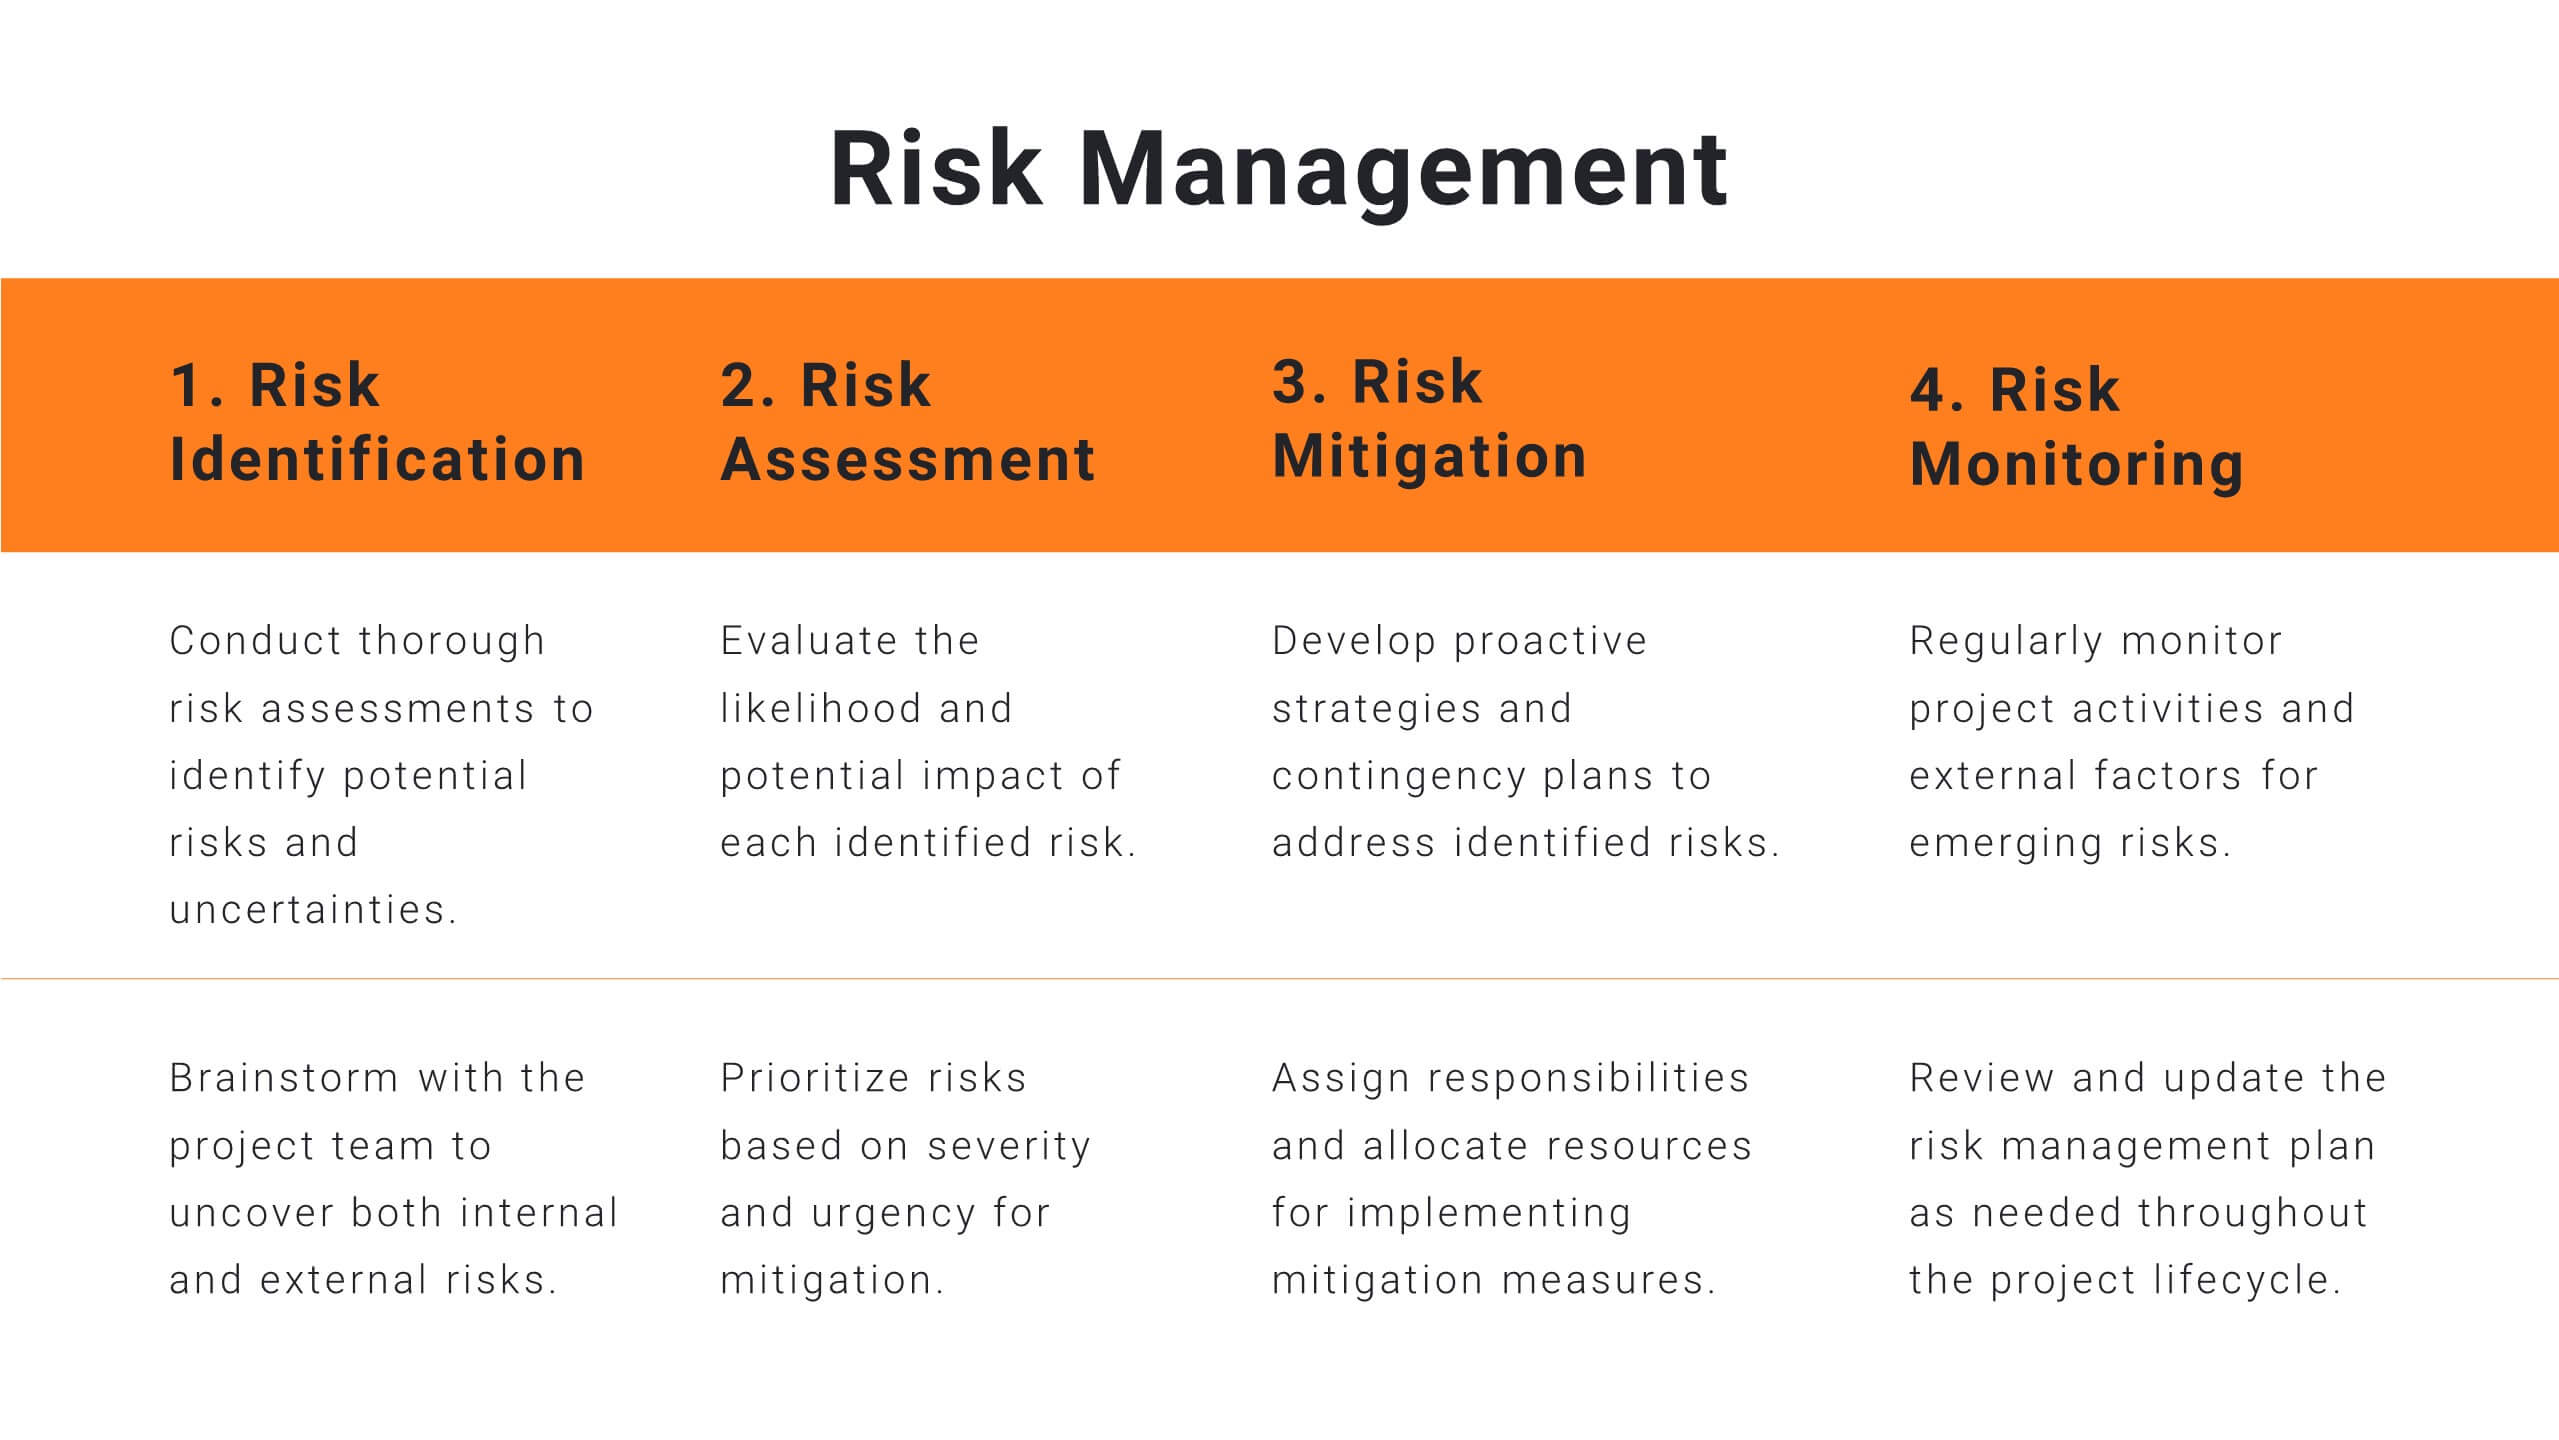
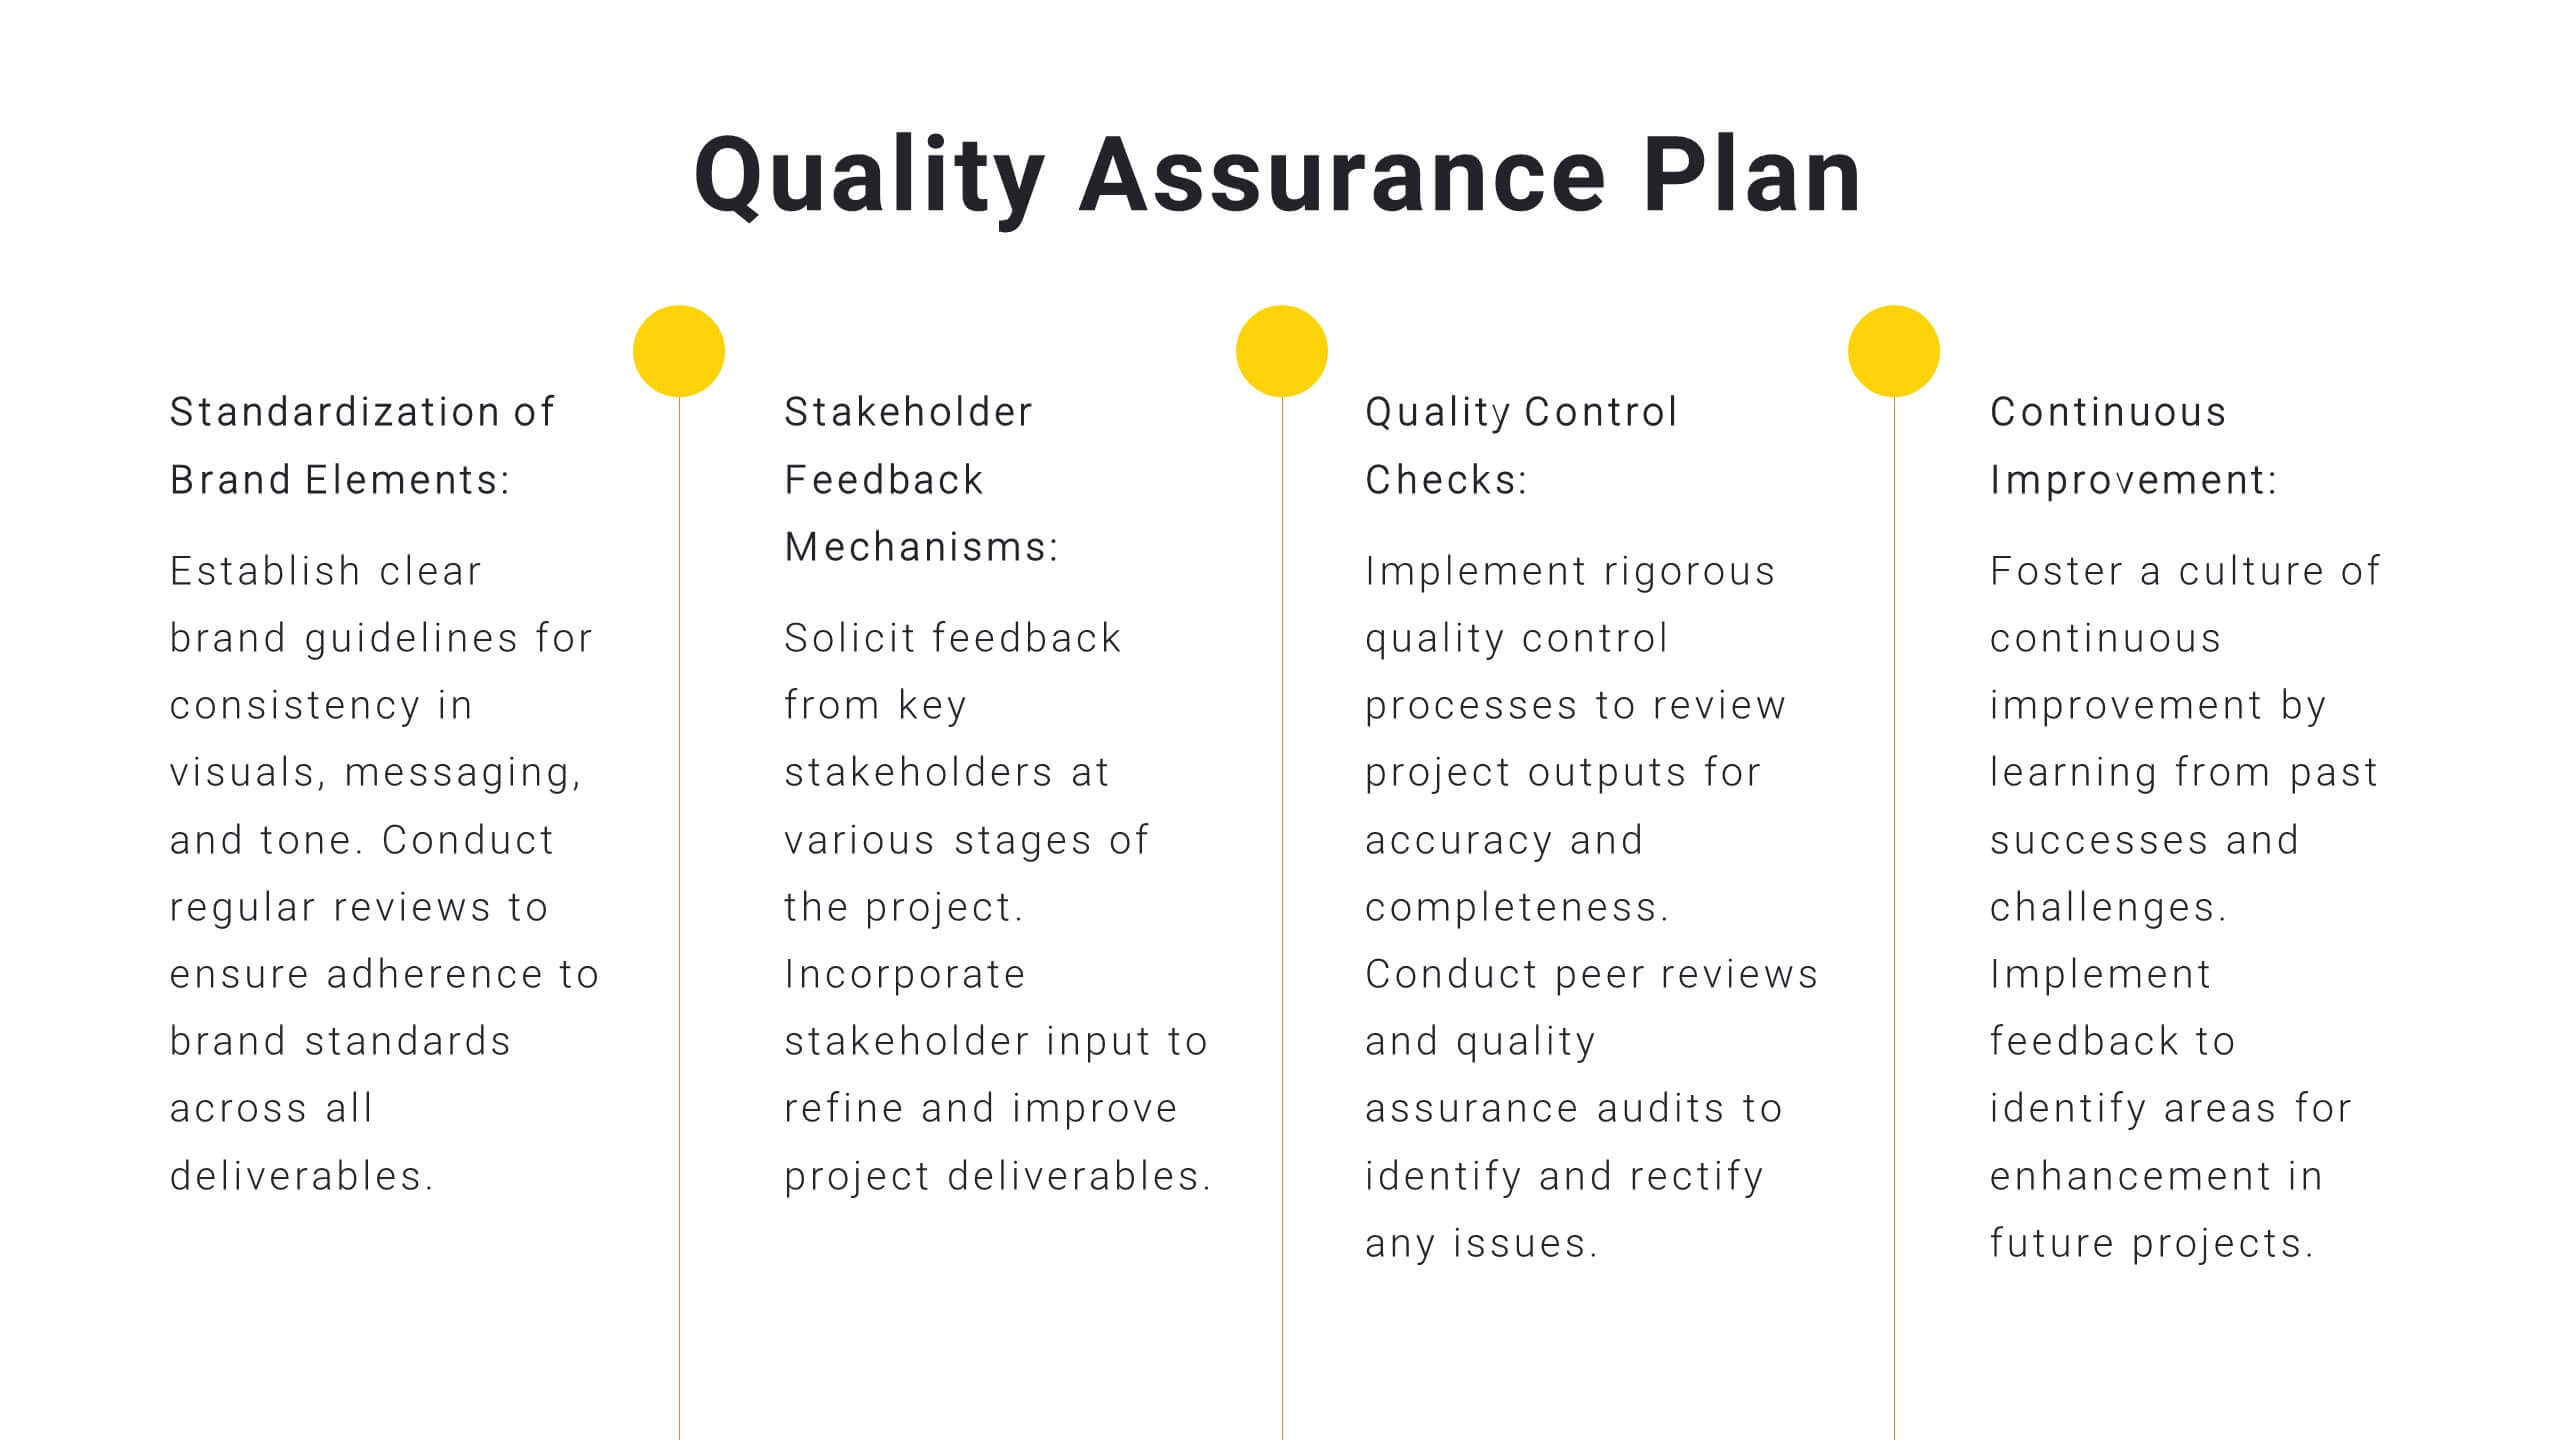
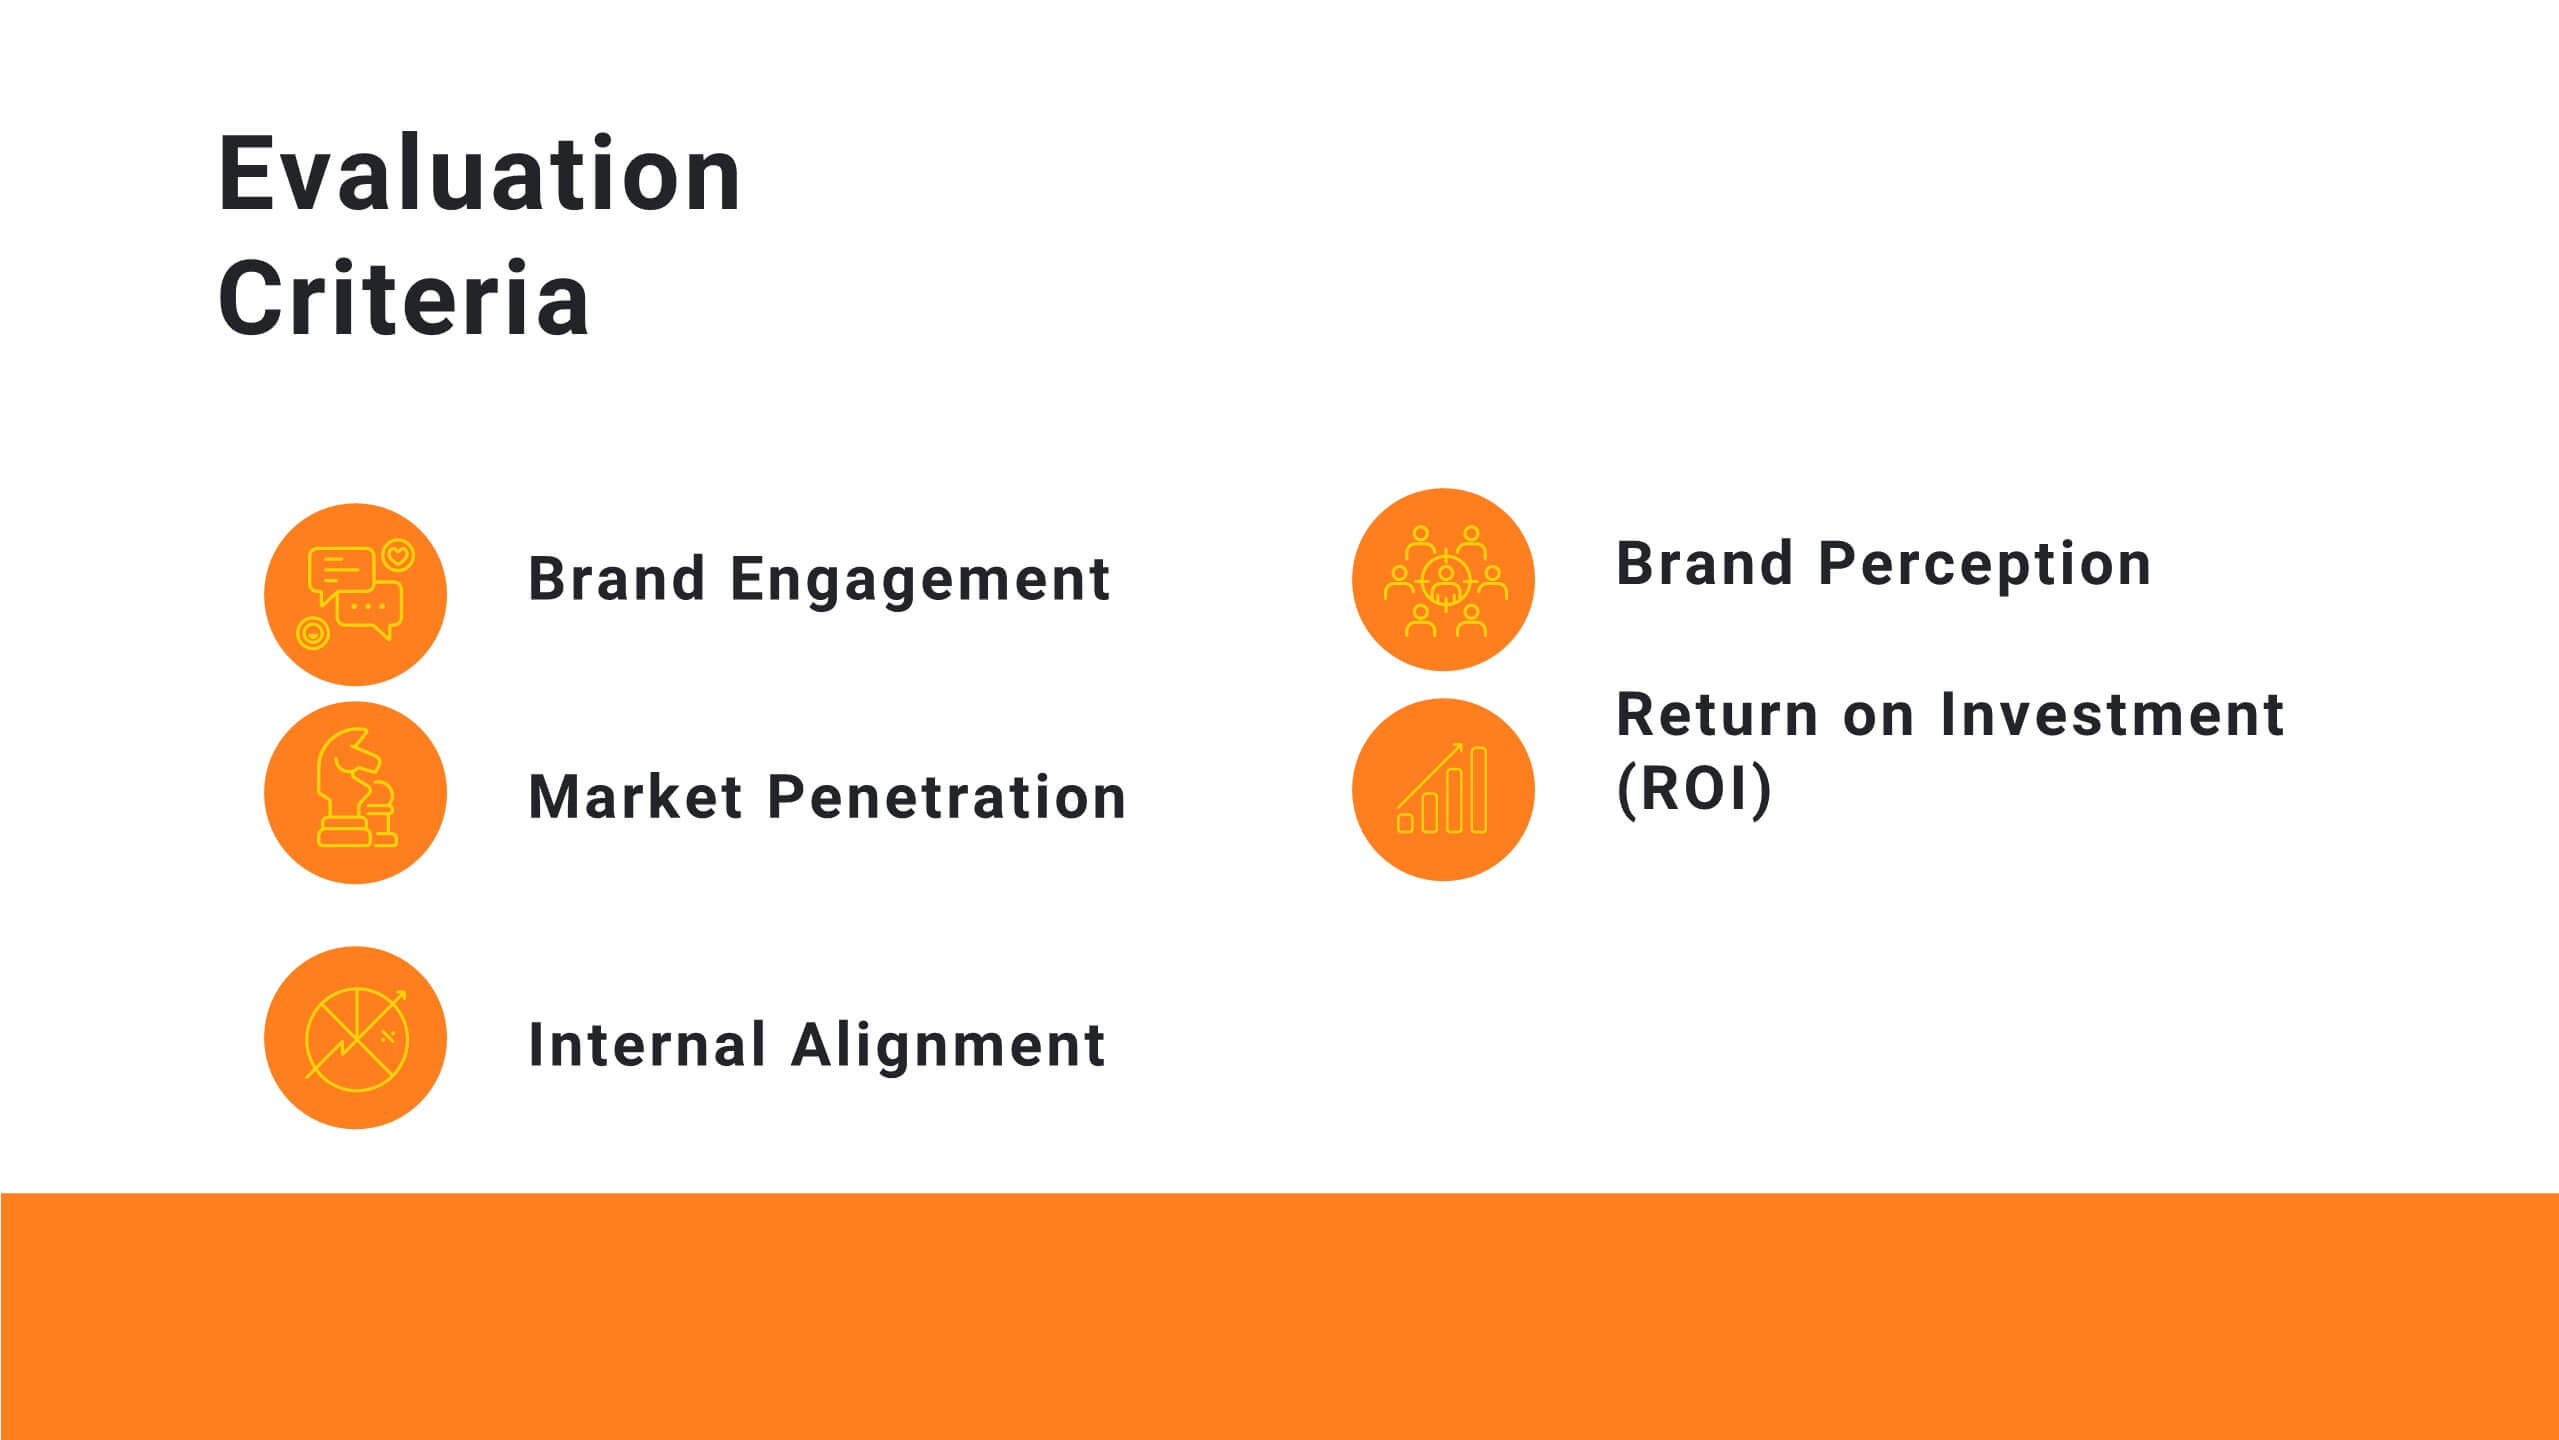
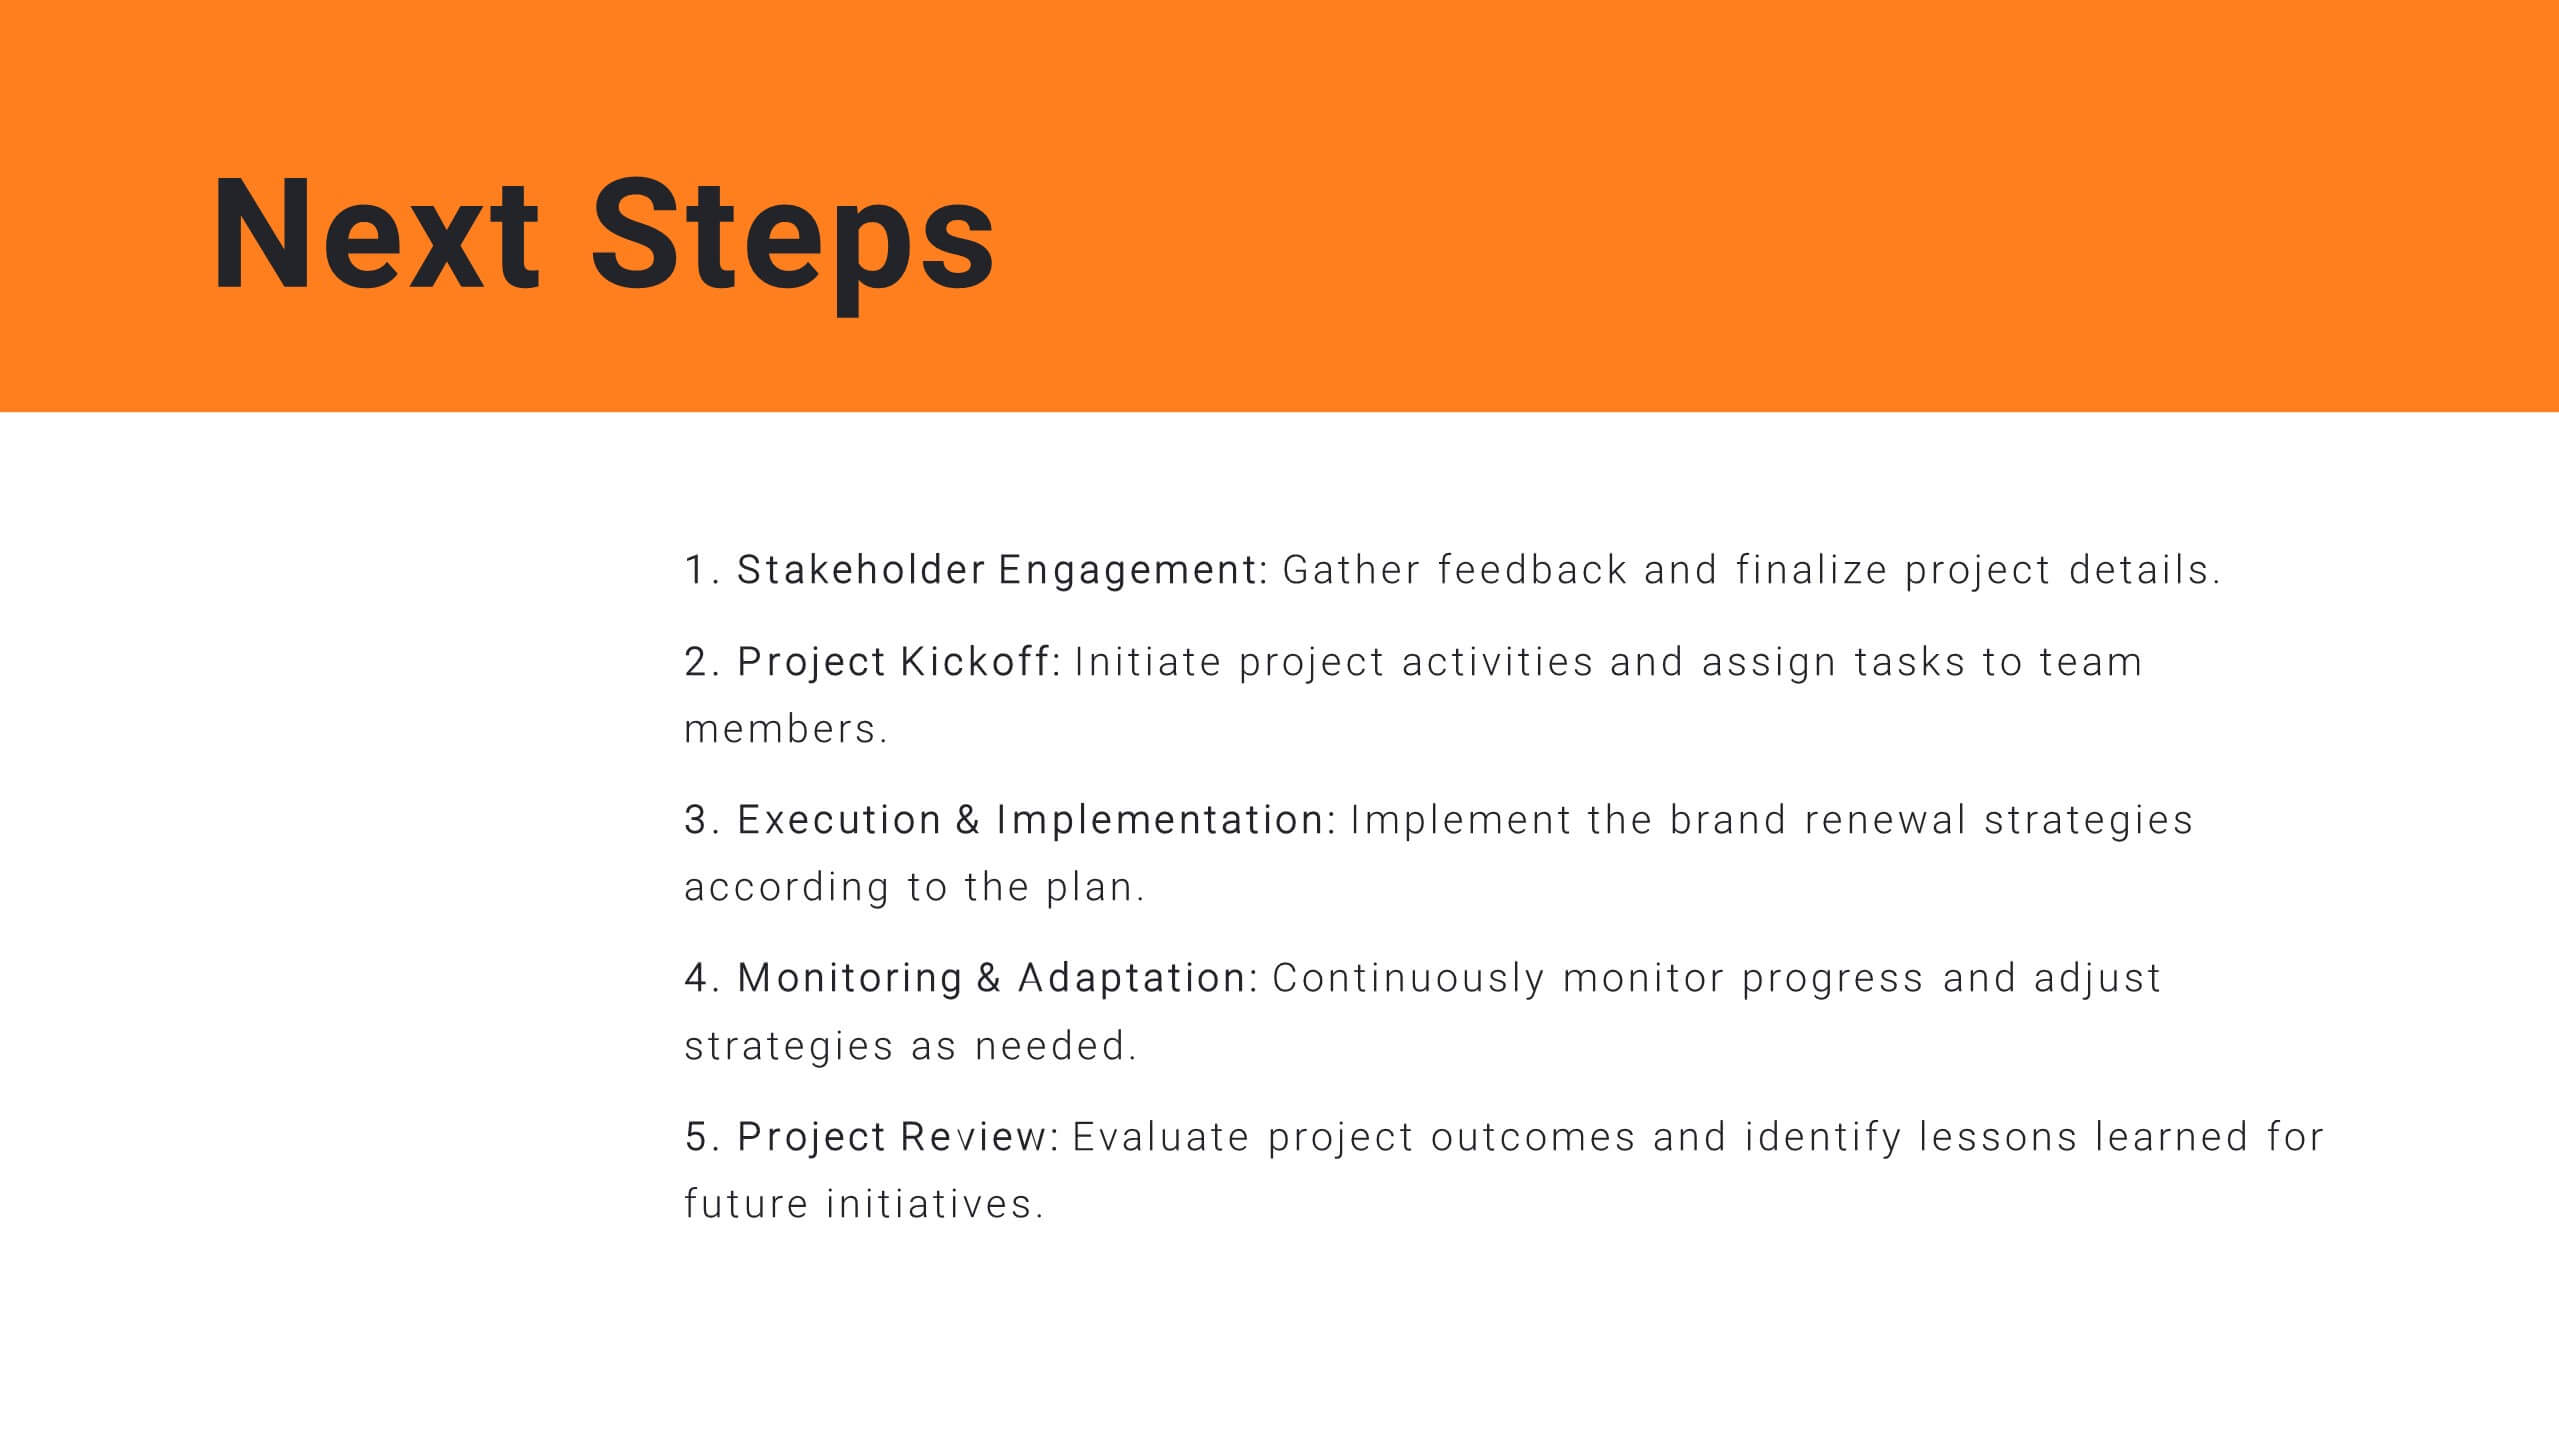
Harmony Project Management Plan Presentation
Plan your project efficiently with this comprehensive project management plan template! It covers all essential aspects including timeline, budget, resource allocation, and risk management. Ensure smooth project execution and achieve your objectives. Compatible with PowerPoint, Keynote, and Google Slides, it's designed to streamline your project planning and management process.

22 slides
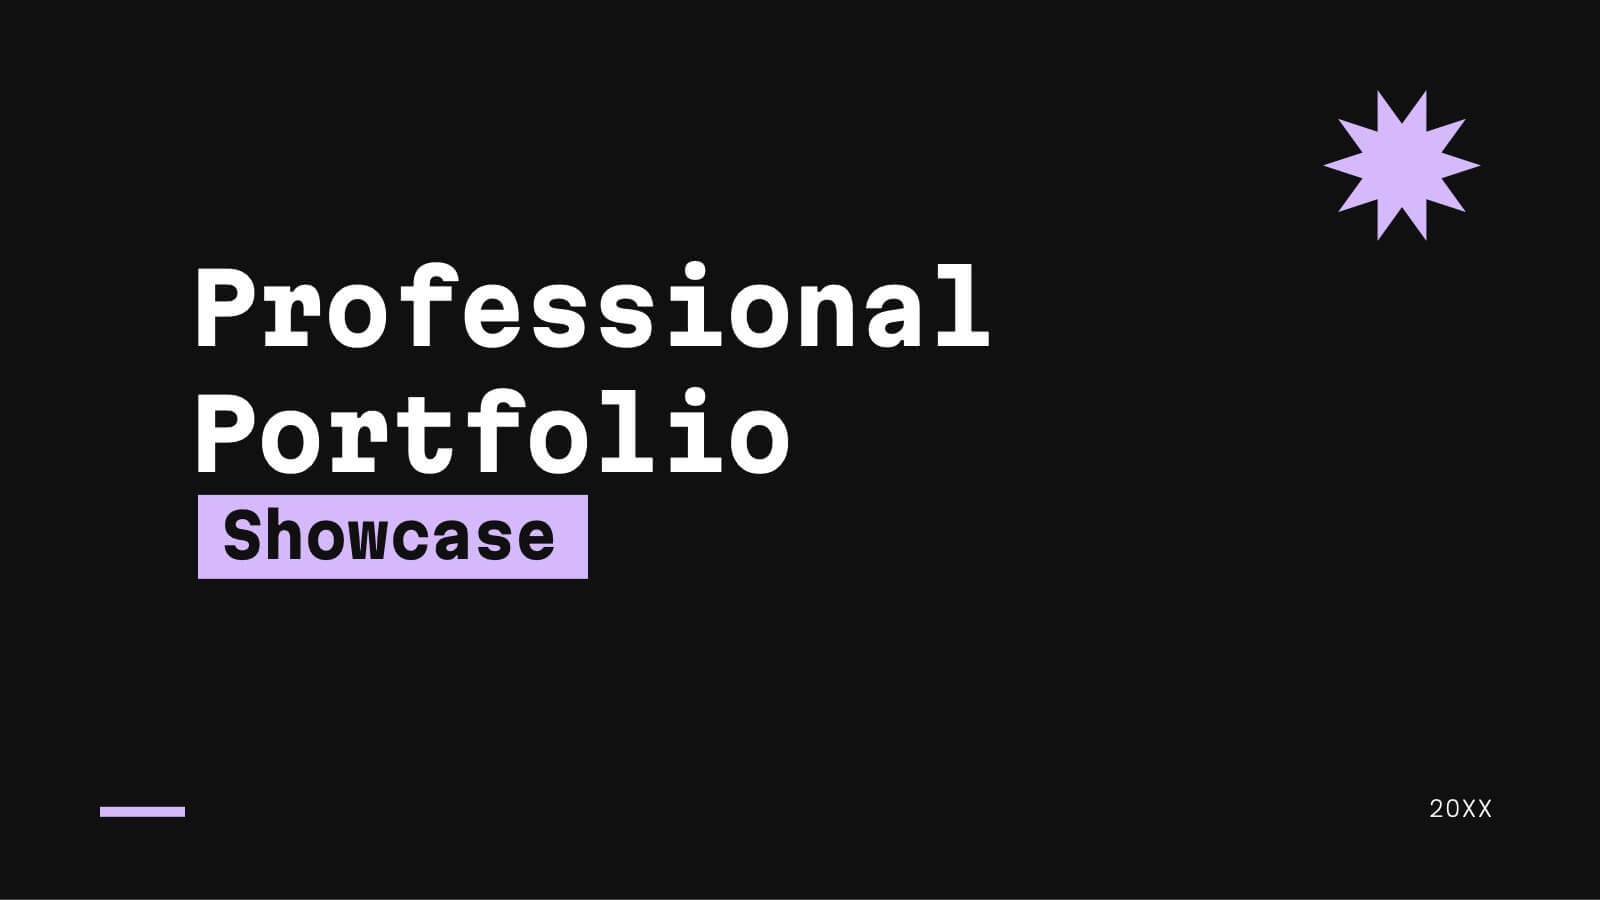
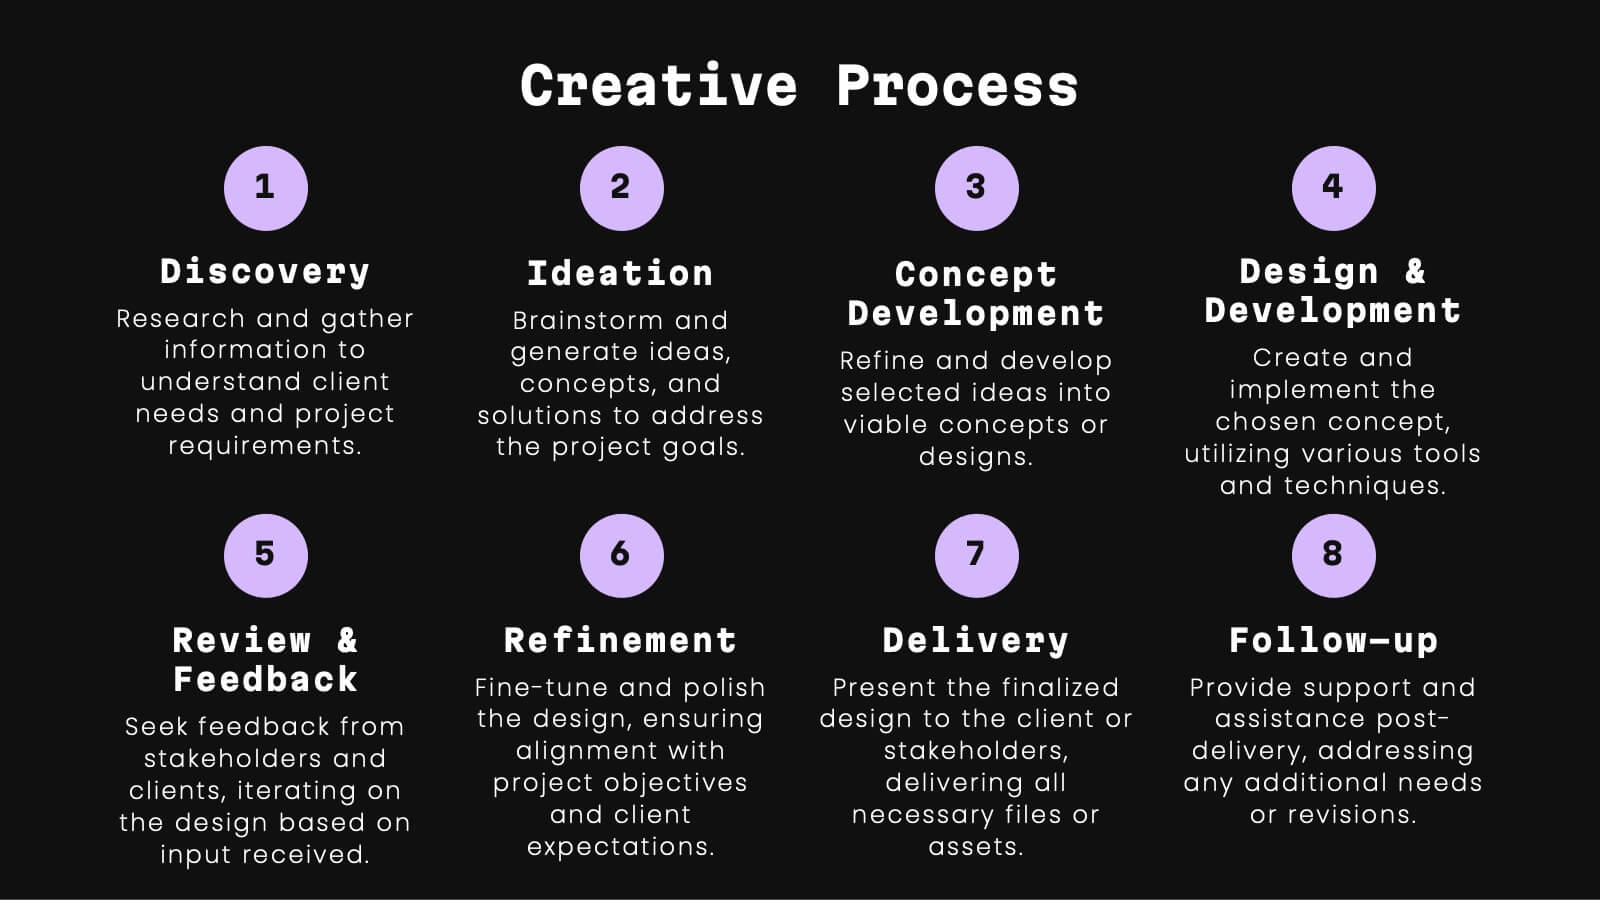
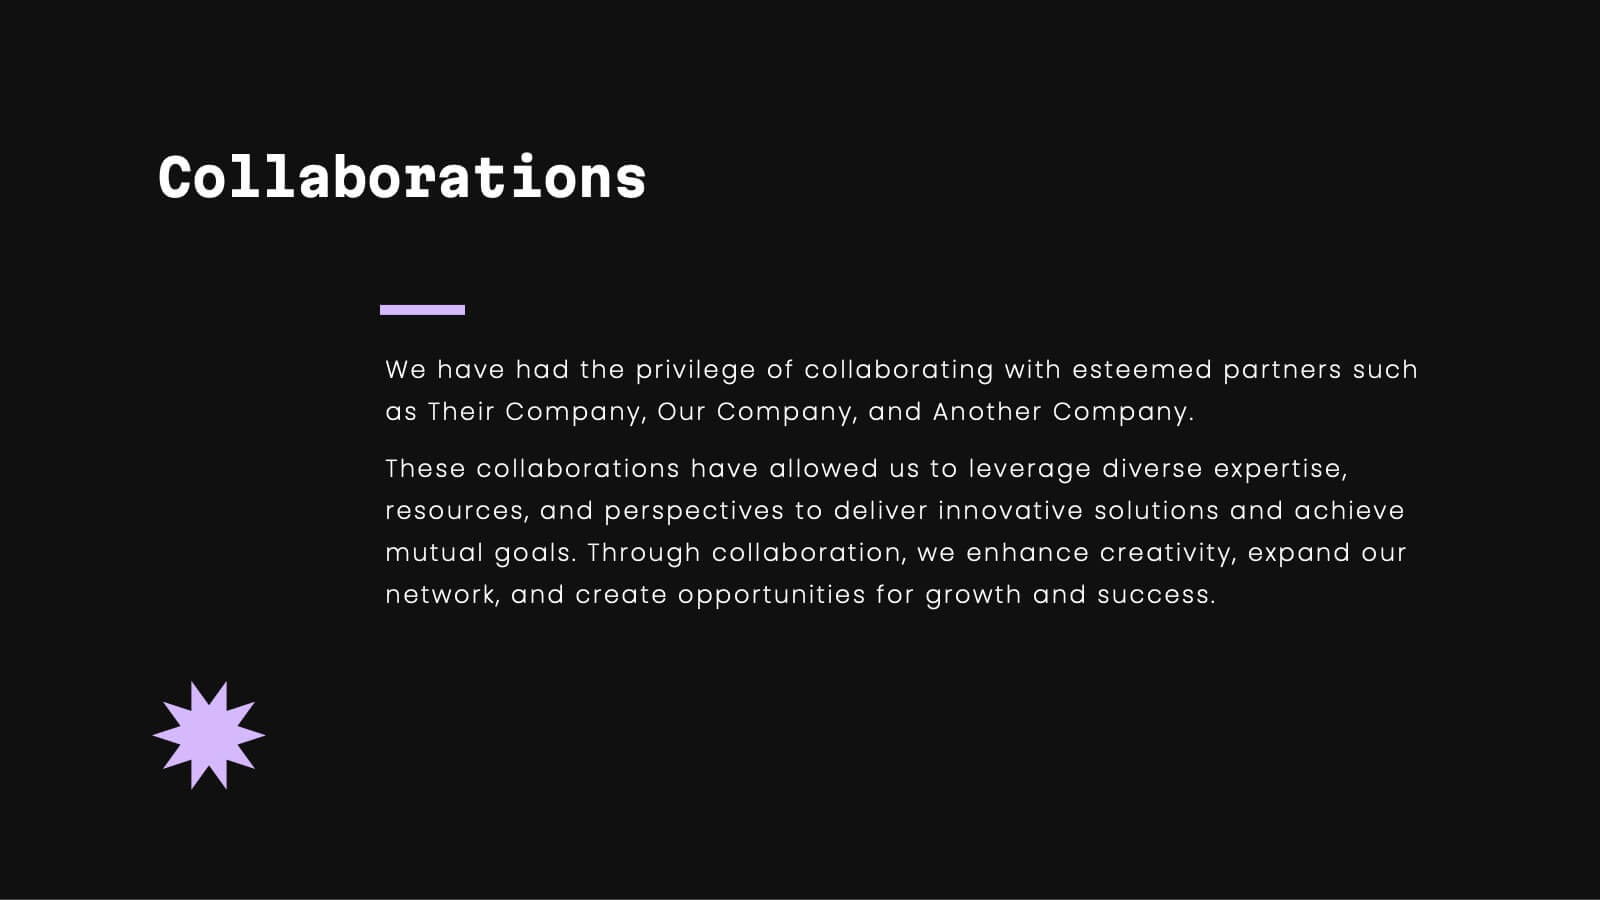
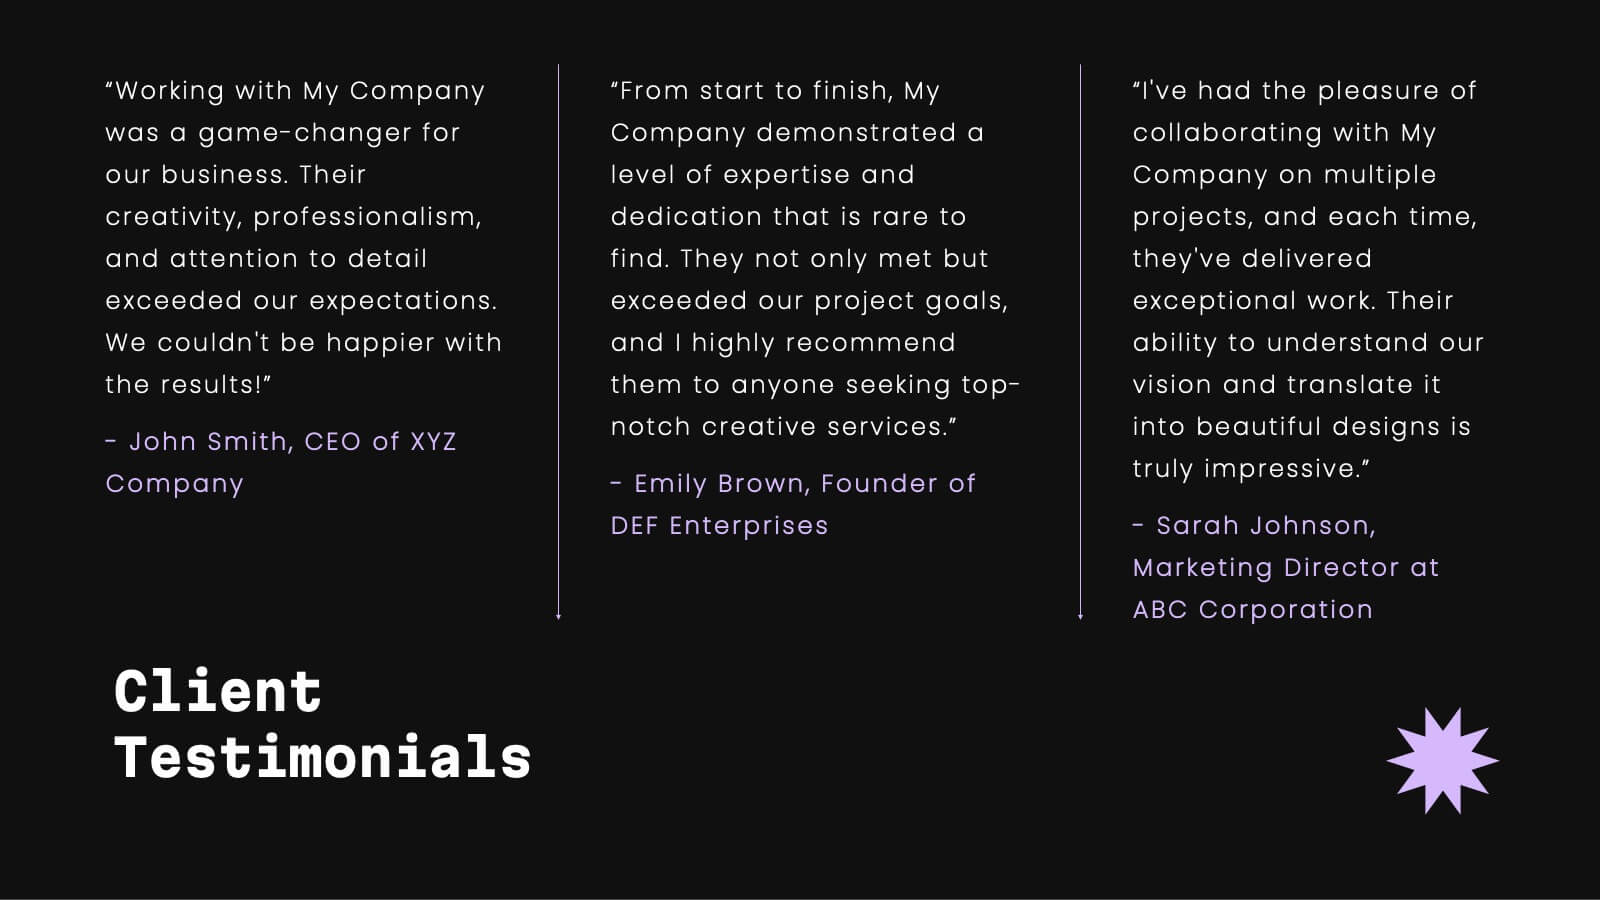
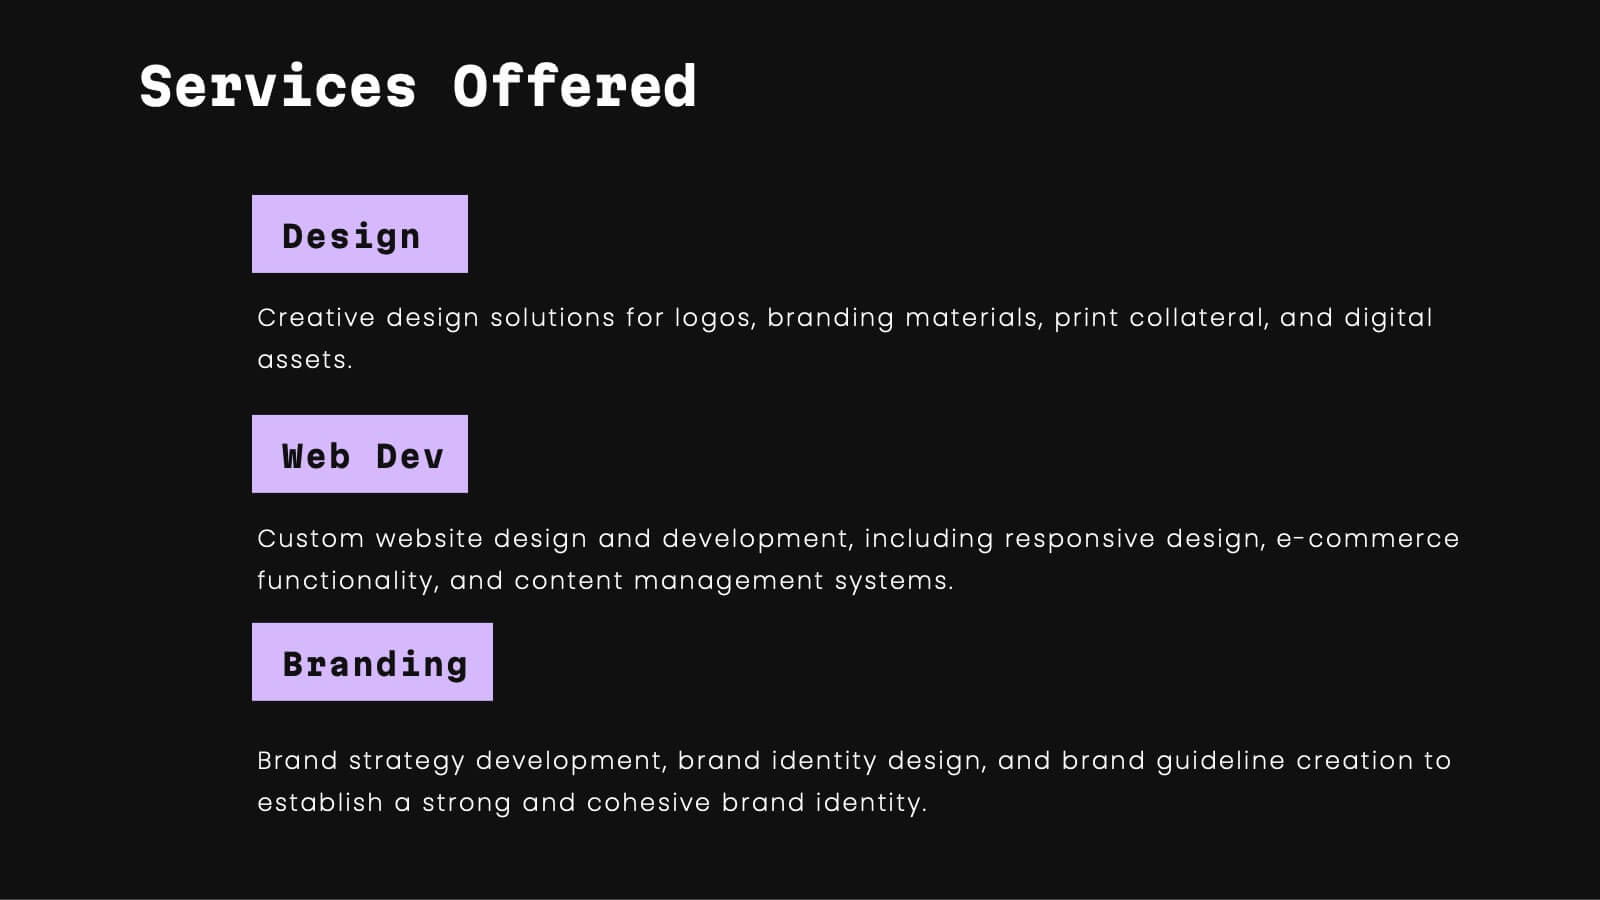
Celeste Professional Portfolio Showcase Presentation
Impress with style using this sophisticated portfolio presentation template. Perfect for showcasing featured projects, creative processes, and client testimonials, this template enhances the visual appeal of your work. Its modern, dark-themed design ensures your content stands out, making a lasting impression. Compatible with PowerPoint, Keynote, and Google Slides, it's versatile for any platform.


5 slides
Business Project Status Review Presentation
Present your team's progress with clarity using this hexagon-icon based project review layout. Designed for status updates, this slide includes four visually distinct sections with toggle-style indicators for highlighting progress, milestones, or tasks. Ideal for project managers, corporate teams, or consultants. Fully editable in PowerPoint, Keynote, and Google Slides.


6 slides
Quality Control Six Sigma Process Presentation
Bring clarity and energy to your workflow with this clean visual guide that outlines each phase of a structured improvement cycle. It helps communicate steps, responsibilities, and progress in a polished, professional way your audience can follow instantly. Fully compatible with PowerPoint, Keynote, and Google Slides.


4 slides
Remote Team Management Slides Presentation
Bring virtual teamwork into focus with a clean, collaborative design that makes managing distributed teams feel effortless. This presentation breaks down communication, coordination, and workflow strategies to help leaders guide remote groups with clarity and structure. Fully customizable and compatible with PowerPoint, Keynote, and Google Slides.