


Features
- 20 Unique slides
- Fully editable and easy to edit in Microsoft Powerpoint, Keynote and Google Slides
- 16:9 widescreen layout
- Clean and professional designs
- Export to JPG, PDF or send by email


Do you have any questions?
Recommend


6 slides
Organizational Change Management Strategy Presentation
Navigate organizational change effectively with this dynamic and structured presentation slide. Featuring a puzzle-piece design, this template visually represents the interconnected steps of change management. Ideal for business leaders, HR professionals, and consultants, it helps illustrate transition processes, strategic adjustments, and team alignment. Fully editable, allowing you to customize text, colors, and layout to fit your business needs. Compatible with PowerPoint, Keynote, and Google Slides for effortless use.


5 slides
Corporate Networking Structure Diagram Presentation
Showcase your internal collaboration and stakeholder relationships with this Corporate Networking Structure Diagram. Designed to visualize team interactions, departmental roles, and key connections, this template is perfect for corporate overviews or internal strategy meetings. Fully editable in PowerPoint, Keynote, and Google Slides for seamless integration into your business presentations.


21 slides
Sonata Product Roadmap Presentation
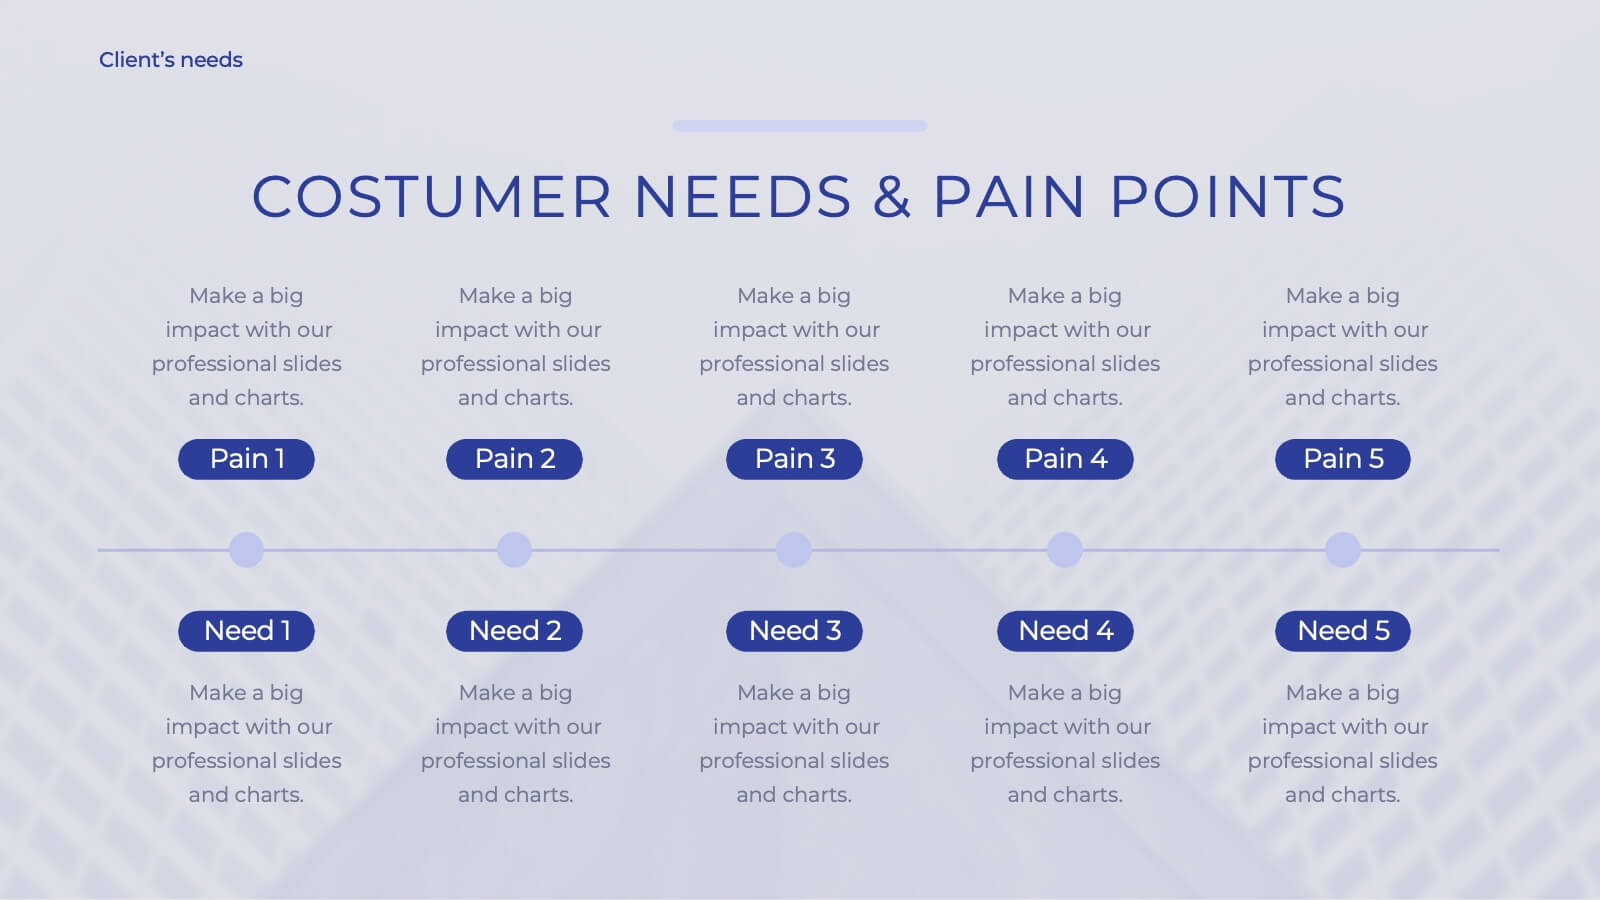
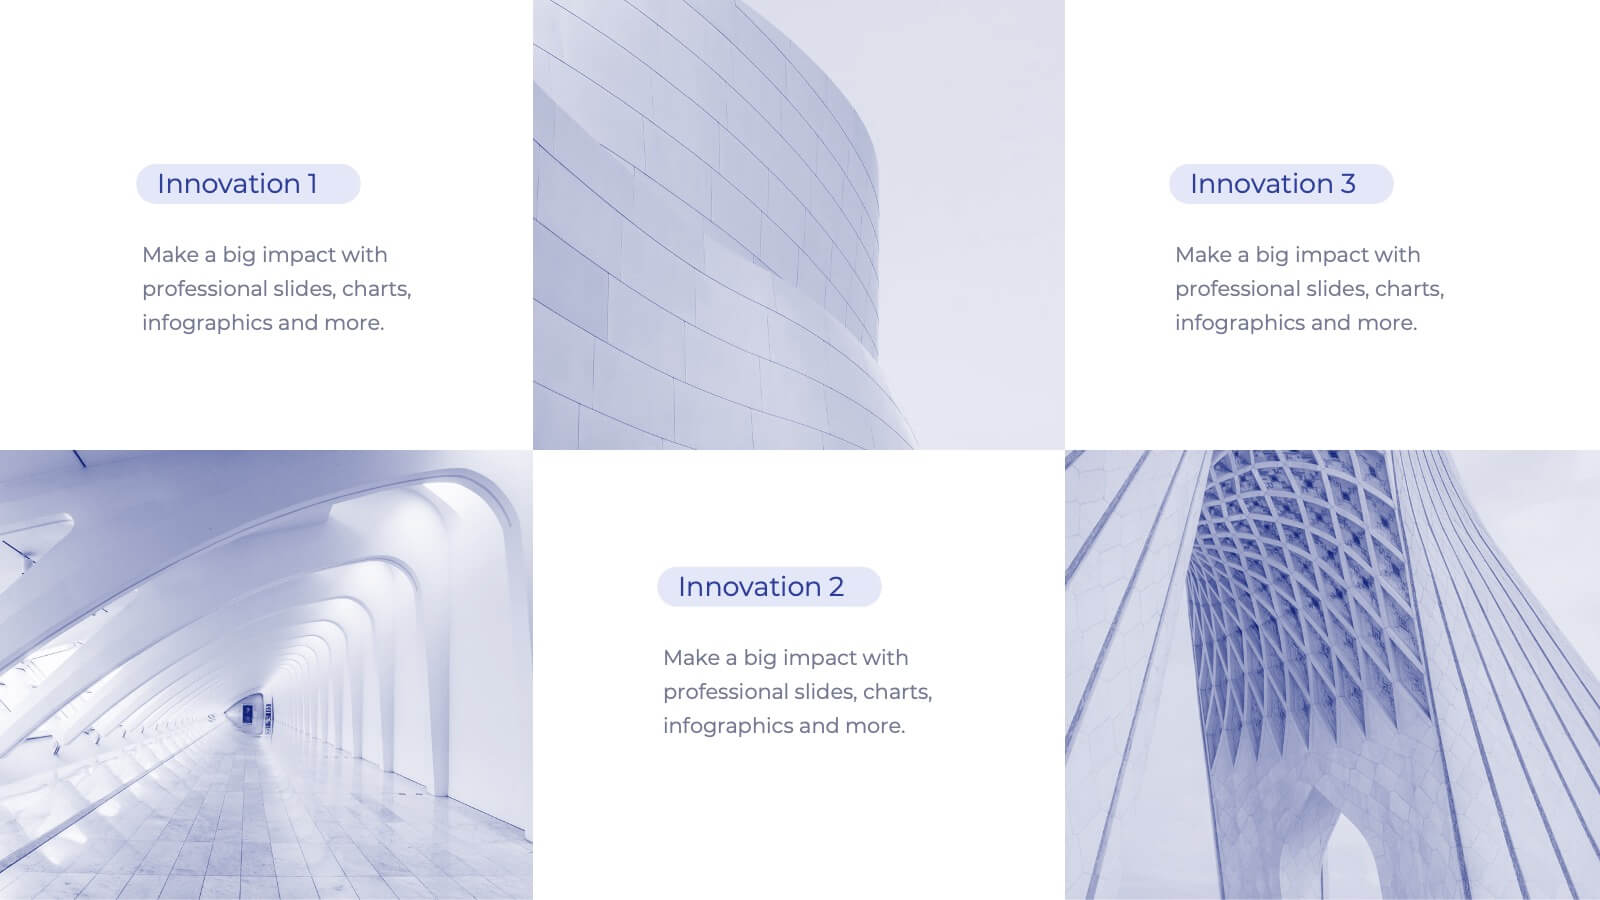
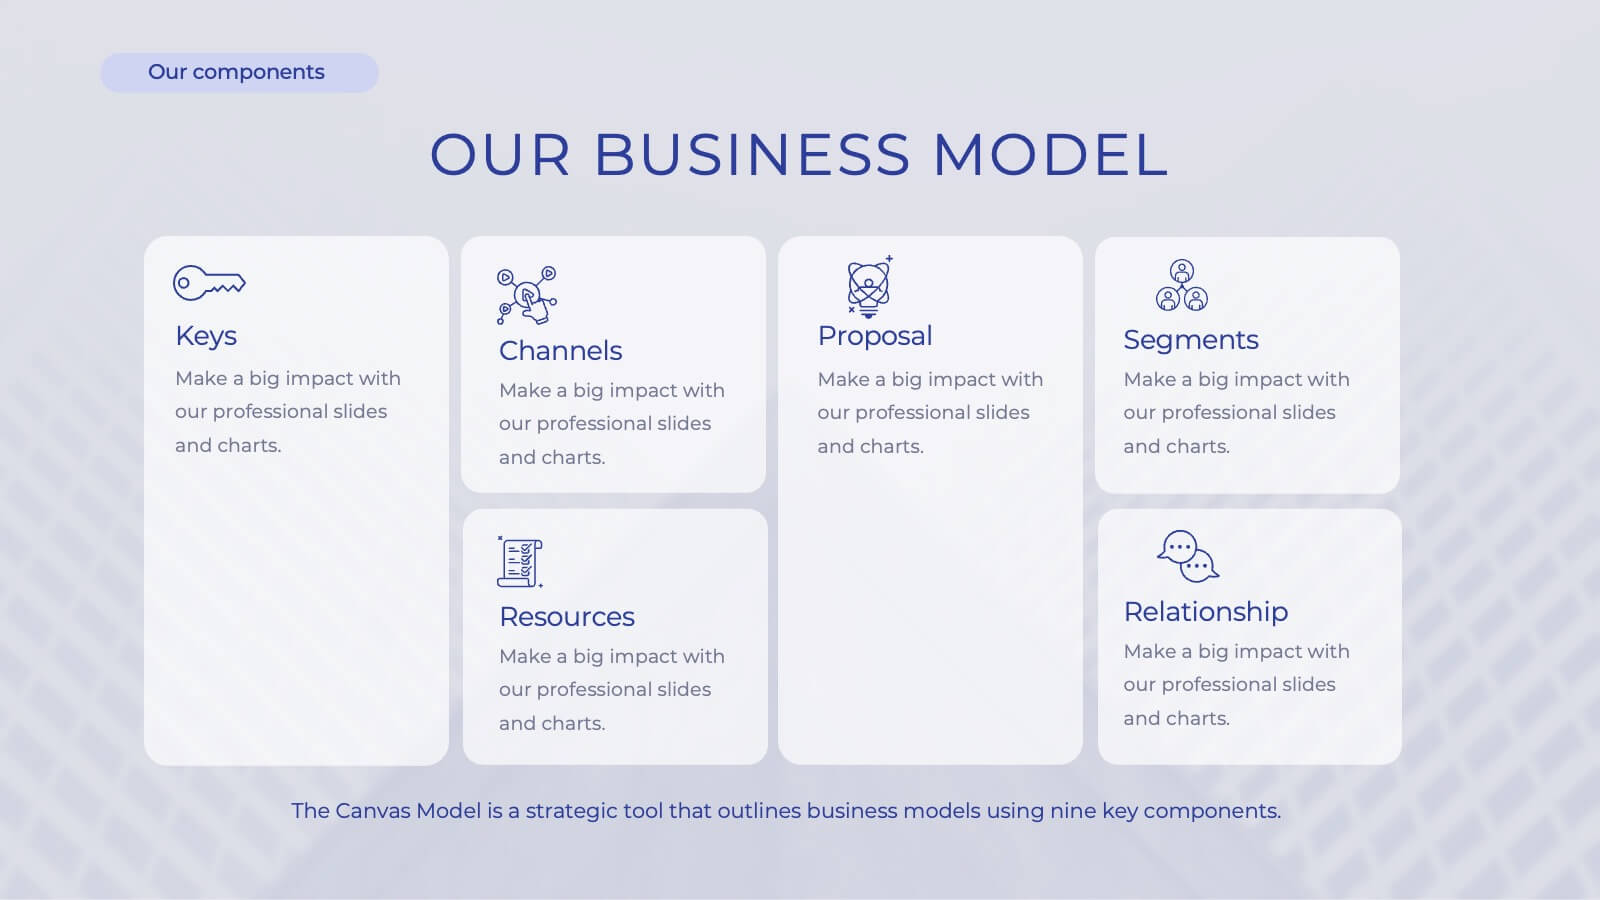
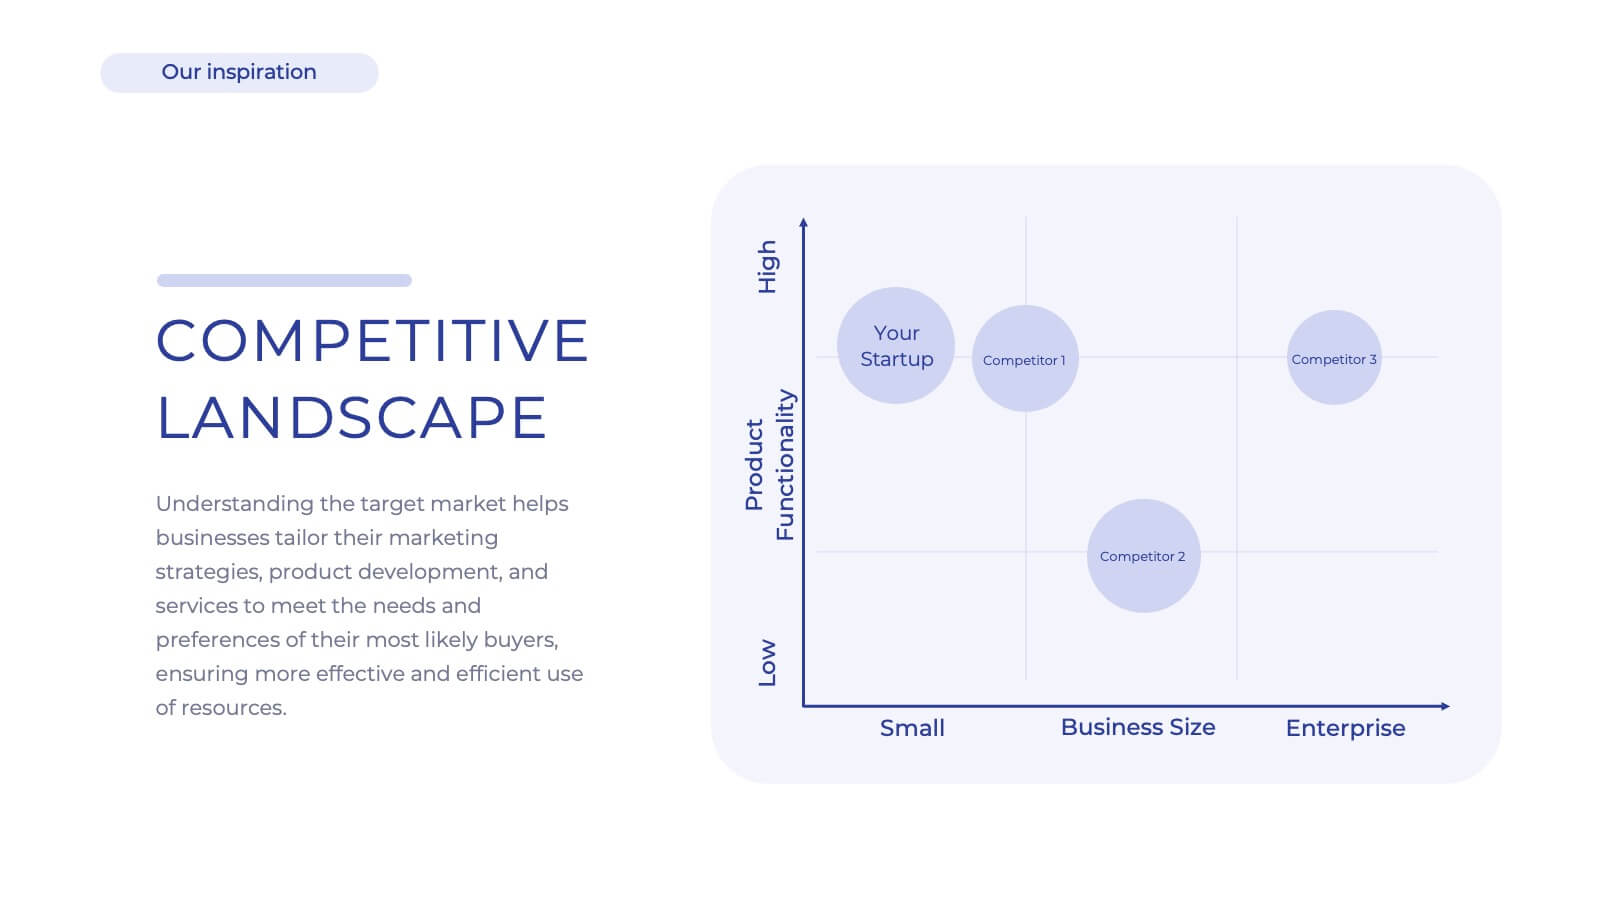
Navigate the future of your product with a structured and compelling roadmap presentation template. Designed for product managers, entrepreneurs, and teams, this layout provides a clear framework to outline product goals, strategies, and timelines effectively. The template includes sections for product overviews, customer pain points, unique value propositions, competitive analysis, pricing strategies, and user experience mapping. It also features slides for stakeholder communication, marketing rollouts, and technical specifications to ensure every aspect of your product journey is covered. Fully compatible with PowerPoint, Google Slides, and Keynote, this template is easy to customize with your brand’s colors, fonts, and visuals. Present your product's roadmap confidently, engaging stakeholders and aligning your team towards success.


20 slides
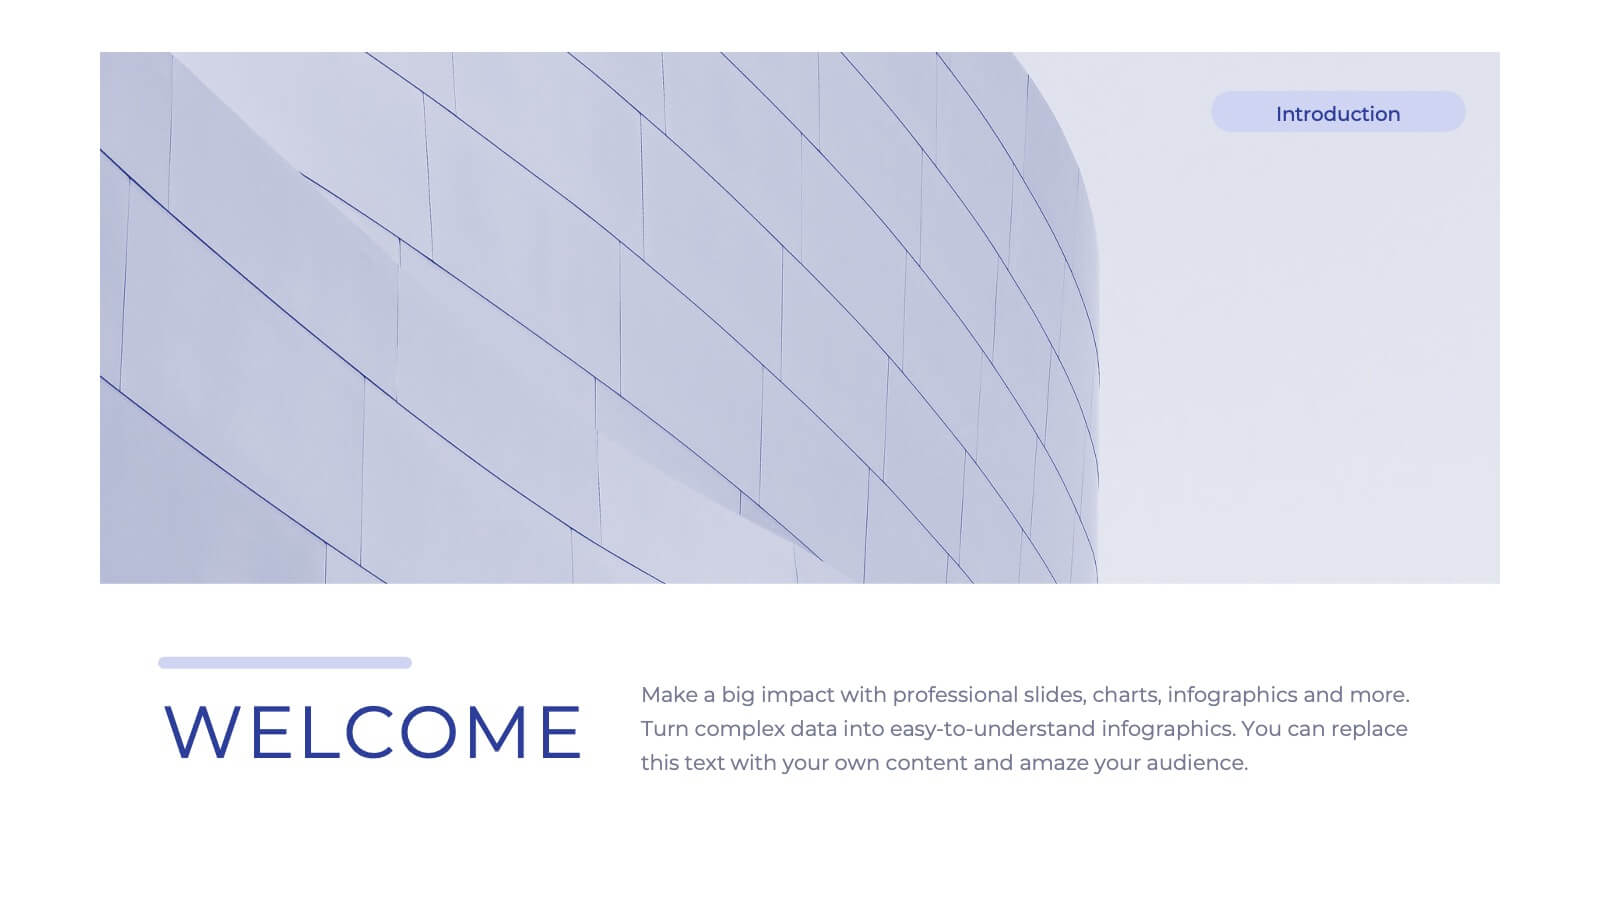
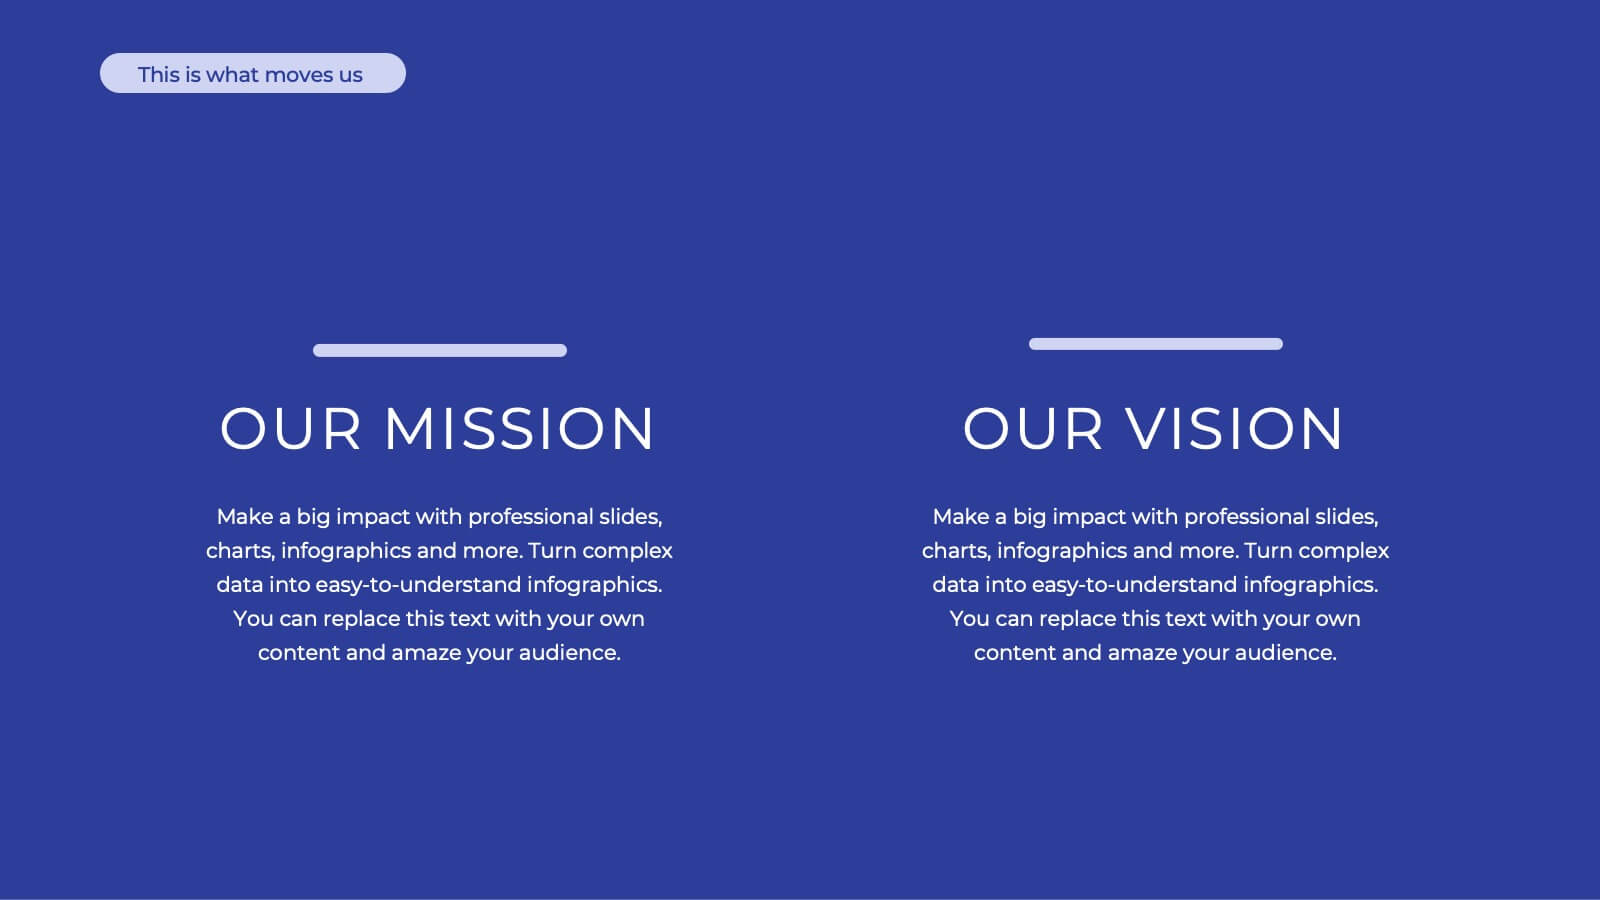
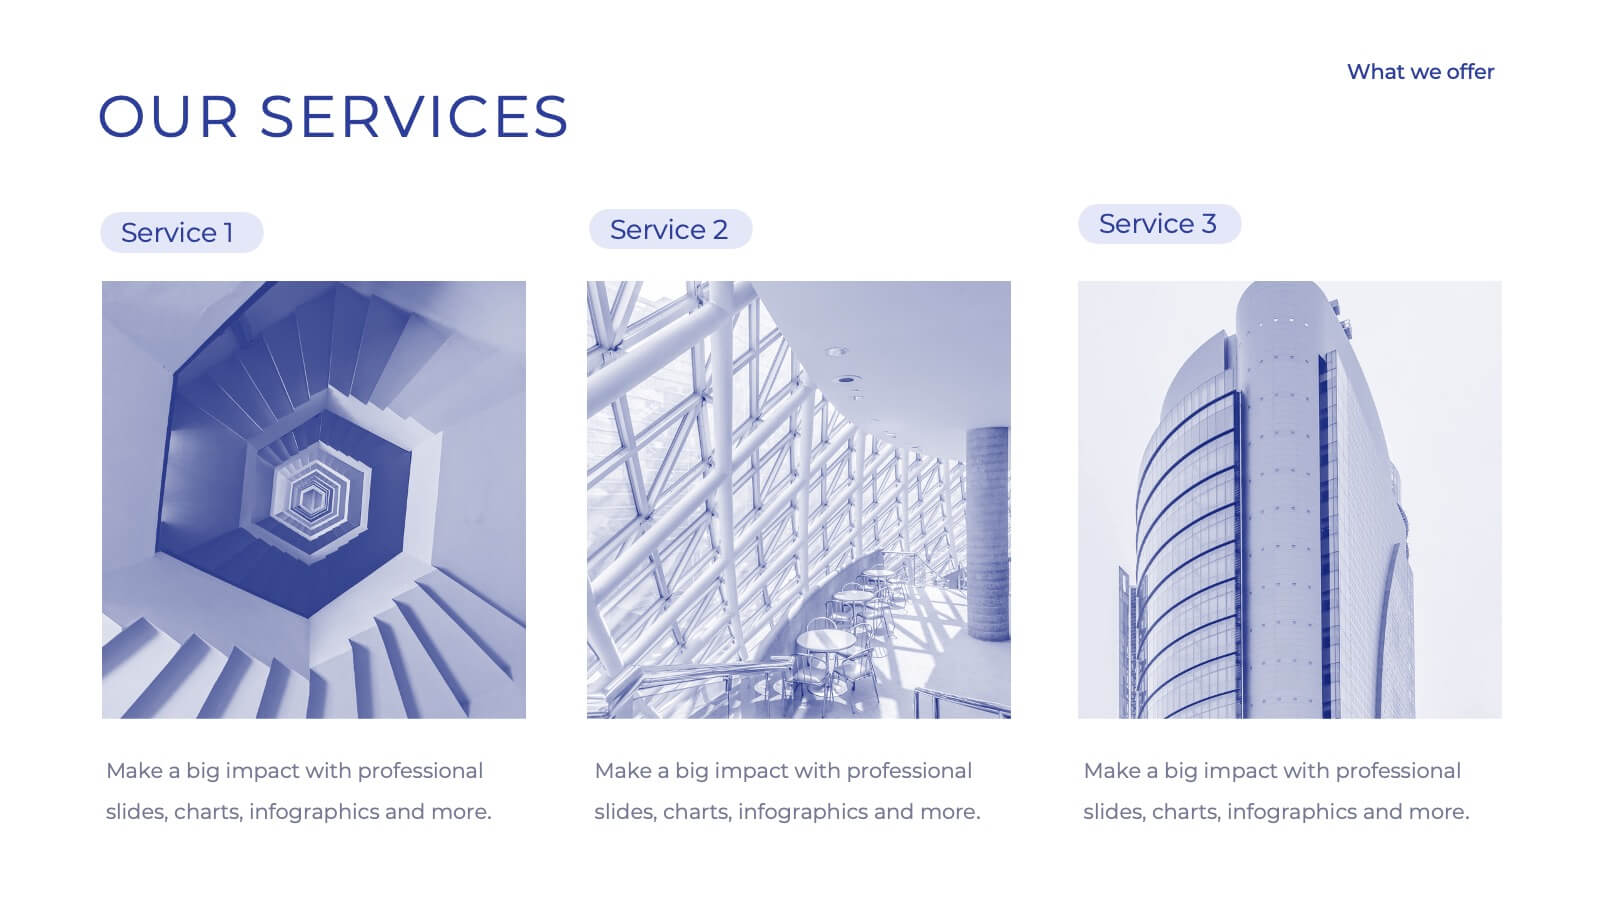
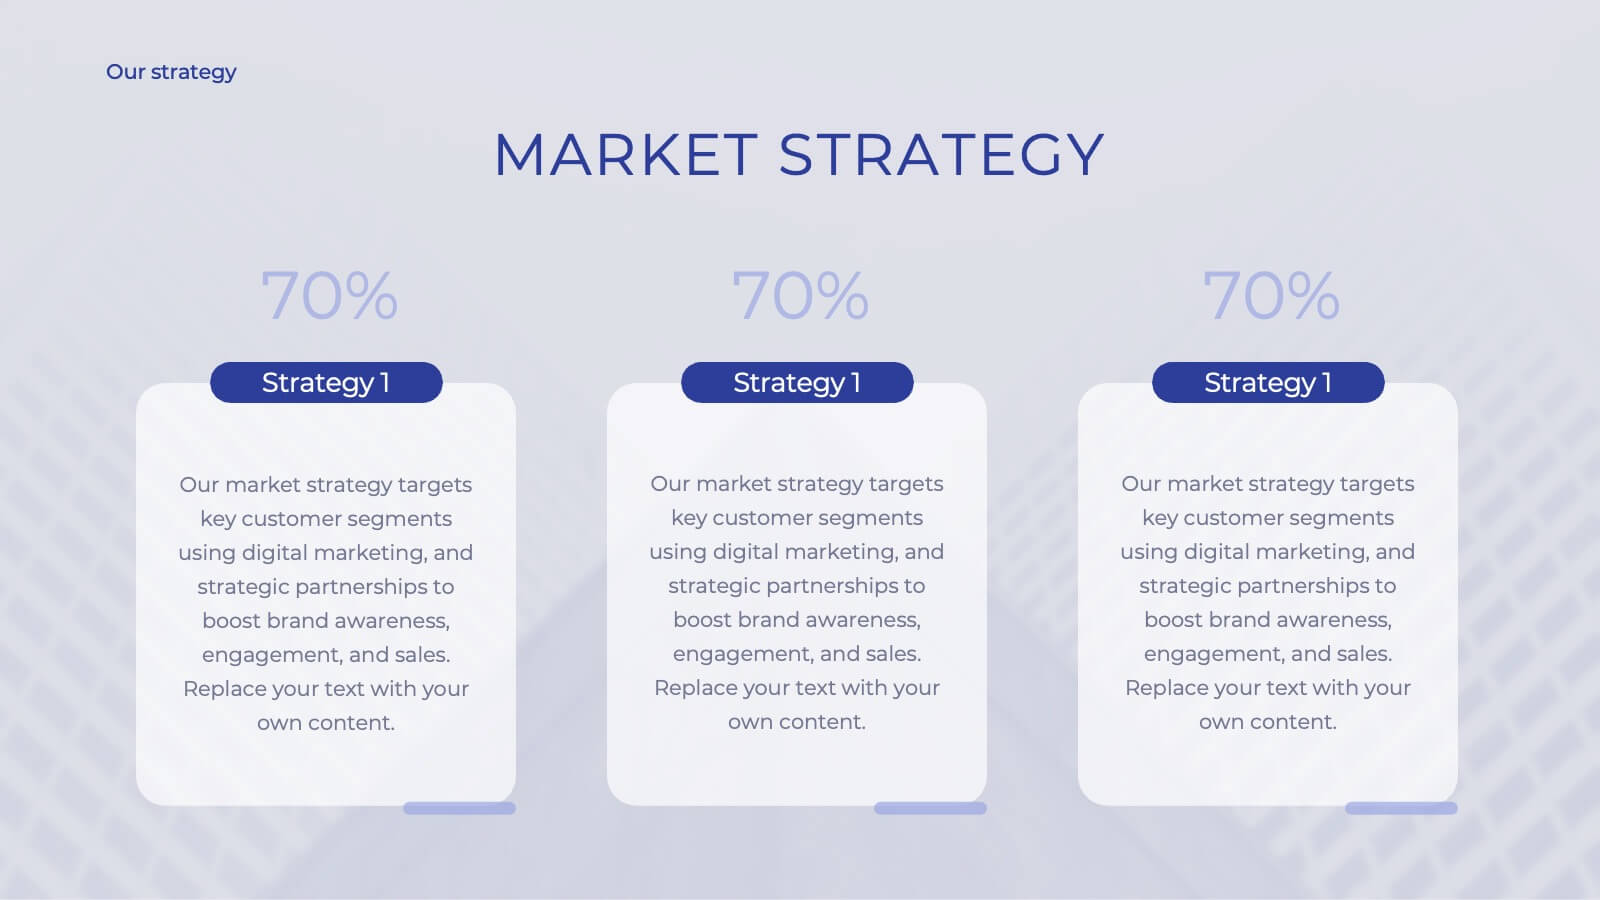
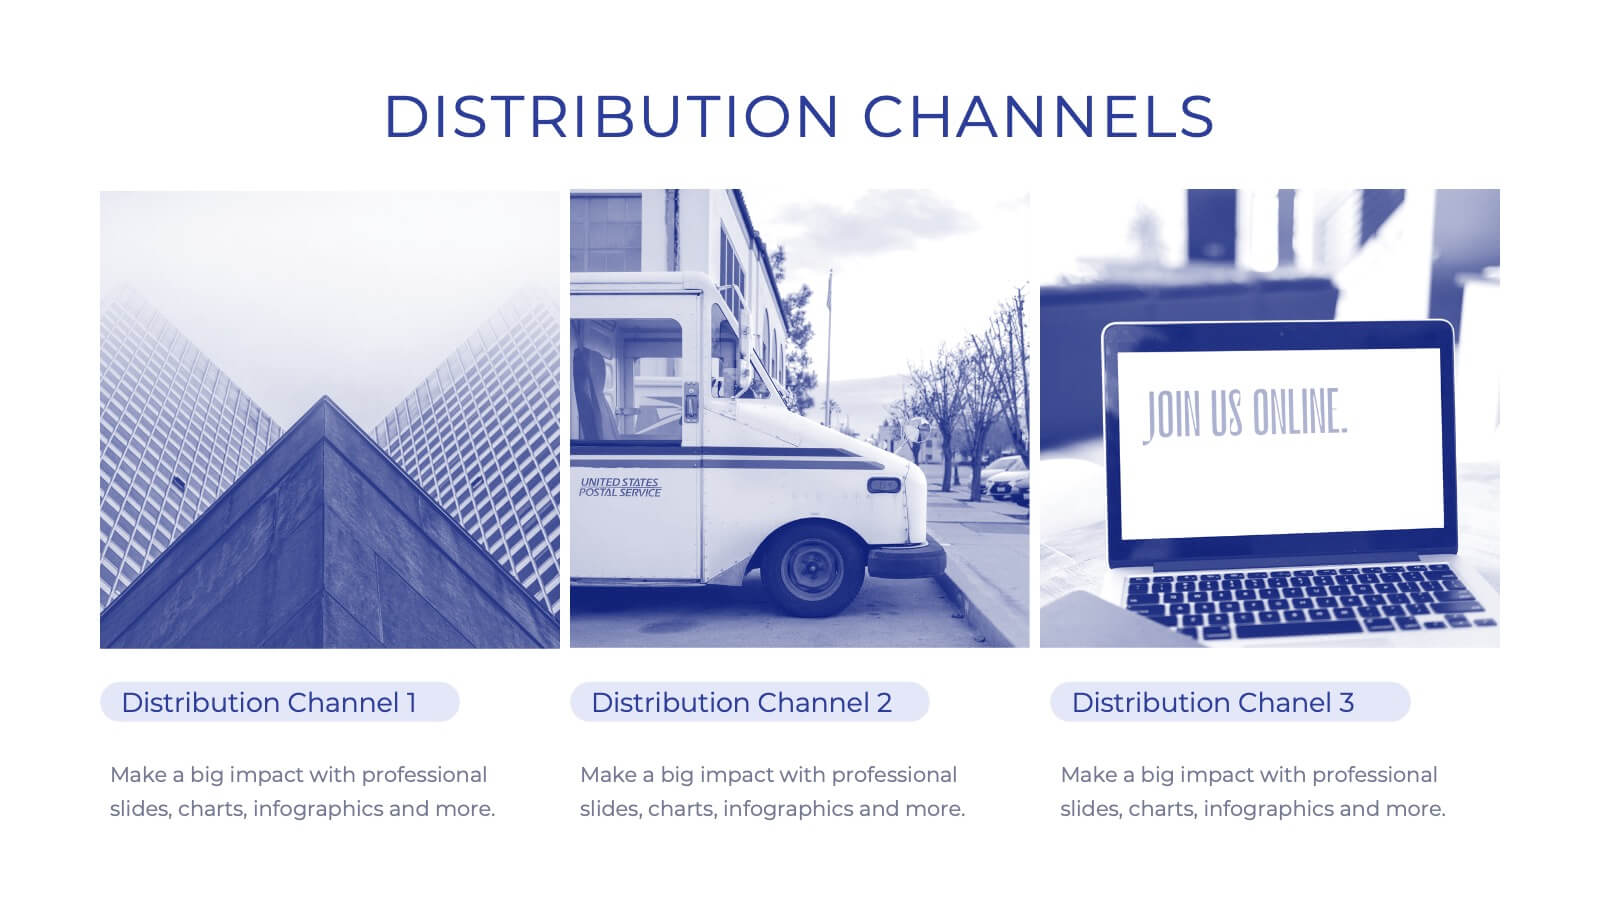
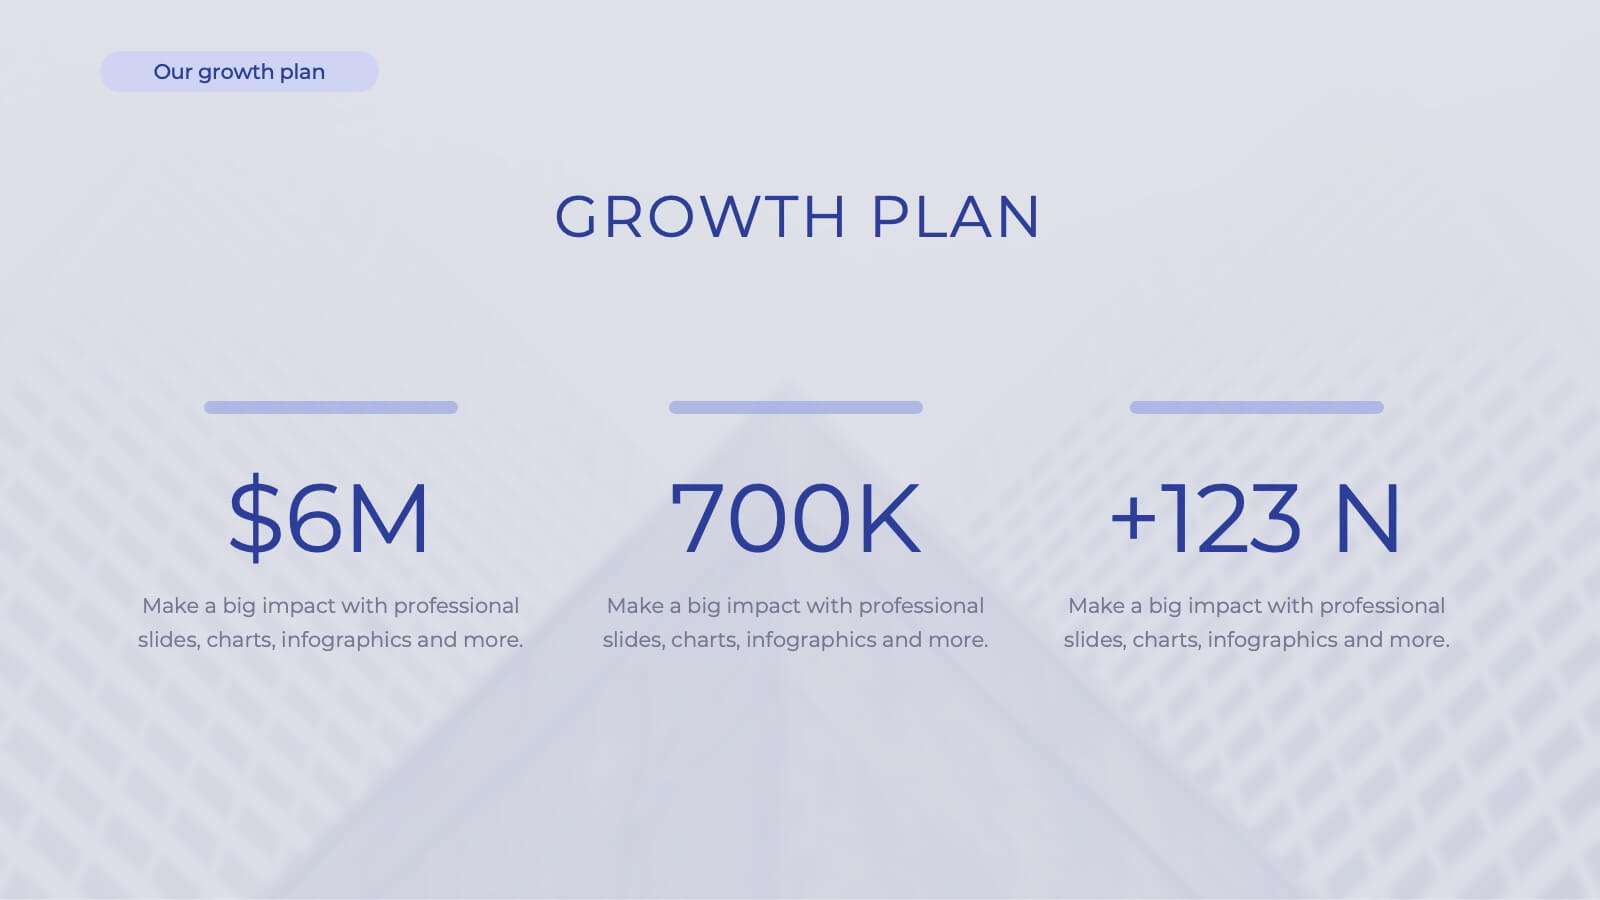
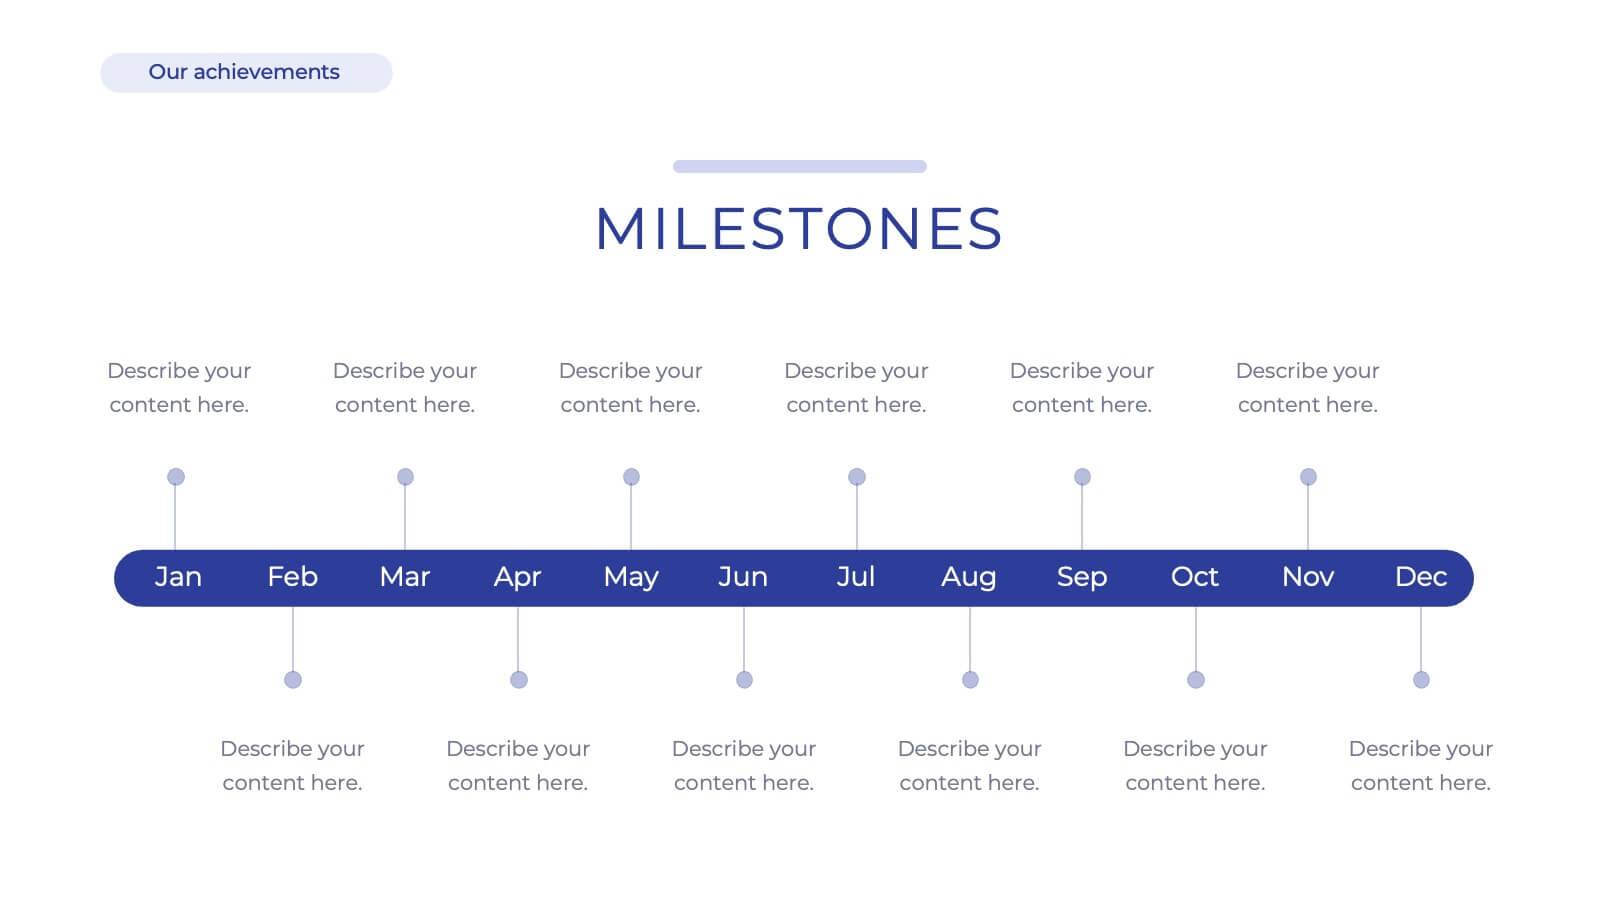
Iconic Startup Business Plan Presentation
Introducing our comprehensive corporate business plan template! Perfect for showcasing your company’s mission, vision, and services. Highlight your market strategy, competitive landscape, and growth plan in a professional design. Ideal for executives and entrepreneurs. Compatible with PowerPoint, Keynote, and Google Slides.


6 slides
Simple Horizontal Timeline Design Presentation
Bring your story to life with a smooth, step-by-step visual that guides viewers through key events with clarity and ease. This presentation helps you outline timelines, processes, or project stages in a clean horizontal flow that’s simple to follow and easy to customize. Fully compatible with PowerPoint, Keynote, and Google Slides.


20 slides
Axisflare Artist Portfolio Presentation
Showcase your creative journey with this vibrant artist portfolio template, featuring sections for project highlights, philosophy, style, and client testimonials. Ideal for presenting your work and artistic approach, this template is compatible with PowerPoint, Keynote, and Google Slides for seamless presentation across various platforms.


20 slides
Fusion Product Roadmap Presentation
Elevate your product roadmap presentations with this sleek and modern template! Perfect for detailing product features, target market, and competitive analysis. Ideal for product managers and teams aiming to align strategy and execution. Compatible with PowerPoint, Keynote, and Google Slides, it’s an essential tool for showcasing your product journey effectively.


5 slides
Building Strong Business Relationships
Create lasting partnerships with this structured business relationship infographic. Ideal for outlining trust-building strategies, collaboration frameworks, and stakeholder engagement plans. Fully editable in PowerPoint, Keynote, and Google Slides, making it simple to align the design with your company’s branding and professional goals.


5 slides
Group Dynamics and Work Roles Presentation
Visualize team roles and responsibilities clearly with the Group Dynamics and Work Roles Presentation. This horizontal timeline layout highlights individual contributions and their position in the workflow, making it ideal for team structure, leadership roles, or project stages. Fully editable in Canva, PowerPoint, or Google Slides for smooth collaboration.


5 slides
Step-by-Step Planning Roadmap Presentation
Clarify each phase of your strategy with the Step-by-Step Planning Roadmap Presentation. This engaging slide design uses a staircase-style layout with labeled checkpoints (A–E) and matching text boxes to clearly communicate sequential goals or stages. Great for project roadmaps, implementation plans, or business timelines. Fully customizable in PowerPoint, Keynote, and Google Slides.


6 slides
Platform-Specific Social Strategy Presentation
Break down your marketing approach by channel using this clear, platform-focused timeline. Highlight strategies for TikTok, Facebook, Instagram, X, and email in a linear, easy-to-read format. Ideal for digital marketers, content teams, and social media managers. Fully editable in PowerPoint, Keynote, and Google Slides to match your brand and strategy.


6 slides
Project Planning and Task Allocation Presentation
Streamline your project timelines with the Project Planning and Task Allocation Presentation. This template uses a clear horizontal flow to map out six key tasks or stages, making it ideal for visualizing schedules, assigning responsibilities, or showcasing milestones. Fully editable in PowerPoint, Google Slides, Keynote, and Canva.


12 slides
Business Growth and Expansion Presentation
Showcase your Business Growth and Expansion strategy with this dynamic presentation template. Featuring bold arrow visuals, it effectively illustrates progression, milestones, and key business insights. Ideal for startups, corporate planning, and market analysis. Compatible with PowerPoint, Keynote, and Google Slides.


12 slides
Corporate Growth Strategy Steps Presentation
Showcase your expansion roadmap with this Corporate Growth Strategy Steps Presentation. Designed as a five-step vertical ladder, this layout is perfect for illustrating progressive stages like market entry, development, scaling, innovation, and leadership. Each level includes editable icons and text placeholders for clarity and customization. Fully compatible with PowerPoint, Keynote, and Google Slides.


6 slides
Organizational Change Process Presentation
Make complex transitions look simple with this modern visual template. Perfect for illustrating every stage of organizational change, this infographic-style design helps communicate key steps with clarity and focus. Easily editable and professionally designed, it's compatible with PowerPoint, Keynote, and Google Slides for seamless integration into your workflow.


20 slides
Aeneas Sales Proposal Presentation
Seal your next deal with this professional sales proposal template. It covers key sections like objectives, pricing strategy, and target market, offering a comprehensive layout for your pitch. Ideal for impressing clients, it's compatible with PowerPoint, Keynote, and Google Slides for smooth, impactful presentations.


21 slides
Eureka Startup Growth Plan Presentation
Present your startup growth plan effectively with this sleek, dynamic presentation template designed for innovators and entrepreneurs. With its vibrant color scheme and streamlined layout, it simplifies complex data, ensuring your audience stays engaged. The template offers slides for showcasing your mission, market analysis, business strategies, and revenue projections. Dedicated sections highlight team profiles, target audience insights, and funding goals, providing a comprehensive view of your growth trajectory. Use the timeline slides to map out milestones and visually articulate your progress. Fully customizable in PowerPoint, Google Slides, and Keynote, it adapts effortlessly to your specific needs, enabling you to communicate your vision with clarity. Ideal for pitching to investors, presenting at conferences, or internal strategic planning, this template equips you with the tools to drive home your ideas with professionalism and style. Empower your growth journey with a presentation that reflects your startup’s potential.