


Features
- 4 Unique slides
- Fully editable and easy to edit in Microsoft Powerpoint, Keynote and Google Slides
- 16:9 widescreen layout
- Clean and professional designs
- Export to JPG, PDF or send by email


Do you have any questions?
Recommend


6 slides
Isometric 3D Elements Presentation
Add depth and dimension to your ideas with this sleek 3D visual layout that transforms flat concepts into engaging graphics. Perfect for showing connected processes, stages, or data structures, it balances clarity with creativity. Fully editable and compatible with PowerPoint, Keynote, and Google Slides for effortless customization.


3 slides
Sustainabilitiy Management Plan Framework Presentation
Turn your sustainability goals into a clear, actionable plan with this dynamic presentation design. Ideal for showcasing environmental strategies, performance metrics, and corporate responsibility initiatives, it combines clarity with visual balance to engage audiences. Fully editable and compatible with PowerPoint, Keynote, and Google Slides for seamless customization and delivery.


20 slides
Elementra Marketing Proposal Presentation
Elevate your marketing initiatives with this professional and well-structured proposal template. Covering essential sections such as objectives, goals, budget breakdown, timeline, and pricing structure, this presentation helps you effectively communicate your strategy to stakeholders and clients. Its clean, modern design ensures clarity and engagement, making it ideal for pitching ideas and securing approvals. Fully customizable and compatible with PowerPoint, Keynote, and Google Slides.


7 slides
Asia Countries Map Infographic
This Asia Countries Map infographic template is ideal for presentations requiring a detailed breakdown of geographic and statistical data across Asia. Compatible with PowerPoint, Google Slides, and Keynote, it features a collection of map styles and data visualization tools including icons, bar charts, and color-coded points for easy data comparison and interpretation. The template is perfect for visualizing diverse metrics such as demographic details or social statistics, with each slide tailored to display information in a clear, engaging manner. This tool is exceptionally suited for educators, and business professionals who need to convey complex data about Asian countries.


4 slides
4-Level Funnel Analysis Diagram Presentation
Give your insights a clear path to follow with this clean, modern diagram built to simplify layered decision-making. This presentation breaks complex stages into four easy-to-read levels, helping you explain flow, priorities, and performance with confidence. Fully compatible with PowerPoint, Keynote, and Google Slides.


7 slides
Digital Marketing Strategies Infographic
The Digital Marketing Strategies Infographic provides a colorful and organized presentation of key performance indicators and metrics essential for evaluating the success of digital marketing campaigns. It covers various platforms and strategies, illustrating comparative engagement rates, follower counts, and other relevant data points. This infographic is an excellent resource for marketers looking to convey their campaign results in a clear, concise manner. It is suitable for use in PowerPoint, Google Slides, and Keynote presentations, ideal for illustrating progress, setting benchmarks, and sharing insights with team members, stakeholders, or clients.


6 slides
Business Roadmap Strategy Presentation
Map your path to success with this Business Roadmap Strategy template. Designed for clarity and impact, it helps you outline goals, milestones, and timelines in a visual journey. Ideal for team planning, strategy meetings, and pitches. Compatible with PowerPoint, Keynote, and Google Slides for seamless editing.


6 slides
Seven Factors for Business Success Presentation
Present key drivers of business success with this visually balanced 7-element diagram. Featuring Systems, Structure, Strategy, Skills, Staff, Style, and Shared Value, this slide is ideal for strategic planning and leadership presentations. Fully customizable in PowerPoint, Keynote, and Google Slides to match your branding and presentation objectives.


5 slides
RAPID Decision-Making Framework Presentation
Streamline your choices and boost collaboration with a clear, structured framework that defines every role in the decision-making process. This modern circular layout helps teams visualize responsibilities, actions, and approvals for faster, smarter outcomes. Fully editable and compatible with PowerPoint, Keynote, and Google Slides for effortless customization and presentation.


5 slides
Search Engine Ranking Presentation
The Search Engine Ranking Presentation template is designed to clearly communicate strategies for improving search engine optimization (SEO). This template visually outlines key concepts in SEO such as enhancing site visibility, optimizing content, reducing bounce rates, and improving branding through intuitive graphical elements and concise bullet points. Each section of the template focuses on a specific aspect of SEO strategy, such as "Improved," "Reduce," "Increase," and "Branding," making it an invaluable tool for marketers looking to present actionable insights. This presentation is perfect for SEO specialists, digital marketers, and content managers aiming to educate teams or clients on the intricacies of boosting online presence effectively.


7 slides
Sports Illustrated Infographic Presentation
Sports are an important aspect of our lives that provide numerous physical, mental, social, and personal benefits. This sports infographic is designed to help you create an awesome visual content using all sorts of colorful images, charts and graphs that best describe your sports related project. This template is perfect if you need to share statistics and facts about sports. It contains 7 slides with colorful backgrounds, sport visualizations and an area for you to input your important data. This template is compatible with Powerpoint, keynote and google slides, perfect for your next project!


6 slides
Corporate Governance Strategy
Present your company’s leadership structure with clarity using this corporate governance strategy slide. This hexagonal framework highlights key areas such as vision, objectives, and strategy—surrounded by six supporting pillars. Each section includes editable icons and text for board responsibilities, ethics, oversight, and more. Ideal for executive updates, policy reviews, and stakeholder reports. Fully customizable in PowerPoint, Keynote, and Google Slides.


21 slides
Glimmer Product Roadmap Presentation
Illuminate your product's future with this vibrant glimmer-themed presentation template! Perfect for outlining your product roadmap, it allows you to present key milestones, features, and timelines in a visually engaging way. Captivate your audience and keep them informed about your exciting journey ahead. Compatible with PowerPoint, Keynote, and Google Slides.


12 slides
Visual Data Representation Bubble Map Presentation
Present complex data effectively with the Visual Data Representation Bubble Map presentation. This template organizes information into clear, interconnected segments, making it ideal for analytics, business insights, and strategic planning. Compatible with PowerPoint, Keynote, and Google Slides.


5 slides
Cryptocurrency Market Trends Presentation
Navigate the dynamic world of digital finance with our "Cryptocurrency Market Trends" presentation templates. Perfect for analysts and enthusiasts alike, these templates provide a clear, visual representation of market movements and trends. They are fully compatible with PowerPoint, Keynote, and Google Slides, making them an excellent resource for anyone keen on the pulse of cryptocurrency markets.


10 slides
Watercolor Texture Infographic
Watercolor texture refers to the visual and tactile effect created by the application of watercolor paint on paper or any other porous surface. This infographic template is a creative representation that incorporates watercolor textures and elements to convey information or data. This infographic is designed to engage viewers with its artistic and unique aesthetic while effectively presenting complex information in a simplified manner. This infographic features a white with watercolor background that sets the tone for the entire design. The soft, flowing, and colorful watercolor patterns create a visually appealing backdrop for the content.


27 slides
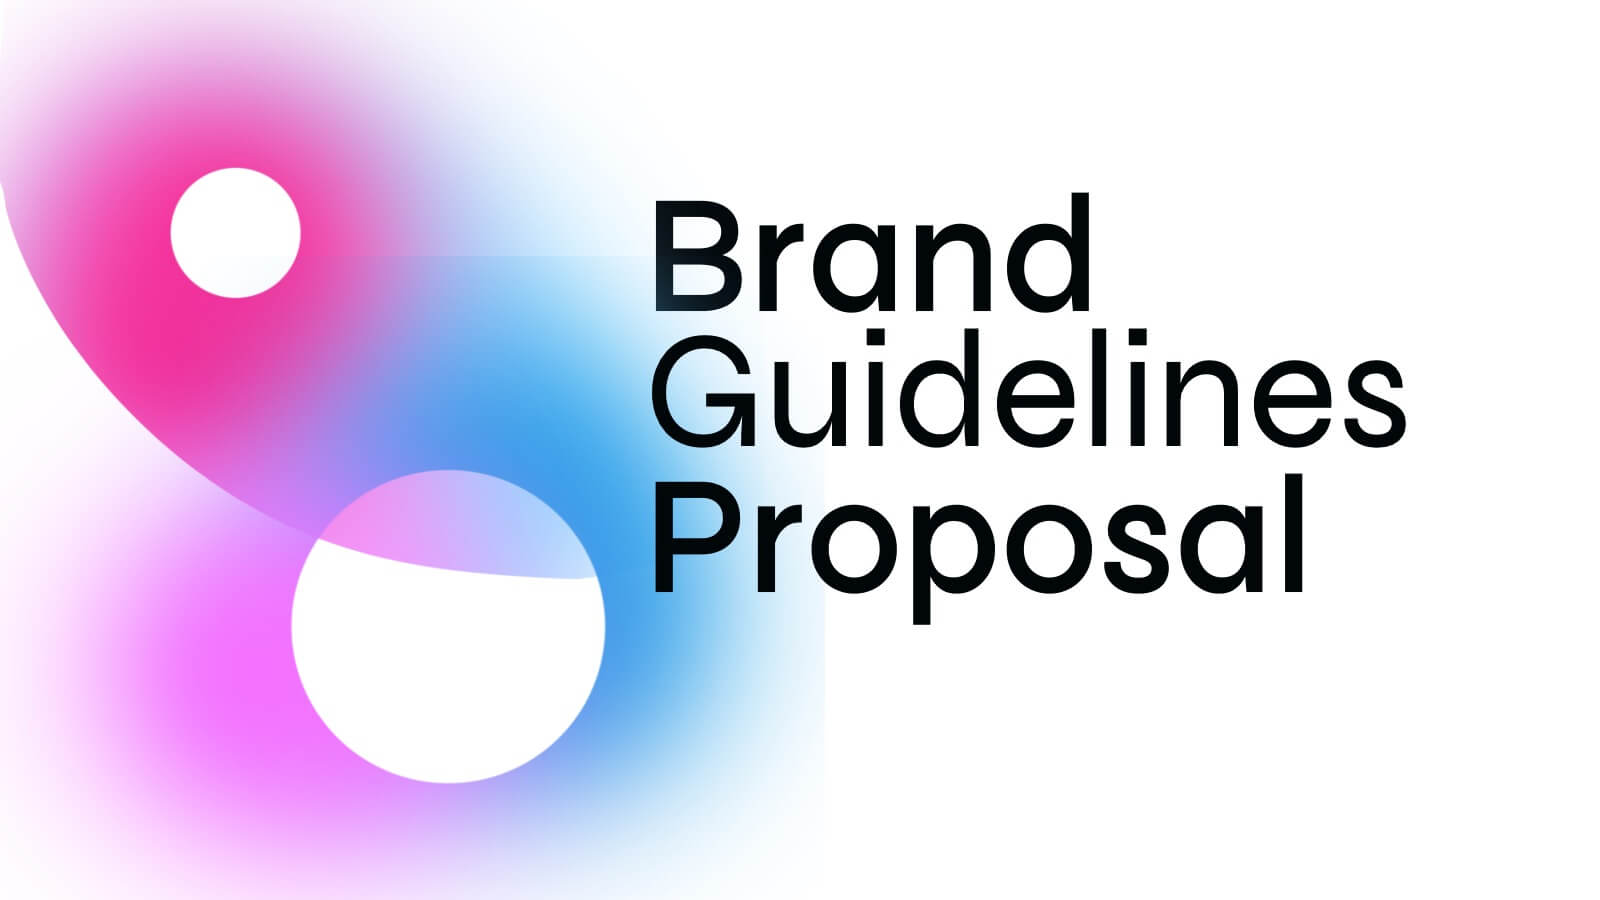
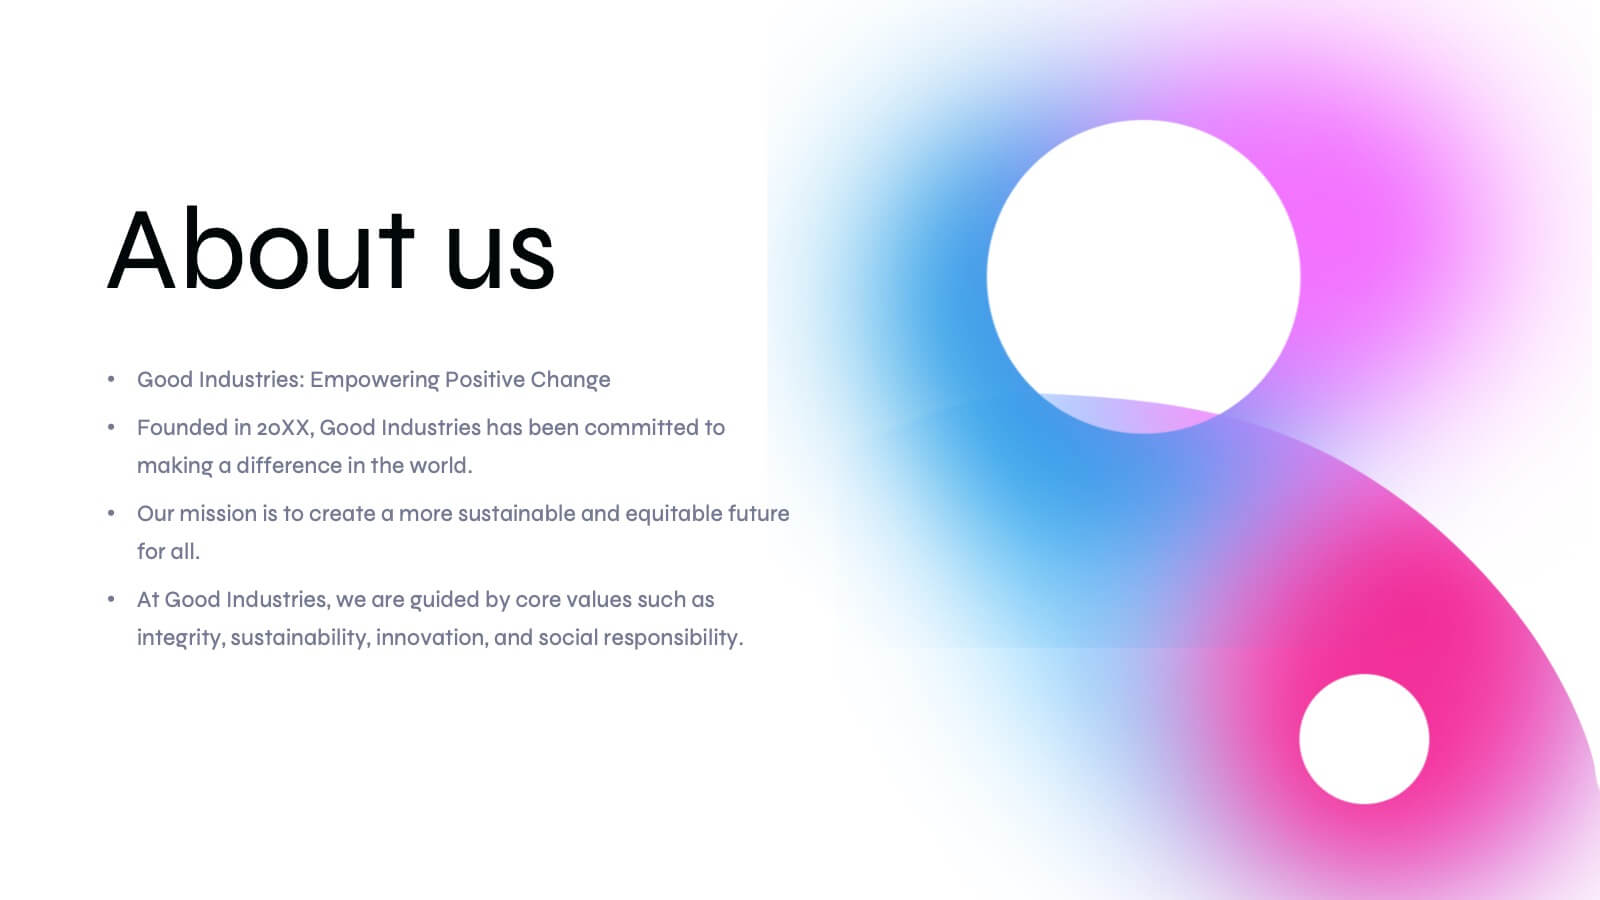
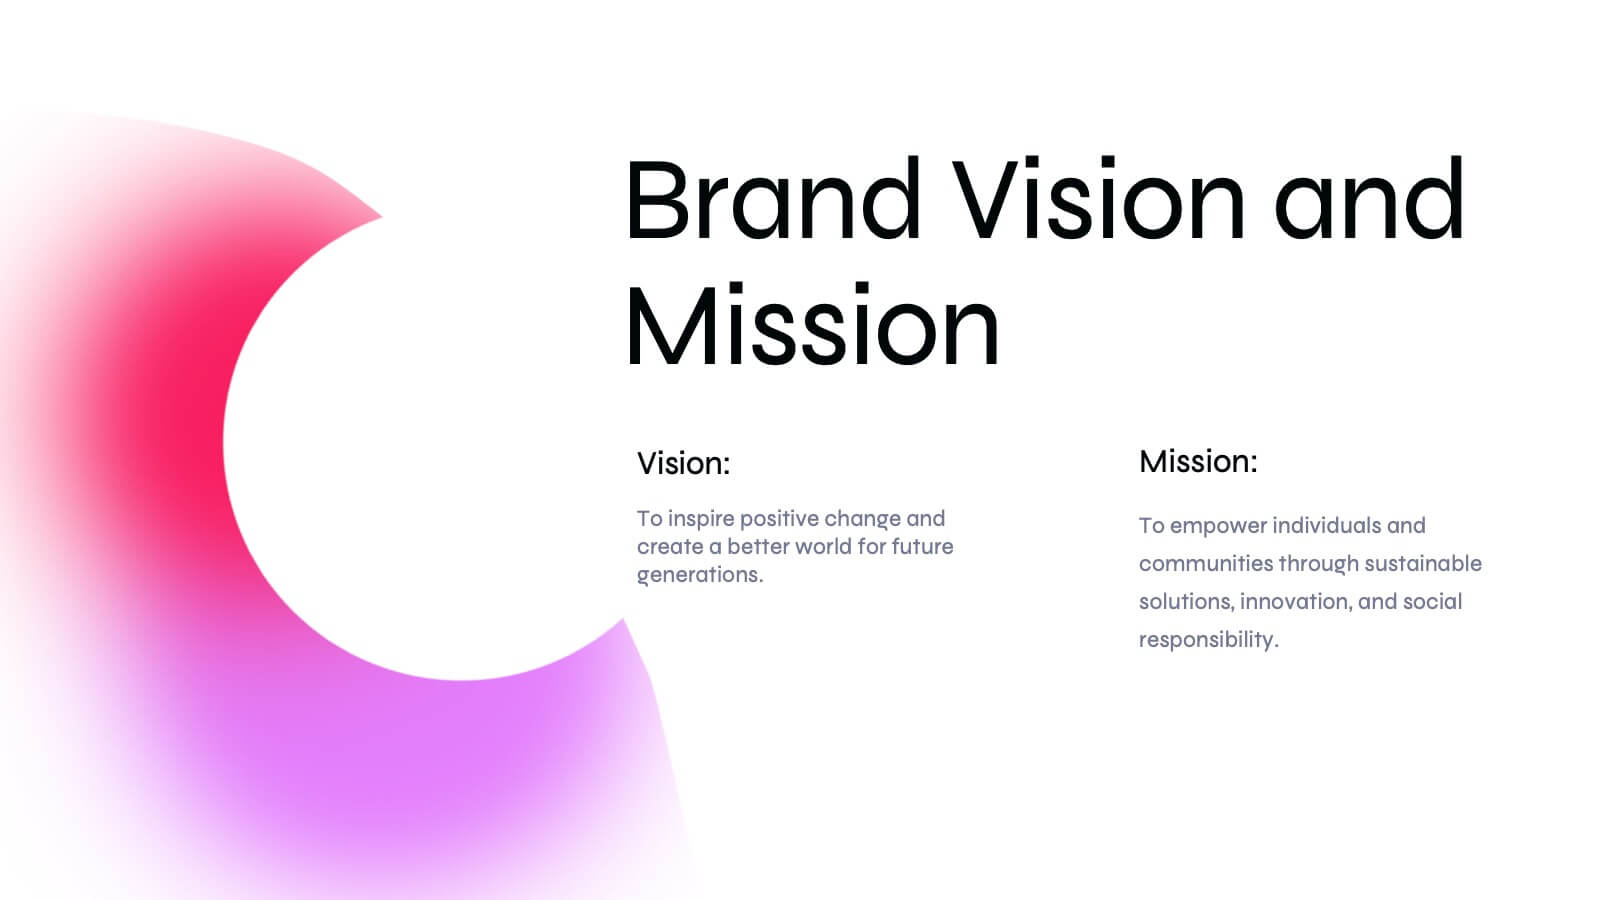
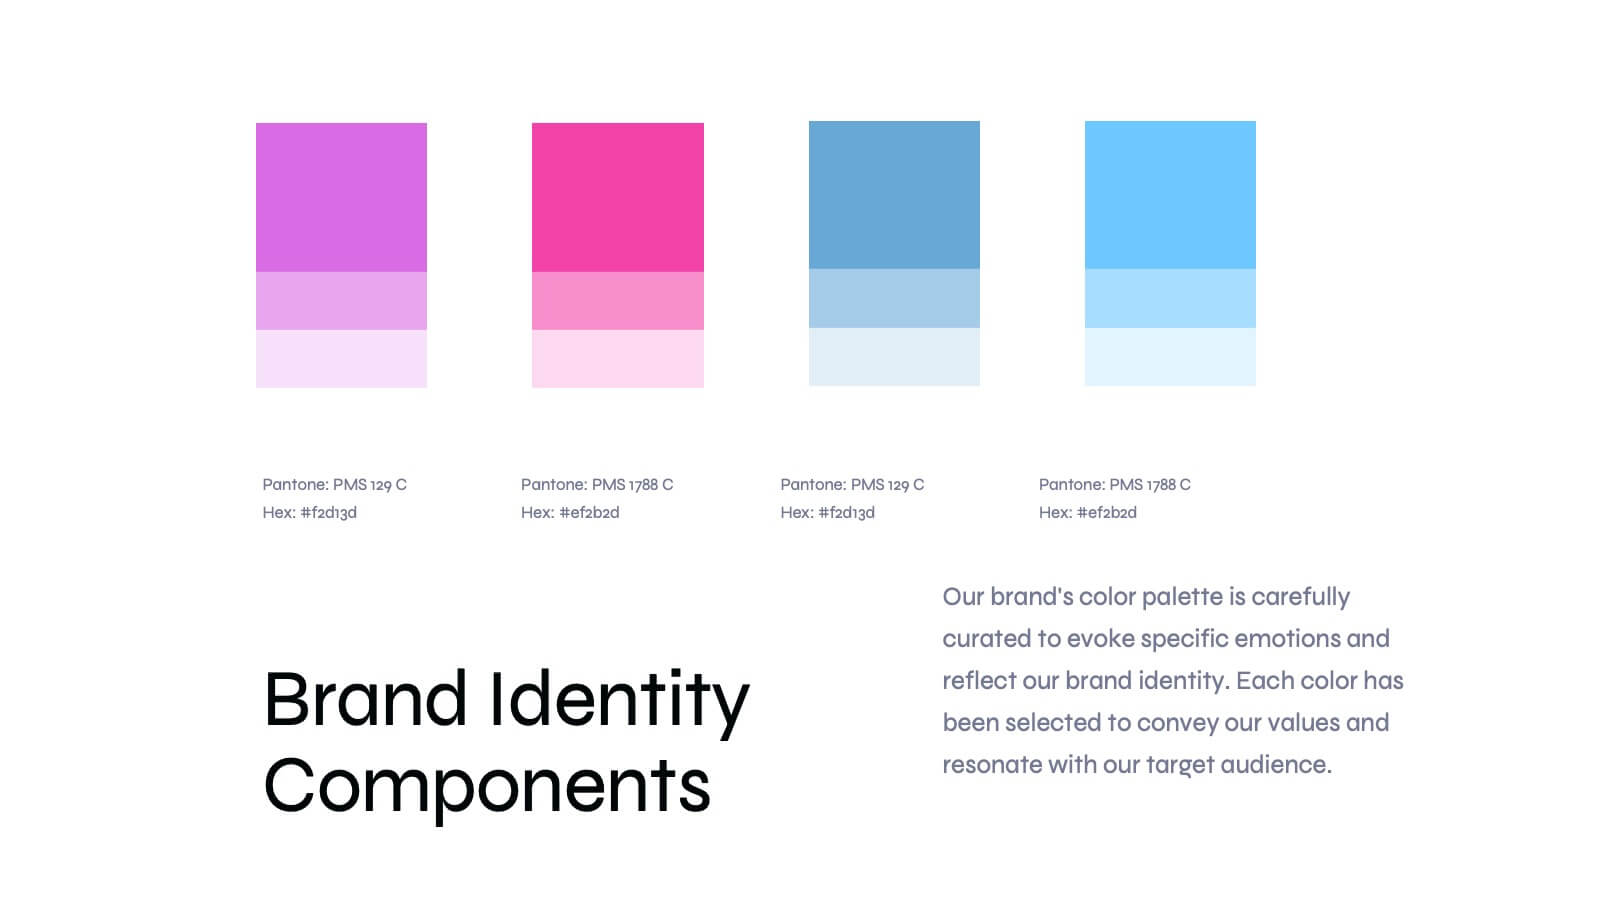
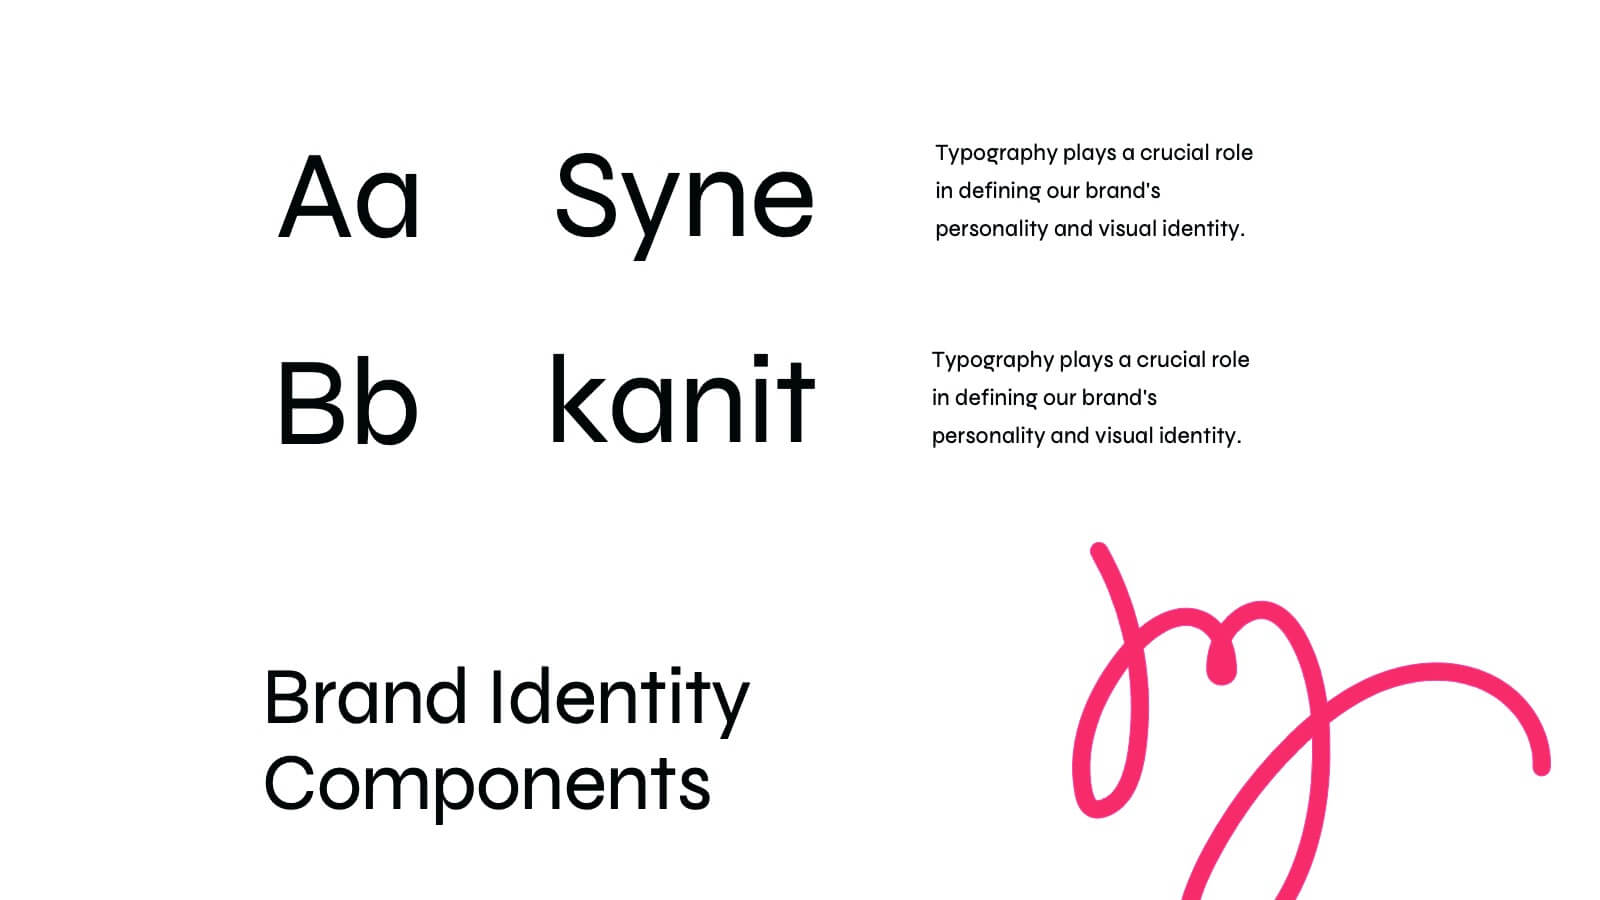
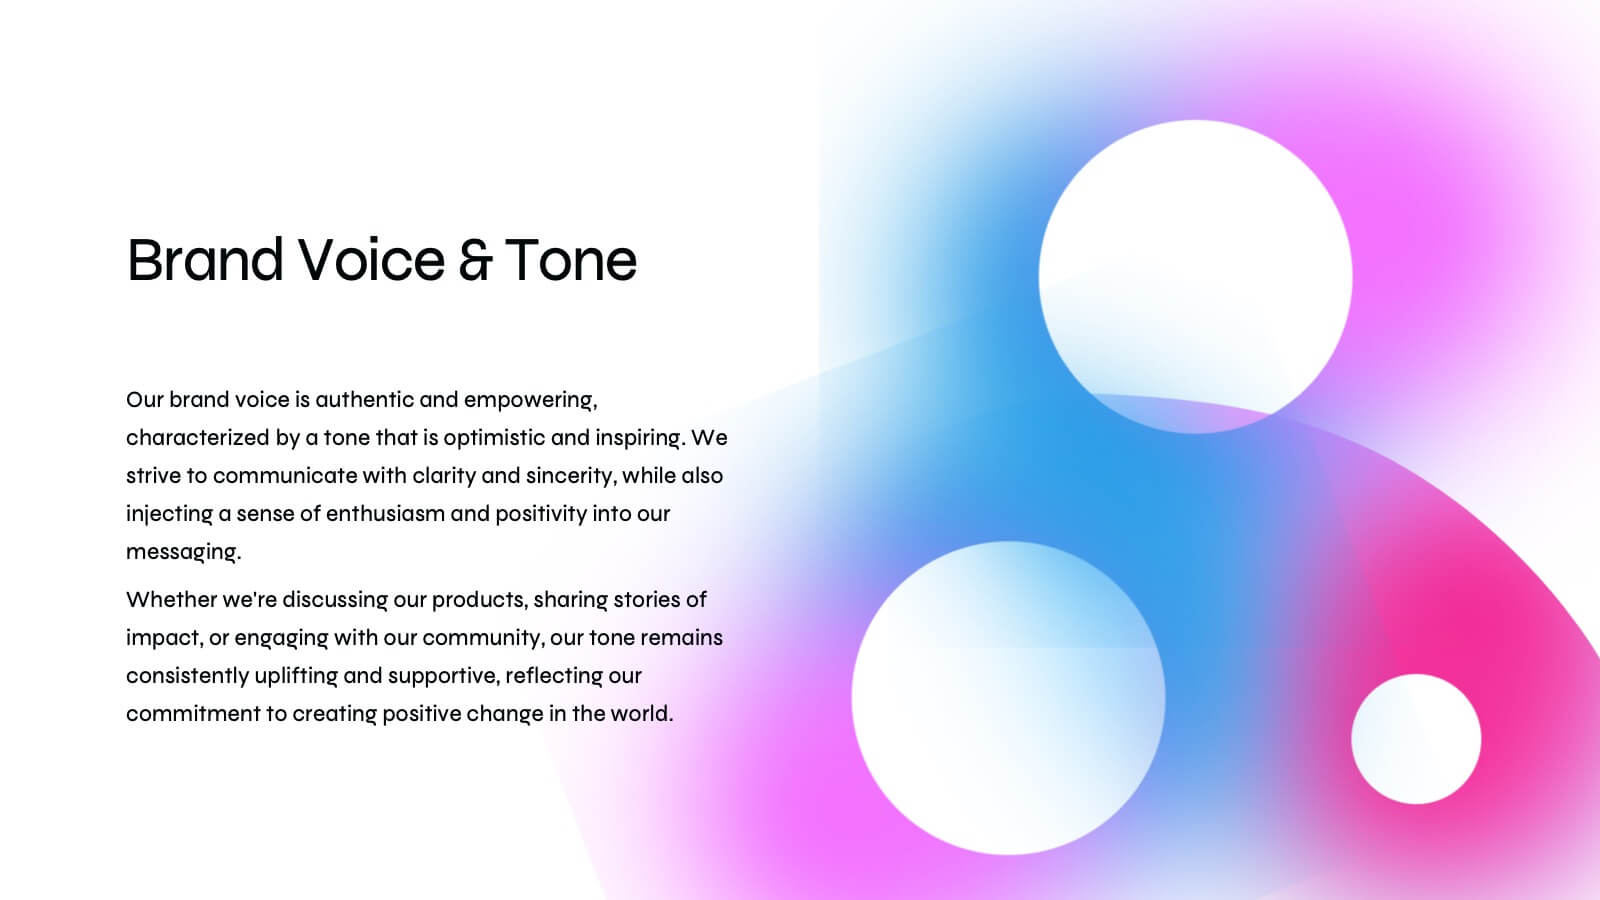
Basilisk Brand Guidelines Proposal Presentation
Present your brand strategy effectively with this modern brand guidelines proposal template! It includes sections for brand vision, values, identity, and market analysis. Fully customizable and compatible with PowerPoint, Keynote, and Google Slides, it’s perfect for showcasing your brand's identity and ensuring consistency across all platforms.