


Features
- 5 Unique slides
- Fully editable and easy to edit in Microsoft Powerpoint, Keynote and Google Slides
- 16:9 widescreen layout
- Clean and professional designs
- Export to JPG, PDF or send by email


Do you have any questions?
Recommend


4 slides
Corporate Company Profile Overview Presentation
Present your business story with clarity and impact using this sleek company profile layout. Designed for corporate overviews, it highlights key points alongside a modern visual backdrop. Ideal for executive summaries, strategy decks, or investor briefings—fully editable in PowerPoint, Keynote, and Google Slides for effortless customization and professional results.


6 slides
Touchpoint-Based Customer Journey Map Presentation
Visualize each stage of the user experience with this Touchpoint-Based Customer Journey Map presentation. Perfect for tracking interactions across the customer lifecycle—from awareness to loyalty—this layout helps pinpoint strengths and gaps at every phase. Clean columns and color-coded touchpoints ensure quick analysis. Fully compatible with PowerPoint, Canva, and Google Slides.


5 slides
Dealing With Cyberbullying Infgraphics
Cyberbullying refers to the act of using digital communication platforms such as social media, instant messaging, online forums, or email to harass, intimidate, or harm others. This infographic template is designed to raise awareness about cyberbullying and provide guidance on how to effectively deal with it. This template aims to educate individuals, parents, educators, and organizations about the impact of cyberbullying and empower them to prevent and address this issue. This template can be used by schools, community organizations, or online safety advocates to raise awareness about cyberbullying, and foster a safer online environment.


4 slides
Technology Device Mockup Presentation
Bring your ideas to life with a sleek, modern slide that showcases your digital product in a clean smartphone mockup. This presentation explains key features or app benefits with clear, structured text that keeps your message focused and professional. Fully compatible with PowerPoint, Keynote, and Google Slides for easy editing and use.


10 slides
Customer Experience Empathy Map
Capture customer feelings in motion with this visual empathy map, where facial icons climb the ladder of satisfaction. This slide is great for illustrating emotional journeys, user experience stages, or feedback insights in a fun, intuitive way. Fully editable and compatible with PowerPoint, Keynote, and Google Slides.


6 slides
Environmental Ecology Report Presentation
Bring sustainability to life with a clear, refreshing design that makes complex environmental insights easy to share. This presentation helps you explain key ecological data, conservation efforts, and resource impact using simple visuals and structured points. Perfect for reports or awareness talks. Fully compatible with PowerPoint, Keynote, and Google Slides.


5 slides
History of Vaccine Infographics
The History of Vaccines is a fascinating journey that spans centuries and has significantly impacted human health and disease prevention. With these infographic templates, you can effectively communicate the importance of vaccines, highlight their role in disease prevention, and debunk common misconceptions. It serves as an educational tool to promote understanding and appreciation for the significant advancements in vaccine development that have saved countless lives throughout history. Use these to provide a comprehensive overview of the history of vaccine and help individuals understand the importance and impact of vaccines.


6 slides
Blue Ocean Strategy Business Model
Capture new market spaces with this innovative Blue Ocean Strategy slide. Designed with a dynamic hourglass visual, it helps you showcase differentiation and low-cost strategies clearly. Perfect for business strategy sessions, growth planning, and innovation discussions. Fully editable in PowerPoint, Keynote, and Google Slides.


6 slides
Interview Question Infographic
Illuminate the path to insightful dialogue with our sleek Infographic Template, a visual masterpiece designed to make every question count! With its chic, minimalist design, this template pairs clean lines and soft colors to create an environment where information stands out and engagement flourishes. Perfect for those looking to elevate dialogue, whether through educational content, team meetings, or customer interactions, this tool makes communication clear and effective. It elegantly balances text and imagery, turning complex questions into easy-to-understand visuals that captivate and inform. Adaptable to various contexts, this template allows for full customization to match your brand’s aesthetic, ensuring that your message not only resonates but also reflects your unique style. Ideal for use in digital forums, presentations, or as part of interactive guides, it ensures your points are both seen and remembered, making every interaction more meaningful.


5 slides
Chemistry Lessons Infographics
Dive into the fascinating world of chemistry with our chemistry lessons infographics. Set against a backdrop of bold orange, black, and blue, this template captures the vibrant essence of chemical reactions and laboratory experiments. Tailored for educators, students, and science enthusiasts, this collection is perfect for enhancing lesson plans, study materials, or research presentations. Compatible with Powerpoint, Keynote, and Google Slides. With its creative, lab-themed design, each infographic is enriched with striking graphics and icons, providing a visual feast that simplifies complex concepts and promotes the joy of learning chemistry.


6 slides
Virtual Collaboration for Remote Teams
Make teamwork flow from anywhere with this streamlined roadmap-style layout built for remote collaboration. Designed to visualize communication stages, key roles, or workflow steps, this template helps virtual teams stay aligned and productive—no matter where they are. Fully compatible with PowerPoint, Keynote, and Google Slides.


6 slides
Targeted Segment Analysis and Mapping Presentation
Highlight your market focus with the Targeted Segment Analysis and Mapping Presentation. This circular layout is perfect for breaking down five audience segments, using subtle icons and visual emphasis for clarity. Ideal for marketers, strategists, and business analysts presenting niche targeting. Fully editable in Canva, PowerPoint, Keynote, and Google Slides.


6 slides
Basic Numbers Infographic
This Basic Numbers Infographic is a visual representation of numerical data or information using simple graphical elements. This infographic template is a straightforward way to convey statistics, facts, or comparisons to your audience in a clear and engaging manner. The infographic includes a clean and uncluttered design while effectively presenting the numerical information. The visual elements enhance understanding and make the infographic visually appealing to your audience. The icons, symbols, and simple illustrations enhance the appeal of the infographic. Compatible with Powerpoint, Keynote, and Google Slides.


7 slides
Supply Chain Process Mapping Presentation
Streamline your logistics and operations presentations with the Supply Chain Process Mapping Presentation. Featuring a linked-chain visual, this editable template is ideal for outlining each step in your supply flow—from sourcing to delivery. Highlight dependencies, bottlenecks, or key stages with customizable color coding. Fully compatible with PowerPoint, Keynote, and Google Slides.


2 slides
Opening Company Profile Introduction Presentation
Make a bold first impression with the Opening Company Profile Introduction Presentation — a sleek, modern design perfect for business overviews, team intros, or brand missions. Featuring clean typography and a purple accent shape that adds personality without distraction, this layout is ideal for concise, professional messaging. Fully editable and compatible with Canva, PowerPoint, Google Slides, and Keynote.
21 slides
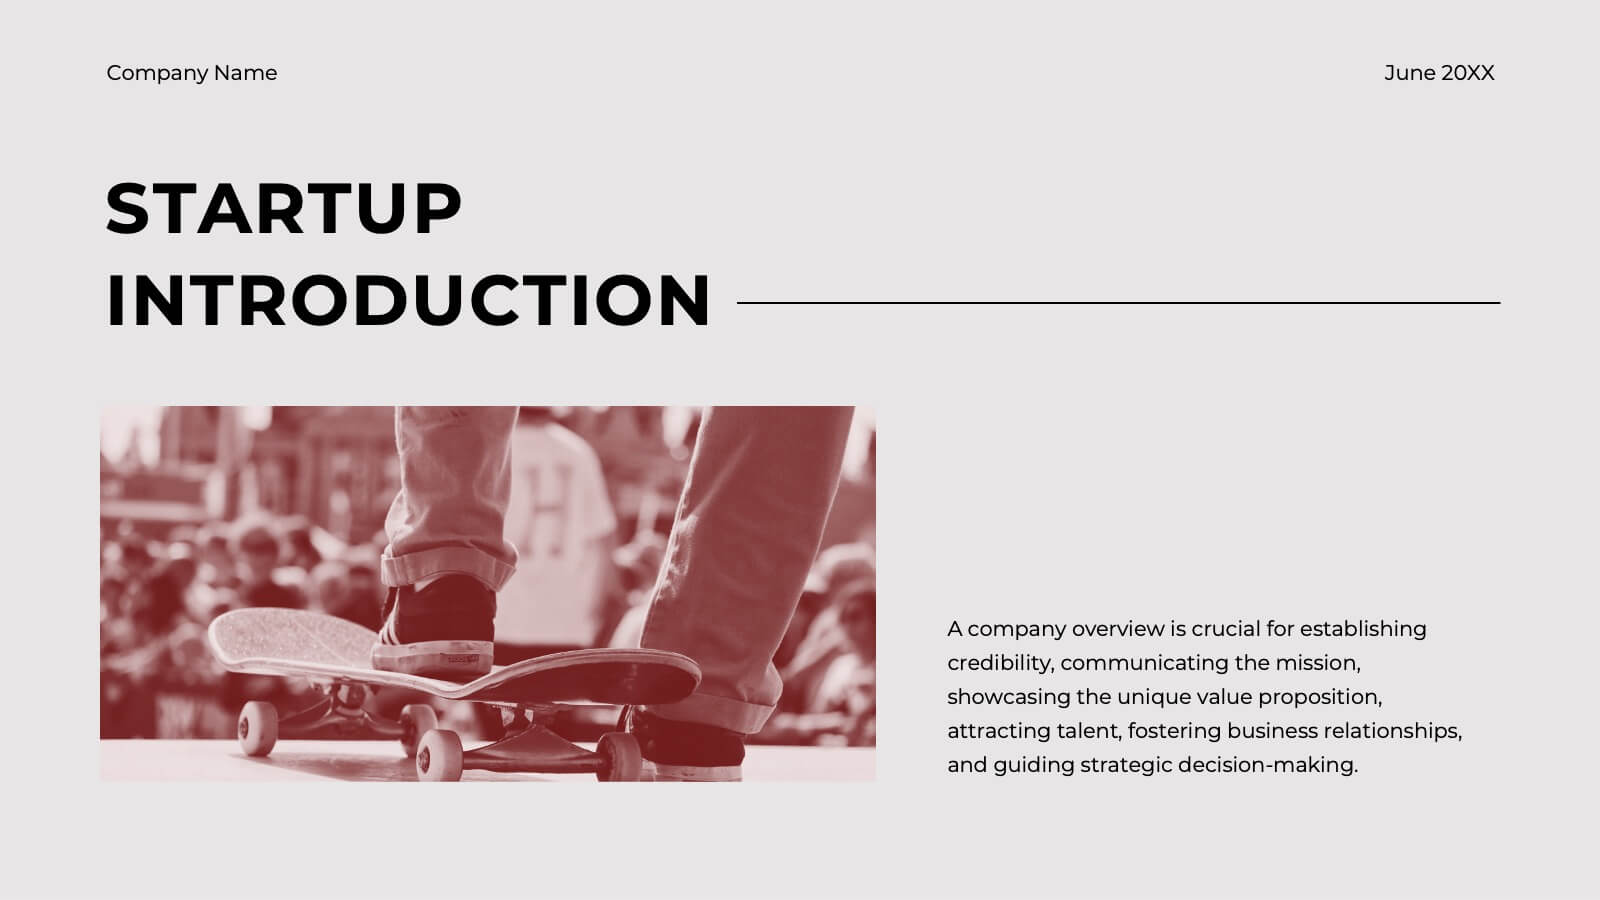
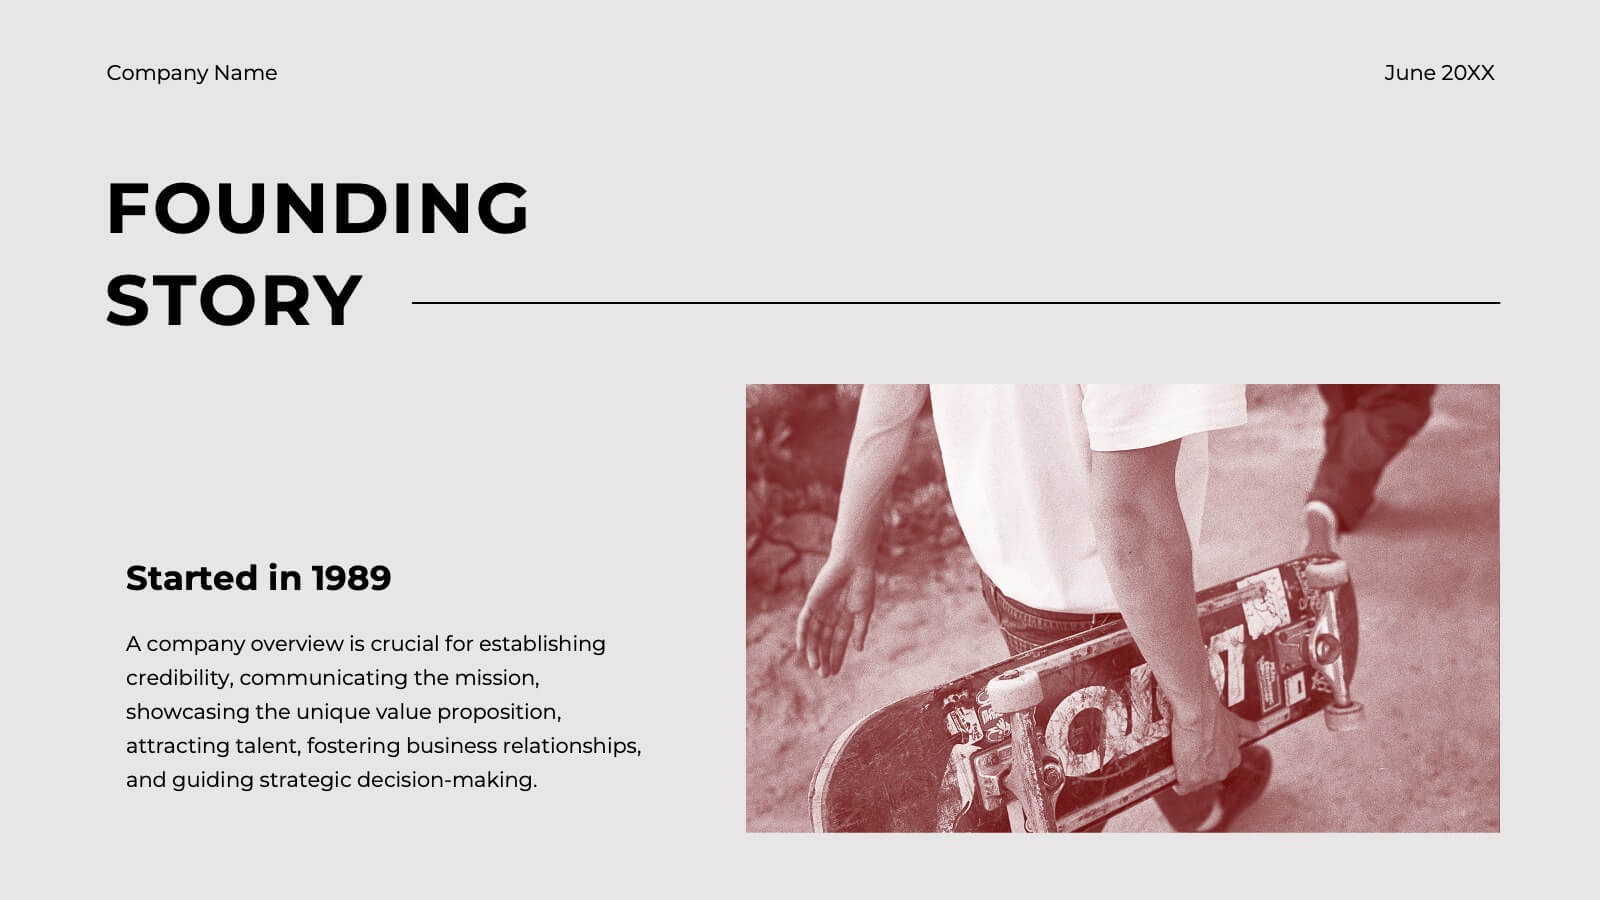
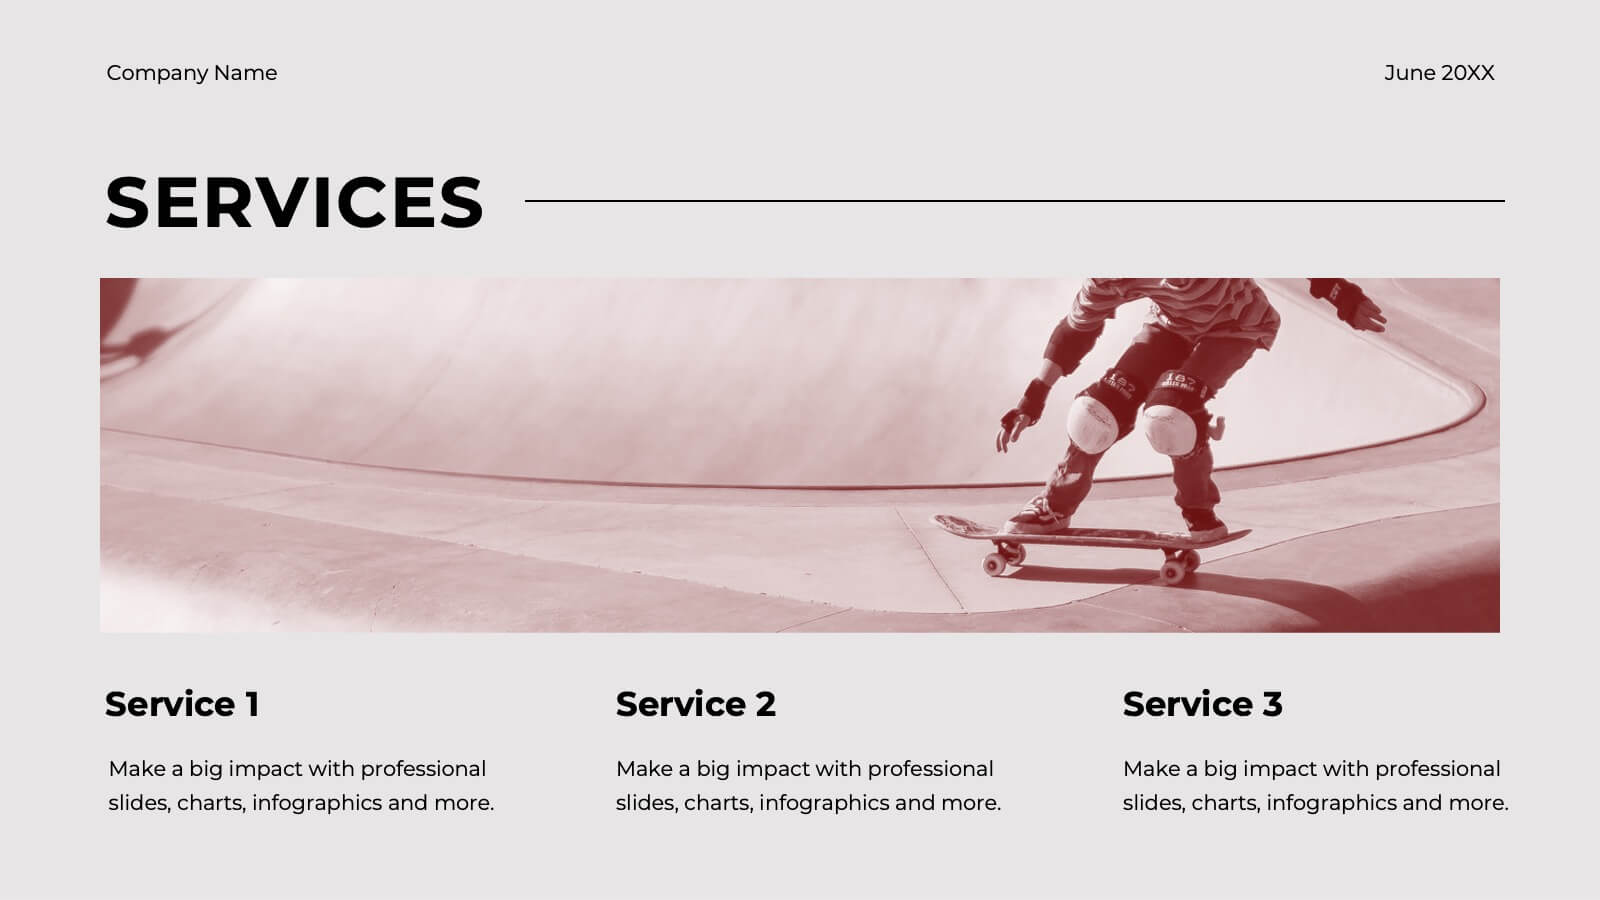
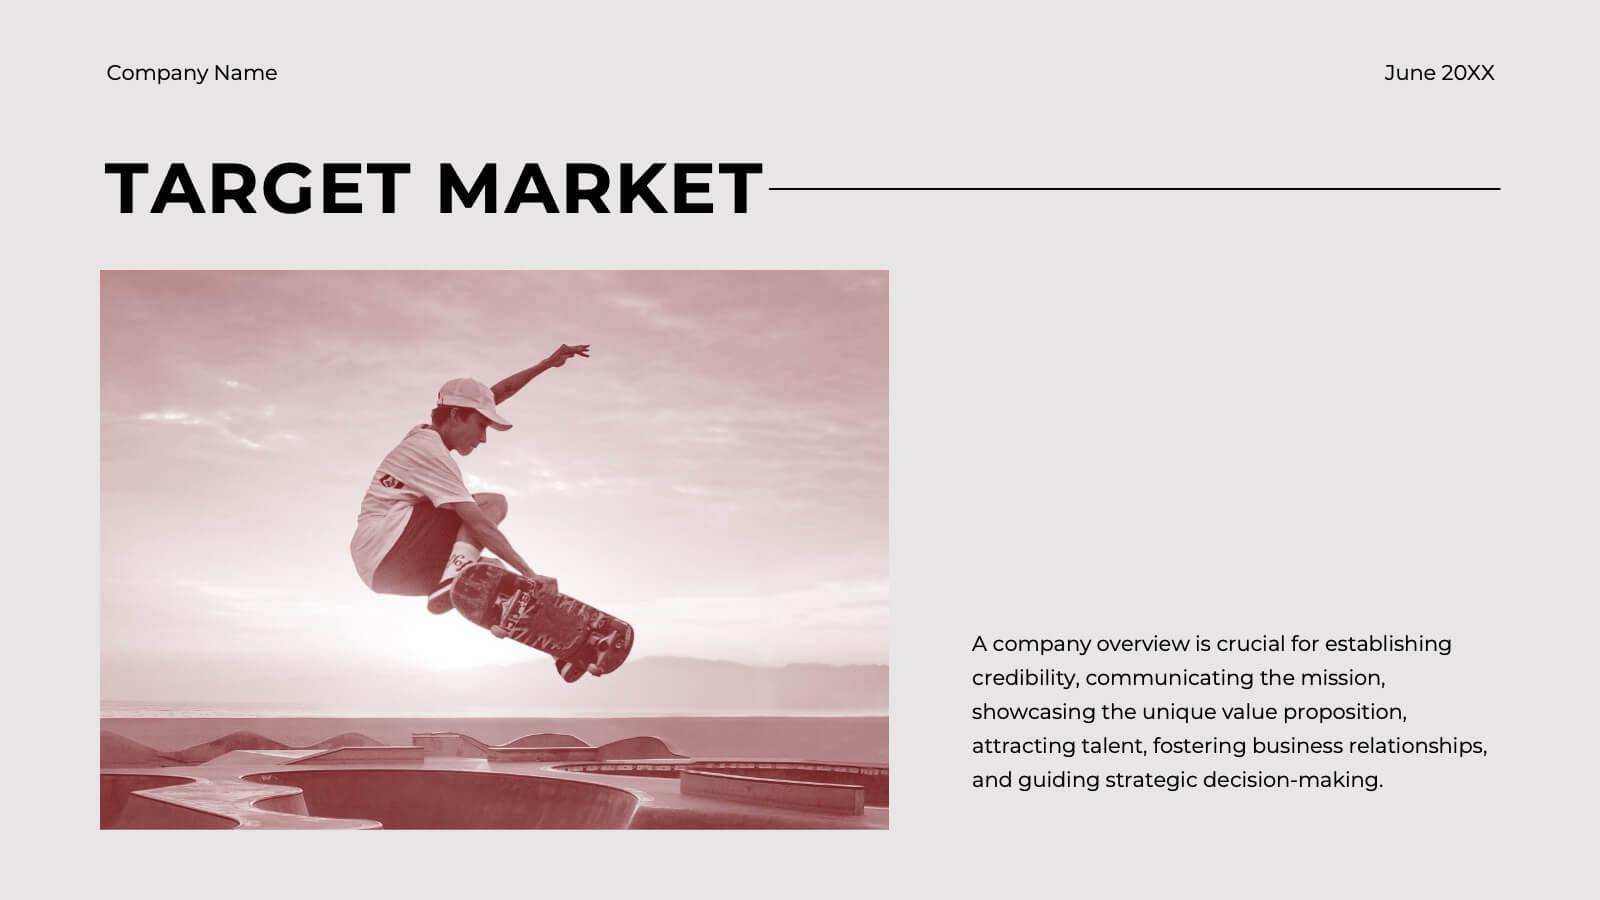
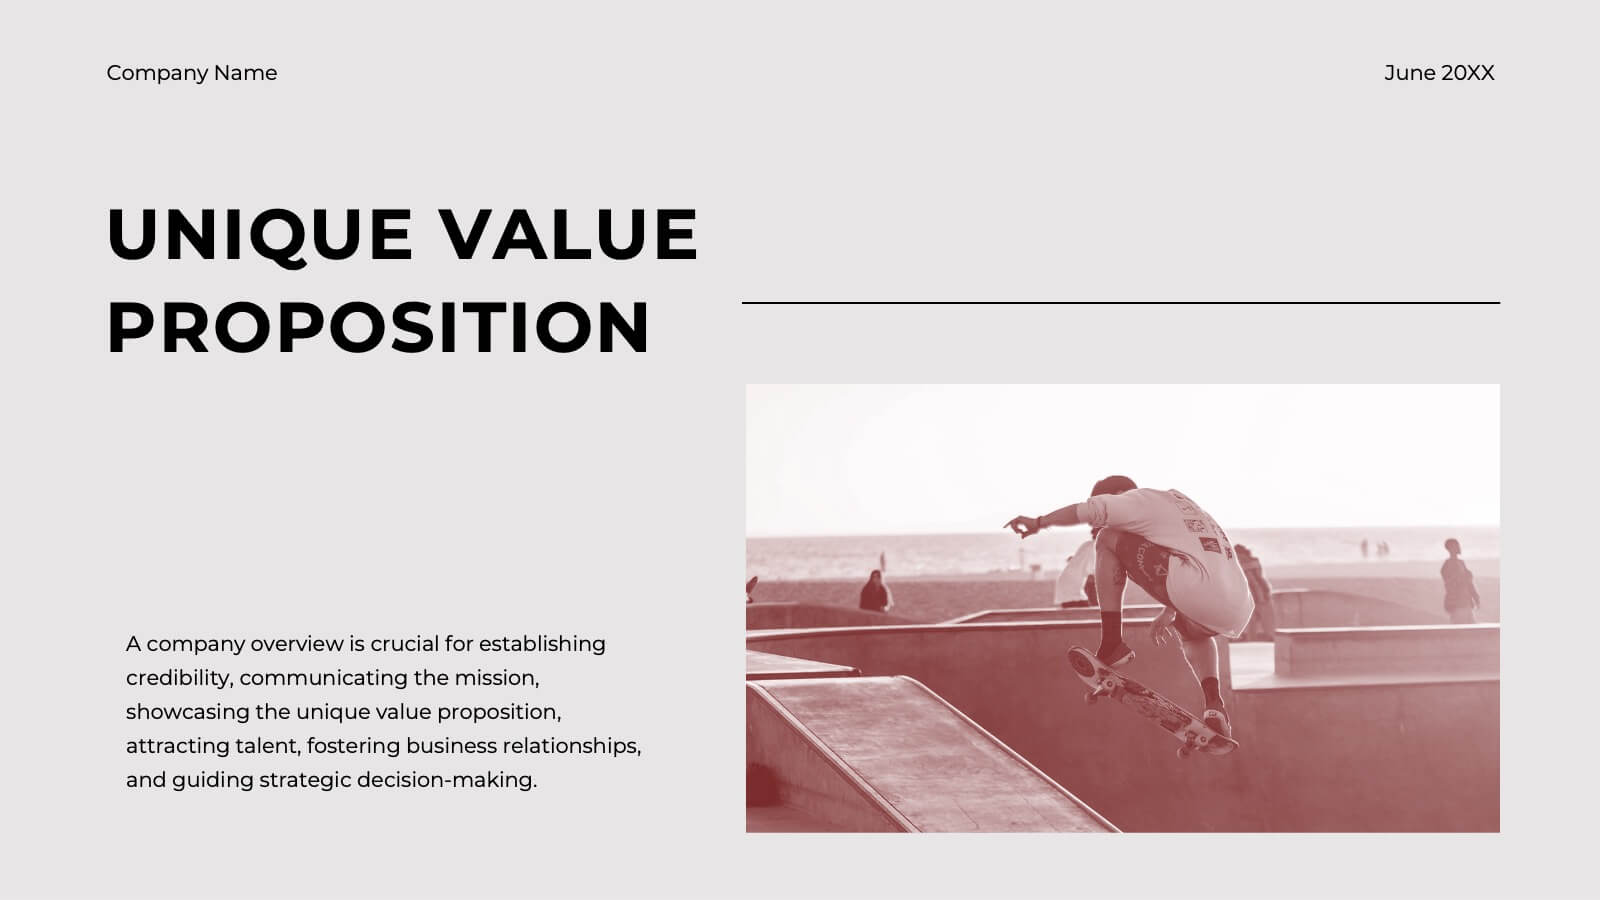
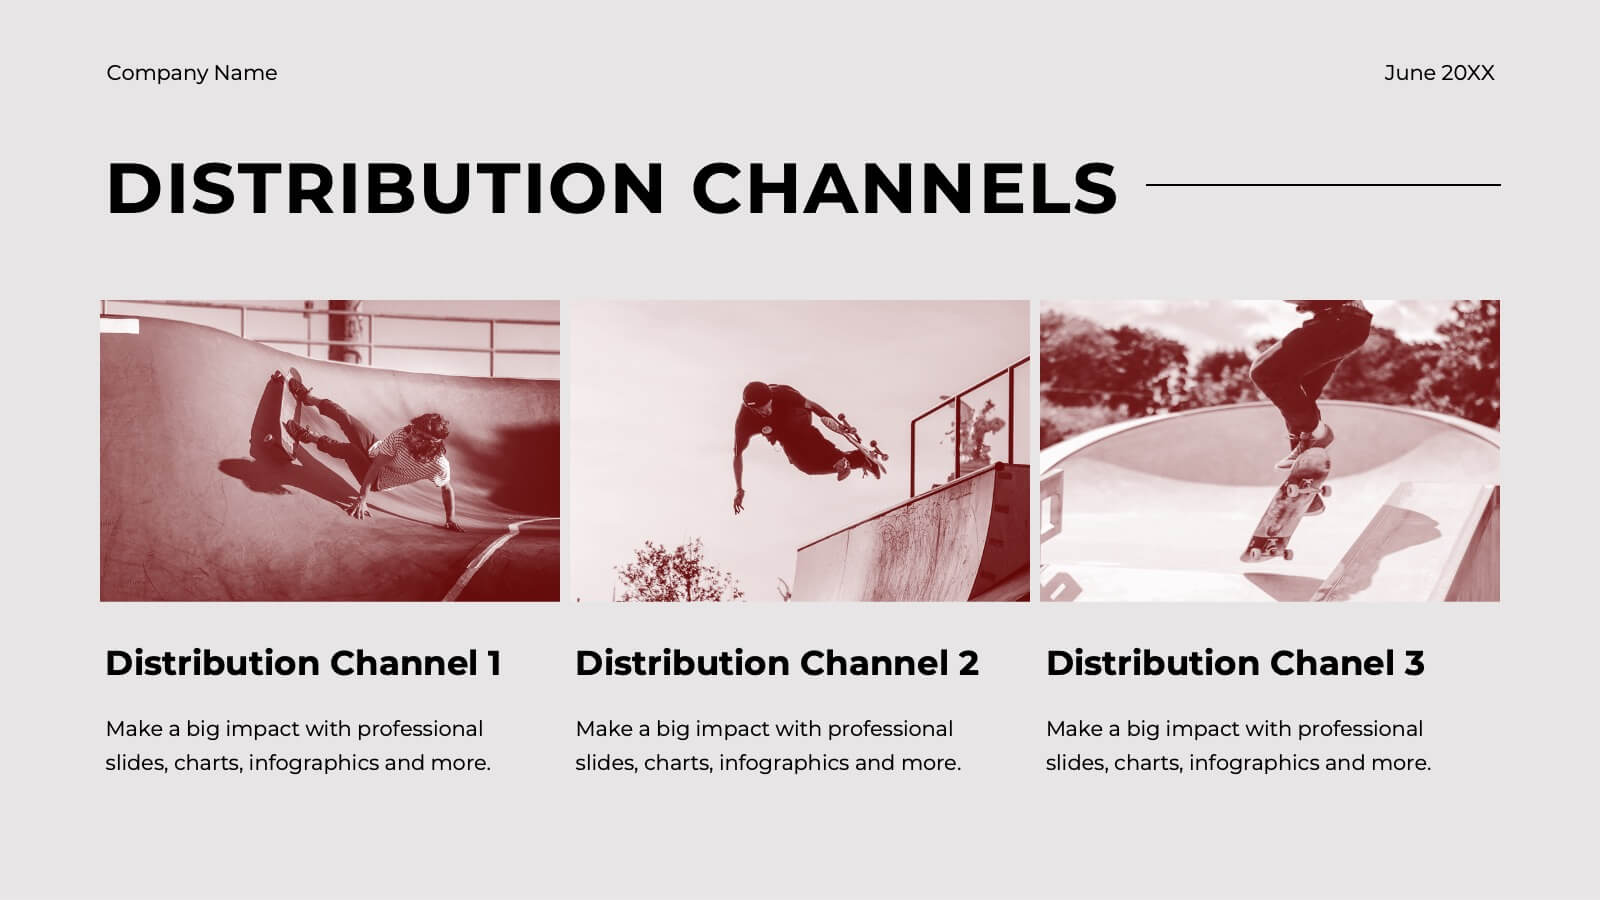
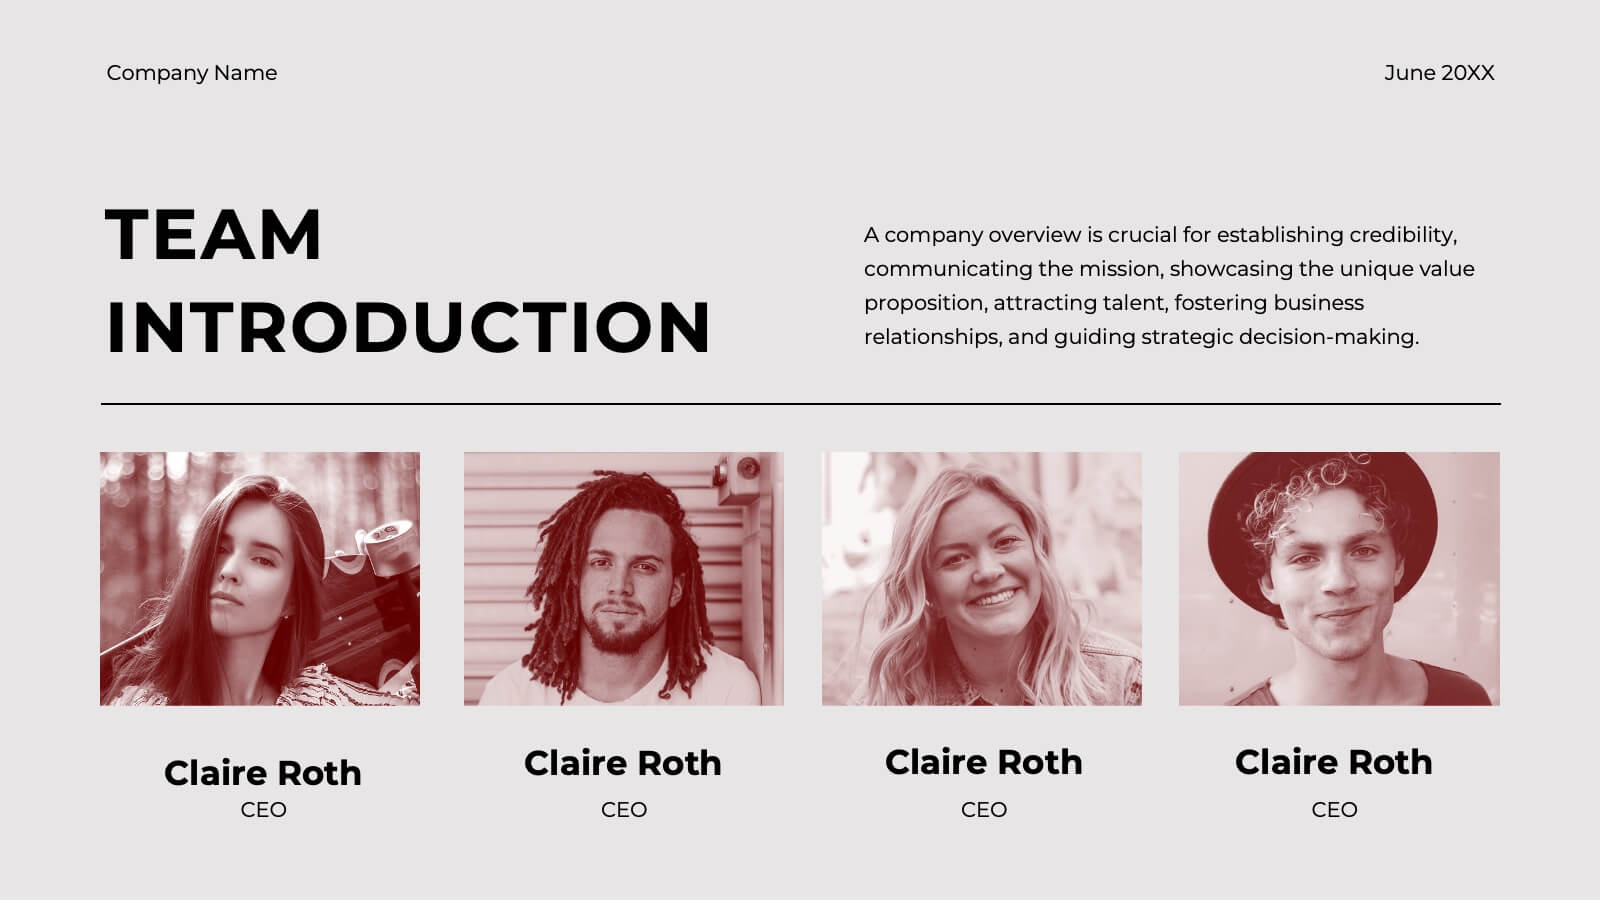
Ember Startup Growth Plan Presentation
Launch your entrepreneurial journey with this dynamic startup plan template! Perfect for detailing your mission, market strategy, and unique value proposition, it features professional slides for customer analysis, business models, and financial projections. Present your innovative ideas clearly and convincingly. Compatible with PowerPoint, Keynote, and Google Slides for seamless presentations on any platform.


5 slides
RAPID Decision-Making Framework Presentation
Streamline your choices and boost collaboration with a clear, structured framework that defines every role in the decision-making process. This modern circular layout helps teams visualize responsibilities, actions, and approvals for faster, smarter outcomes. Fully editable and compatible with PowerPoint, Keynote, and Google Slides for effortless customization and presentation.