


Features
- 12 Unique Slides
- Fully editable and easy to edit in Microsoft Powerpoint, Keynote and Google Slides
- 16:9 widescreen layout
- Clean and professional designs
- Export to JPG, PDF or send by email


Do you have any questions?
Recommend


7 slides
Pillar of Success Infographic
Pillars of Success is a metaphorical term used to describe principles or key elements that are essential for achieving success in various aspects of life, whether it's in personal development, business, education, relationships, or any other domain. This infographic template unveils the essential principles that constitute the very pillars upon which triumph and accomplishment stand. Compatible with Powerpoint, Keynote, and Google Slides. The pillars represent foundational factors that contribute to success. This template symbolizes the foundation of any successful venture, emphasizing the importance of a strong start.


7 slides
Agile Project Management Approach Presentation
Illustrate iterative planning and delivery cycles with this Agile Project Management Approach Presentation. The dynamic circular graphic paired with a horizontal flow arrow highlights six core steps in agile workflows. Ideal for scrum teams, product owners, or project leads, each phase is clearly labeled with editable titles and content placeholders. Fully customizable and compatible with PowerPoint, Keynote, and Google Slides.


5 slides
Business Model Canvas Overview Presentation
Streamline your business strategy with the Business Model Canvas Overview Presentation. Designed for entrepreneurs, startups, and strategists, this template visualizes key partners, activities, value propositions, customer segments, revenue streams, and more. Fully editable for PowerPoint, Keynote, and Google Slides, ensuring a structured and professional business plan presentation.


3 slides
Workflow Improvement and Progress Chart Presentation
Folders aren't just for files—they’re perfect for ideas too. This visual chart maps out streamlined processes, making it easier to track progress and improve internal workflow. Great for managers and teams, this infographic presentation template is fully compatible with PowerPoint, Keynote, and Google Slides for effortless editing and sharing.


7 slides
Modern Education Infographic
Immerse yourself in the evolving world of learning with our Modern Education Infographic. With a crisp white canvas, the design incorporates an energizing mix of orange, the trust-building hue of blue, and a dash of passionate red. This template boasts modern infographics, bespoke icons, and versatile image placeholders, offering a visual guide to contemporary educational methods, tools, and trends. Precision-made for Powerpoint, Keynote, or Google Slides. Ideal for educators, curriculum developers, edtech startups, or any professional keen on showcasing the transformation in learning techniques.


5 slides
Agile Workflow and Role Breakdown Presentation
Visualize Agile processes with this streamlined workflow and role breakdown diagram. Perfect for Scrum teams and project leads, this layout maps out five stages using arrows, icons, and a circular feedback loop. Easily editable in PowerPoint, Keynote, and Google Slides to fit any development cycle or team structure.


7 slides
Blue Ocean Strategy Infographic Presentation Template
The Blue Ocean strategy is a highly practical, step-by-step process for leaders to create uncontested market space and make the competition irrelevant. With this template you will be able to identify and capitalize on the growth opportunities your company has been overlooking or avoiding due to industry constraints. Our template is designed to help you identify market opportunities and formulate your strategy to avoid the threat of competition. Use this as a graphic organizer to help you think about how you can best compete in the marketplace. This template is perfect for your next presentation!


7 slides
Innovation Strategy Infographic Presentation
An Innovation Infographic presents information related to innovation, including why it is important, and how it can be managed in different contexts. Innovation is the process of developing new ideas and products that create value and drive progress. This template is designed to help you effectively communicate the importance of innovation and provide tips and strategies for managing it. This template includes seven customizable layouts and charts, and allows you to include your own images. The template also includes editable text boxes and bullet points to present your information.


5 slides
Hierarchical Structure in Triangle Format Presentation
Clearly illustrate levels of authority or stages of growth with the Hierarchical Structure in Triangle Format Presentation. This layout features a visually stacked triangle with color-coded segments, each layer representing a tier or level of information. Ideal for organizational charts, value pyramids, or priority structures. Each section includes a title, icon, and description area to keep your message clear and impactful. Fully editable in PowerPoint, Keynote, and Google Slides.


6 slides
Social Science Infographics
The "Social Science" infographic template is an intellectually stimulating and visually engaging tool, thoughtfully designed for PowerPoint, Keynote, and Google Slides. This template is a brilliant resource for educators, researchers, and students who seek to present the multifaceted aspects of social sciences in a clear and compelling manner. This template skillfully encompasses various disciplines within social science, such as anthropology, sociology, psychology, and political science. It presents key theories, methodologies, and findings in an organized and digestible format. This makes it an invaluable aid for academic presentations, research proposals, or educational discussions, facilitating a deeper understanding of human society and social relationships. The design is as thought-provoking as the subject it represents, with a color scheme that stimulates intellectual curiosity while maintaining clarity and focus. This not only enhances the visual appeal of the presentation but also complements the analytical and reflective nature of social science. Whether used in a lecture hall, a conference, or a study group, this template ensures that the complex world of "Social Science" is presented in an engaging, informative, and visually captivating manner.


21 slides
Minoan Project Timeline Presentation
Step back in time with this beautifully crafted Minoan-inspired presentation, perfect for outlining your project timeline! With an elegant design and clear structure, this template helps you showcase key milestones, deadlines, and deliverables in a visually stunning way. Keep your project on track. Compatible with PowerPoint, Keynote, and Google Slides.


6 slides
Conversion Funnel Stages Overview Presentation
Visualize user journeys with clarity using the Conversion Funnel Stages Overview Presentation. This funnel diagram template breaks down key conversion phases—from awareness to decision—into distinct, color-coded stages. Ideal for marketing reports, sales strategies, or product demos. Fully editable in PowerPoint, Google Slides, and Canva.


21 slides
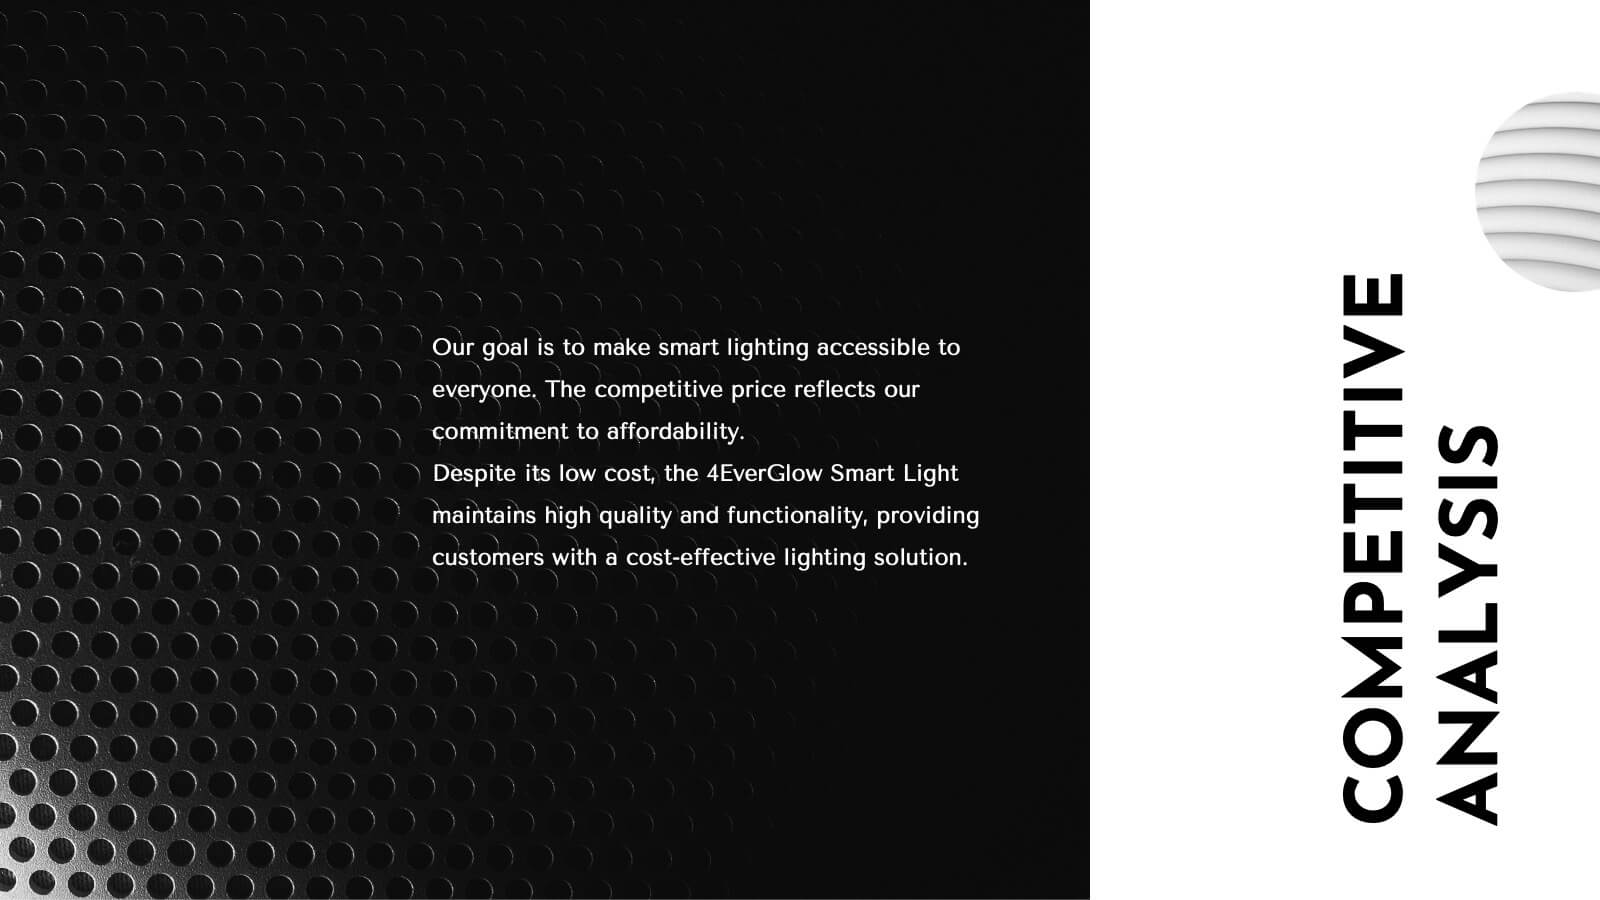
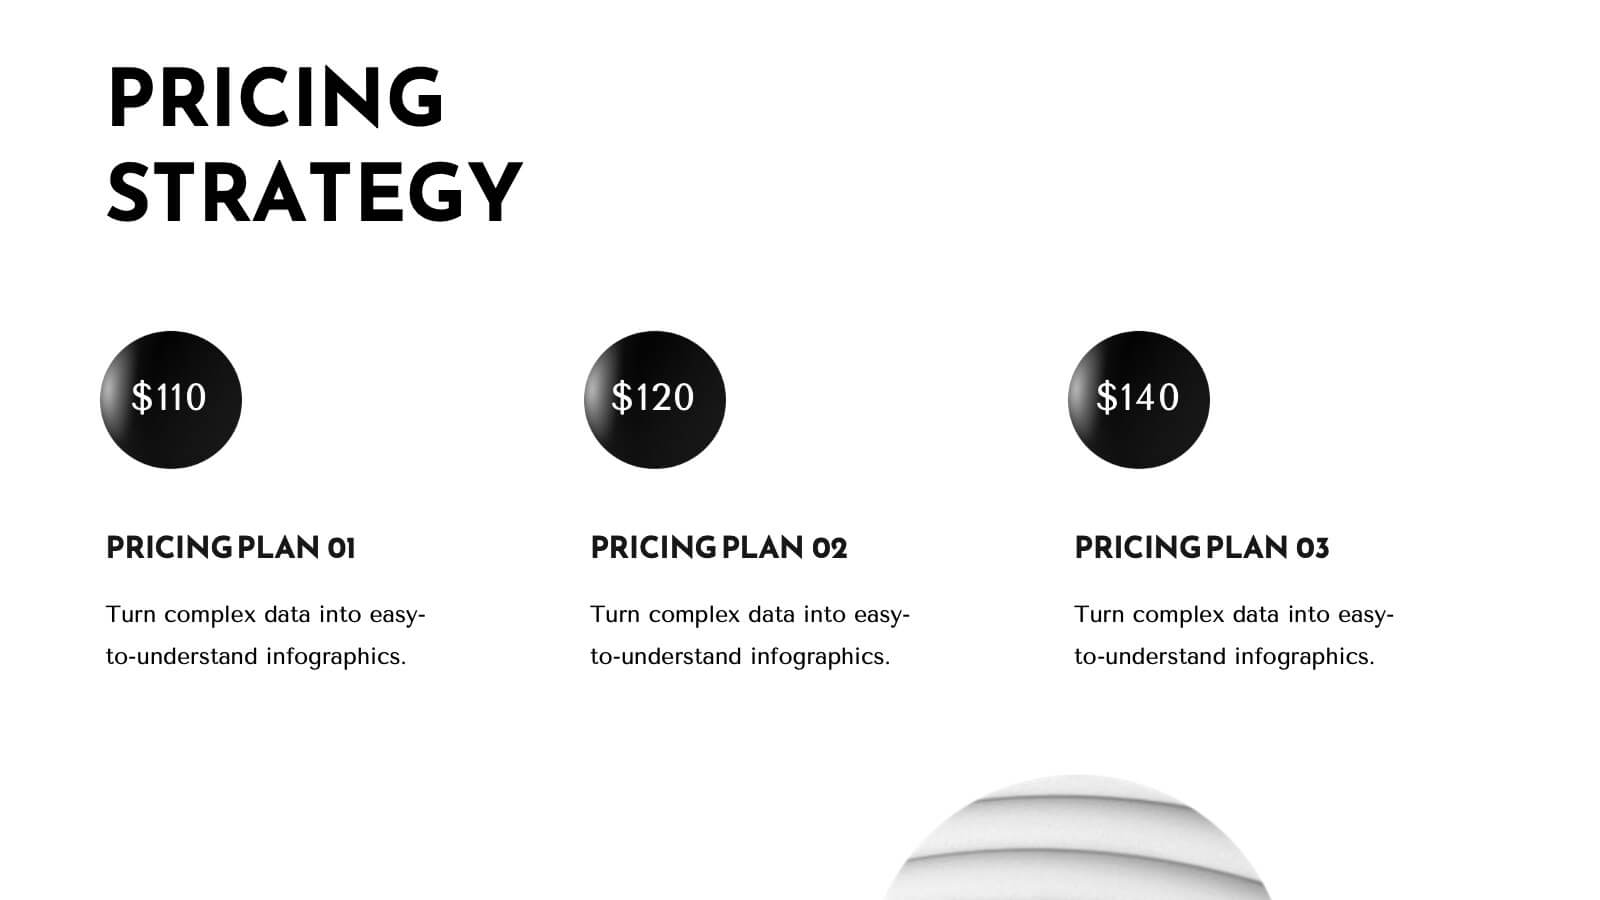
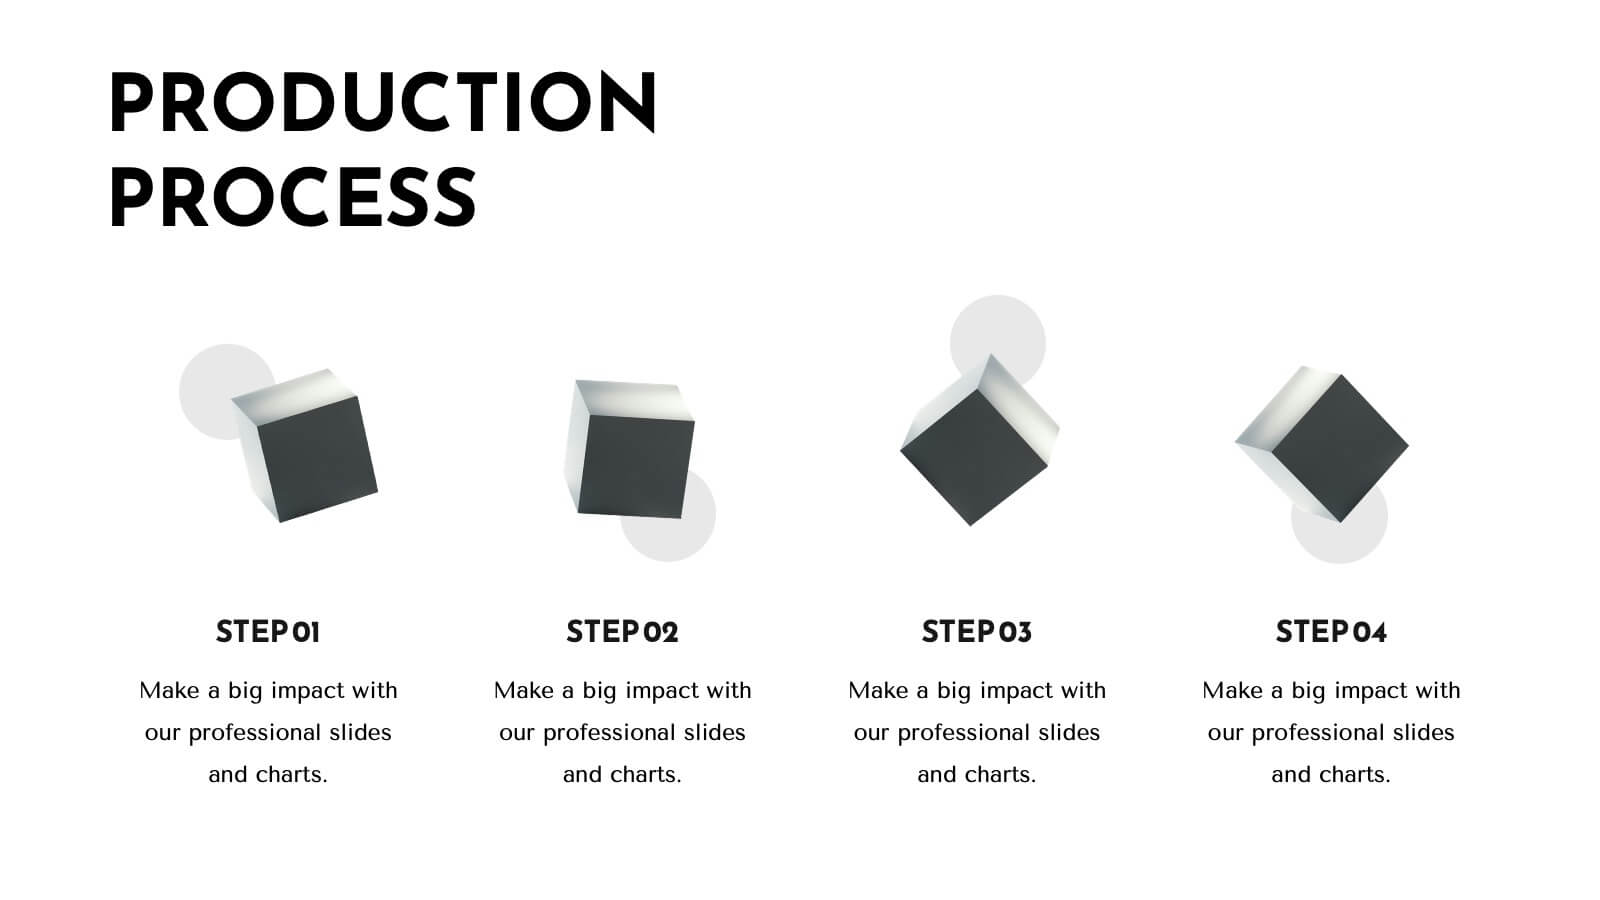
Trident Product Development Plan Presentation
Present your product development strategy with this sleek, professional template! Highlight company overview, product features, and unique selling proposition. Ideal for showcasing market analysis, pricing strategy, and production process. Perfect for developers and project managers. Compatible with PowerPoint, Keynote, and Google Slides.


6 slides
Product Development Lifecycle Presentation
Visualize each stage of your product’s journey with this sleek infinity loop diagram template. Perfect for outlining development processes, continuous improvement cycles, or iterative workflows. Fully editable in Canva, PowerPoint, and Google Slides, it delivers a clear, modern design to communicate lifecycle stages with impact and professional appeal.


6 slides
RAPID Roles and Responsibilities Slide Presentation
Make teamwork crystal clear with a structured chart that defines who does what and when. This organized layout helps map decision-making roles, streamline collaboration, and prevent confusion in complex projects. Easy to edit and ready to use, it’s fully compatible with PowerPoint, Keynote, and Google Slides for smooth customization.


20 slides
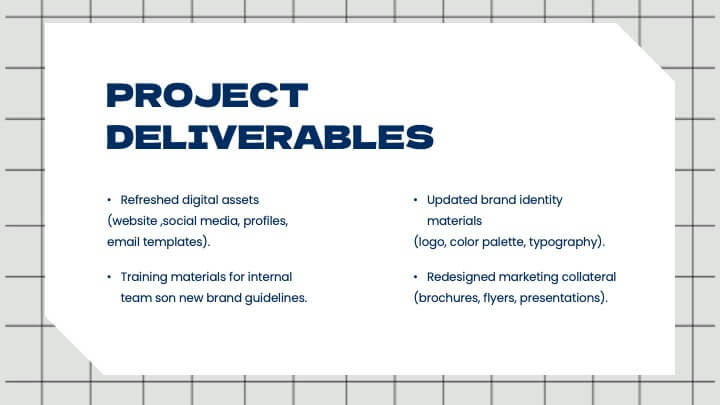
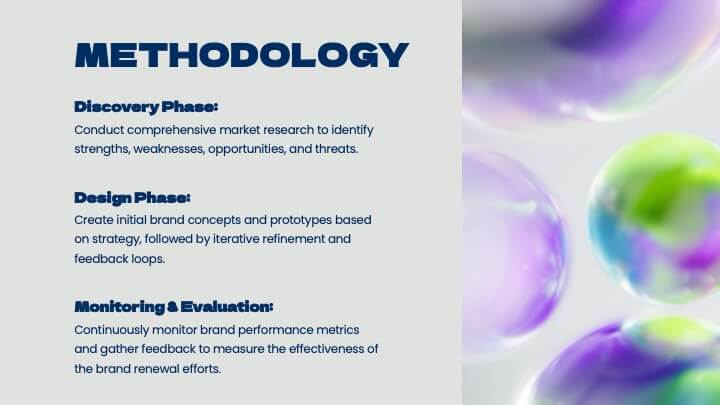
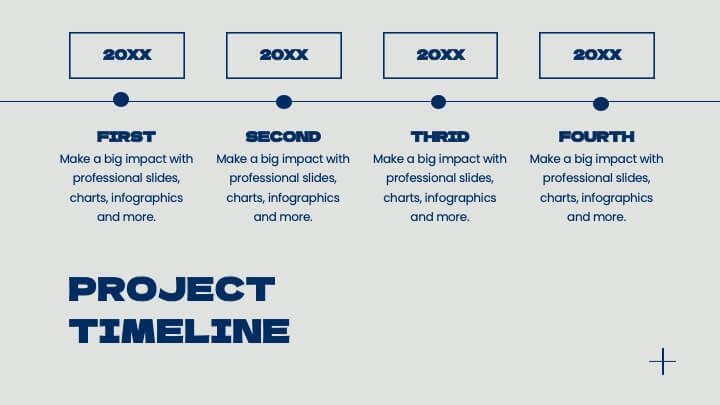
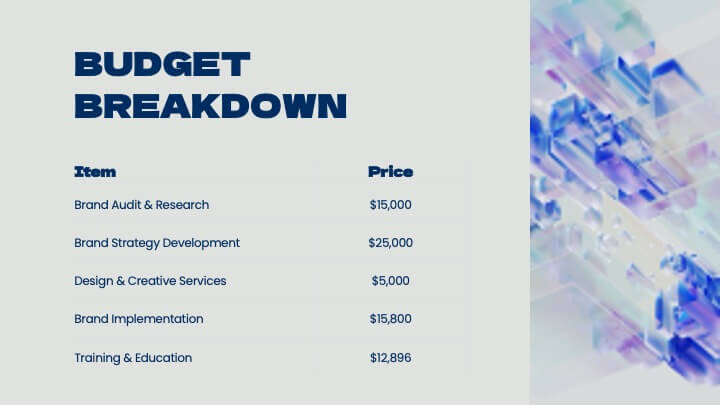
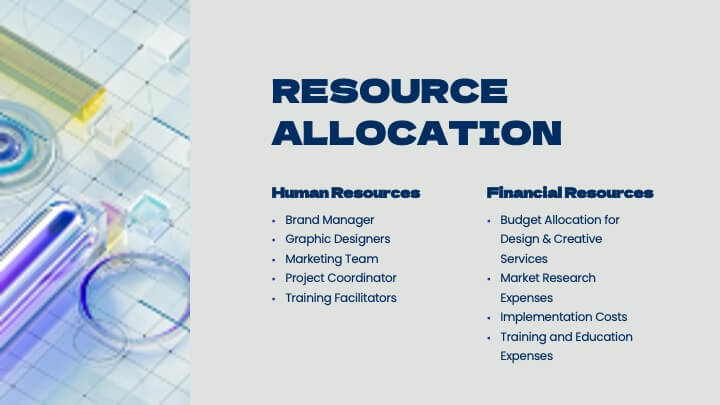
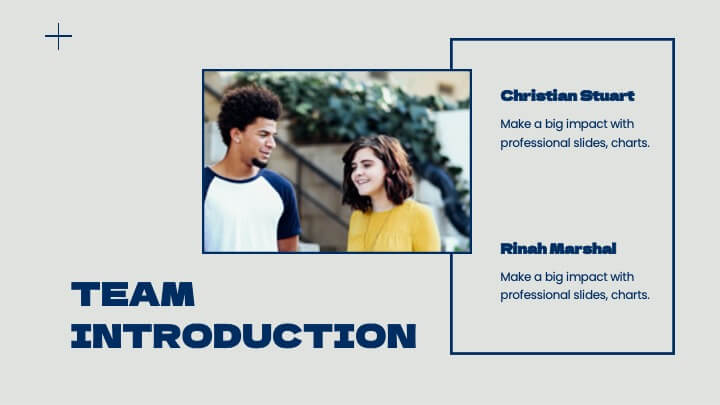
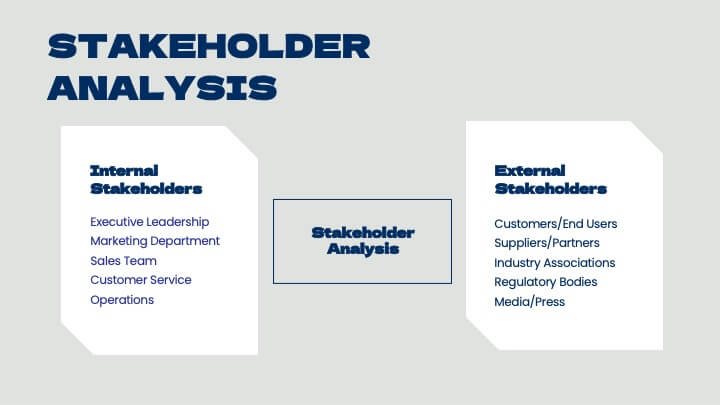
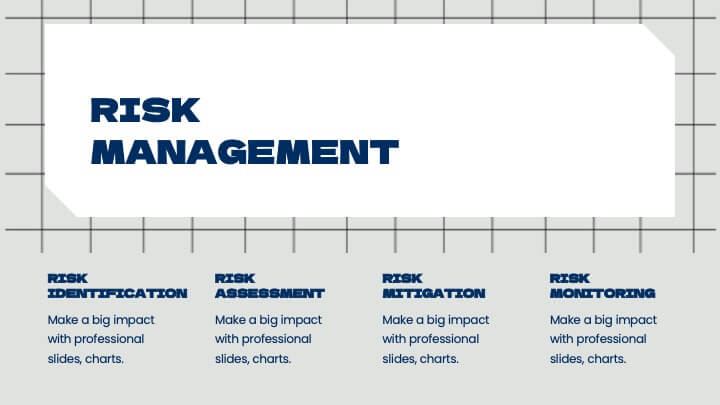
Elementra Marketing Proposal Presentation
Elevate your marketing initiatives with this professional and well-structured proposal template. Covering essential sections such as objectives, goals, budget breakdown, timeline, and pricing structure, this presentation helps you effectively communicate your strategy to stakeholders and clients. Its clean, modern design ensures clarity and engagement, making it ideal for pitching ideas and securing approvals. Fully customizable and compatible with PowerPoint, Keynote, and Google Slides.


7 slides
Concentric Circle Diagrams Infographic Presentation Template
Concentric Circle Diagrams can display interrelated and independent units of a concept in overlapping circular designs. The diagram is really helpful for organizing information, displaying relationships among concepts, showing whole-part relationships and more. It uses overlapping circular designs to display ideas and separate them with their own size, color and position on a chart. This template contains a variety of circular diagram that display in overlapping different-shaded circles. This template can be used to demonstrate the relationship of all elements to the central idea.