


Features
- 12 Unique Slides
- Fully editable and easy to edit in Microsoft Powerpoint, Keynote and Google Slides
- 16:9 widescreen layout
- Clean and professional designs
- Export to JPG, PDF or send by email


Do you have any questions?
Recommend


5 slides
Letter Recognition Chart Presentation
Enhance learning and data visualization with this Letter Recognition Chart Presentation template. Featuring a modern, stepwise design with speech bubbles, this layout is perfect for education, branding, and business-related presentations. Fully customizable and compatible with PowerPoint, Keynote, and Google Slides.


8 slides
Corporate Annual Summary Report Presentation
Visualize your company's yearly progress with the Corporate Annual Summary Report Presentation. This professional template highlights quarterly results using progress circles and percentage data, making it easy to track key milestones and performance. Perfect for board meetings and stakeholder reports. Fully editable in Canva, PowerPoint, and Google Slides.
4 slides
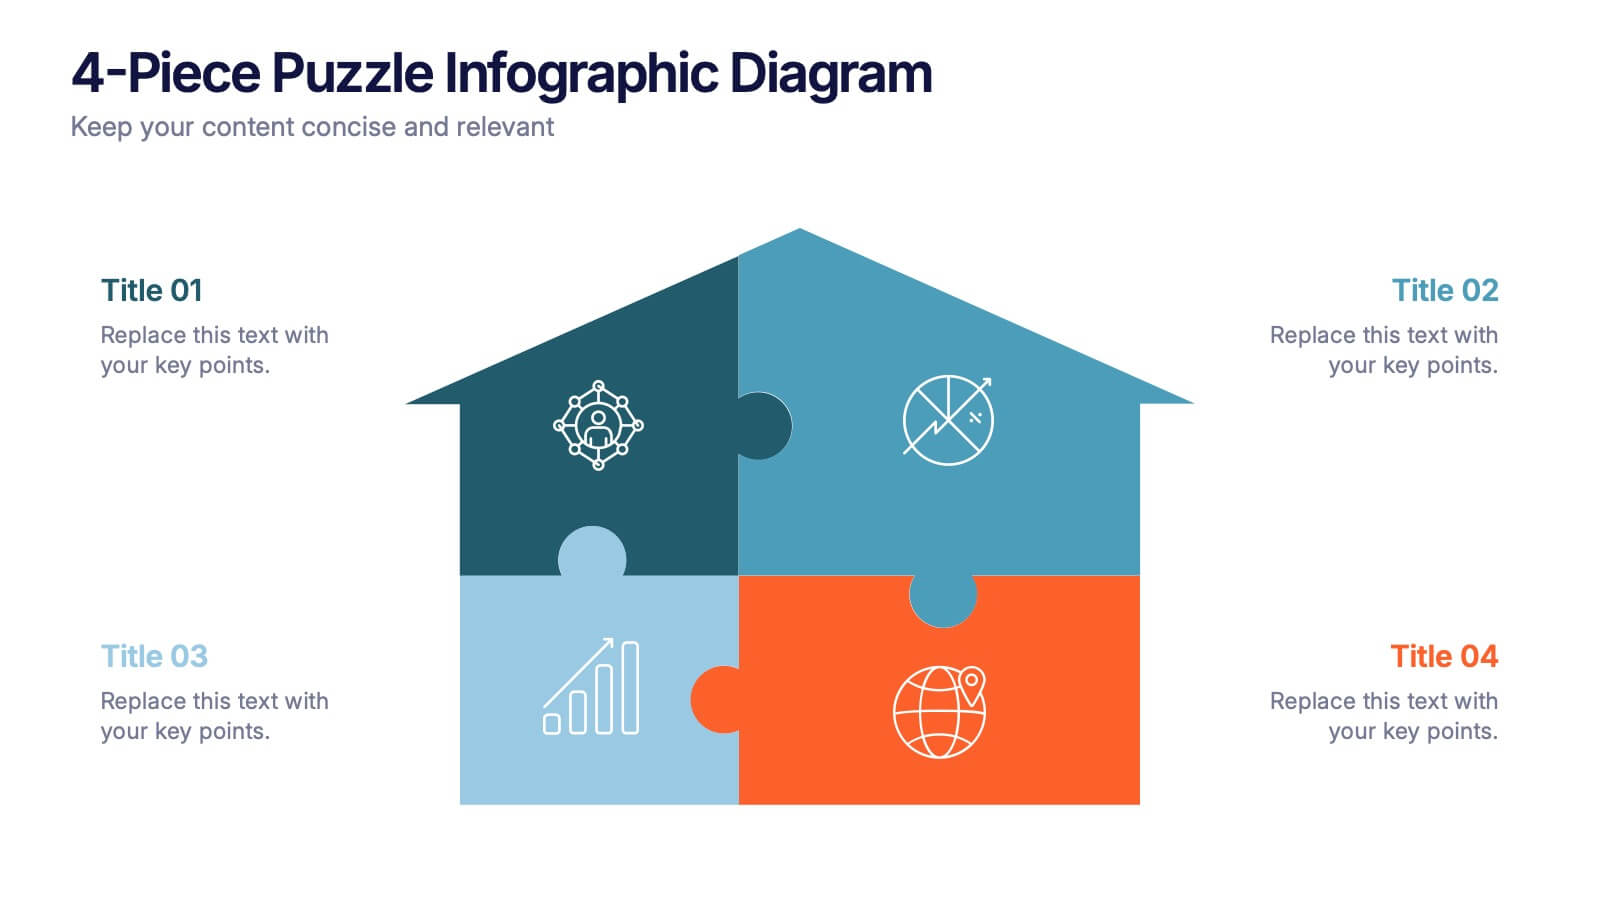
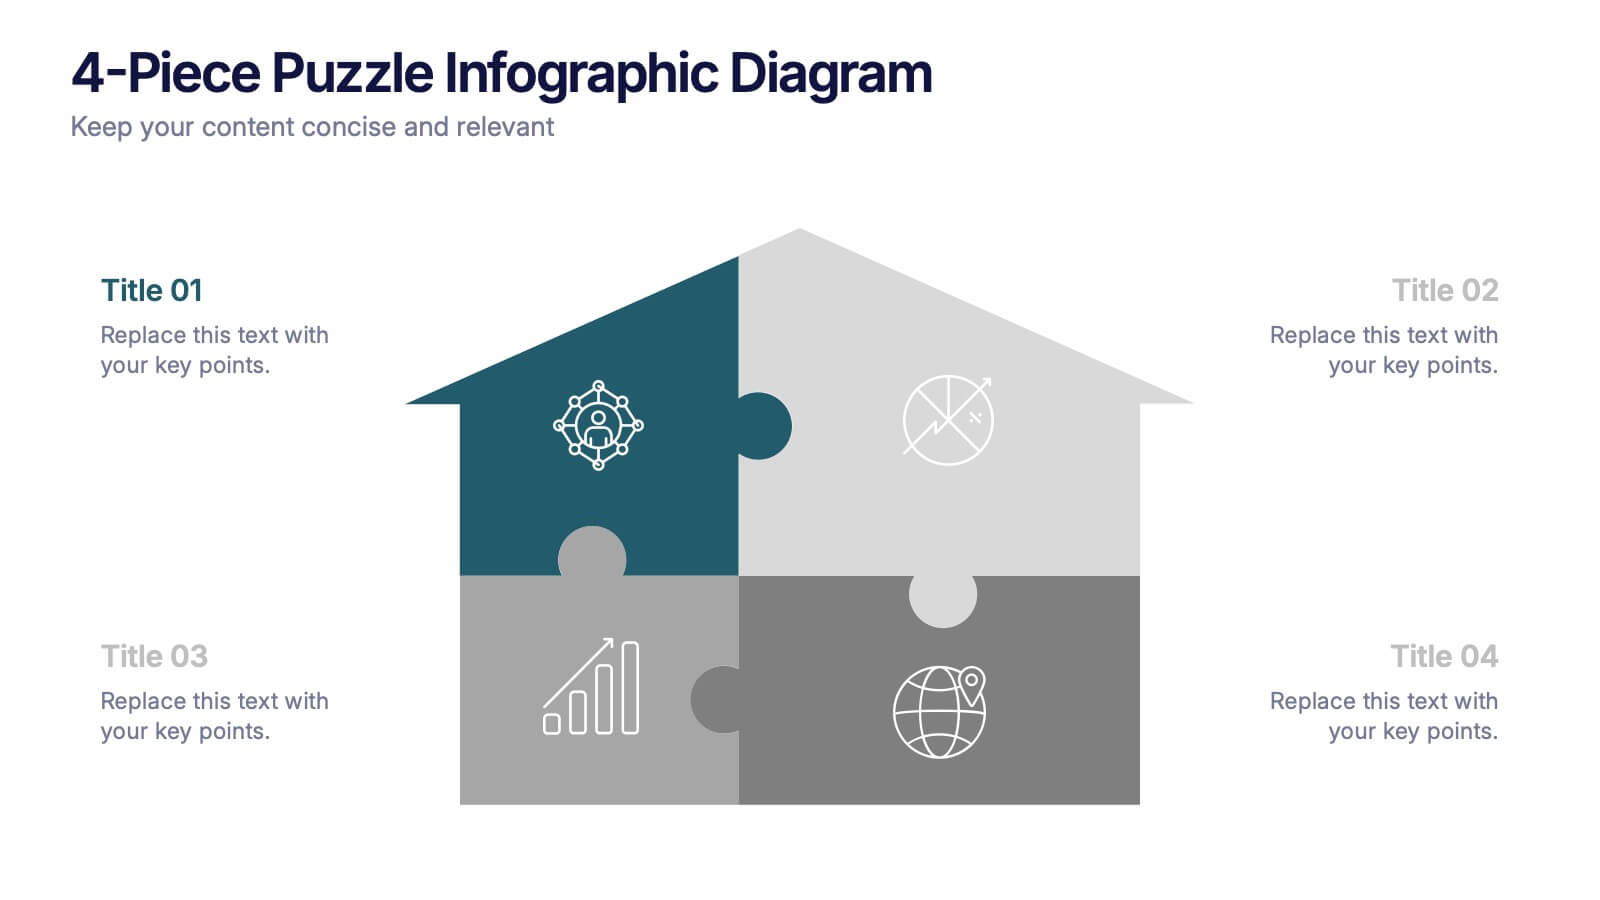
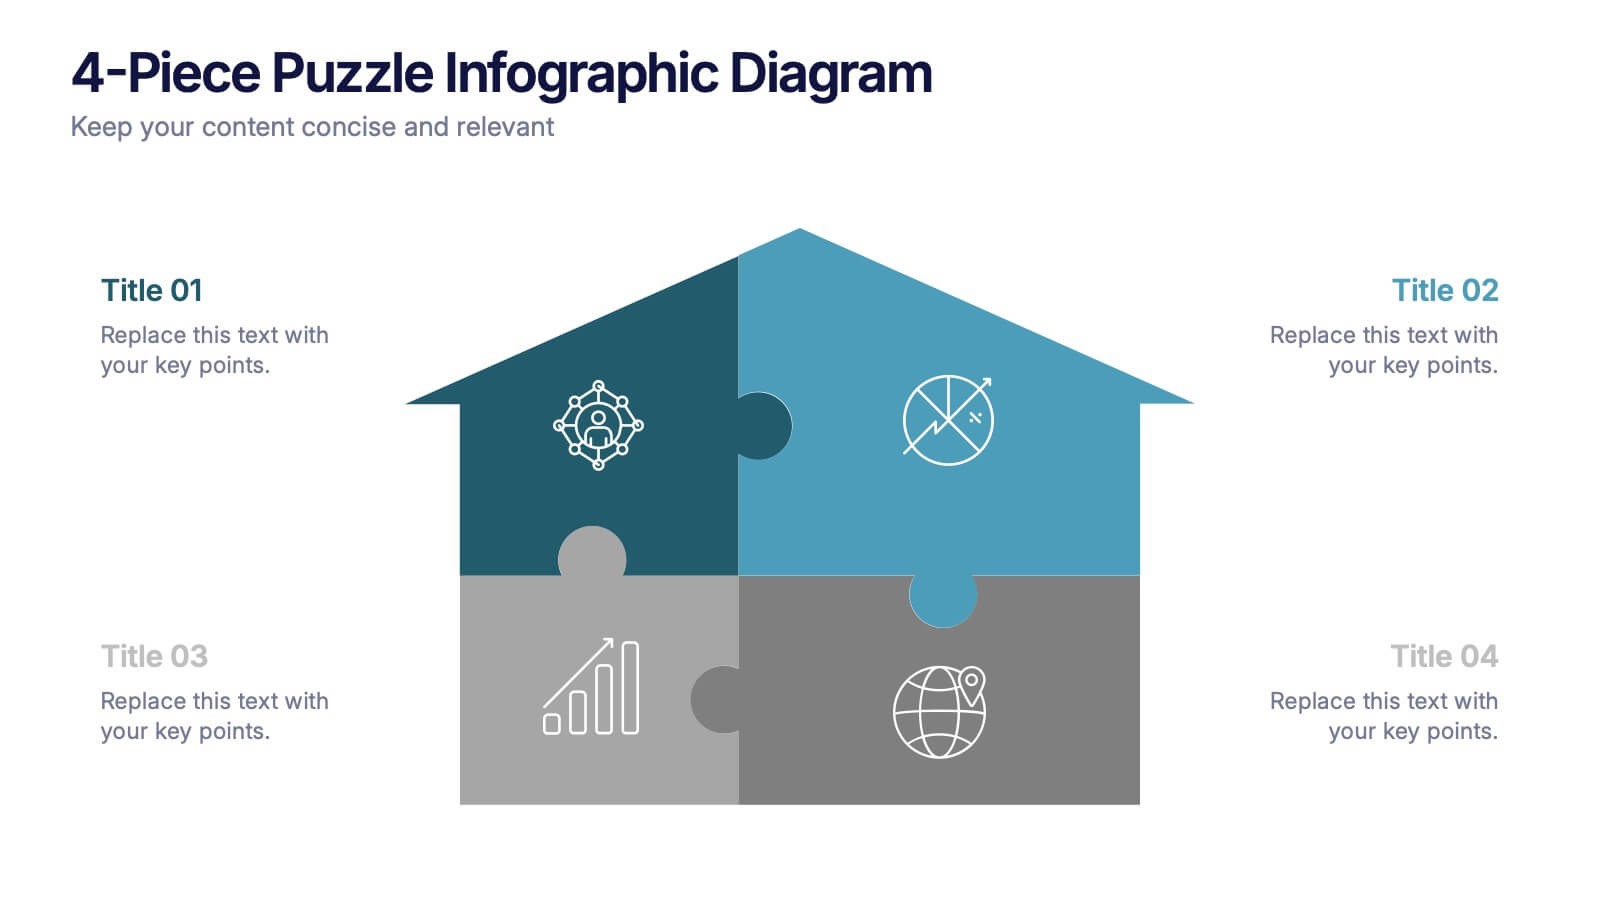
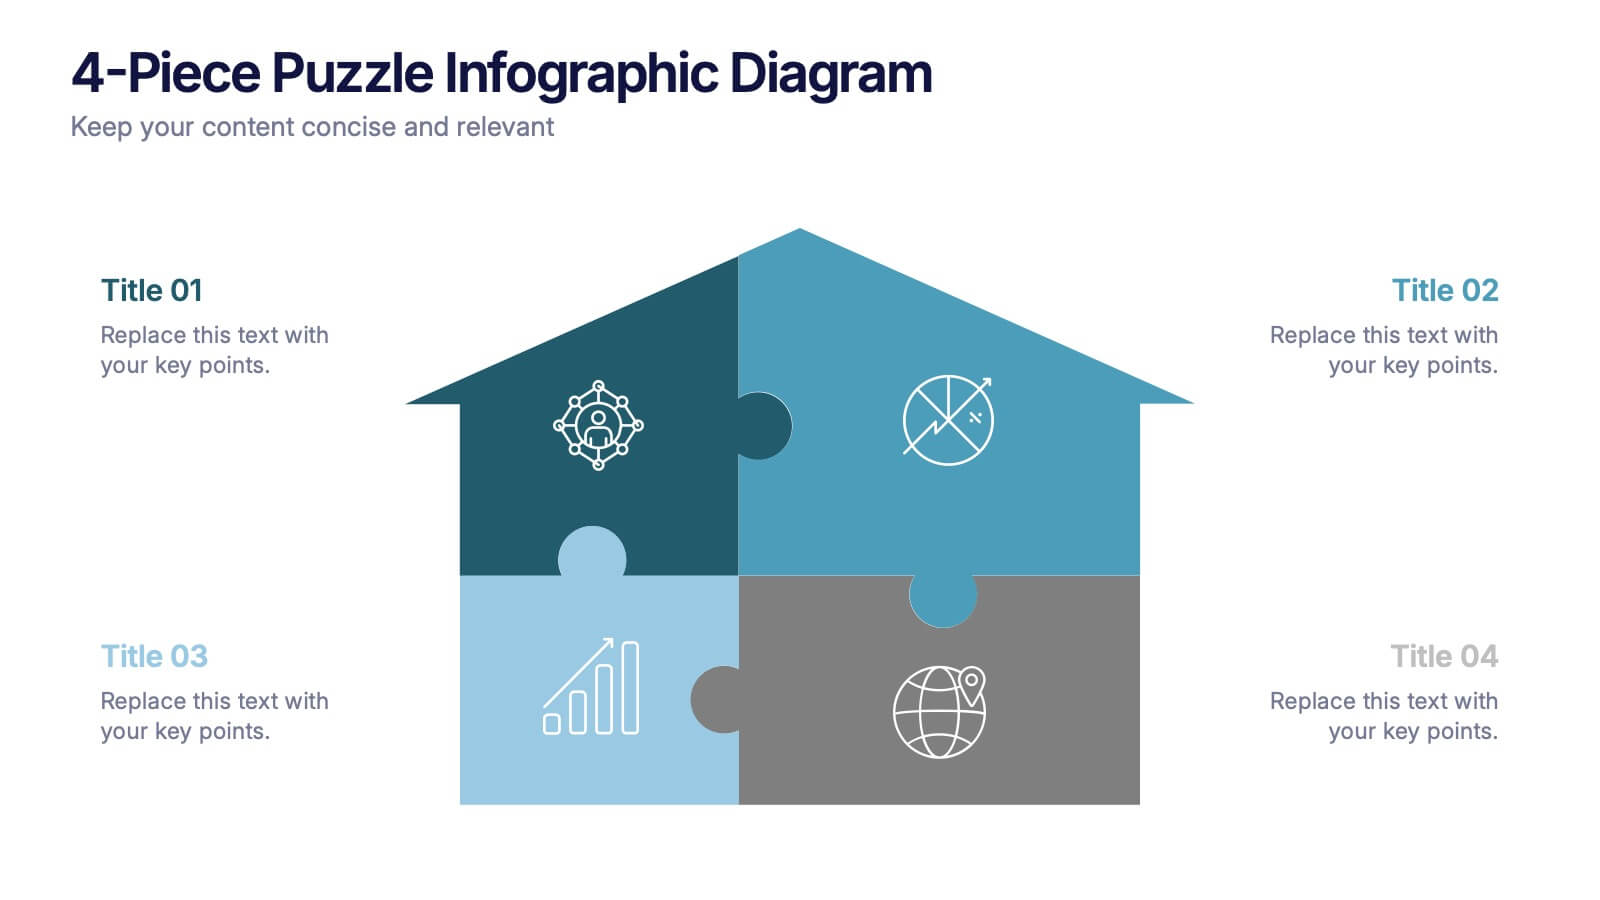
4-Piece Puzzle Infographic Diagram Presentation
Bring clarity and impact to your message with a visual layout that snaps big ideas together like a puzzle. This presentation helps you break complex concepts into four connected sections, making explanations easier and more engaging for any audience. Ideal for planning, insights, or strategy sessions. Fully compatible with PowerPoint, Keynote, and Google Slides.


4 slides
Legal Overview and Policy Summary Presentation
Present legal insights with clarity using the Legal Overview and Policy Summary Presentation. This scale-themed design is ideal for outlining compliance, governance, or internal policies. Each section is visually balanced to reflect fairness and structure. Fully editable for use in PowerPoint, Keynote, and Google Slides.


6 slides
Vision to Execution Business Strategy Presentation
Bridge the gap between strategic vision and operational execution with this visual funnel-style template. Ideal for mapping high-level goals to tactical outcomes, this slide helps communicate transformation processes, business initiatives, or product strategies. Fully editable in PowerPoint, Keynote, or Google Slides for strategic planning, leadership sessions, or roadmap presentations.


5 slides
Agile and Waterfall PM Models Presentation
Compare two popular project methodologies with ease using the Agile and Waterfall PM Models Presentation. This side-by-side layout highlights key differences in structure, flexibility, and delivery approach—perfect for client briefings, team onboarding, or stakeholder reviews. Fully editable in PowerPoint, Google Slides, Keynote, and Canva for seamless customization.


5 slides
Harvey Ball Rating System Overview Presentation
Visualize performance ratings or feature comparisons with the Harvey Ball Rating System Overview Presentation. This template uses vertical bar visuals combined with Harvey ball icons to communicate progress, satisfaction, or status across four key areas. Clean, intuitive, and ideal for executive summaries or status dashboards. Fully editable and compatible with PowerPoint, Keynote, and Google Slides.


5 slides
Benefits of Insurance Infographics
The purpose of insurance is to mitigate the financial impact of unexpected events or circumstances that may result in financial loss. These infographic templates are versatile and effective tools to convey the value of insurance to your audience. These are perfect to highlight the various advantages and importance of having insurance coverage. This serves as an engaging tool to educate and inform your audience about the benefits of different types of insurance policies. This makes it easy for viewers to understand the benefits and importance of insurance in various aspects of life. Compatible with Powerpoint, Keynote, and Google Slides.


10 slides
Checklist and Action Plan List Presentation
Stay organized and achieve goals efficiently with this checklist and action plan template. Designed for task tracking, project management, and strategic planning, it provides a clear visual structure for prioritizing tasks. Perfect for professionals and teams aiming for productivity. Compatible with PowerPoint, Keynote, and Google Slides for seamless editing and presentation.


5 slides
Sex Education in Schools Infographics
Navigating the sensitive topic of sex education becomes approachable and comprehensible with our sex education in schools infographics template. Cast in shades of understanding purple and a spectrum of relatable colors, this creative yet educational tool is a boon for educators and advocacy groups. It simplifies complex concepts into visuals, fostering an environment of learning and open dialogue. Compatible with Powerpoint, Keynote, and Google Slides. The template features instructive graphics and discrete icons, curated specifically to aid in the delicate task of imparting sex education with respect, care, and factual accuracy.


8 slides
Business Strategy Alternatives
Present multiple strategic paths with this creative 4-way arrow infographic. Designed to clearly display four different options or directions, it’s ideal for scenario analysis, strategic planning, or decision-making meetings. Each path is paired with an icon and description for easy interpretation. Fully editable in PowerPoint, Keynote, and Google Slides.


7 slides
Travel Infographic Presentation Template
Our Travel Infographic is a gorgeous infographic template that allows you to instantly create a modern, stylish and eye-catching travel infographic. You can easily customize this travel infographic to suit all your needs in just a few minutes. This Travel Infographic is designed to used as a travel guide with tons of destinations, flight deals and tips to make your trip memorable. This template can be used to help you create dynamic visual content for your travels. This travel infographic is a perfect way to plan, organize and prepare for your next trip or for all the upcoming trips!


6 slides
Mission and Values Overview Presentation
Your company's purpose deserves a visually stunning story! This infographic presentation template helps you clearly outline core values and mission statements with an engaging, structured design. Ideal for business strategy meetings, corporate presentations, and branding discussions, it keeps your content professional and impactful. Fully customizable and compatible with PowerPoint, Keynote, and Google Slides.


5 slides
How to Prevent Cyberbullying Infographics
Cyberbullying is a serious issue that can have detrimental effects on individuals' mental and emotional well-being. These vertical infographics provide essential information and tips for preventing cyberbullying. These are designed to raise awareness about the issue and educate individuals on how to effectively address and prevent cyberbullying incidents. The infographics feature a visually appealing design with attention-grabbing colors, icons, and illustrations. The engaging visuals are intended to capture the attention of the audience and convey the seriousness of the topic. The infographics offer practical tips and strategies for preventing cyberbullying.


8 slides
Process Flowchart Presentation
Visualize your workflows effortlessly with this Process Flowchart template. Designed for business presentations, it helps map out key steps with a structured, gear-based design. Fully editable with customizable colors, icons, and text for seamless adaptation. Compatible with PowerPoint, Keynote, and Google Slides for maximum flexibility and ease of use.


6 slides
Quality Control Six Sigma Process Presentation
Bring clarity and energy to your workflow with this clean visual guide that outlines each phase of a structured improvement cycle. It helps communicate steps, responsibilities, and progress in a polished, professional way your audience can follow instantly. Fully compatible with PowerPoint, Keynote, and Google Slides.


10 slides
Social Media Marketing Growth Presentation
Boost your social media strategy with this dynamic infographic template! Perfect for illustrating marketing growth, engagement tactics, and content performance, it features an intuitive flow that simplifies complex data. Ideal for presentations to teams and clients, it’s fully customizable and works seamlessly with PowerPoint, Keynote, and Google Slides.