


Features
- 5 Unique slides
- Fully editable and easy to edit in Microsoft Powerpoint, Keynote and Google Slides
- 16:9 widescreen layout
- Clean and professional designs
- Export to JPG, PDF or send by email


Do you have any questions?
Recommend


21 slides
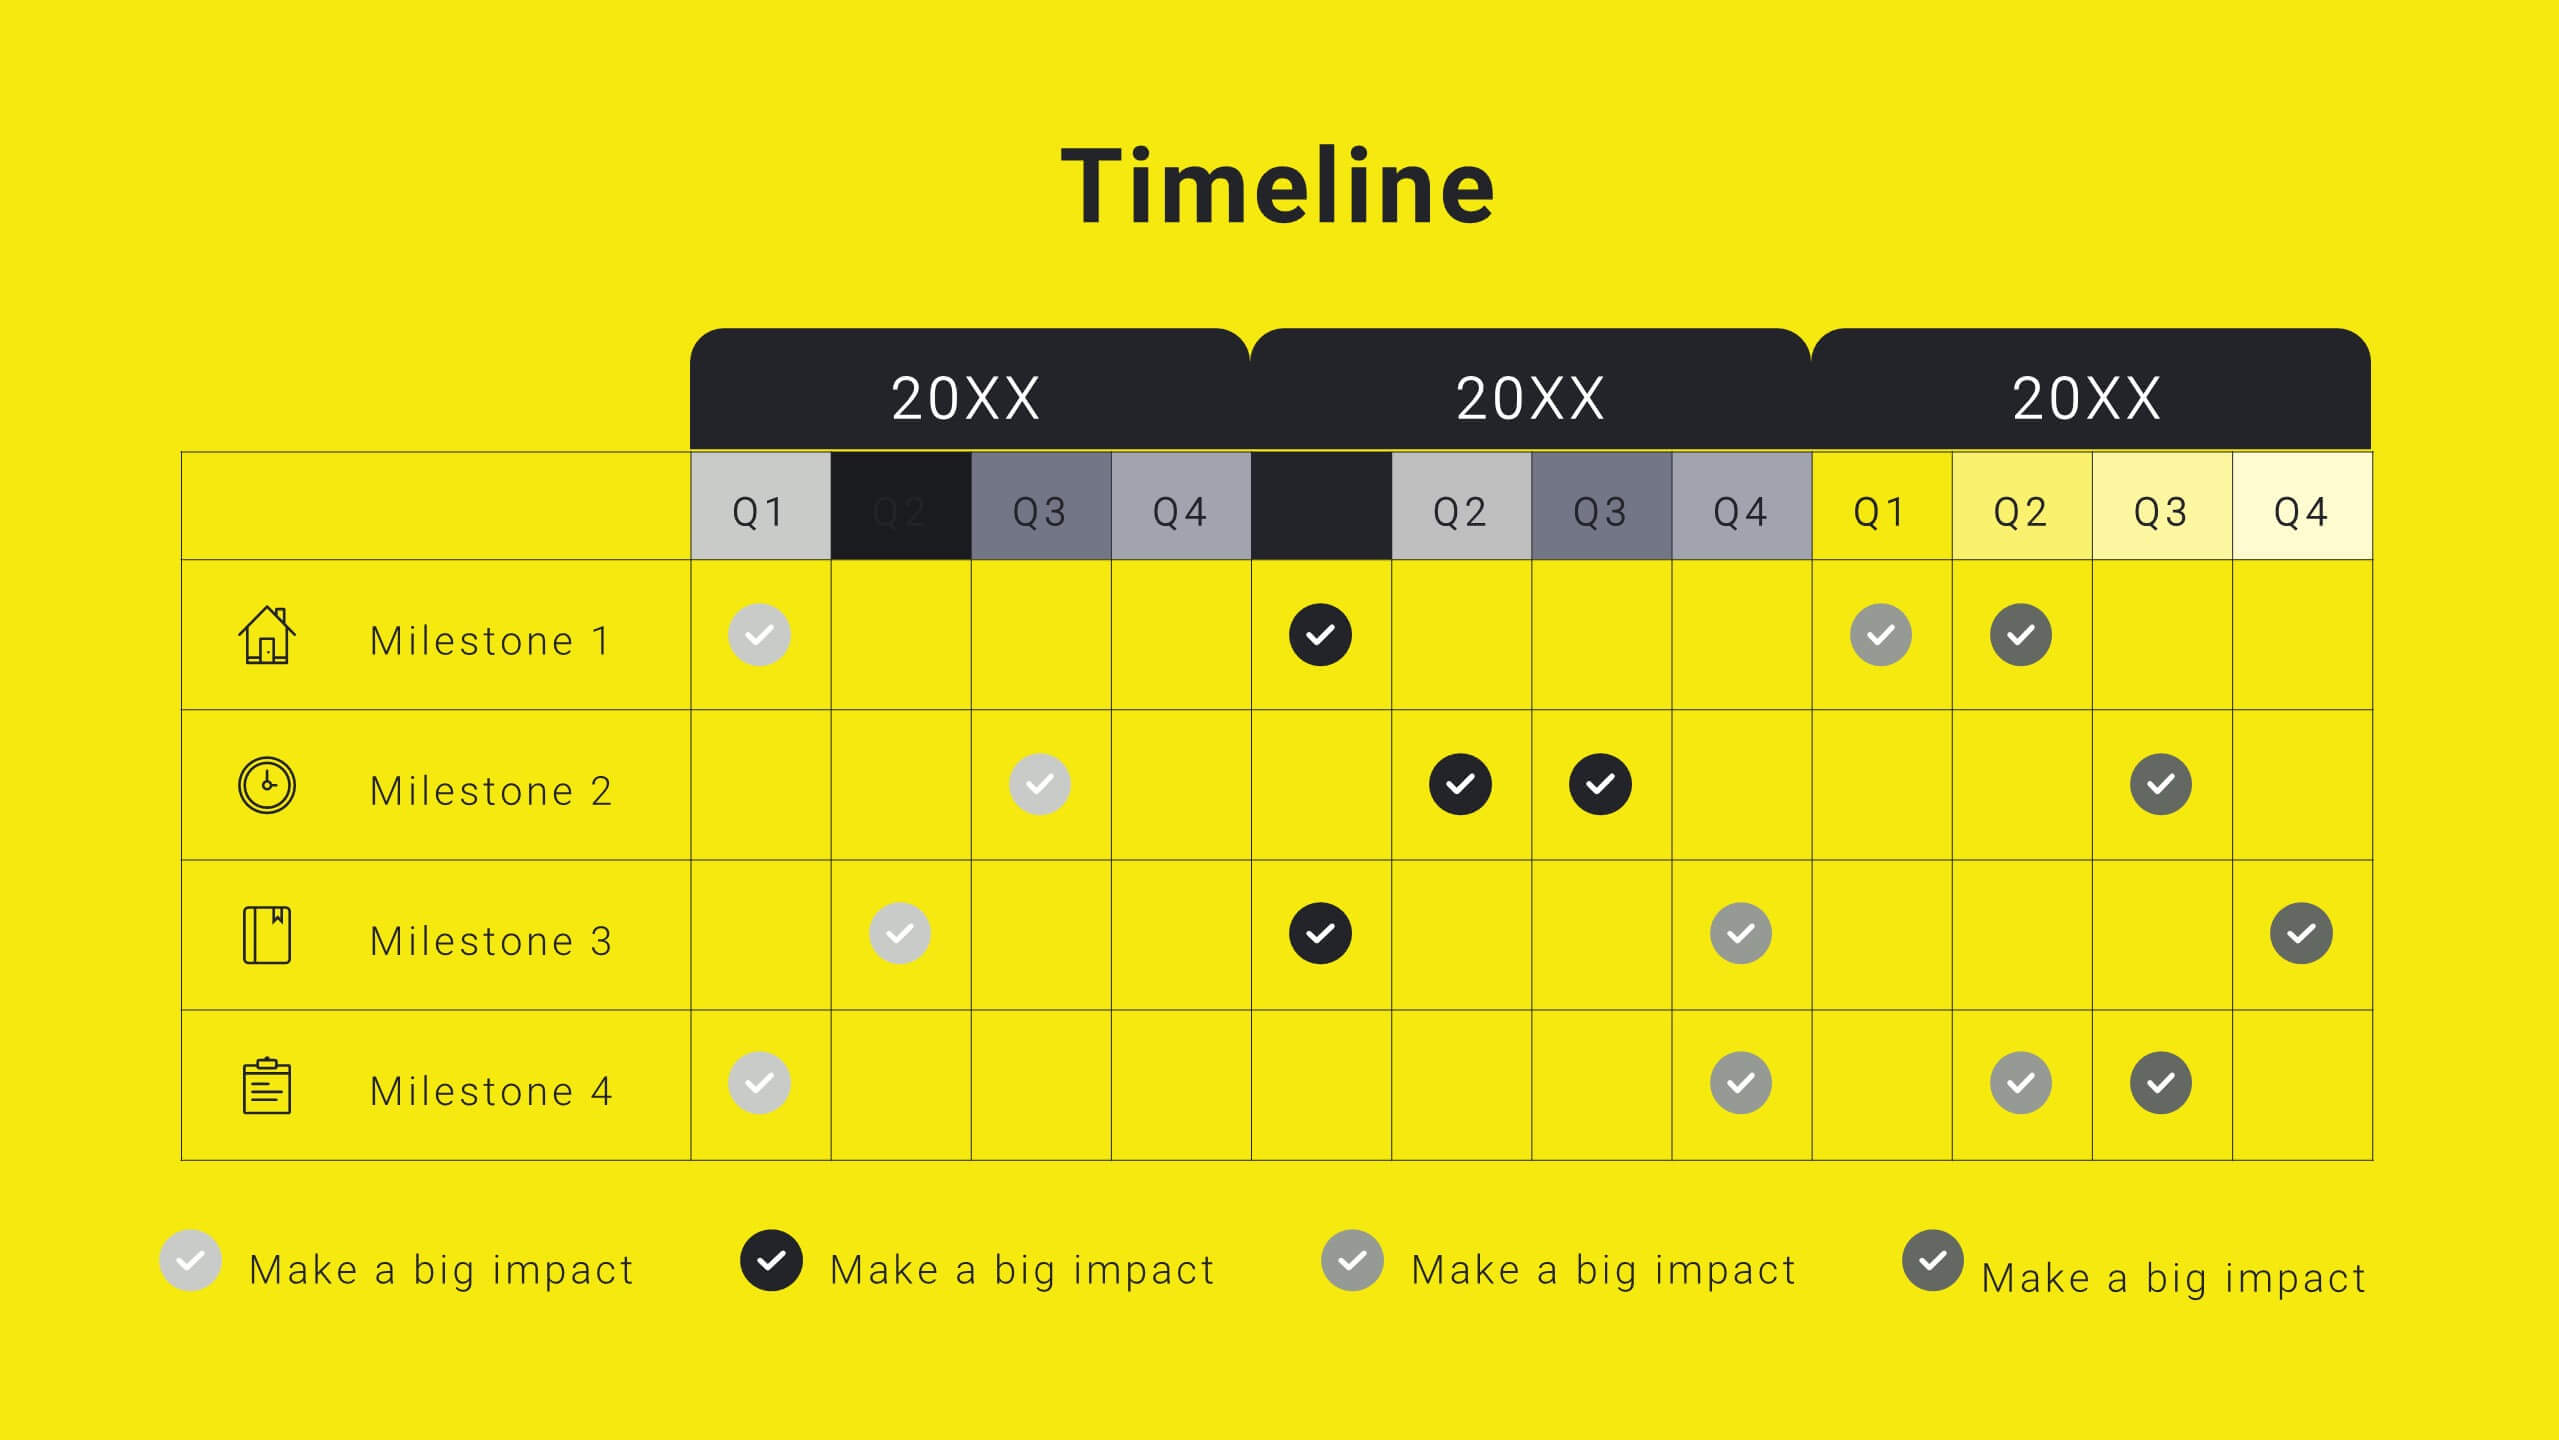
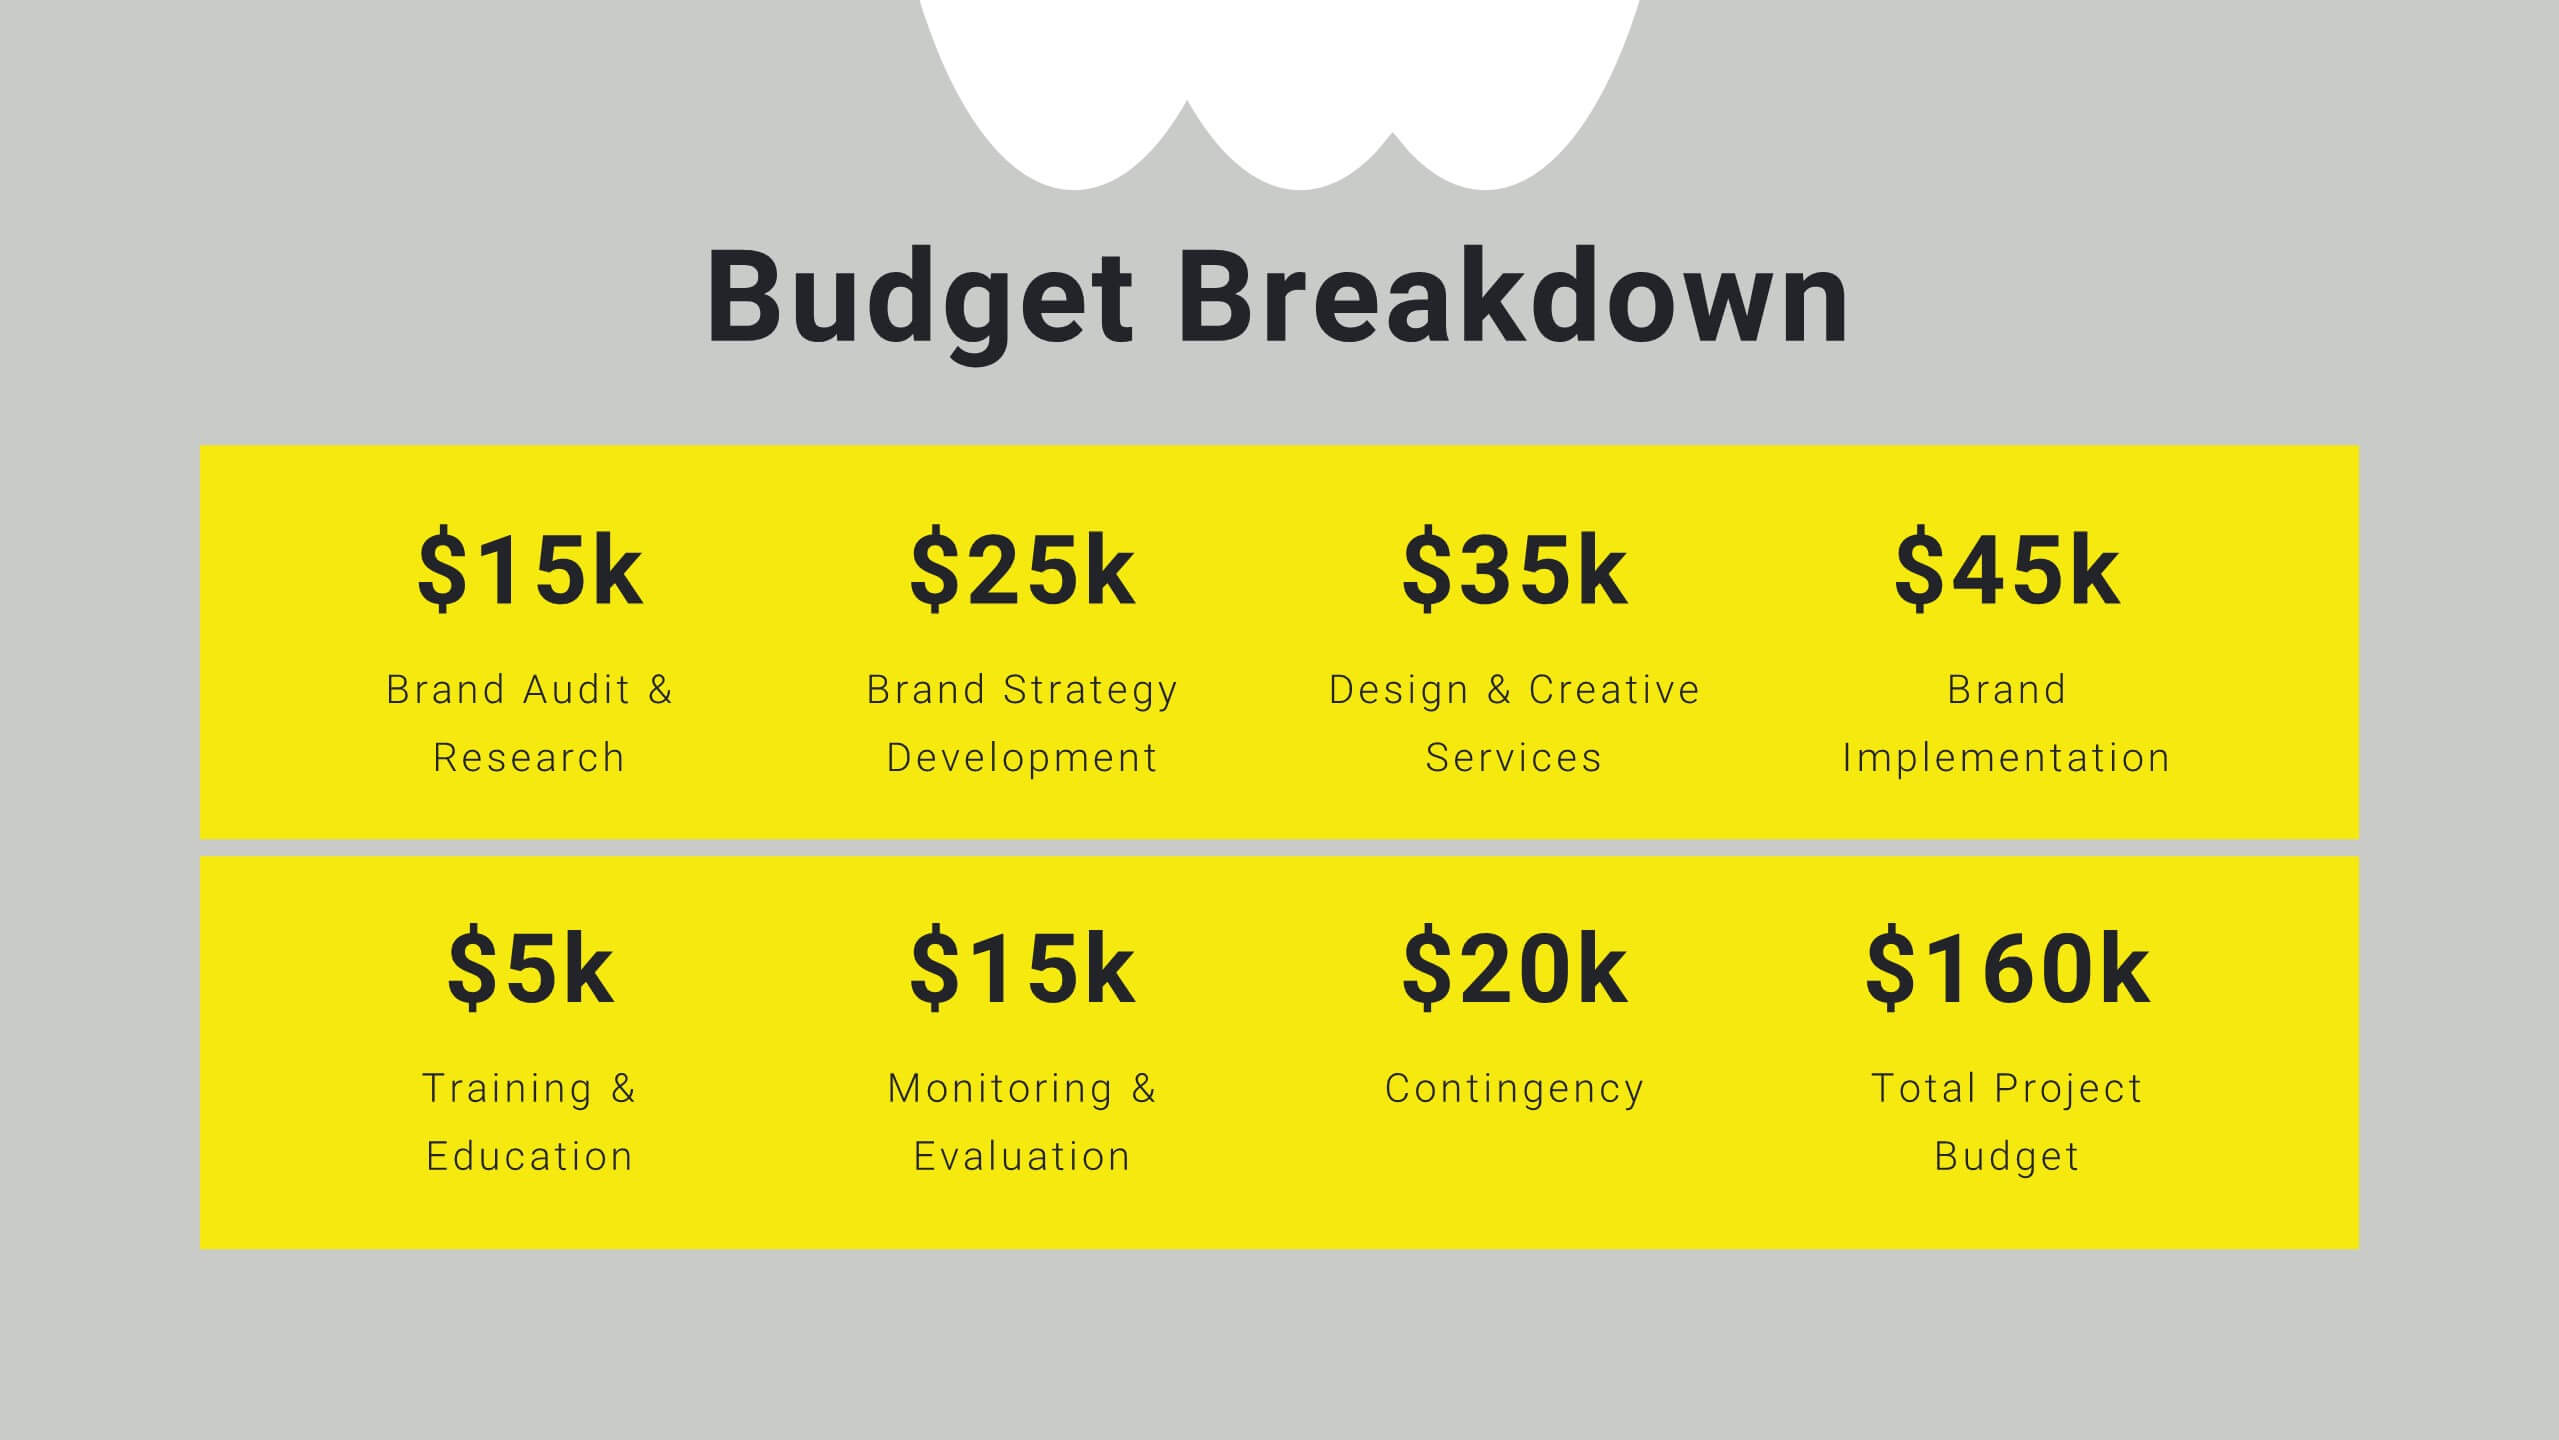
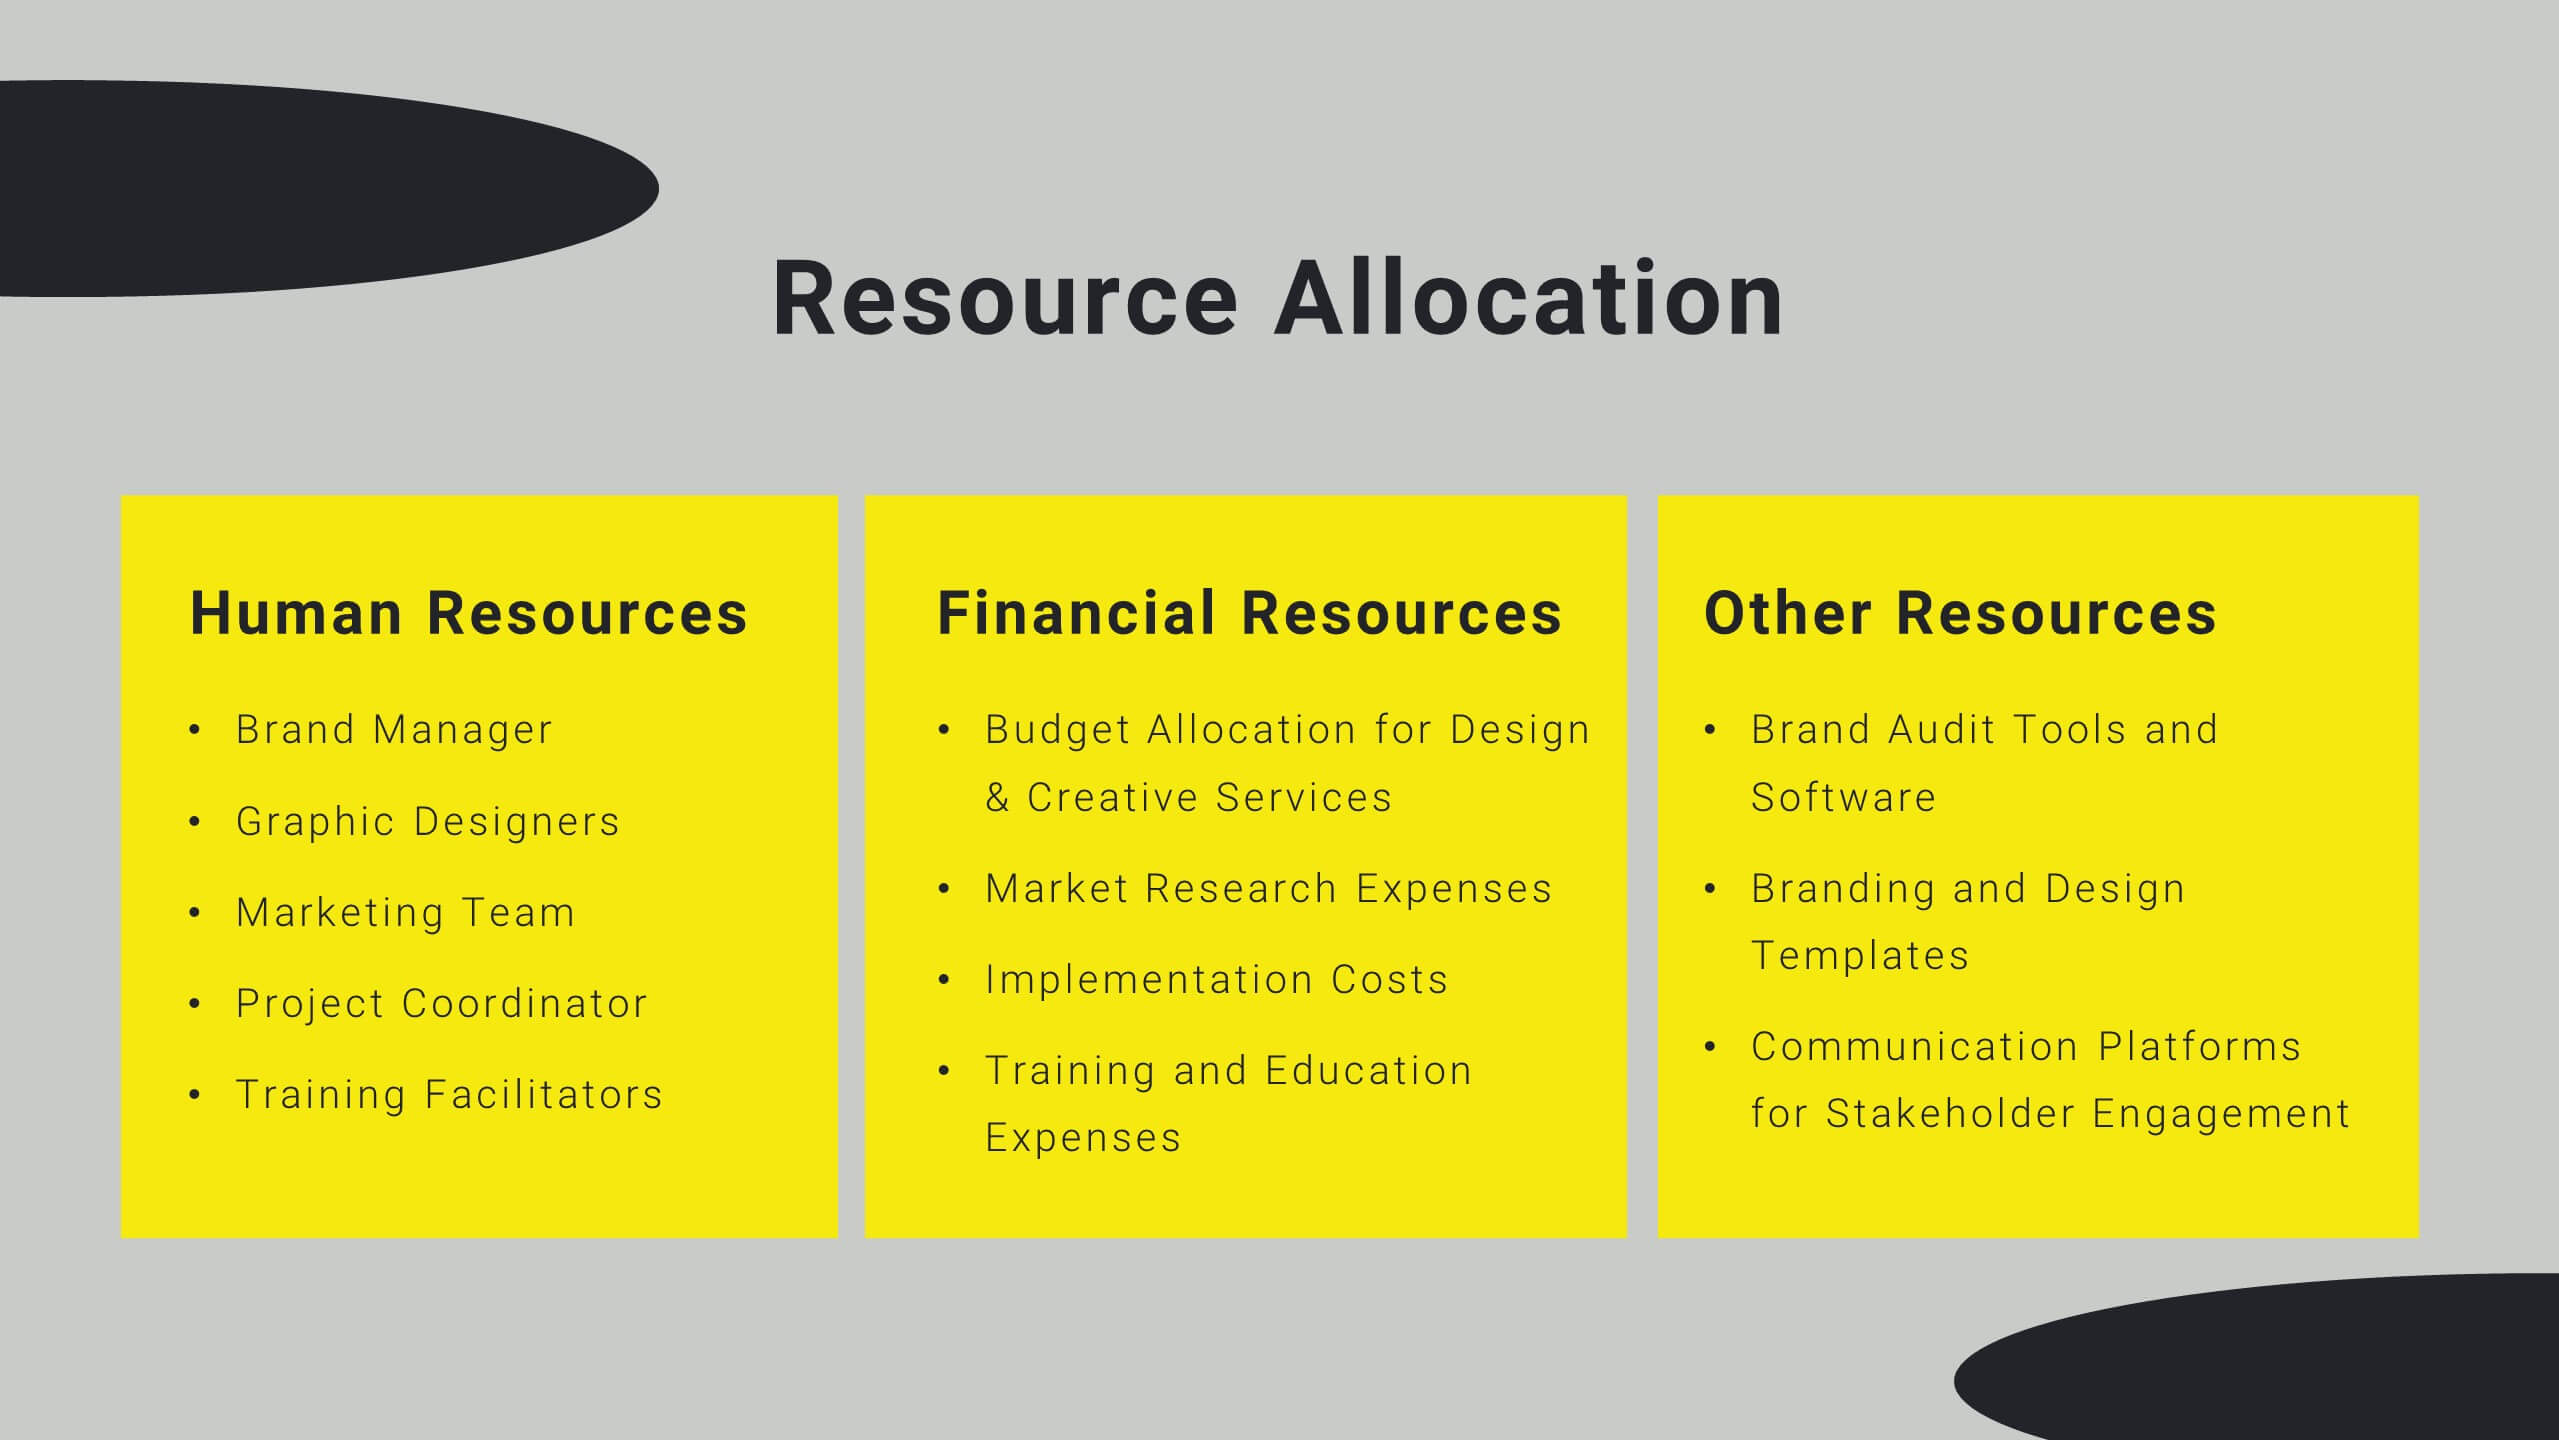
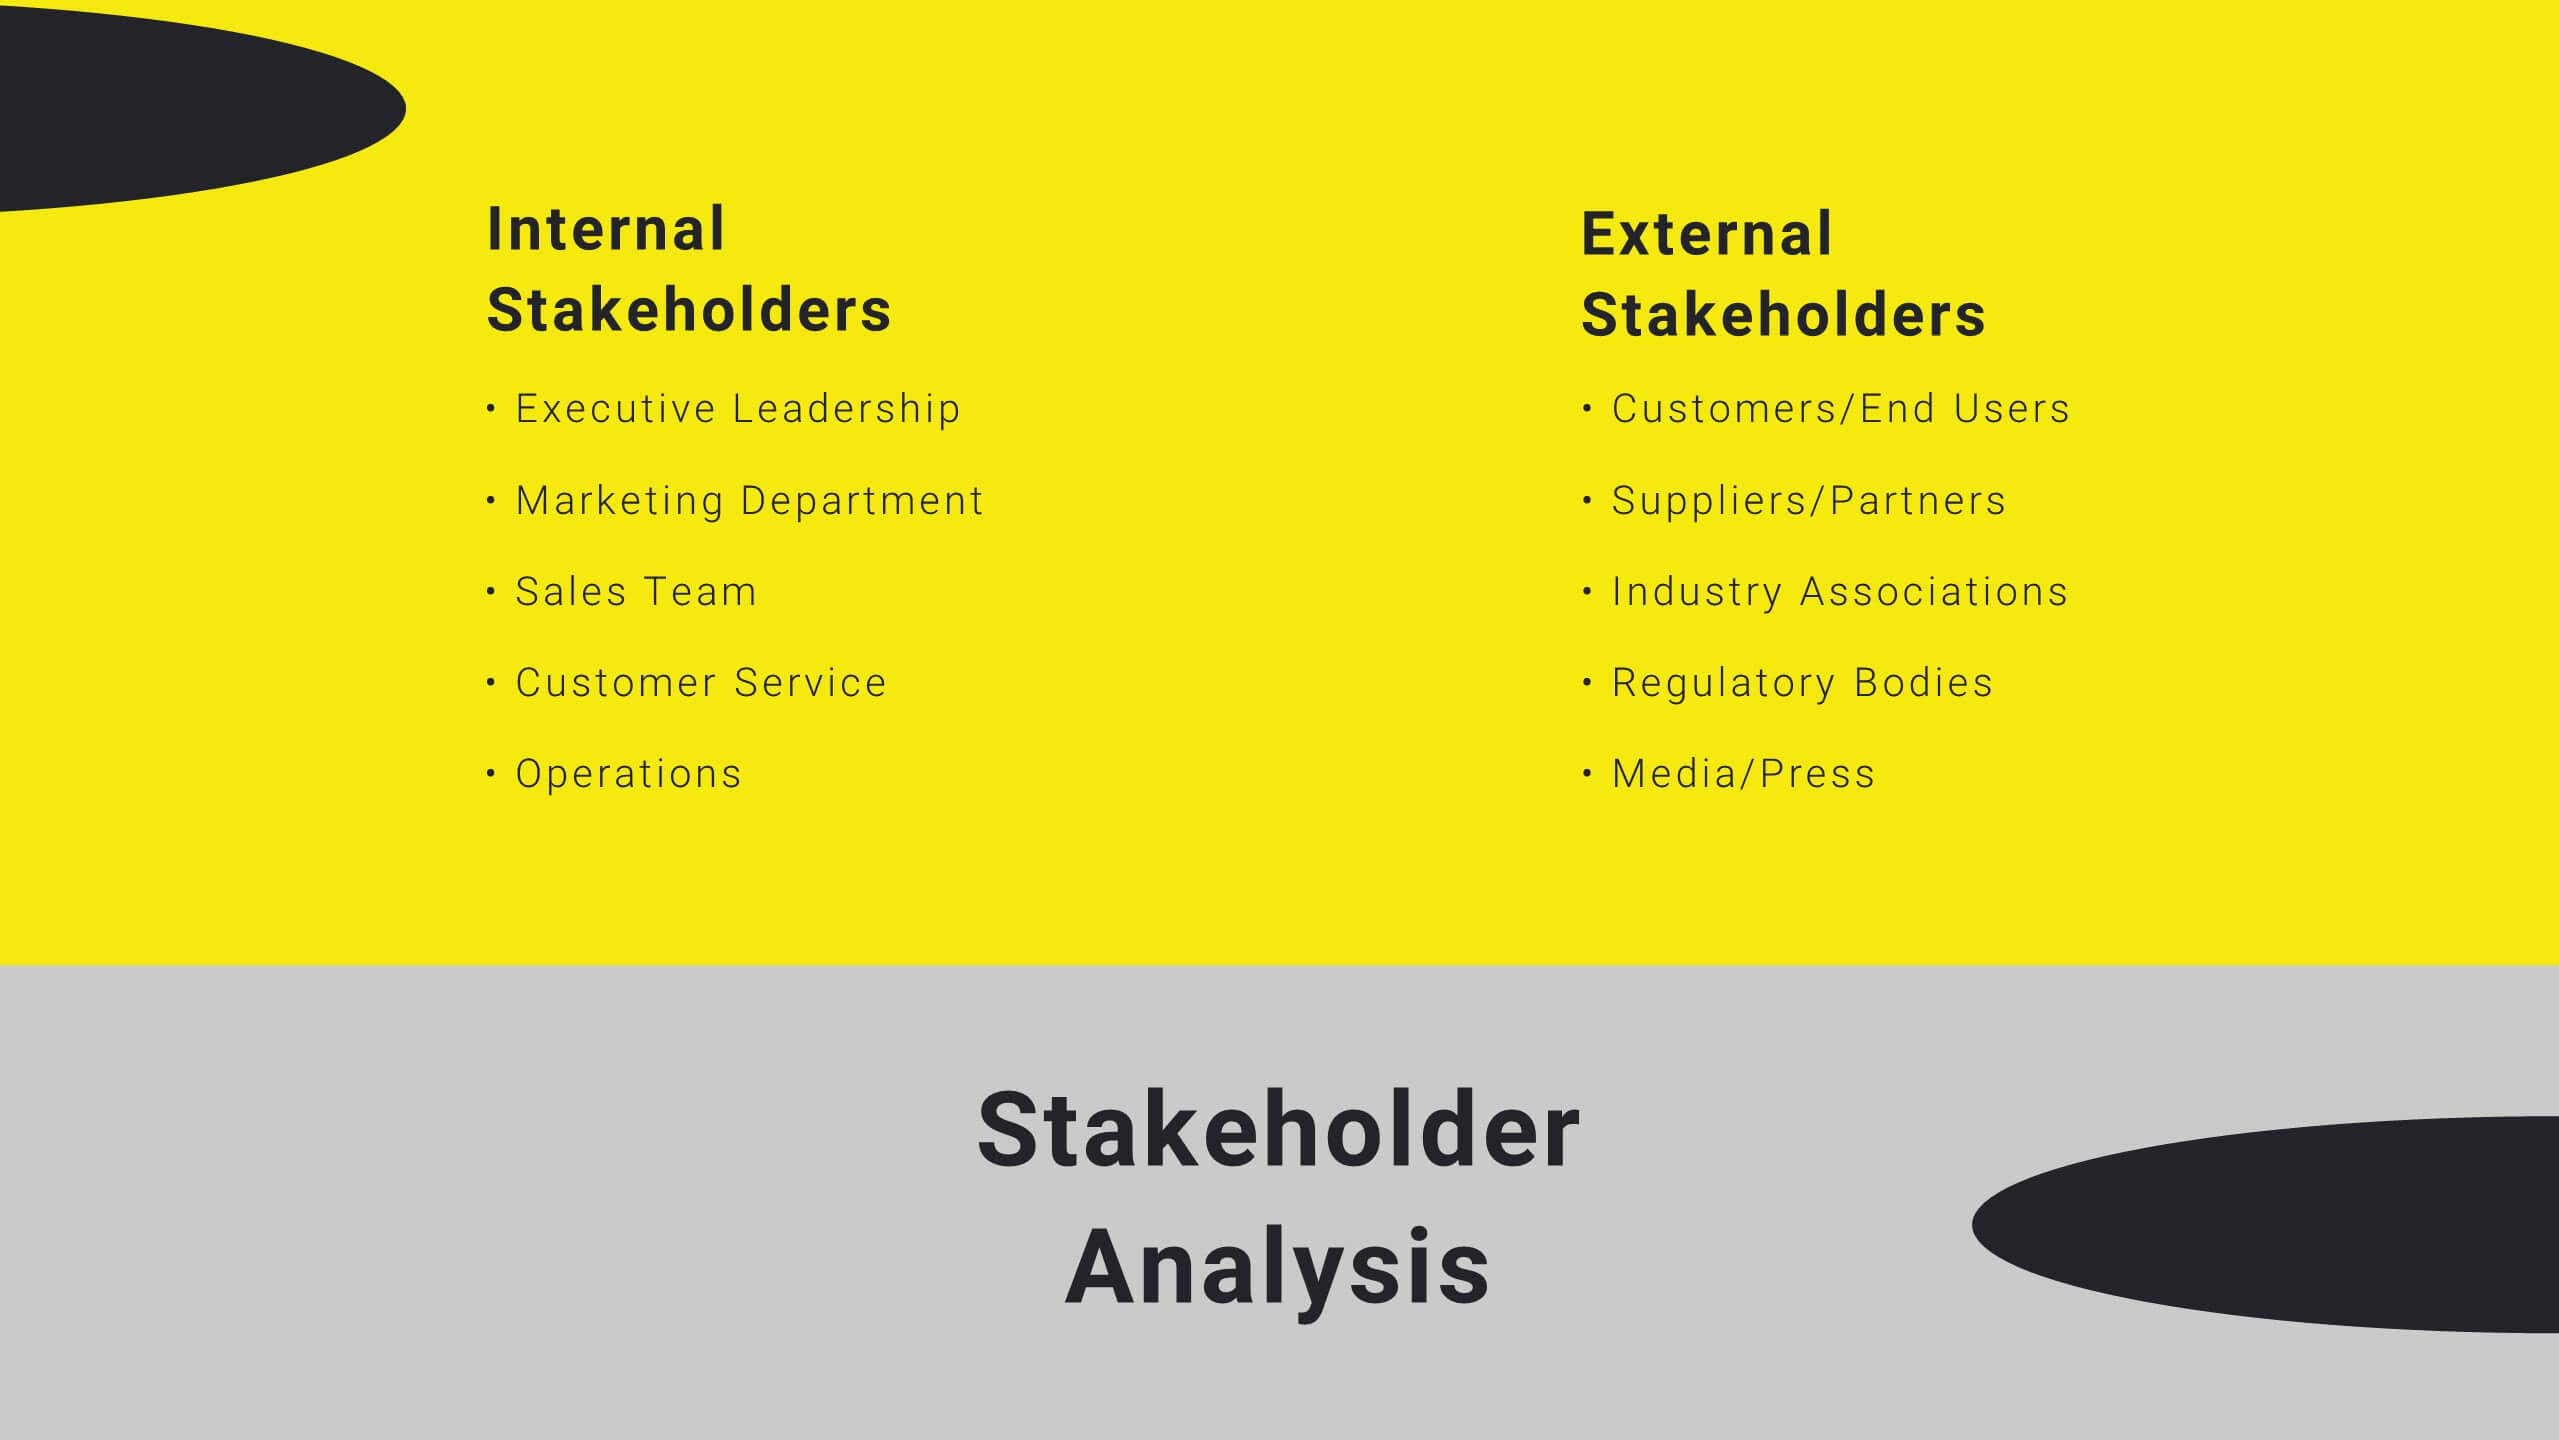
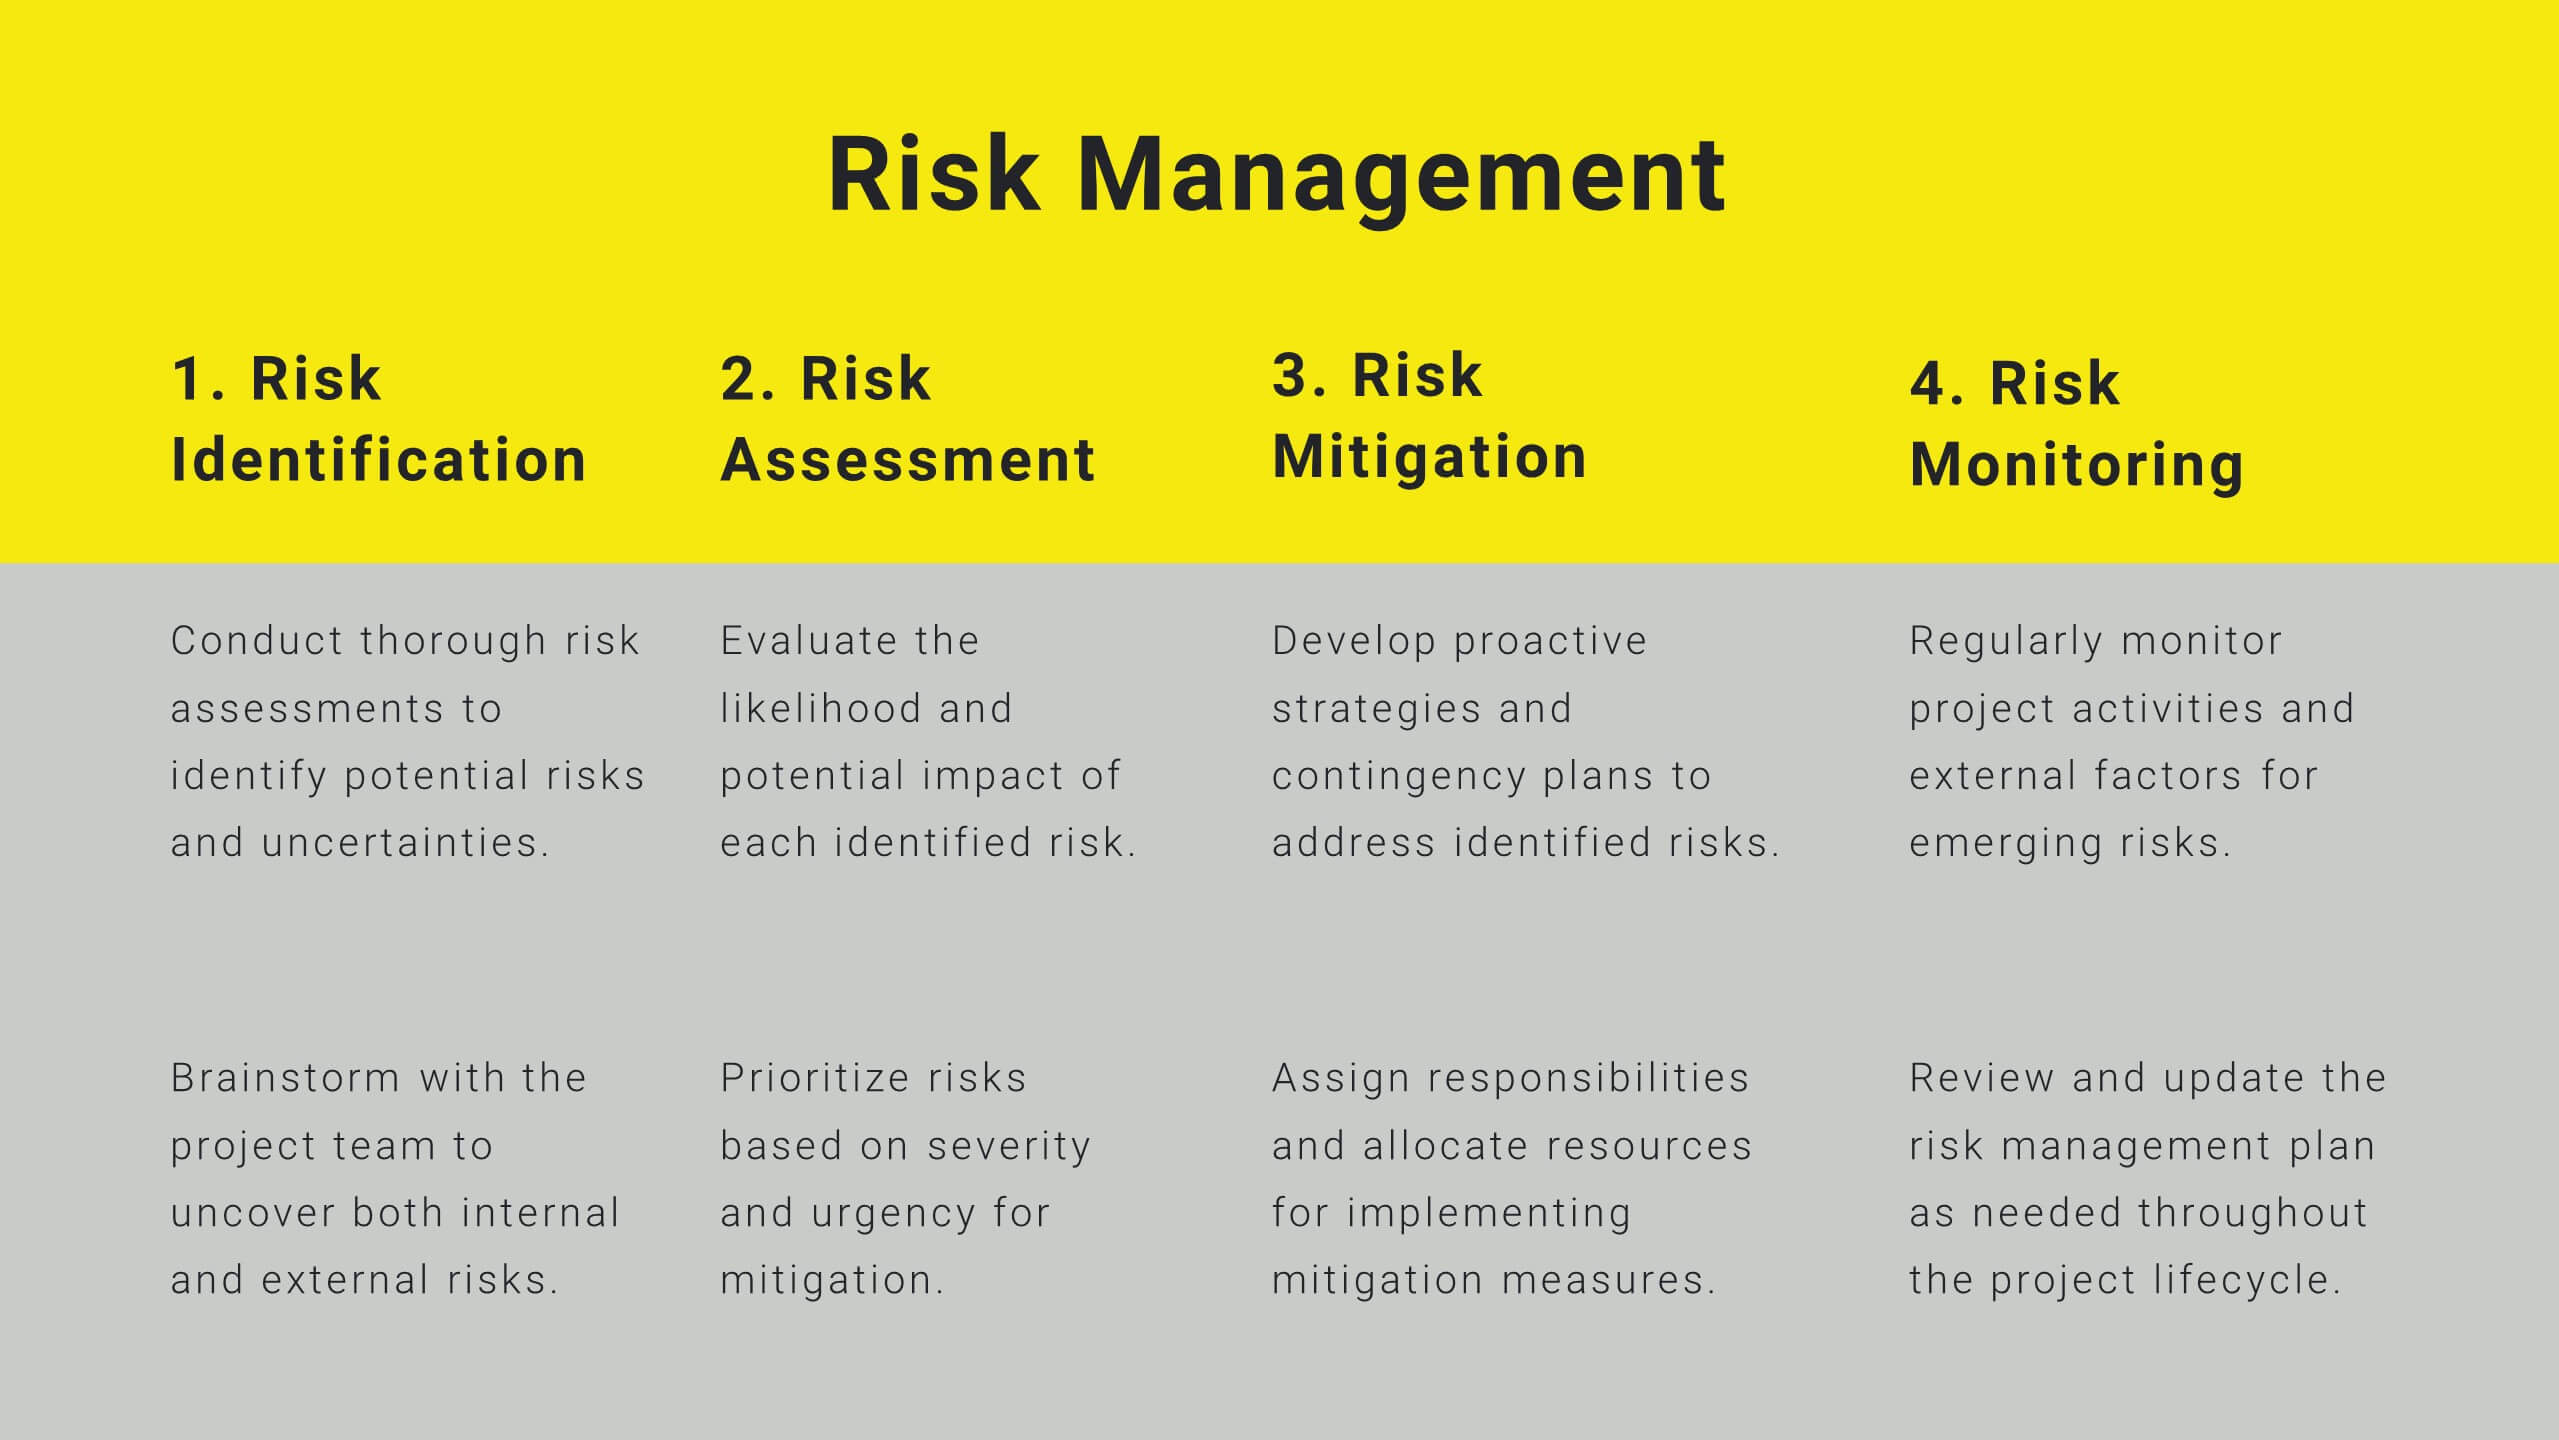
Sable Detailed Project Execution Plan Presentation
Master your project planning with this comprehensive execution plan template! Perfect for detailing project overviews, objectives, and timelines, it includes slides for budget breakdowns, resource allocation, and risk management. Ensure every detail is covered with structured content and clear visuals. Compatible with PowerPoint, Keynote, and Google Slides for seamless presentations on any platform.


4 slides
Clean Business Table Slide Design Presentation
Present your data with clarity using this Clean Business Table Slide Design presentation. Ideal for service comparisons, feature checklists, or role responsibilities, this layout uses simple icons and crisp tables for quick scanning. Professional and modern, it's perfect for client presentations or internal reports. Compatible with PowerPoint, Canva, and Google Slides.


7 slides
Rotational Process Flow in Wheel Layout Presentation
Showcase continuous workflows, lifecycle stages, or strategic loops with the Rotational Process Flow in Wheel Layout Presentation. This visually engaging circular diagram breaks down processes into six distinct segments, each with editable icons, colors, and titles—ideal for marketing funnels, product development stages, or team cycles. Fully compatible with PowerPoint, Keynote, and Google Slides.


12 slides
Predictive Analytics with Big Data Presentation
Unleash the power of Predictive Analytics with Big Data using this dynamic presentation template. Designed to highlight data-driven insights, AI-powered forecasting, and strategic decision-making, this template is ideal for data scientists, business analysts, and IT professionals. Fully customizable and available for PowerPoint, Keynote, and Google Slides, it ensures a visually compelling and structured presentation.


4 slides
3-Step Action Plan Next Steps Presentation
Turn your next big idea into a clear, achievable plan with this structured, goal-focused layout. Designed to visualize progress through three defined stages, it’s perfect for strategic planning, project timelines, or team roadmaps. Fully compatible with PowerPoint, Keynote, and Google Slides for smooth editing and professional presentation delivery.


6 slides
Organizational Strategy via Mind Mapping
Clarify your corporate vision with the Organizational Strategy via Mind Mapping Presentation. This infographic-style slide uses a head silhouette and segmented arc to represent five strategic focus areas (A–E), making it perfect for showcasing alignment across departments, initiatives, or leadership goals. Fully customizable in PowerPoint, Keynote, and Google Slides for versatile strategic presentations.


4 slides
Comprehensive Business Project Pitch Presentation
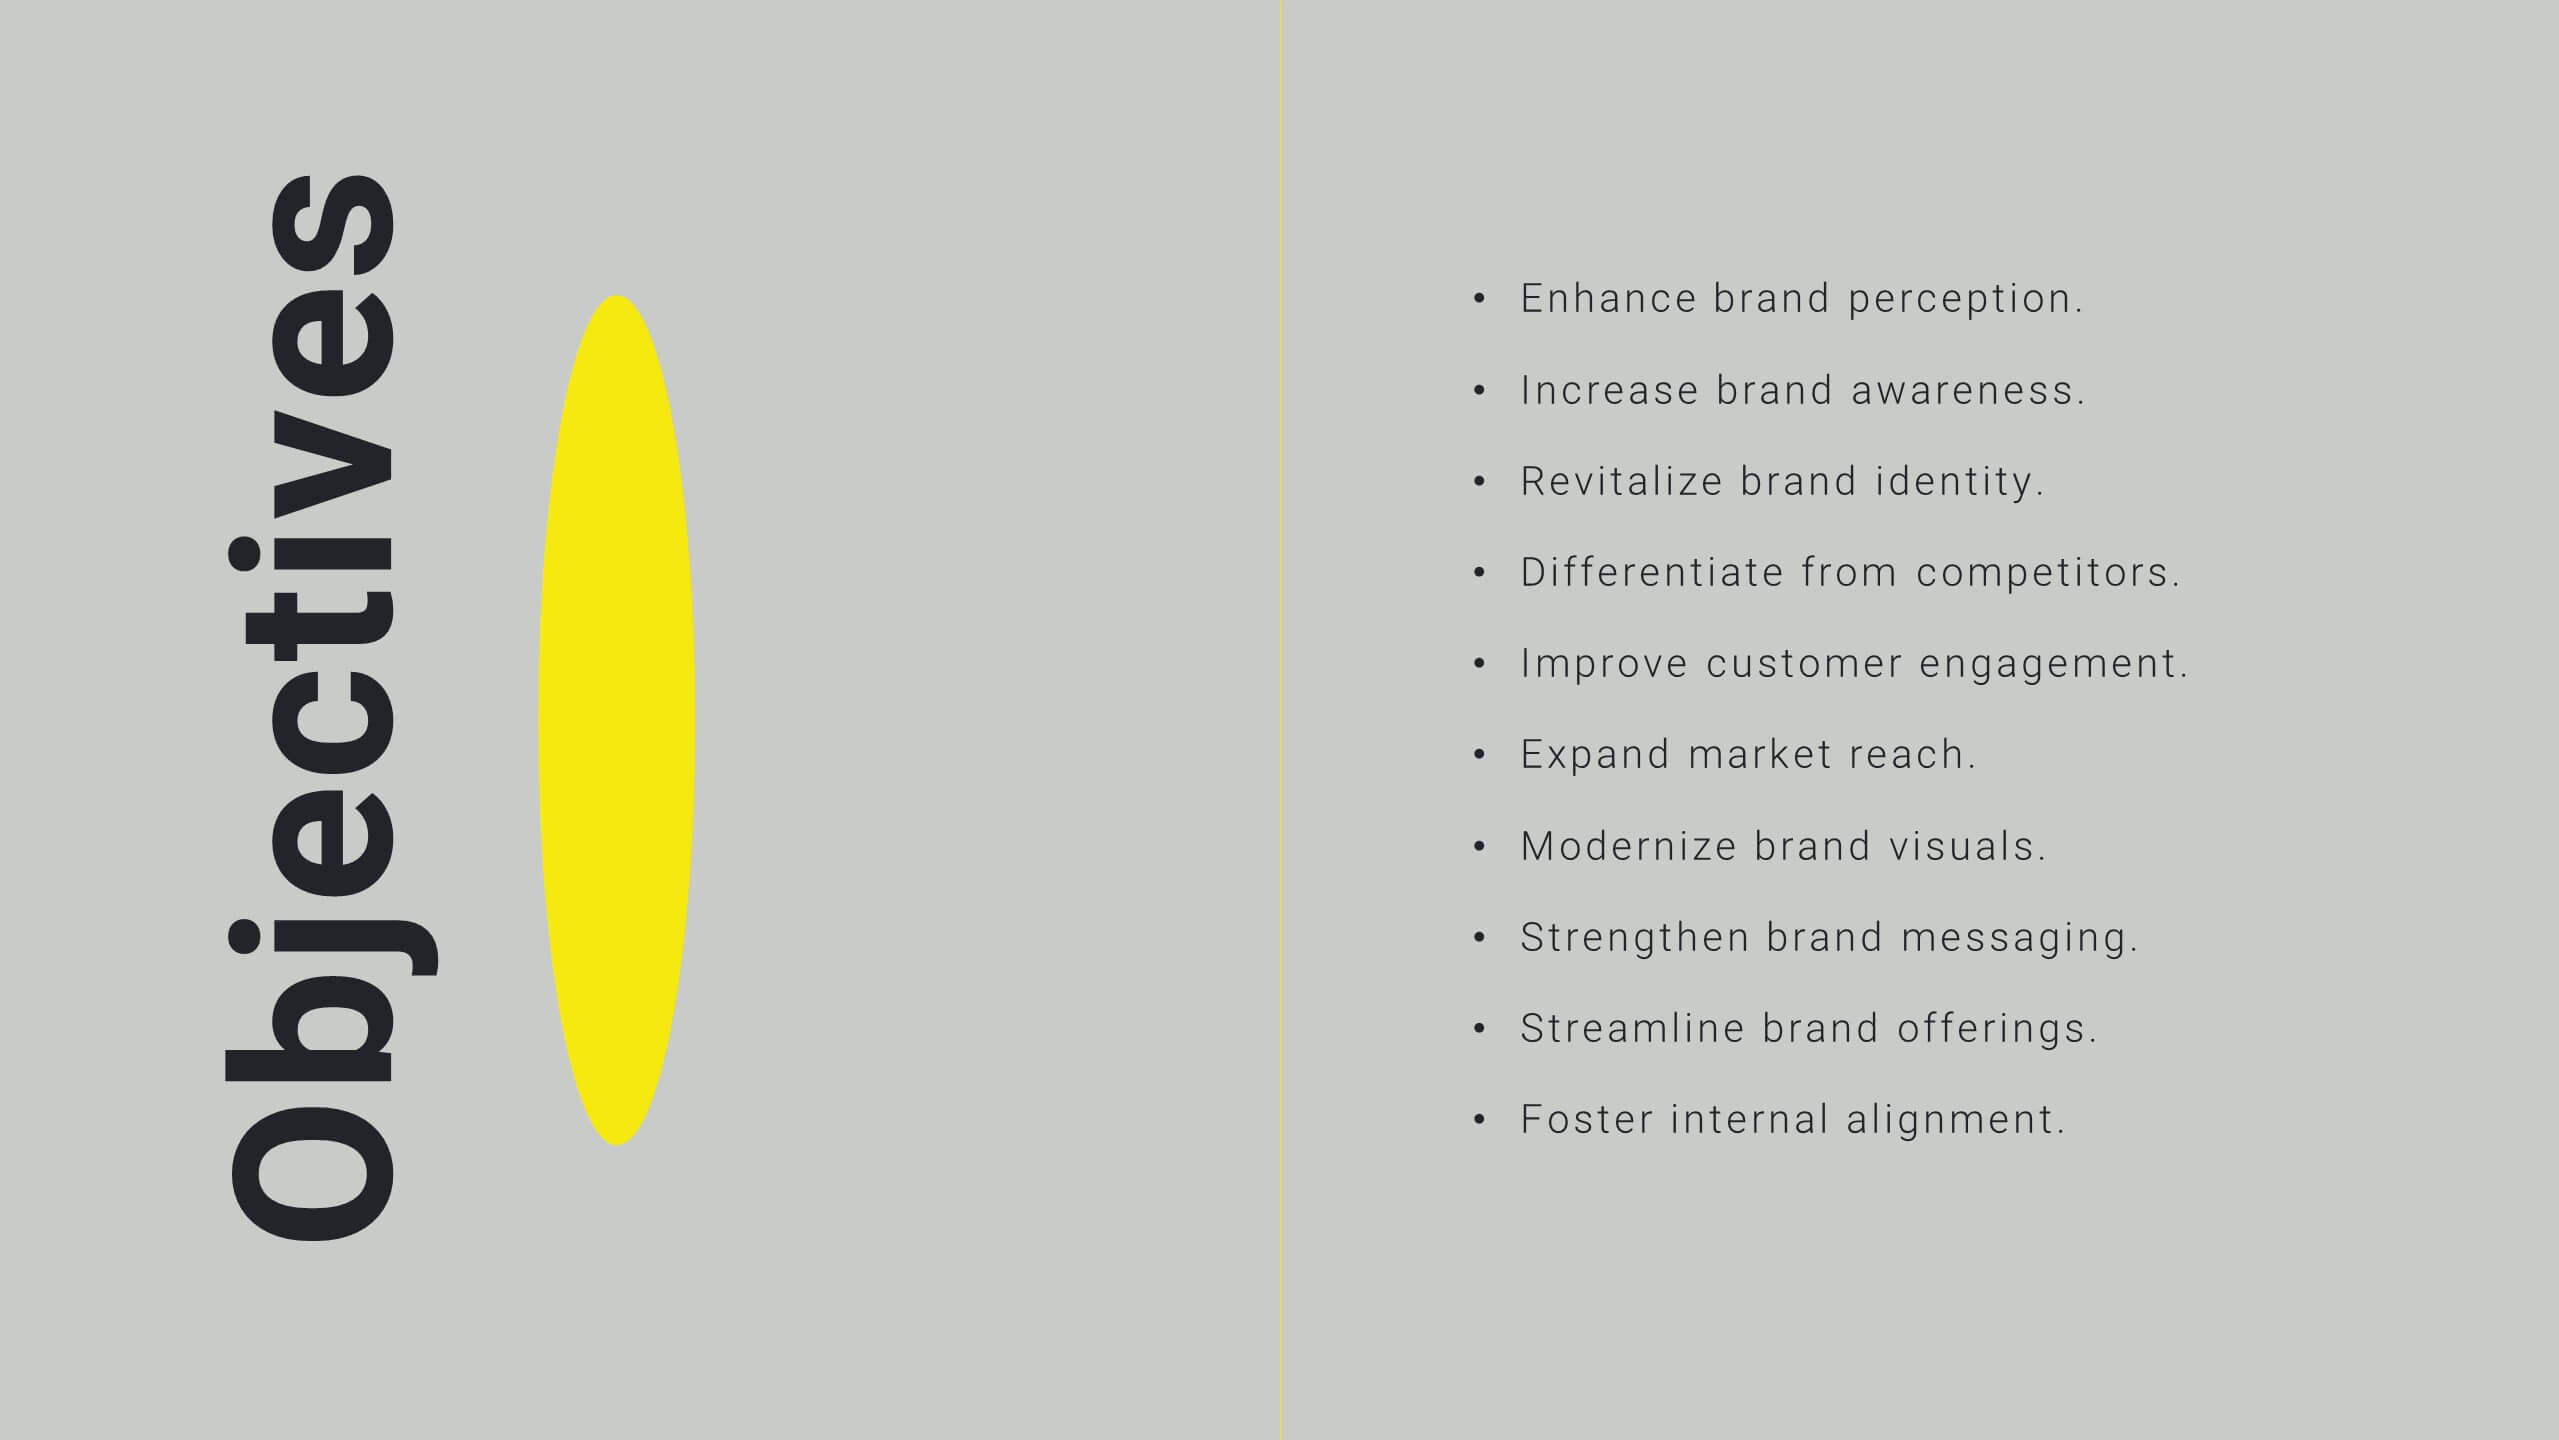
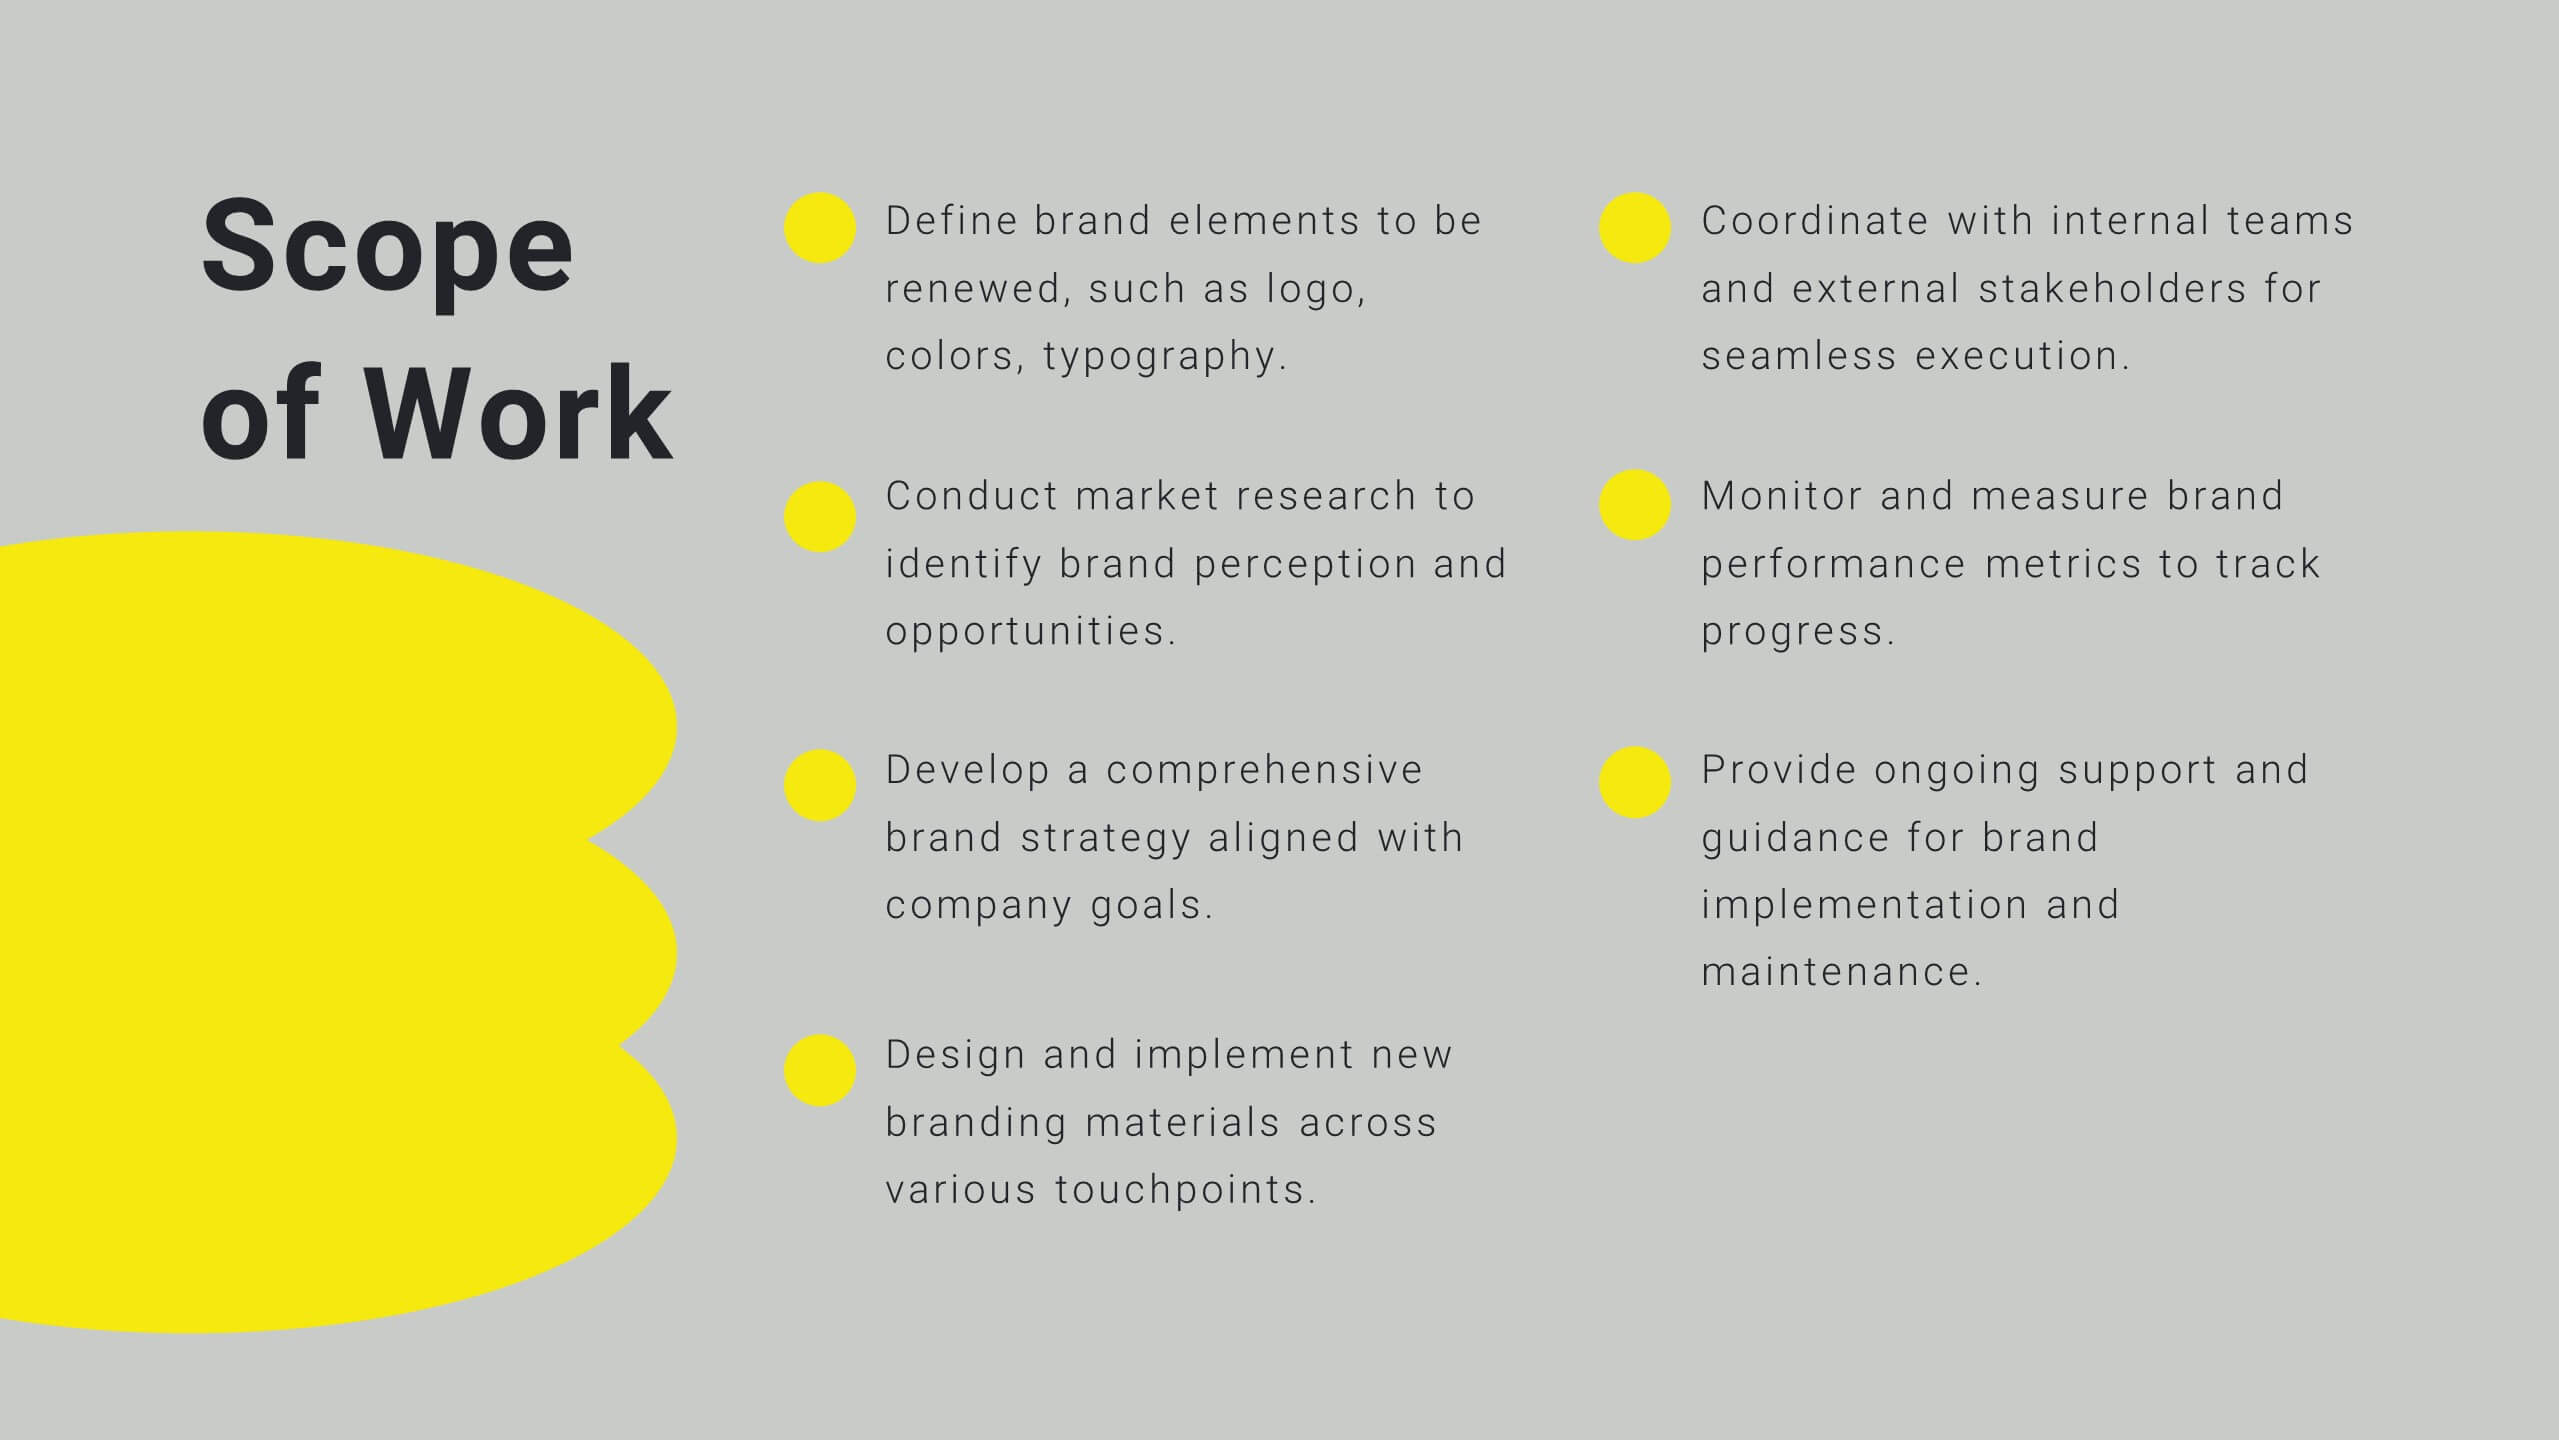
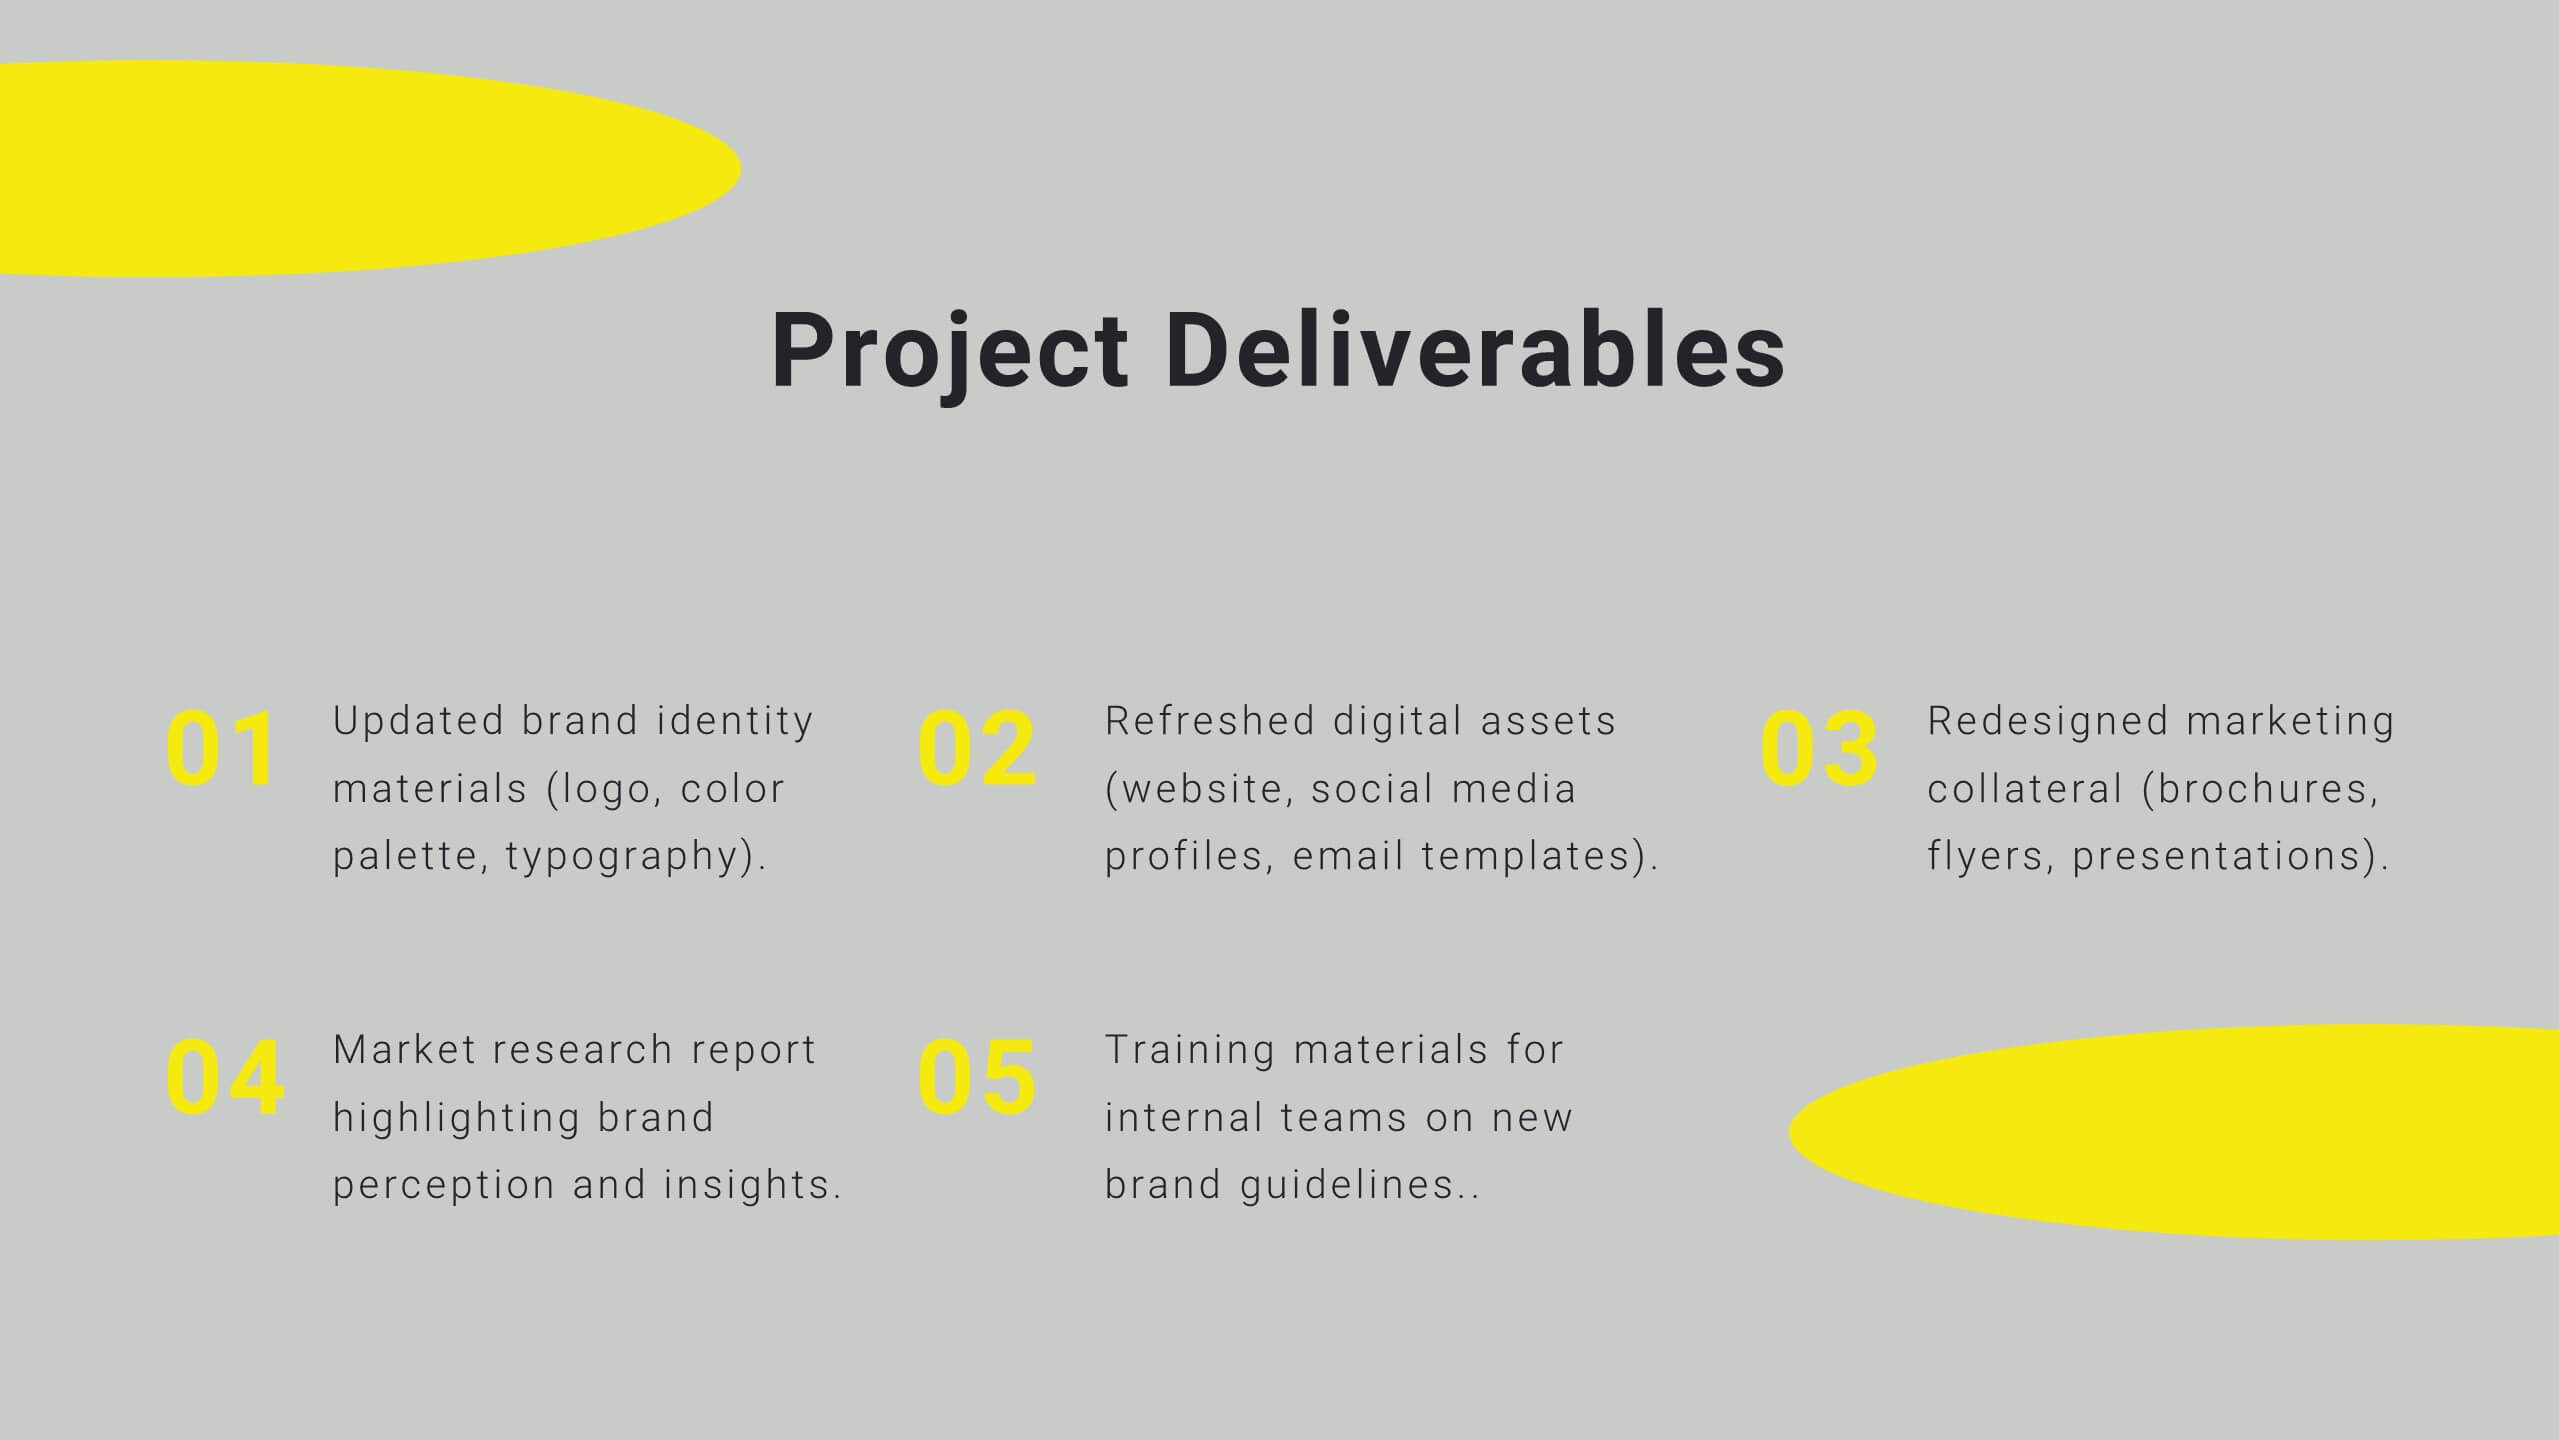
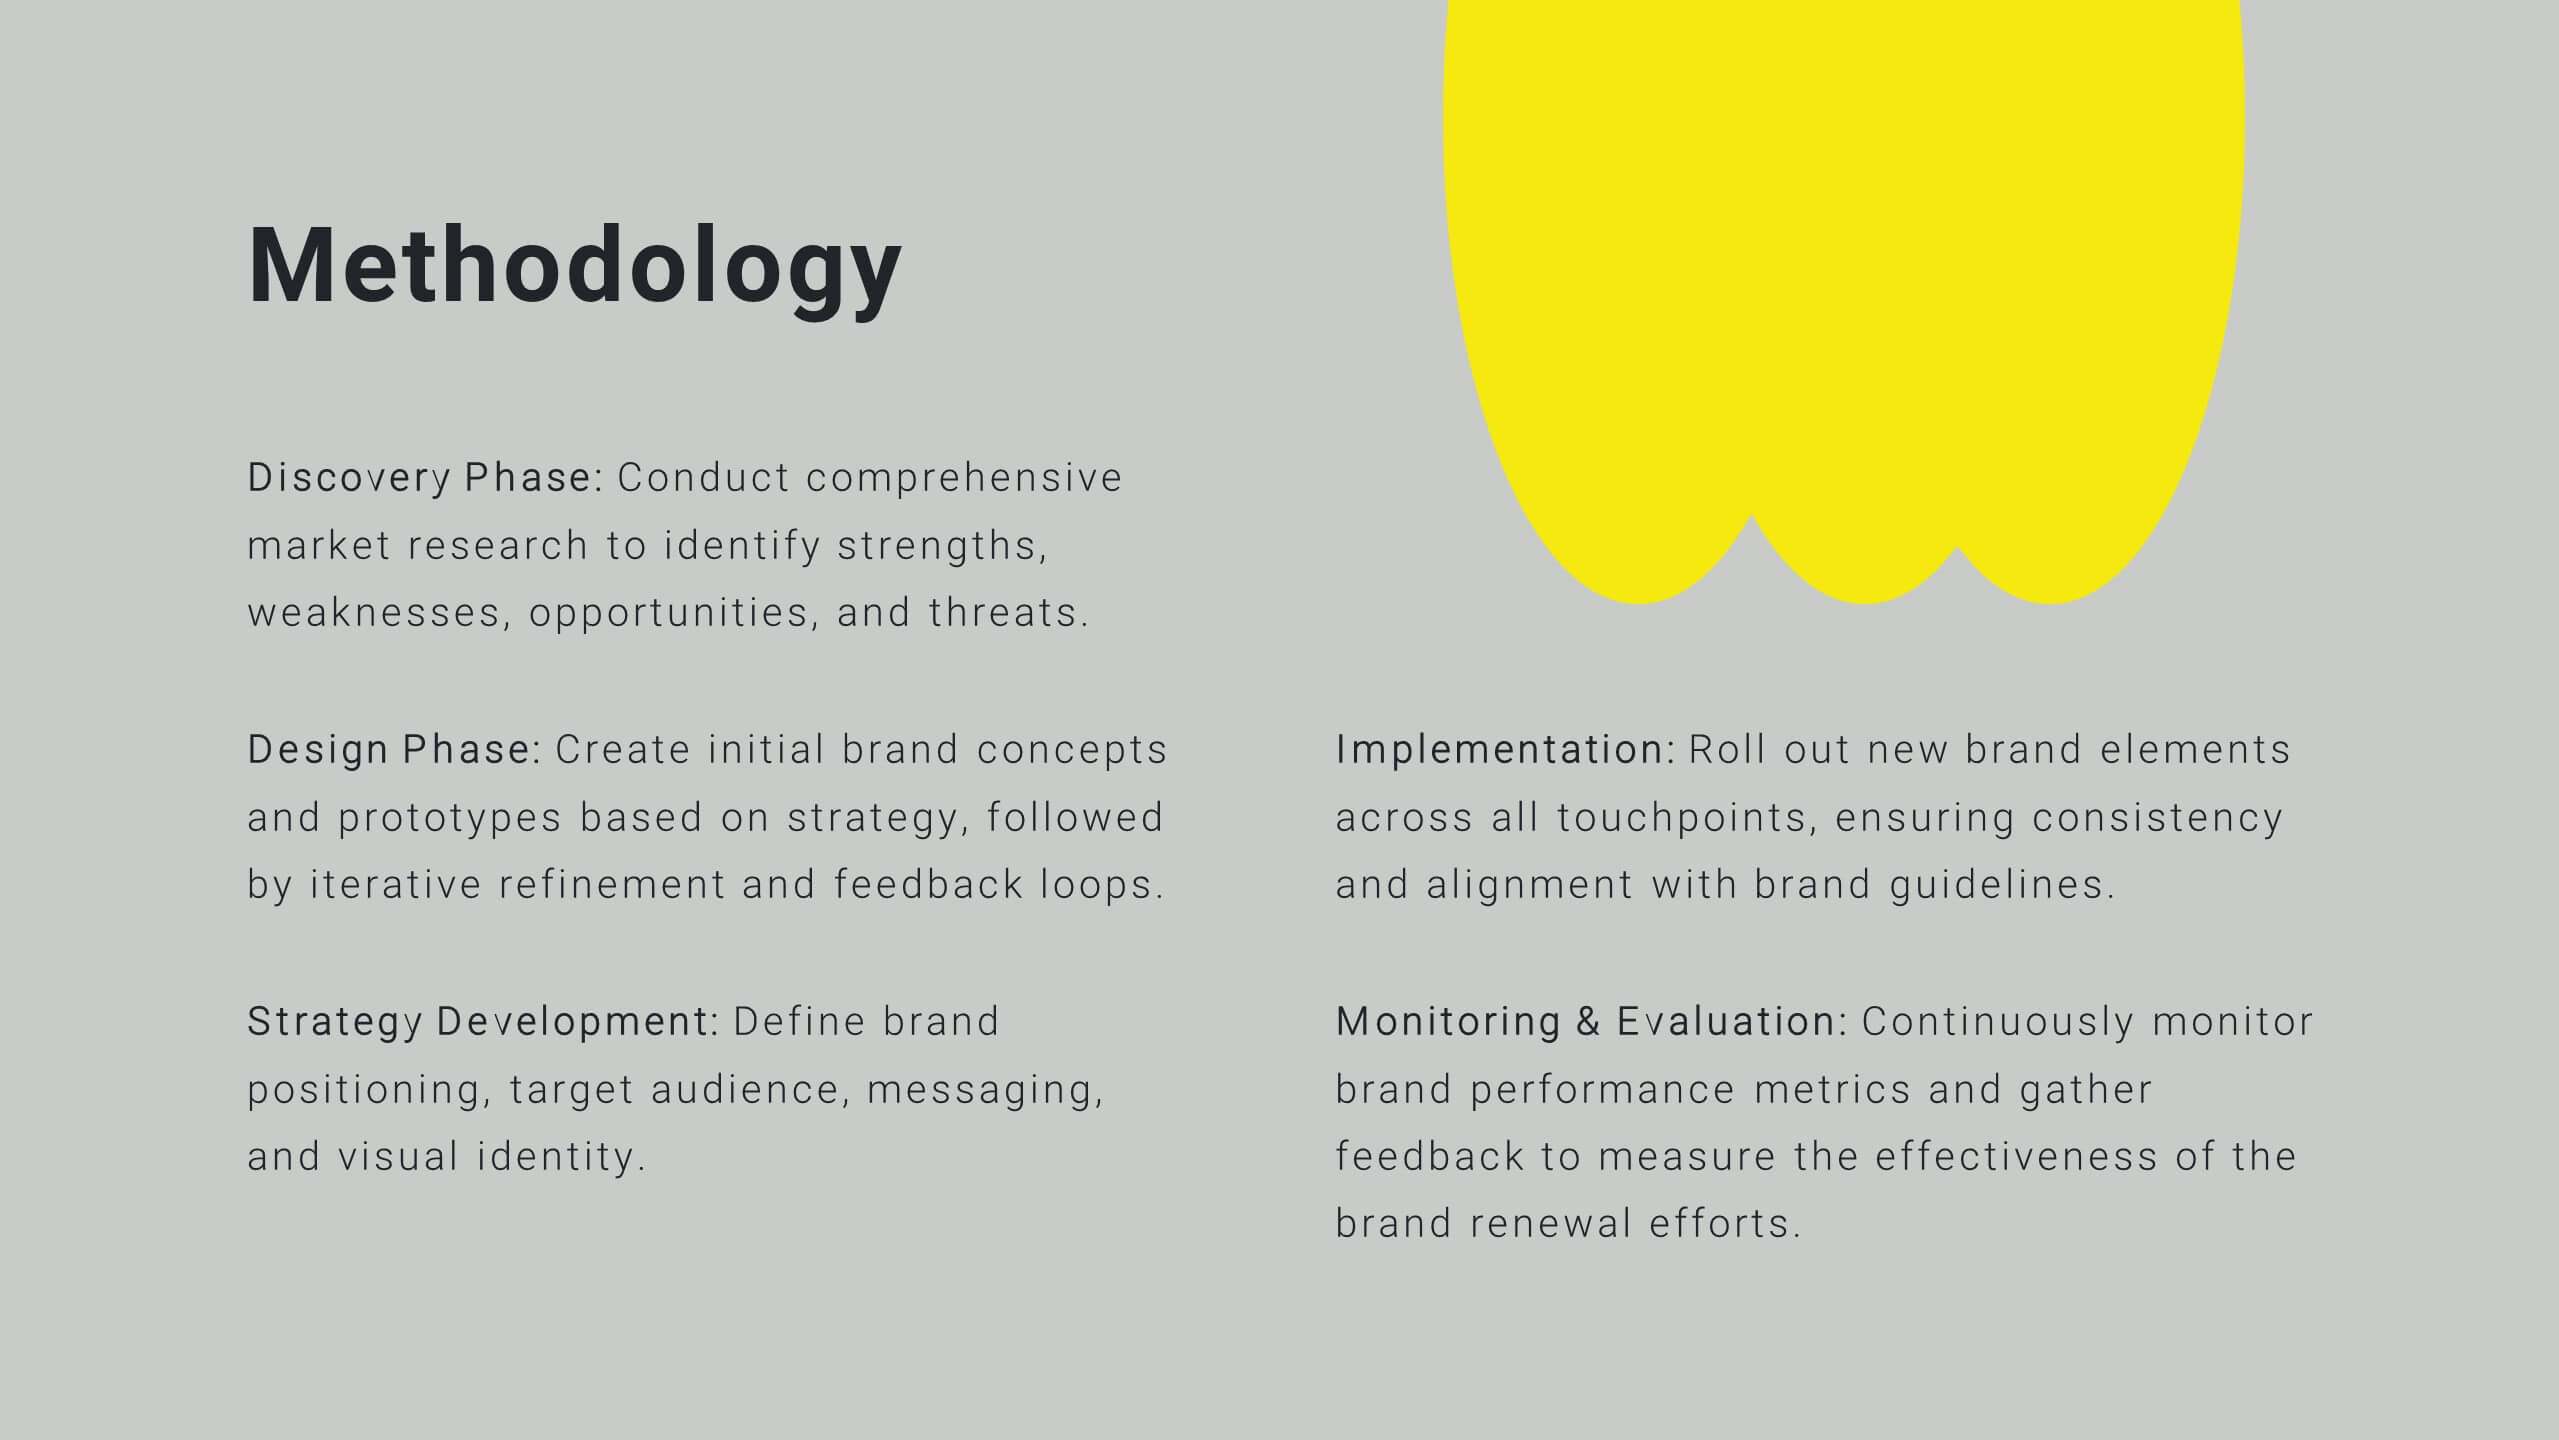
Present a polished and structured message with the Comprehensive Business Project Pitch Presentation. Featuring a clean checklist format paired with bold icons and color-coded segments, this layout is perfect for showcasing core strategies, deliverables, or proposal points. Easily customizable for PowerPoint, Keynote, or Google Slides.


7 slides
Strategic Highlights Executive Summary Presentation
Showcase your business priorities with the Strategic Highlights Executive Summary Presentation. This layout features up to seven colorful, clearly labeled content blocks—perfect for summarizing goals, KPIs, initiatives, or focus areas. Easy to edit in PowerPoint, Keynote, Google Slides, or Canva for quick customization and clean executive reporting.


6 slides
5-Level Risk Assessment Diagram Presentation
Simplify complex risk analysis with a clean, layered design that walks your audience through five key levels of impact and probability. Perfect for corporate reports, project management, or strategic planning, this presentation ensures clarity and engagement. Fully compatible with PowerPoint, Keynote, and Google Slides for easy customization.


12 slides
Alphabet Learning and Education Presentation
Introduce concepts creatively with this bold "A"-shaped infographic designed for education topics. Each segment of the letter highlights a numbered point, making it ideal for step-by-step instructions, learning stages, or literacy development. Use it to simplify complex ideas visually. Fully editable in PowerPoint, Keynote, and Google Slides.
20 slides
Beacon Content Marketing Pitch Deck Presentation
Ignite your marketing strategies with this dynamic and sleek content marketing pitch deck! Filled with modern design and comprehensive insights, this template is perfect for showcasing trends, influencer marketing, and emerging technologies. Make your brand's story stand out while captivating your audience. Fully compatible with PowerPoint, Keynote, and Google Slides!


22 slides
Diana Digital Agency Strategy Plan Presentation
Set your agency’s strategy in motion with this sleek and professional presentation! Featuring essential sections like market analysis, service offerings, campaign execution, and client success stories, it’s built to align your vision and goals. Ideal for client pitches or internal meetings, it’s fully compatible with PowerPoint, Keynote, and Google Slides.


4 slides
Historical Event Timeline Presentation
Visualize your timeline with this Historical Event layout, ideal for showcasing progress, milestones, or key moments over time. Featuring a horizontal design with date markers and icons, it’s perfect for history, education, or project recaps. Fully editable in PowerPoint, Keynote, and Google Slides to match your content and branding.


5 slides
Medical Research Findings Presentation
Present key discoveries with clarity using this clean, medical-themed infographic. Designed around a diamond-shaped flow of icons (representing medication, data, instruments, and analysis), this layout is ideal for visualizing research processes, clinical trial stages, or scientific summaries. Fully editable in PowerPoint, Keynote, and Google Slides for flexible customization.


4 slides
Execution-Based Strategic Action Plan Presentation
Highlight your execution strategy with this visually striking pinwheel diagram. Each blade represents a focused action step, ideal for showcasing implementation plans or performance initiatives. Fully customizable in PowerPoint, Keynote, and Google Slides—perfect for strategic reviews, team briefings, or progress tracking across four critical areas.


4 slides
Rewards and Membership Benefits Presentation
Maximize engagement and incentivize loyalty with the "Rewards and Membership Benefits" presentation template. This layout is designed to help businesses effectively communicate the value of their membership programs, highlighting perks and rewards in a visually engaging way. Perfect for marketers aiming to enhance customer retention strategies, it's compatible with PowerPoint, Keynote, and Google Slides.


21 slides
Luminor Project Timeline Presentation
Stay on track and achieve your goals with this dynamic project timeline presentation template. It provides a clear structure to outline key milestones, objectives, budget breakdown, risk management, and resource allocation, ensuring seamless project execution. The modern and professional design enhances communication with stakeholders and team members alike. Fully customizable and compatible with PowerPoint, Keynote, and Google Slides.