


Features
- 8 Unique slides
- Fully editable and easy to edit in Microsoft Powerpoint, Keynote and Google Slides
- 16:9 widescreen layout
- Clean and professional designs
- Export to JPG, PDF or send by email


Do you have any questions?
Recommend


8 slides
Business Growth with TAM SAM SOM Framework Presentation
Illustrate Your Market Expansion Strategy with this Business Growth with TAM SAM SOM Framework presentation template. Clearly differentiate Total Addressable Market (TAM), Serviceable Available Market (SAM), and Serviceable Obtainable Market (SOM) to help businesses, entrepreneurs, and investors make informed growth decisions and target market opportunities. This visually engaging and fully customizable template is compatible with PowerPoint, Keynote, and Google Slides, making it ideal for business planning, market research, and investor presentations.


5 slides
Technology Innovation Infographics
Technology innovation refers to the process of creating and introducing new or improved technologies that have the potential to bring about significant advancements in various industries and sectors. These vertical infographics explores the world of technology innovation and its impact on various industries. These templates are designed to showcase the latest advancements, emerging trends, and transformative technologies that are shaping our digital landscape. These enable you to showcase the transformative power of technology and inspire your audience to embrace the opportunities it presents.


25 slides
The Future of Retail Presentation Template
Step into the next generation of commerce with this sleek and modern presentation template exploring the future of retail! Designed to showcase trends, innovations, and strategies shaping the retail landscape, this template offers a perfect balance of visual appeal and clarity. With customizable charts, data-driven infographics, and professional layouts, it’s ideal for presenting market insights, technology integration, and consumer behavior shifts. Bold colors and contemporary design elements create a dynamic flow, keeping your audience engaged while emphasizing key points. Perfect for entrepreneurs, analysts, or educators, this template adapts to a variety of topics with ease. Fully compatible with PowerPoint, Keynote, and Google Slides, it ensures your presentation is as forward-thinking as the ideas you share


5 slides
RACI Role Assignment Matrix Overview Presentation
Clarify team responsibilities with the RACI Role Assignment Matrix Overview Presentation. This professional template helps define who is Responsible, Accountable, Consulted, and Informed across key project tasks. Perfect for streamlining communication, reducing overlap, and improving accountability. Fully editable in PowerPoint, Canva, and Google Slides.


5 slides
Next-Gen Networks and 5G Infrastructure Presentation
Build the future, one signal at a time. This engaging infographic presentation visually tracks the evolution of mobile network infrastructure, using a clean timeline layout with colorful tower icons and milestone markers. Perfect for tech educators, analysts, or engineers. Fully compatible with PowerPoint, Keynote, and Google Slides for seamless editing.


6 slides
Employee Feedback Survey Results Presentation
Showcase Employee Feedback Survey Results with a data-driven and professional layout designed for clear visualization and analysis. This PowerPoint, Keynote, and Google Slides-compatible template features stacked bar charts for easy trend comparison, helping you present workplace insights effectively. Fully customizable with editable text, colors, and labels, this template ensures a seamless and engaging presentation of employee feedback metrics.


5 slides
Geometric Design Elements
Make your message stand out with this bold, 3D geometric infographic layout. Ideal for visualizing layered concepts, structural data, or multi-dimensional strategies. Each triangular section is color-coded and fully editable to align with your brand or topic. Compatible with PowerPoint, Keynote, and Google Slides.


7 slides
Stores Pricing Tables Infographic Presentation
A Pricing Table Infographic is a visual representation of the prices and features of different products or services offered by a company. This template is designed so you can compare and contrast the different options available to potential customers, and to make an informed decision based on their needs and budget. This template includes a table that lists the different products and services, along with their prices, features, and any other relevant information you chose to include. It also include charts or graphs to help visualize the differences between the different options available.


4 slides
Interactive Data Dashboard Display Presentation
Present data with clarity using this Interactive Data Dashboard Display presentation. Designed to showcase multiple metrics at once, it includes pie charts, donut charts, bubble graphs, and bar comparisons. Ideal for business reports, marketing insights, or performance reviews. Fully editable in Canva, PowerPoint, and Google Slides for flexible customization.


7 slides
Rotational Process Flow in Wheel Layout Presentation
Showcase continuous workflows, lifecycle stages, or strategic loops with the Rotational Process Flow in Wheel Layout Presentation. This visually engaging circular diagram breaks down processes into six distinct segments, each with editable icons, colors, and titles—ideal for marketing funnels, product development stages, or team cycles. Fully compatible with PowerPoint, Keynote, and Google Slides.


20 slides
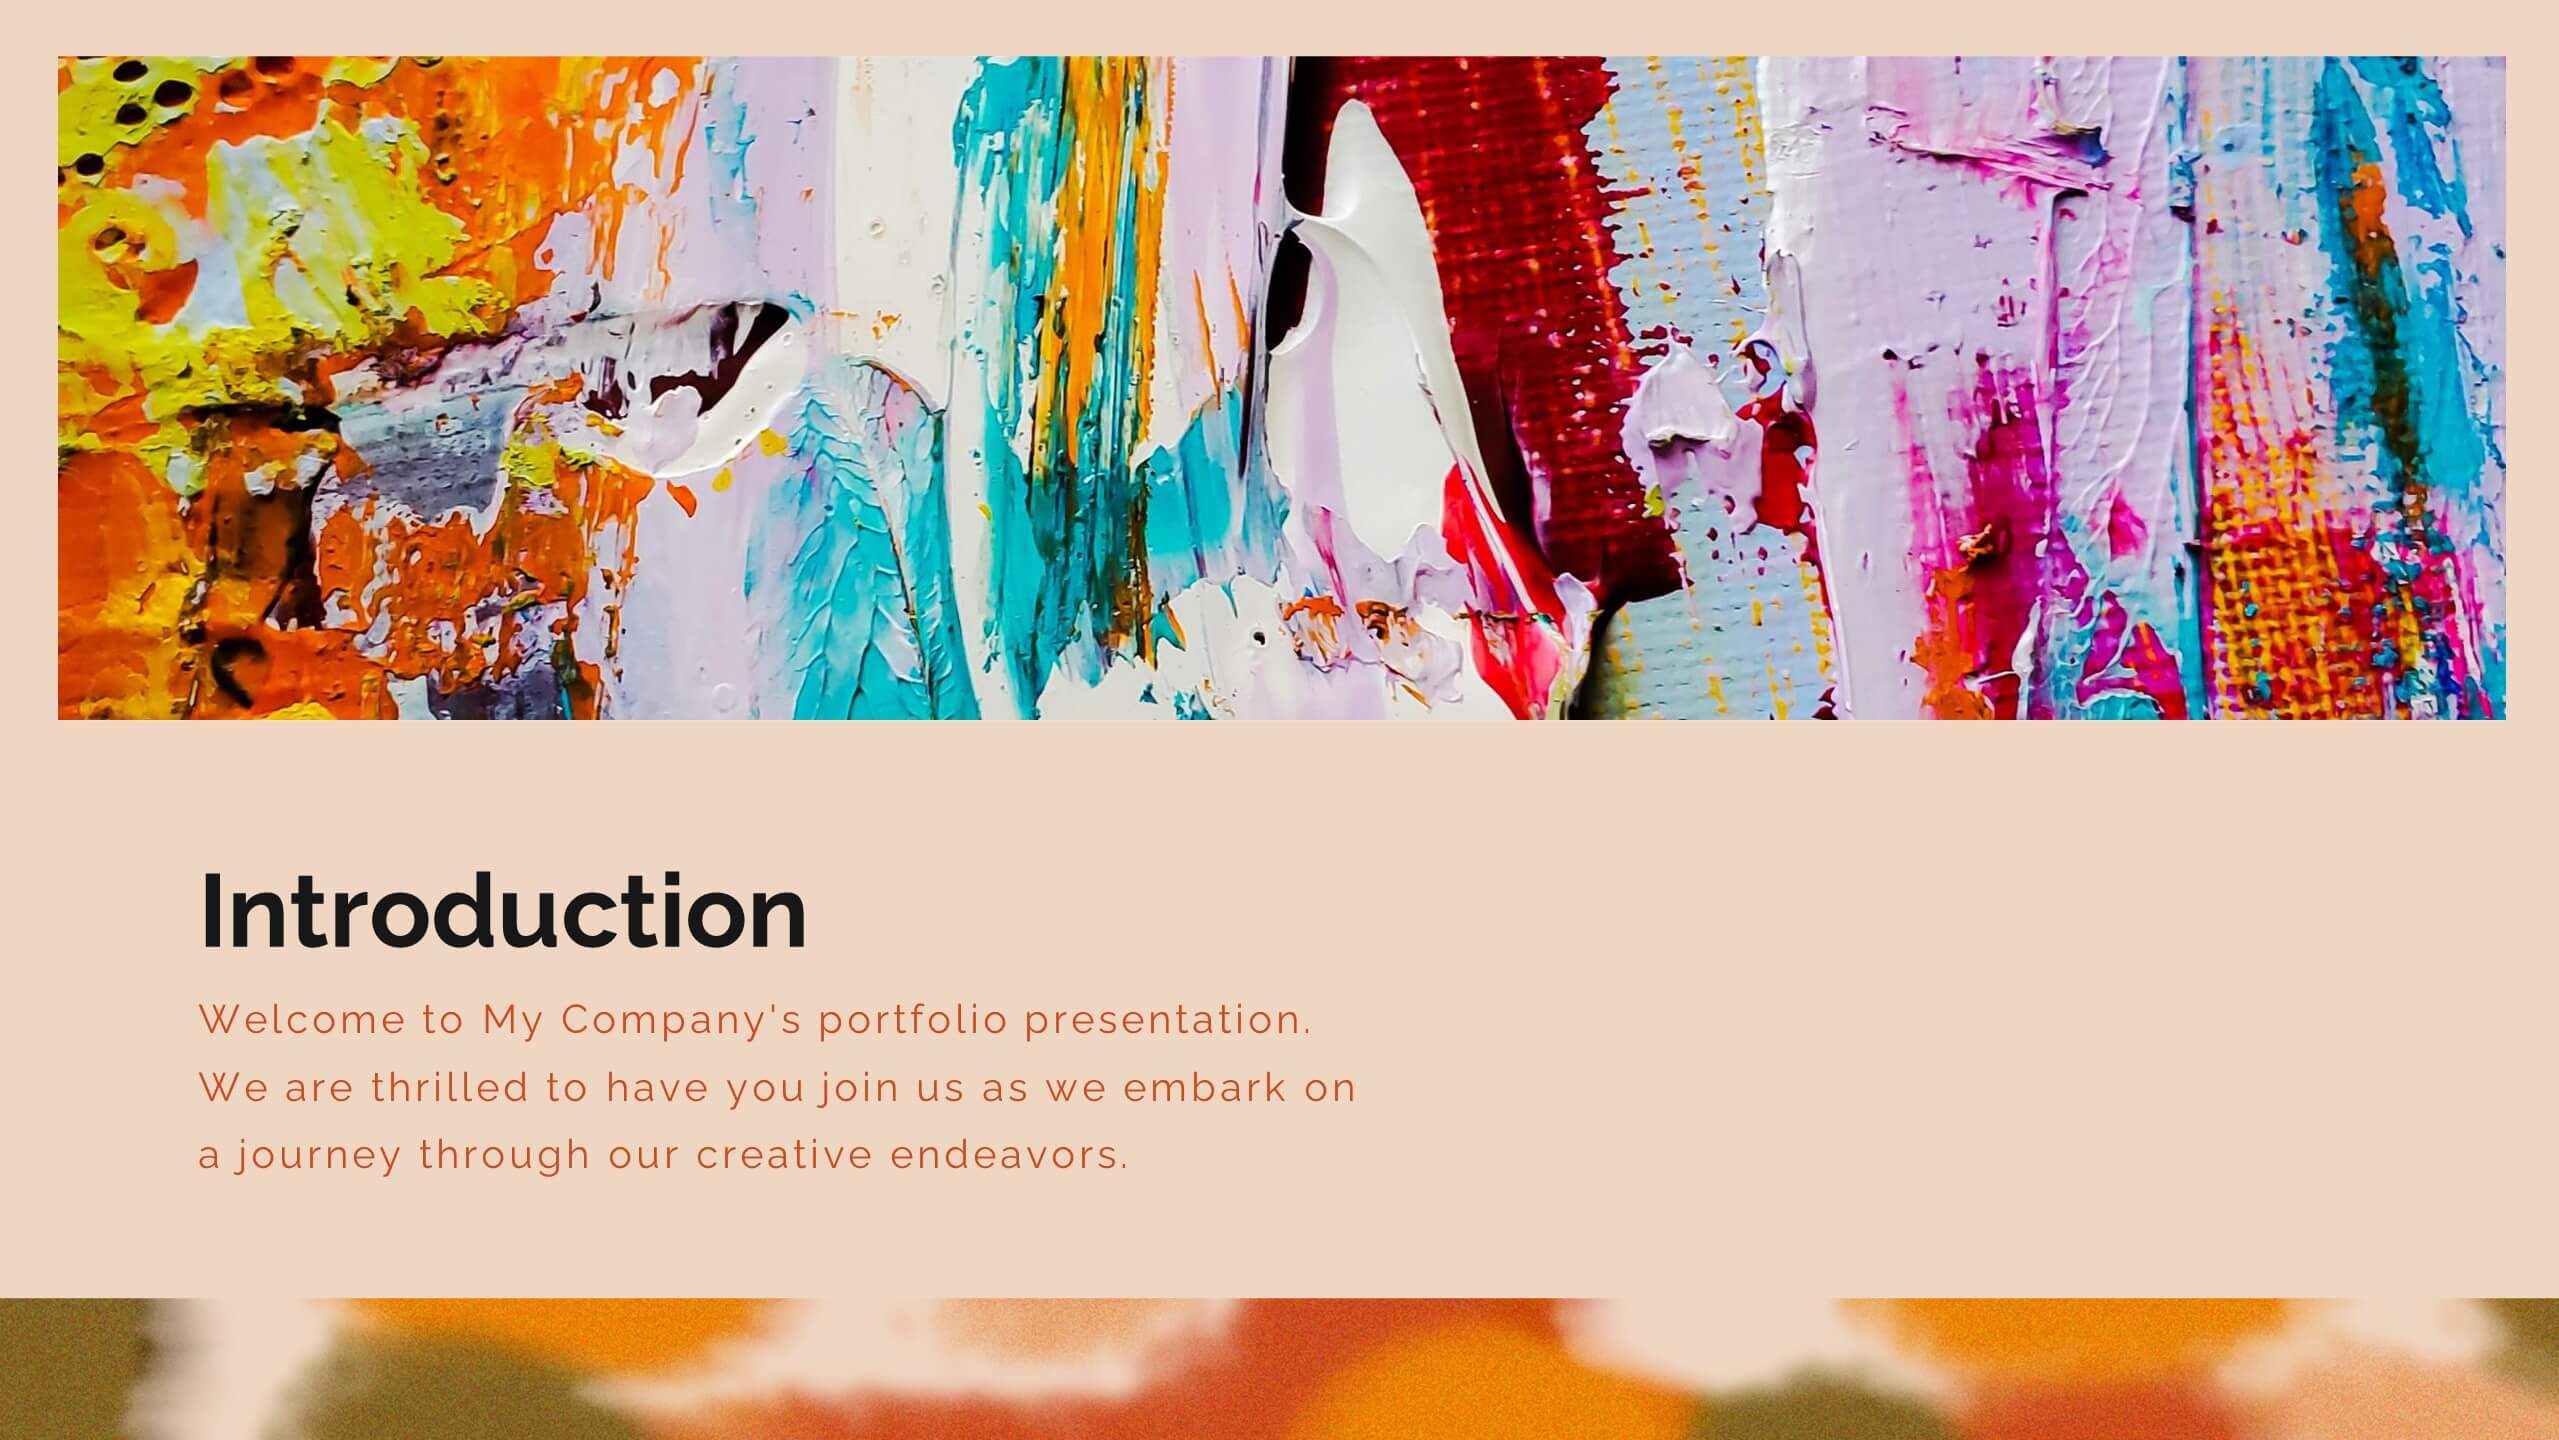
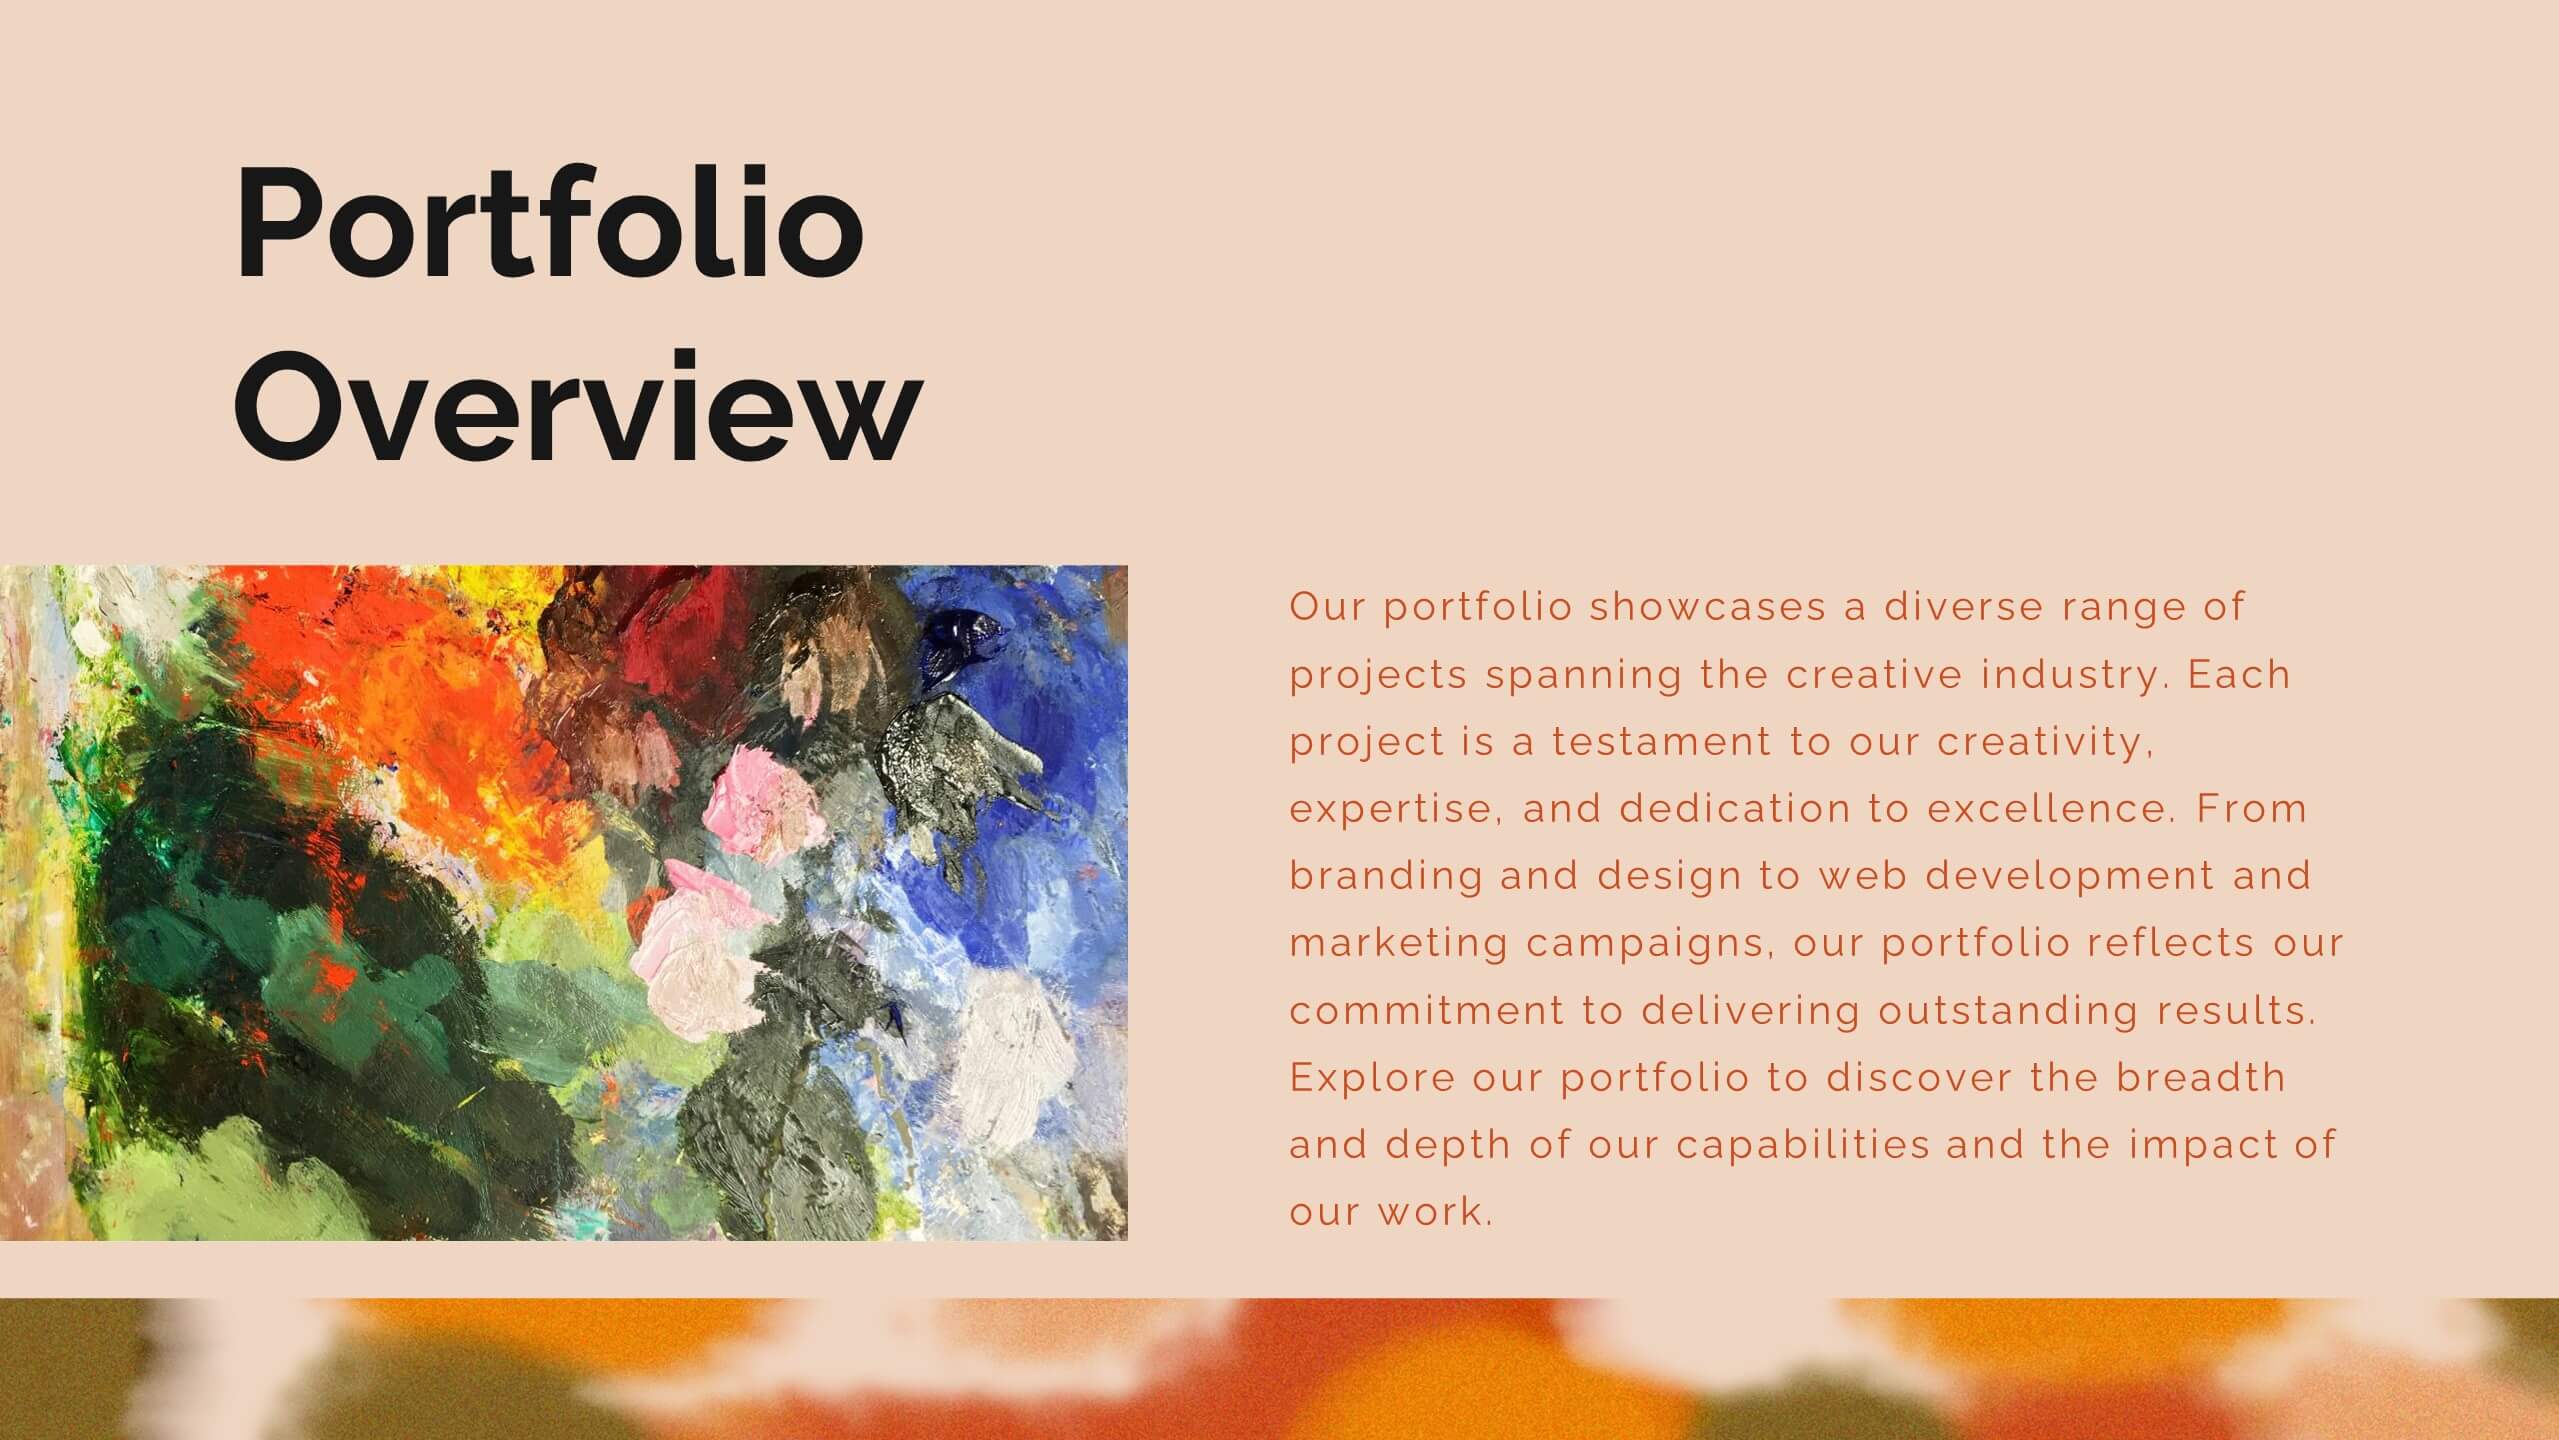
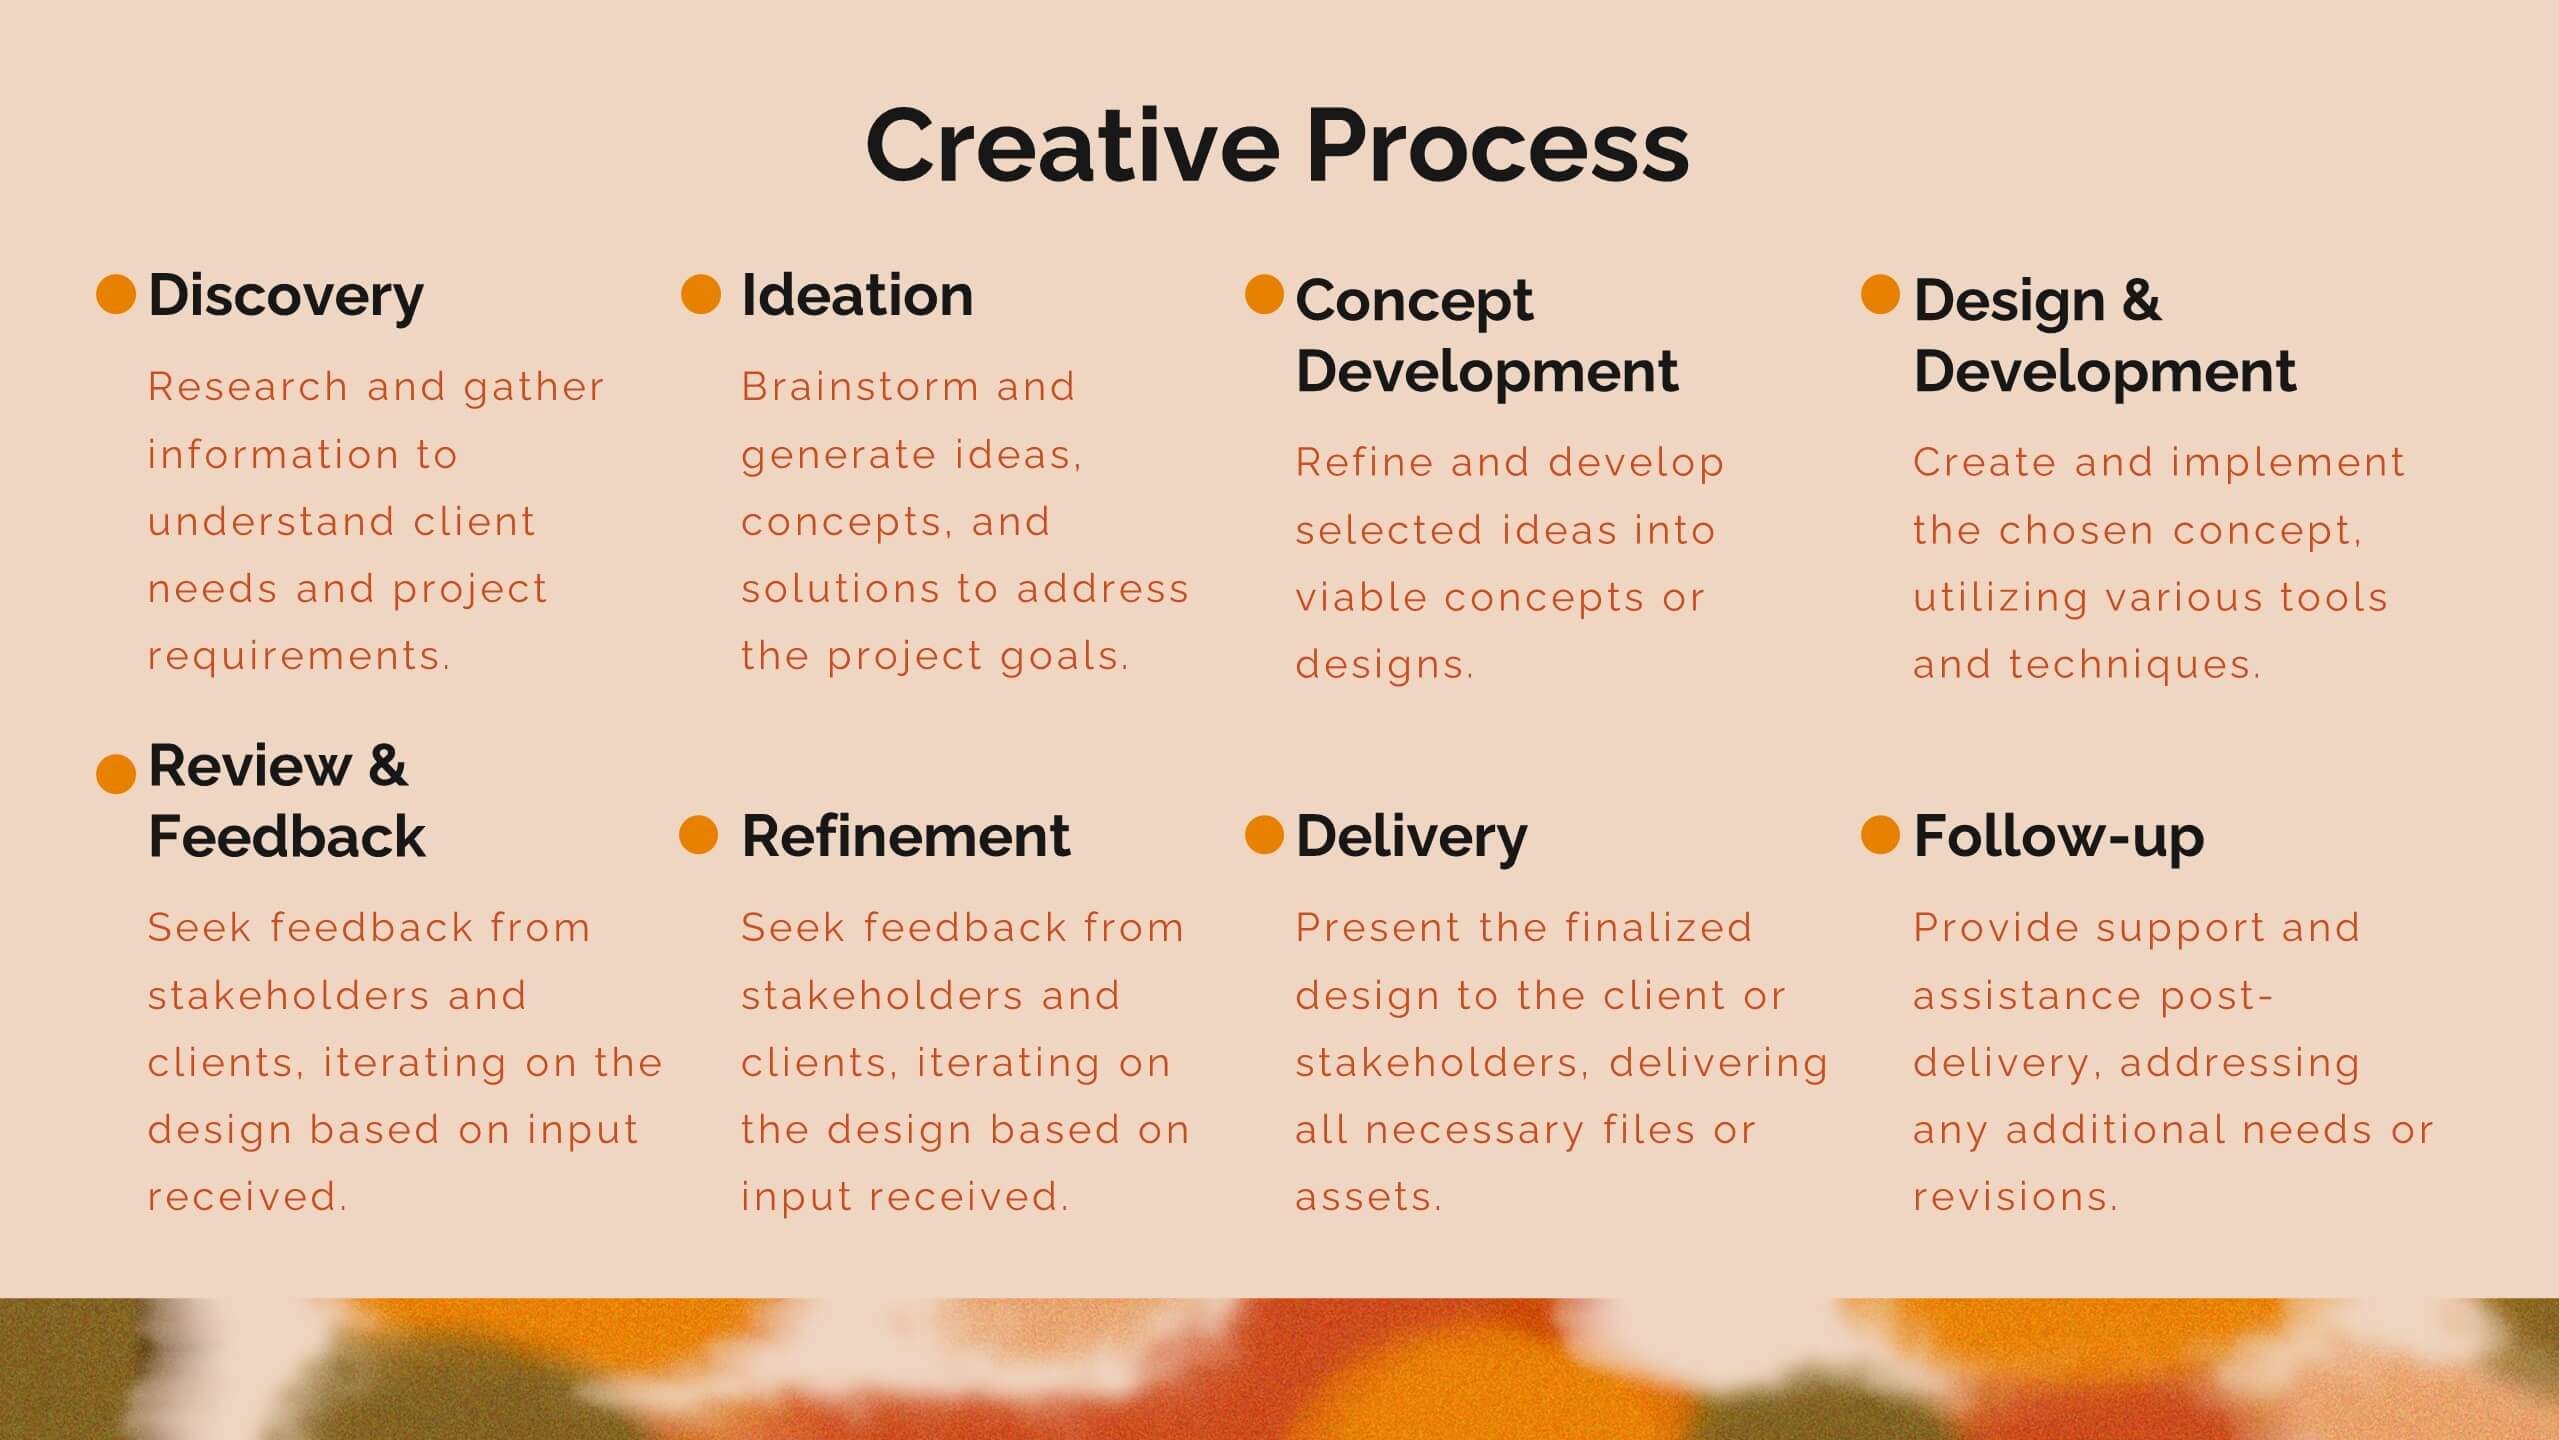
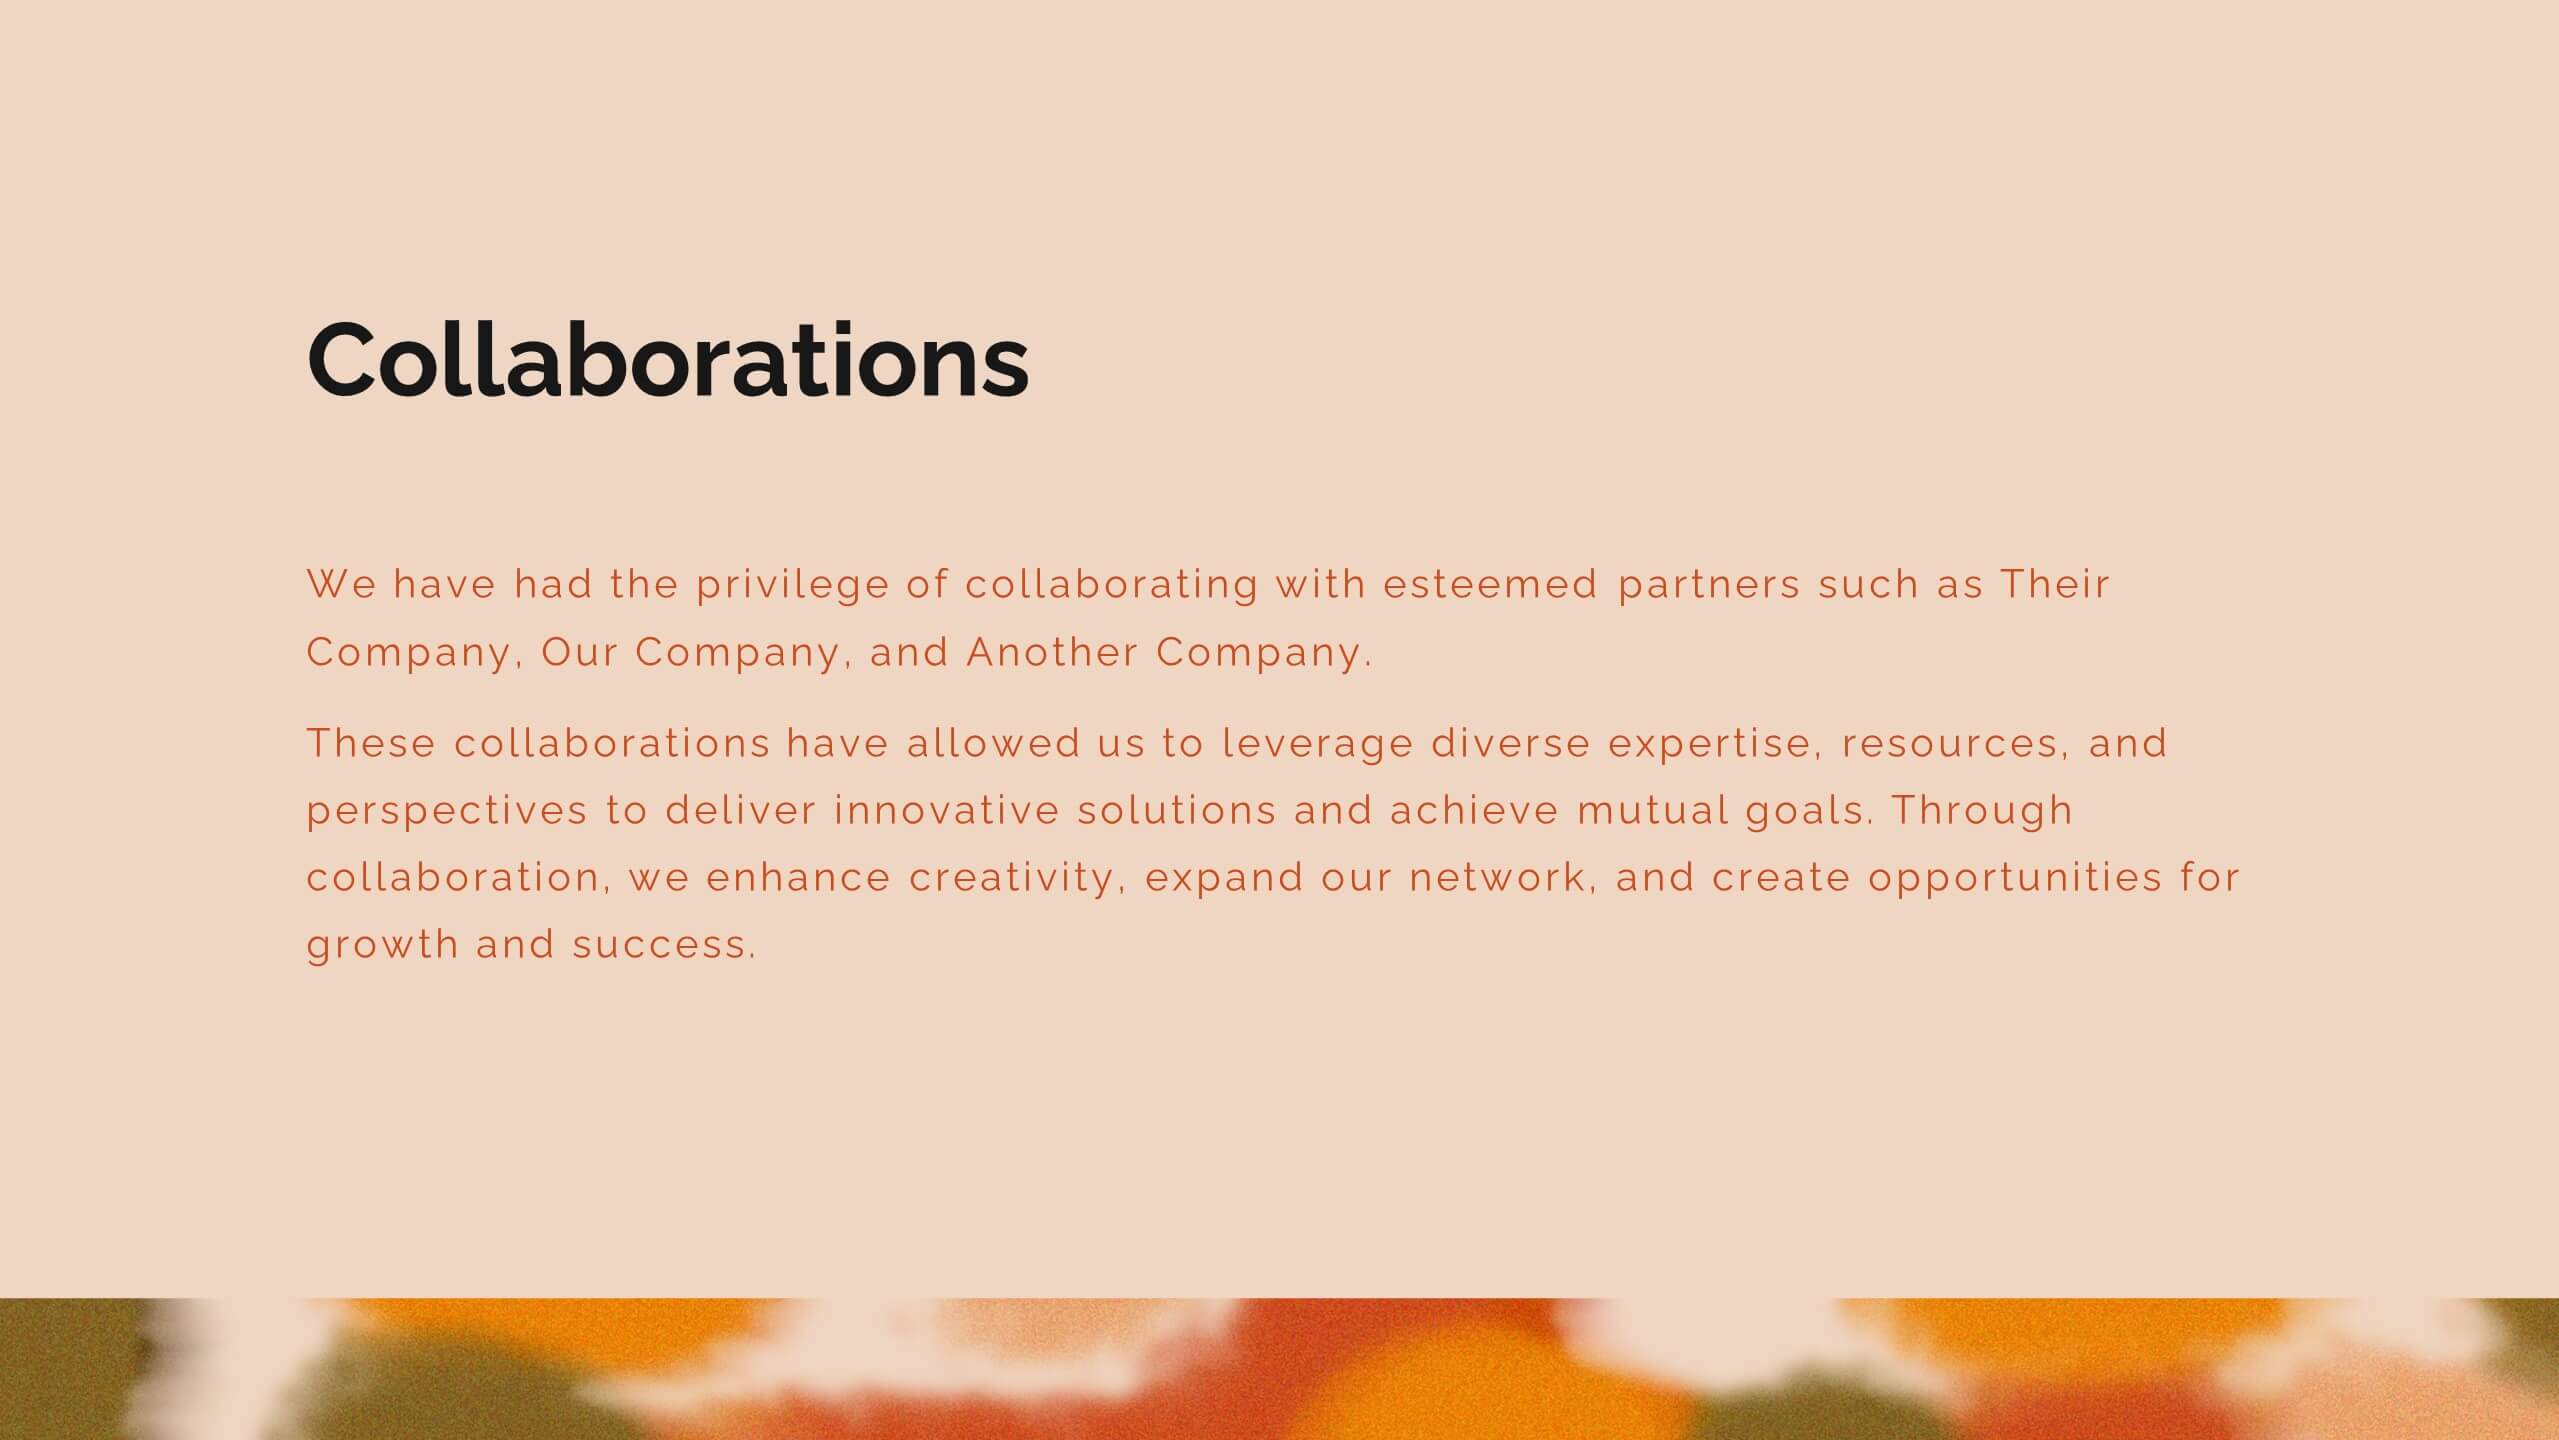
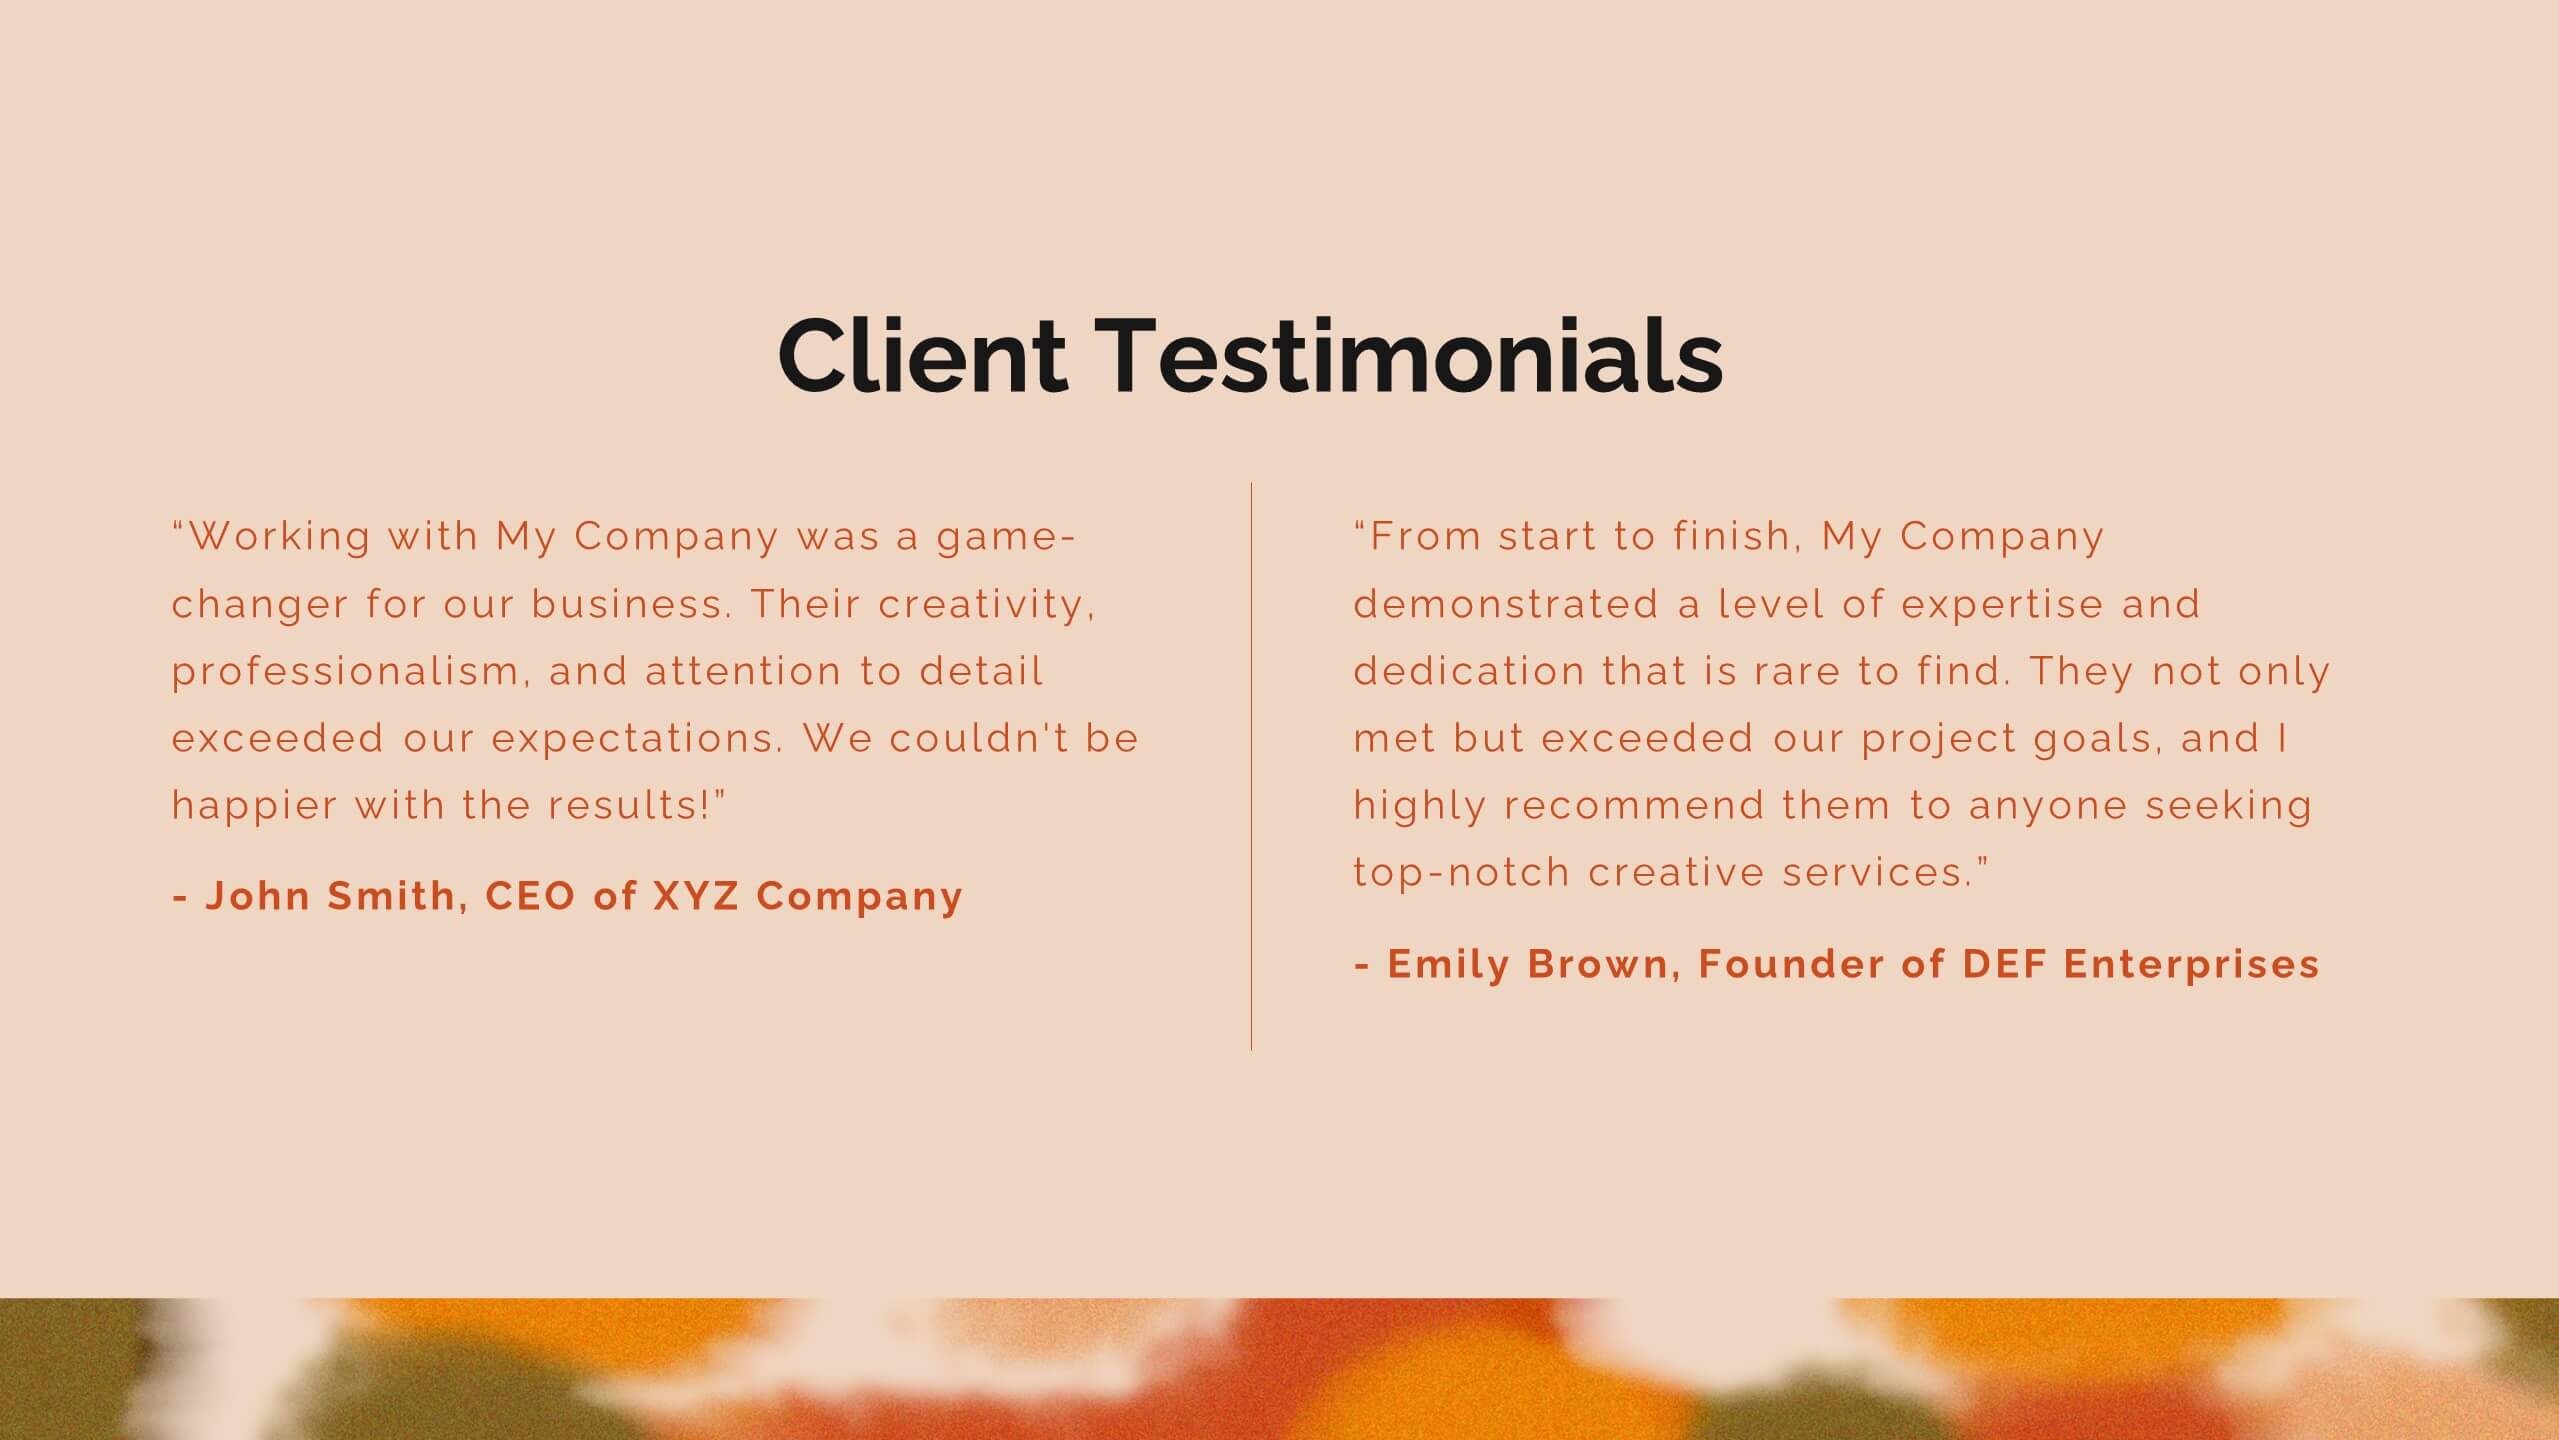
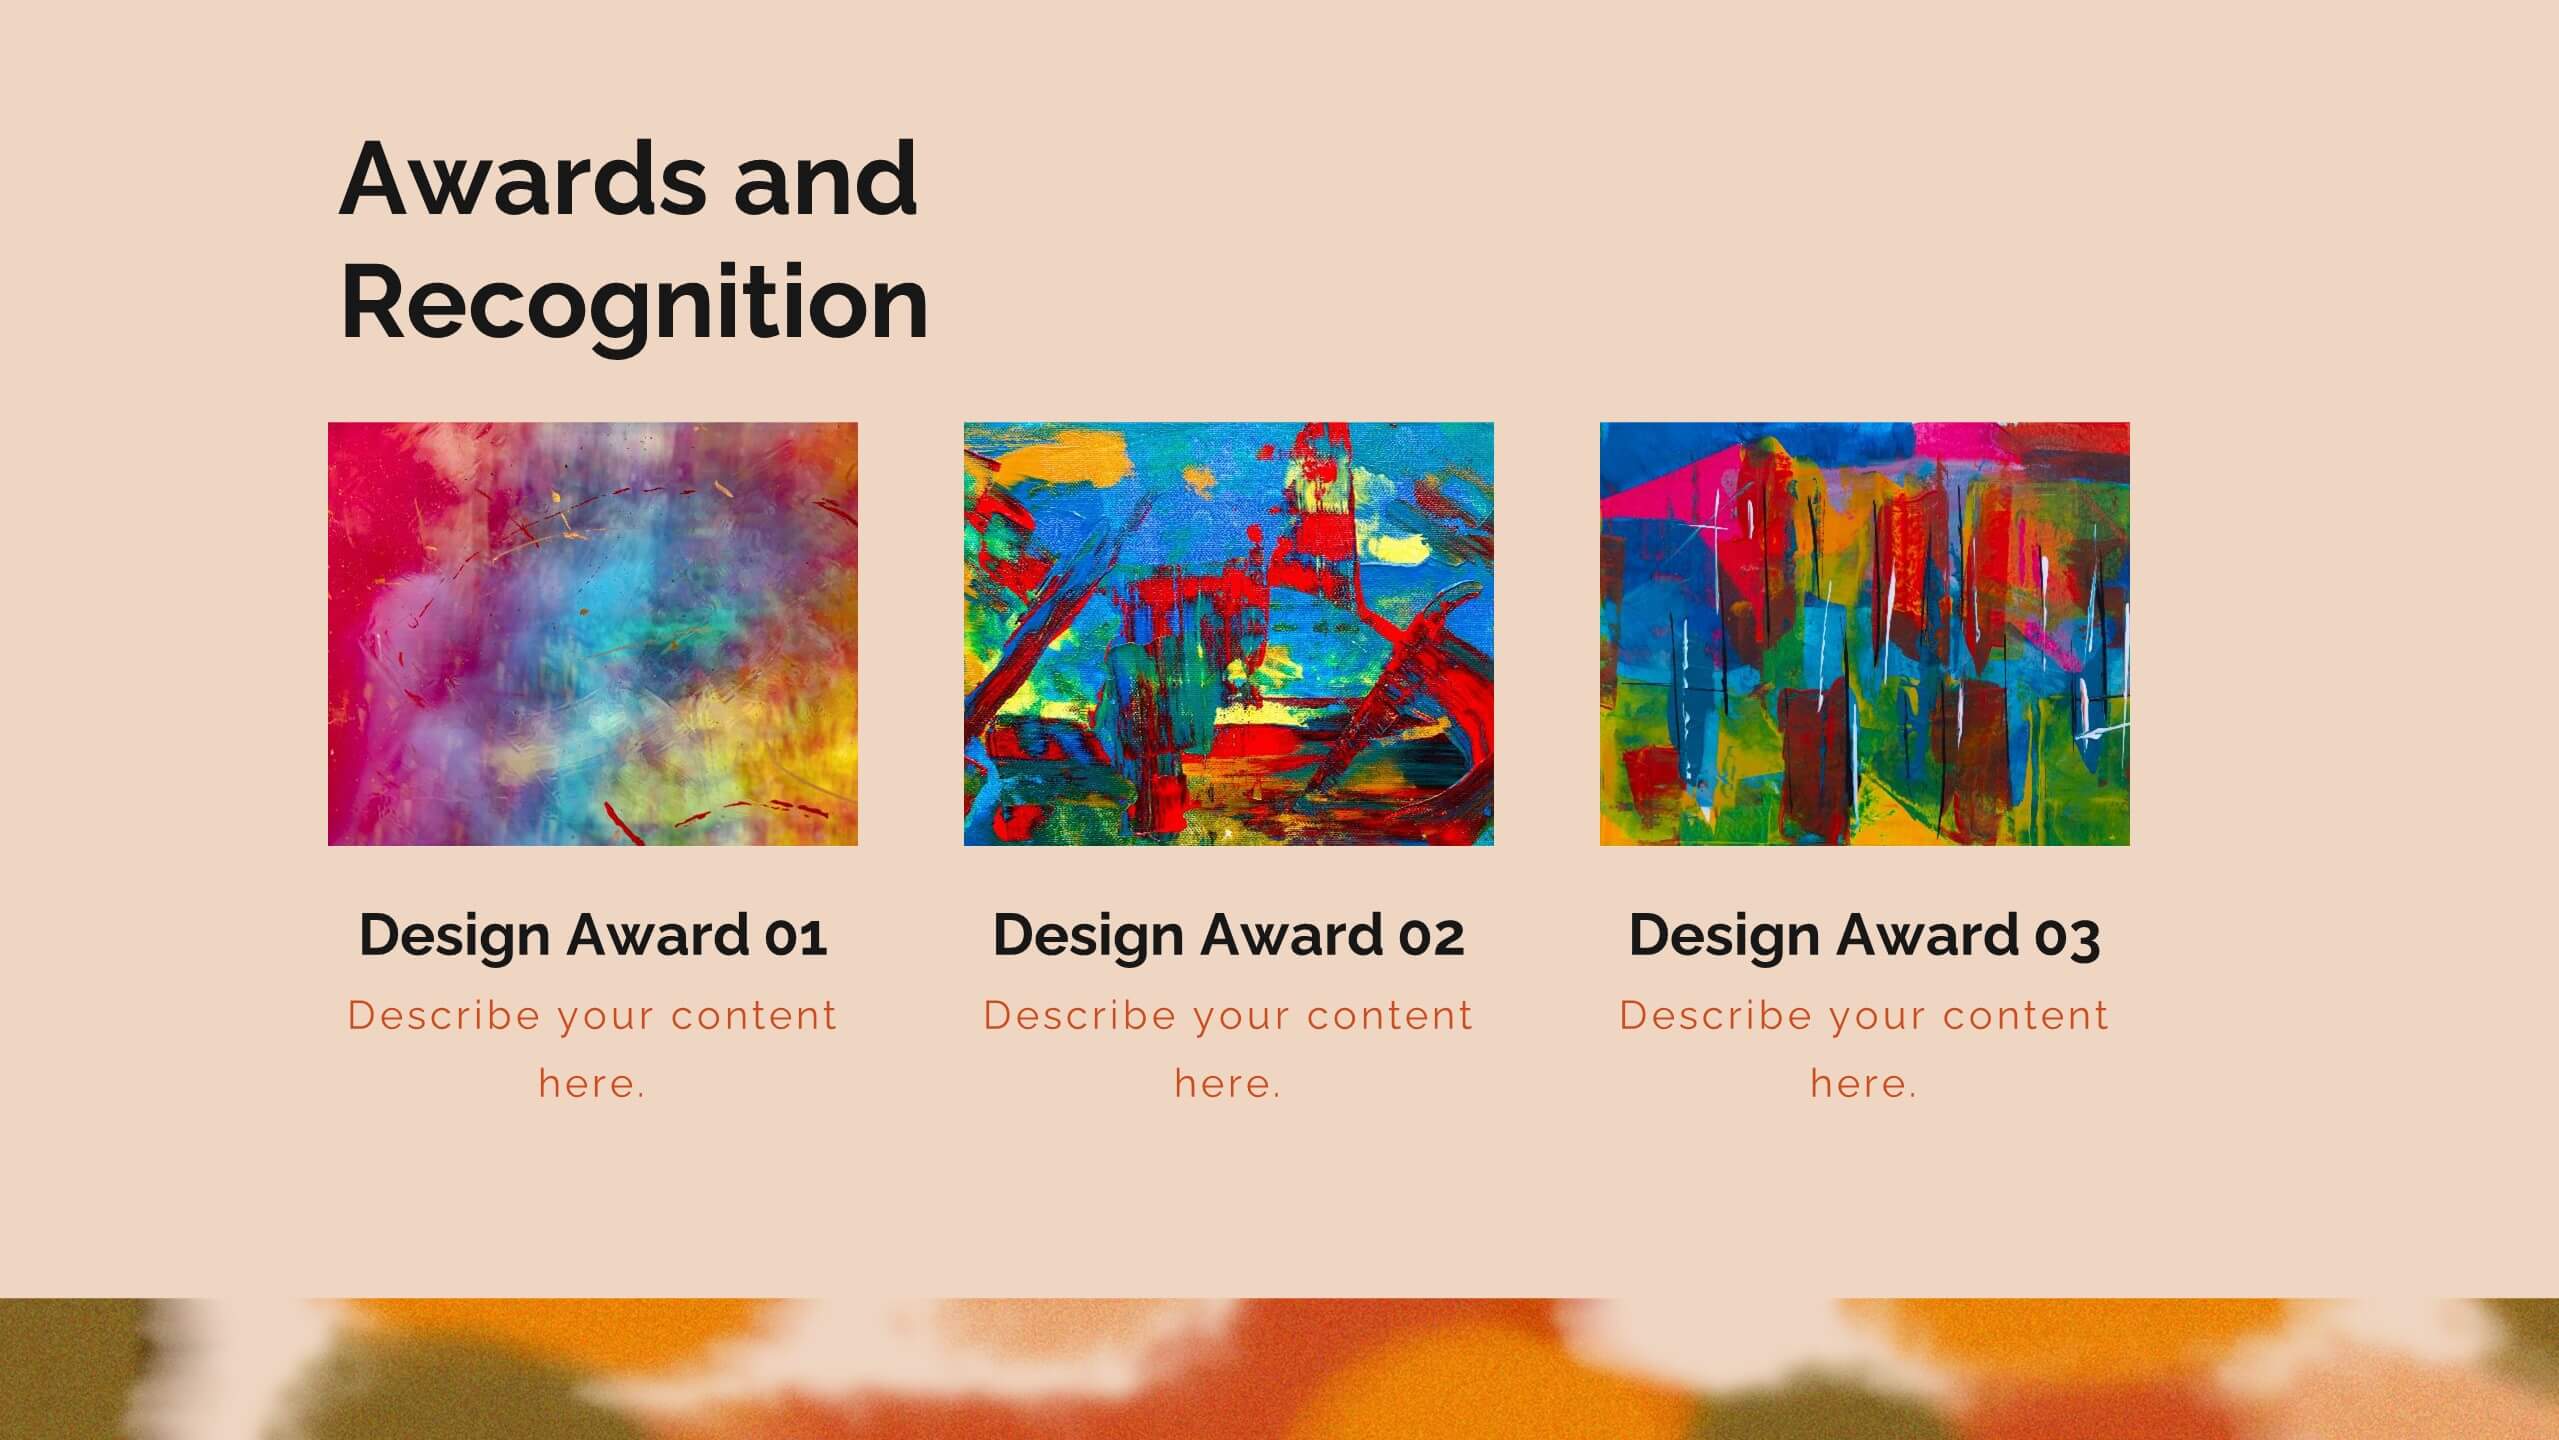
Zenith Artist Portfolio Presentation
Showcase your artistic journey with this captivating portfolio template! Perfect for presenting your projects, creative process, and client testimonials. Ideal for artists aiming to highlight their work and achievements. Compatible with PowerPoint, Keynote, and Google Slides, this template ensures your portfolio is visually stunning and professionally presented. Make your art stand out!


24 slides
Copper Small Business Pitch Deck Presentation
Elevate your business presentations with this clean and professional pitch deck template! Ideal for team meetings, business updates, or investor pitches, it includes sections for collaboration opportunities, performance metrics, and process improvements. The layout ensures clarity and focus, making it perfect for effective communication. It’s fully customizable and works seamlessly with PowerPoint, Keynote, and Google Slides for hassle-free integration.


6 slides
Machine Learning and Data Science Presentation
Deliver insights with precision using this data-driven presentation template tailored for machine learning, AI, and analytics topics. Featuring a central hub-and-spoke design, this layout allows you to showcase key components like algorithms, tools, processes, or data sources. Each segment includes clean icons and customizable titles for seamless editing. Ideal for data scientists, tech professionals, and academic presentations. Fully editable in PowerPoint, Keynote, and Google Slides.


5 slides
Iceberg Model Infographics
Introducing our Iceberg Model Infographic, this is a visual representation of the Iceberg Model which is a metaphor for understanding a problem or issue. It is based on the idea that just like an iceberg, only a small portion of the problem or issue is visible on the surface, while the majority of it lies beneath. In this vertical infographic use the top visible part of the iceberg to represent the things that are easily observed, and the larger hidden part of the iceberg can be the underlying causes or factors that are not easily visible. This is designed to help people understand the complexity of a problem and encourage them to look beyond the surface level.


6 slides
Business Success Case Study
Showcase your brand's impact with this clean, image-forward case study slide. Designed for storytelling, it outlines the Problem, Solution, and Approach alongside a product image—perfect for client wins, pitch decks, and brand storytelling. Fully customizable in PowerPoint, Keynote, and Google Slides.


7 slides
Health Infographic Presentation Template
A health infographic is a visual representation of information and data related to health. This template can be used to convey complex information about a variety of health topics, such as disease symptoms, risk factors, and preventive measures, in a simple and easily understandable manner. This Health infographic displays graphics, images, and charts to help illustrate the information and make it more engaging and accessible to your audience. This template can be used for various purposes, such as educating the public, promoting healthy habits, and informing healthcare professionals.


6 slides
Business Concepts Using Geometric Layouts Presentation
Present your key business ideas with this structured, modern layout featuring six colorful geometric segments. Ideal for showcasing strategies, goals, or processes with visual clarity. Each section allows for brief insights with clean iconography. Fully editable in PowerPoint, Google Slides, Keynote, and Canva—perfect for professional, client-facing presentations.