


Features
- 5 Unique slides
- Fully editable and easy to edit in Microsoft Powerpoint, Keynote and Google Slides
- 16:9 widescreen layout
- Clean and professional designs
- Export to JPG, PDF or send by email


Do you have any questions?
Recommend


5 slides
Training and Development Onboarding
Streamline your employee learning journey with the Training and Development Onboarding Presentation. This modern, five-step roadmap uses a wave-style flow from A to E, allowing you to break down each stage of training with matching step labels and title placeholders. Ideal for HR professionals, team leaders, and onboarding managers, it’s perfect for introducing structured learning, role-specific training, or compliance modules. Compatible with PowerPoint, Keynote, and Google Slides, and fully editable to match your brand style.


4 slides
Editable Table Chart Presentation
Simplify side-by-side evaluations with the Editable Table Chart Presentation. Designed for clear comparisons, this layout uses checkmarks, icons, and a clean structure to display features or data across multiple categories. It's perfect for showcasing product options, service tiers, or strategic alternatives. Fully customizable and compatible with PowerPoint, Keynote, and Google Slides.


7 slides
Customer Thank You Infographic
Elevate your expressions of gratitude with this sophisticated collection, designed to blend elegance with heartfelt thanks. Each piece in this set is crafted with meticulous attention to detail, featuring a mix of subtle color palettes, elegant typography, and beautifully arranged visual elements to enhance the sincerity of your message. Choose from a variety of designs, ranging from minimalist to more richly layered compositions, each providing a unique way to communicate appreciation. These designs can be customized to suit any occasion, making them perfect for expressing professional thanks to clients, customers, or partners. Ideal for use across both digital and physical mediums, this collection helps ensure that your messages not only convey thanks but also resonate deeply with recipients, strengthening relationships and leaving a memorable impression.


4 slides
Property Investment and Housing Report Presentation
Present your Property Investment and Housing Report with this structured real estate-themed presentation template. Featuring a house-shaped design with ascending financial metrics, this layout is perfect for illustrating market trends, investment growth, and housing analysis. Ideal for real estate agents, property developers, and financial analysts, this template makes data visually engaging and easy to understand. Fully customizable and compatible with PowerPoint, Keynote, and Google Slides.


6 slides
Global Transportation & Logistics Infographics
The "Global Transportation and Logistics" infographic template, suitable for PowerPoint, Keynote, and Google Slides, is an invaluable tool for professionals in the logistics, shipping, and supply chain industries. This comprehensive template is designed to effectively communicate the complexities and scope of global transportation and logistics. This template features key elements such as global shipping routes, logistics management, and supply chain operations. Its detailed and informative design is perfect for presentations that need to illustrate the intricacies of global logistics, from transportation networks to logistical challenges. This is especially useful for strategic planning, educational purposes, or corporate presentations in the logistics sector. The color scheme of the template reflects global connectivity and efficiency, incorporating shades of blue, green, and earth tones. This professional and visually appealing design not only enhances the clarity of the information but also adds a global perspective to your presentation. Whether used for training, client meetings, or industry conferences, this template ensures your insights into global transportation and logistics are presented with precision and professionalism.


4 slides
Environmental Impact Assessment Presentation
Bring your audience into a greener future with a clean, leaf-inspired design that makes complex sustainability insights feel clear and approachable. This presentation helps you break down key environmental factors, impact areas, and responsible planning in a simple visual flow. Fully editable and compatible with PowerPoint, Keynote, and Google Slides.


6 slides
Oceania Biome Map Infographics
Explore our versatile Oceania Biome Map infographic template, a powerful tool for visualizing the diverse ecosystems in the Oceania region. This template is compatible with popular presentation software such as PowerPoint, Keynote, and Google Slides, allowing you to effortlessly customize it to meet your specific needs. The Oceania Biome Map infographic template serves as a foundational framework for displaying information about various biomes, including rainforests, deserts, coral reefs, and more. Whether you're an educator, environmentalist, or simply interested in Oceania's ecology, this template provides a user-friendly platform for creating informative presentations and educational materials. Impress your audience with this SEO-optimized Oceania Biome Map infographic template, thoughtfully designed for clarity and ease of use. Customize it to showcase the unique characteristics and biodiversity of Oceania's biomes, making it an invaluable resource for your projects and presentations. Begin crafting your personalized infographic today!


5 slides
Organizational and IT Network Mapping Presentation
Visualize internal roles and technical relationships with this Organizational and IT Network Mapping template. Ideal for IT teams, operations, or management, it helps illustrate user access, collaboration patterns, and system connections. Fully customizable and compatible with PowerPoint, Keynote, and Google Slides for a seamless integration into your presentations.


5 slides
Layered Circular Model for Strategy Presentation
Communicate complex strategies with ease using the Layered Circular Model for Strategy Presentation. This 3D-style infographic breaks down your framework into five distinct levels, making it ideal for visualizing hierarchies, stages, or priorities. Each layer is fully editable and labeled for customization. Works with PowerPoint, Google Slides, and Canva.


6 slides
Agenda Network Infographic
Elevate your networking events with our sophisticated collection of agenda slide templates. These slides are crafted to structure and present the flow of activities at networking events, making them essential for coordinators who aim to foster professional connections among attendees. Each template is designed with clarity and style, featuring clean lines and modern graphics to outline key segments of your event, such as welcome remarks, networking sessions, panel discussions, and closing statements. The thoughtful layout includes designated spaces for time slots, session titles, and speaker details, ensuring that participants can easily follow the event's progression and plan their participation accordingly. These slides are fully customizable, allowing you to match the visual design with your event’s theme or corporate branding. The adaptable format makes it simple to insert or remove sections based on the specific needs of your event. Ideal for business conferences, industry meet-ups, or any professional gathering, these agenda slides help you manage and execute a seamless networking experience.


20 slides
Firelight Design Portfolio Presentation
This Design Portfolio Presentation Template offers a bold and modern layout to showcase your creative projects, services, and achievements. It features sections for project highlights, awards, client testimonials, and pricing, making it perfect for freelancers and agencies. Fully customizable in PowerPoint, Keynote, and Google Slides.


5 slides
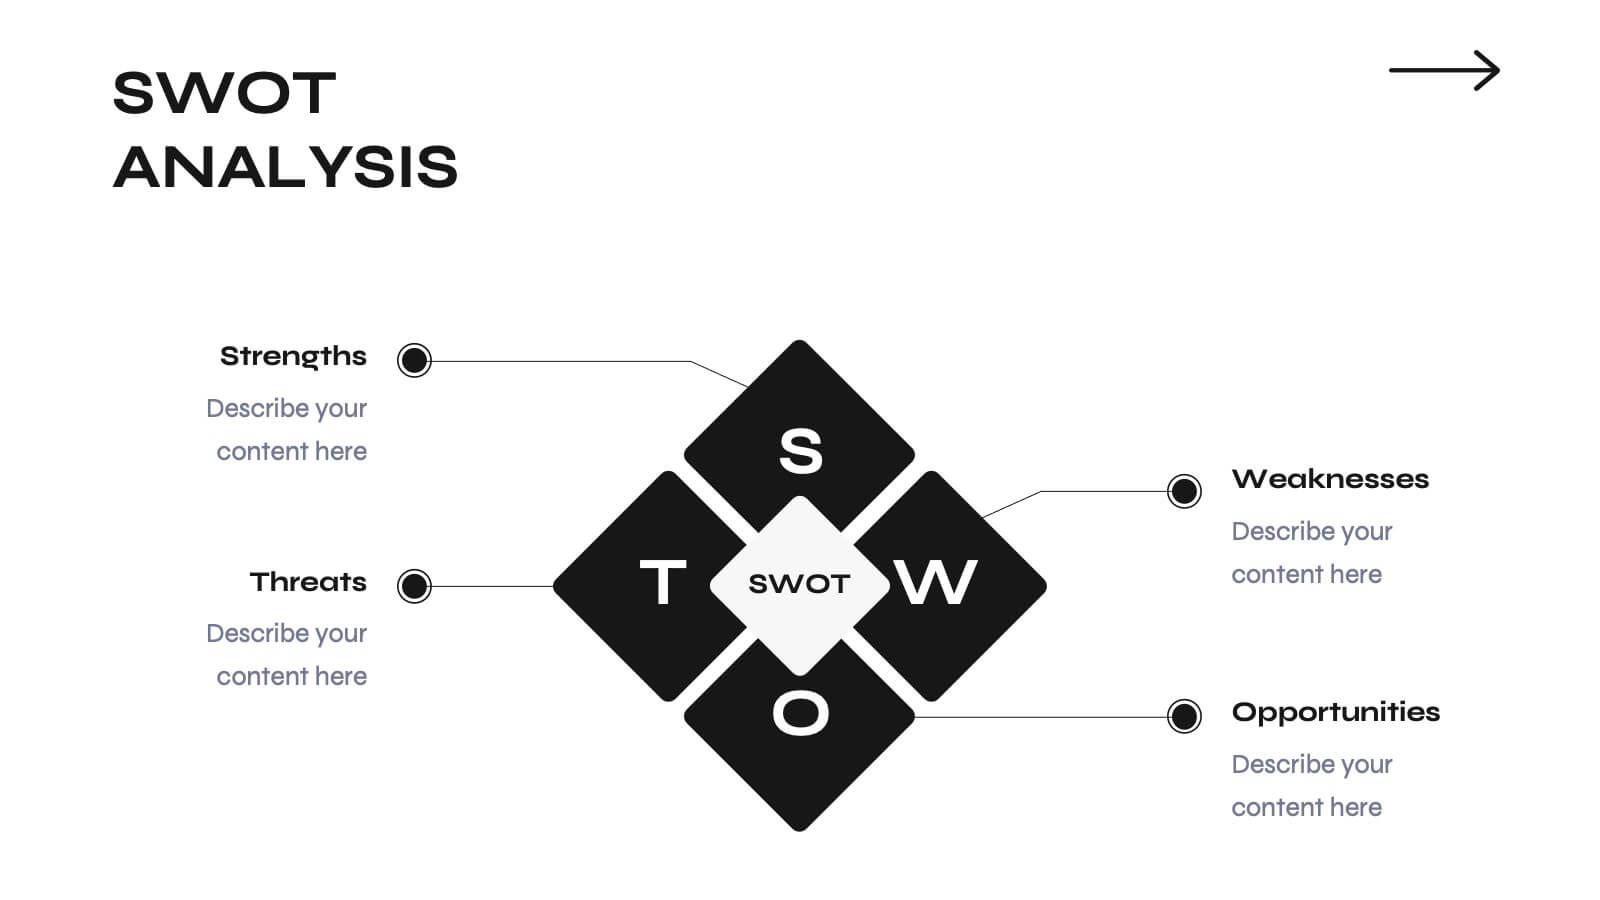
Business SWOT Evaluation Framework Presentation
Deliver clear strategic analysis with the Business SWOT Evaluation Framework Presentation. This layout features a modern quadrant design that segments Strengths, Weaknesses, Opportunities, and Threats around a central focus, making your insights easy to digest. Fully editable in PowerPoint, Canva, and Google Slides—perfect for business planning and executive reporting.


5 slides
Employee Change Management Plan Presentation
Guide employees through transitions with clarity using this Employee Change Management Plan template. This step-by-step visual represents progress from initial stages (20%) to full implementation (100%), making it ideal for HR strategies, organizational development, and workforce transformation initiatives. Fully customizable—adjust colors, text, and data points to fit your business needs. Compatible with PowerPoint, Keynote, and Google Slides for seamless integration into your presentations.


5 slides
European Countries Editable Map Presentation
Bring your data to life with a detailed and modern map layout that showcases insights across Europe. Perfect for visualizing country comparisons, regional statistics, or business expansion plans, this clean design ensures clarity and impact. Fully compatible with PowerPoint, Keynote, and Google Slides for easy editing and presentation.

21 slides
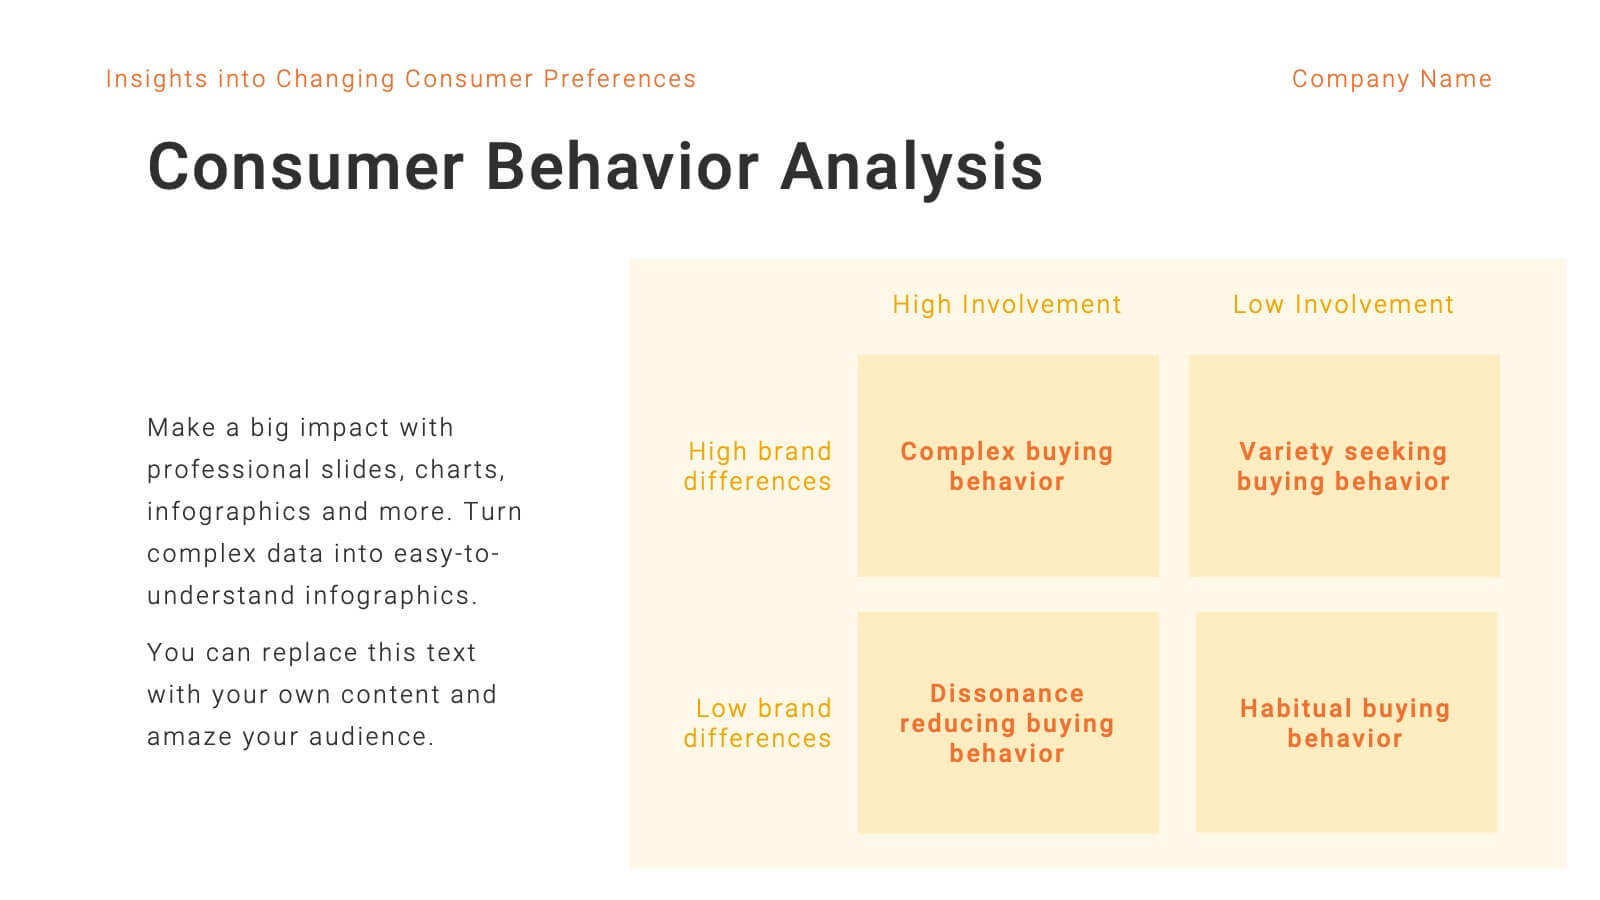
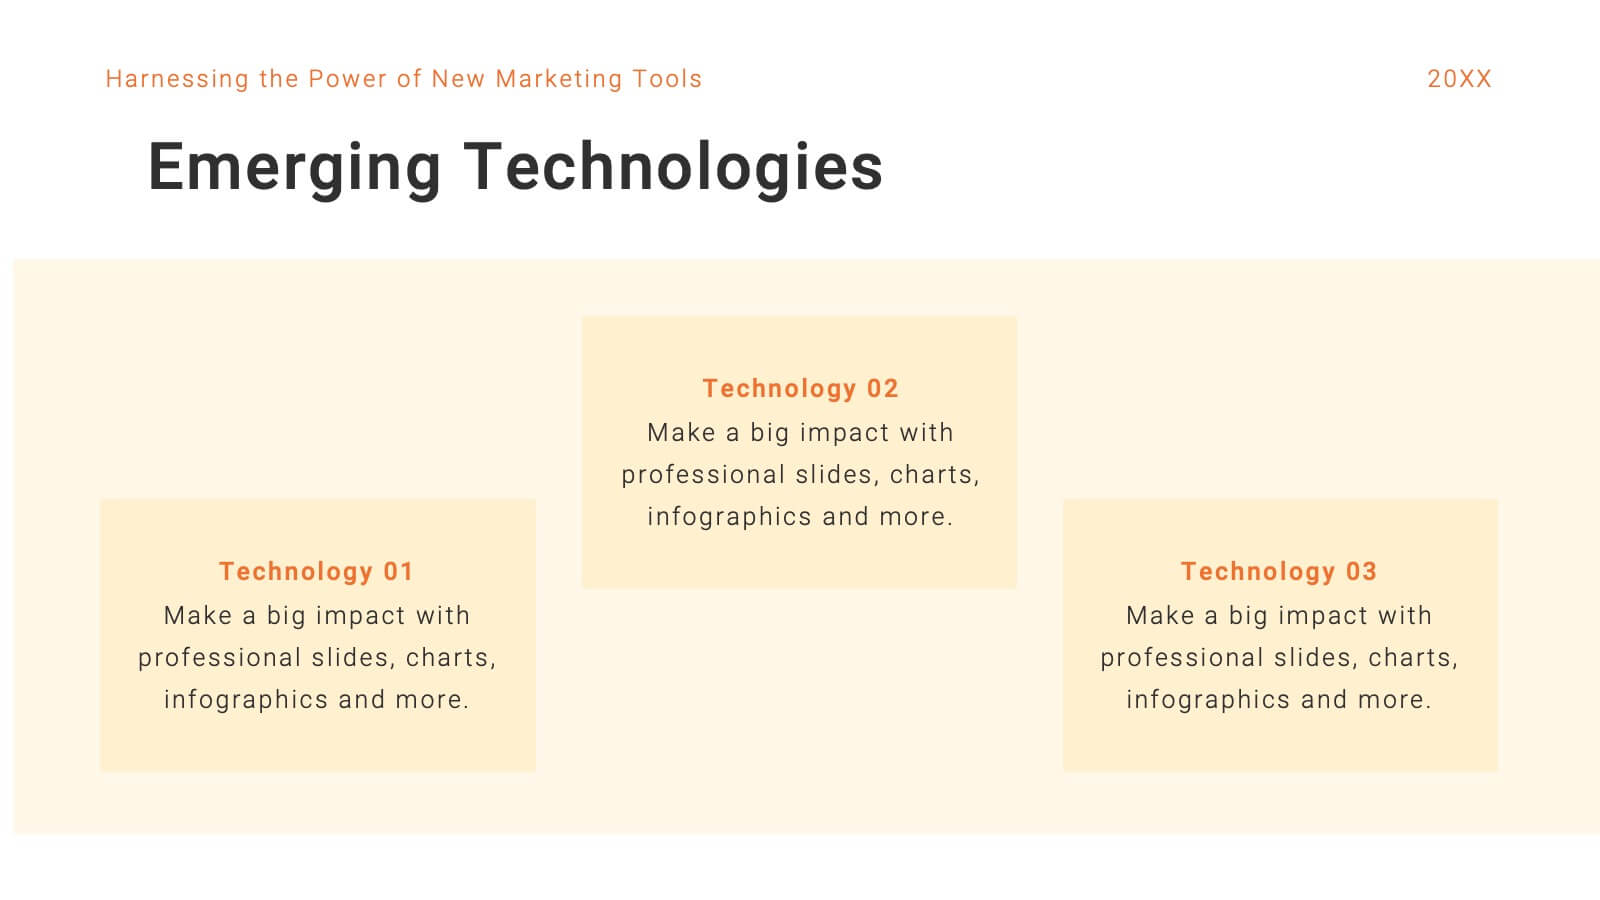
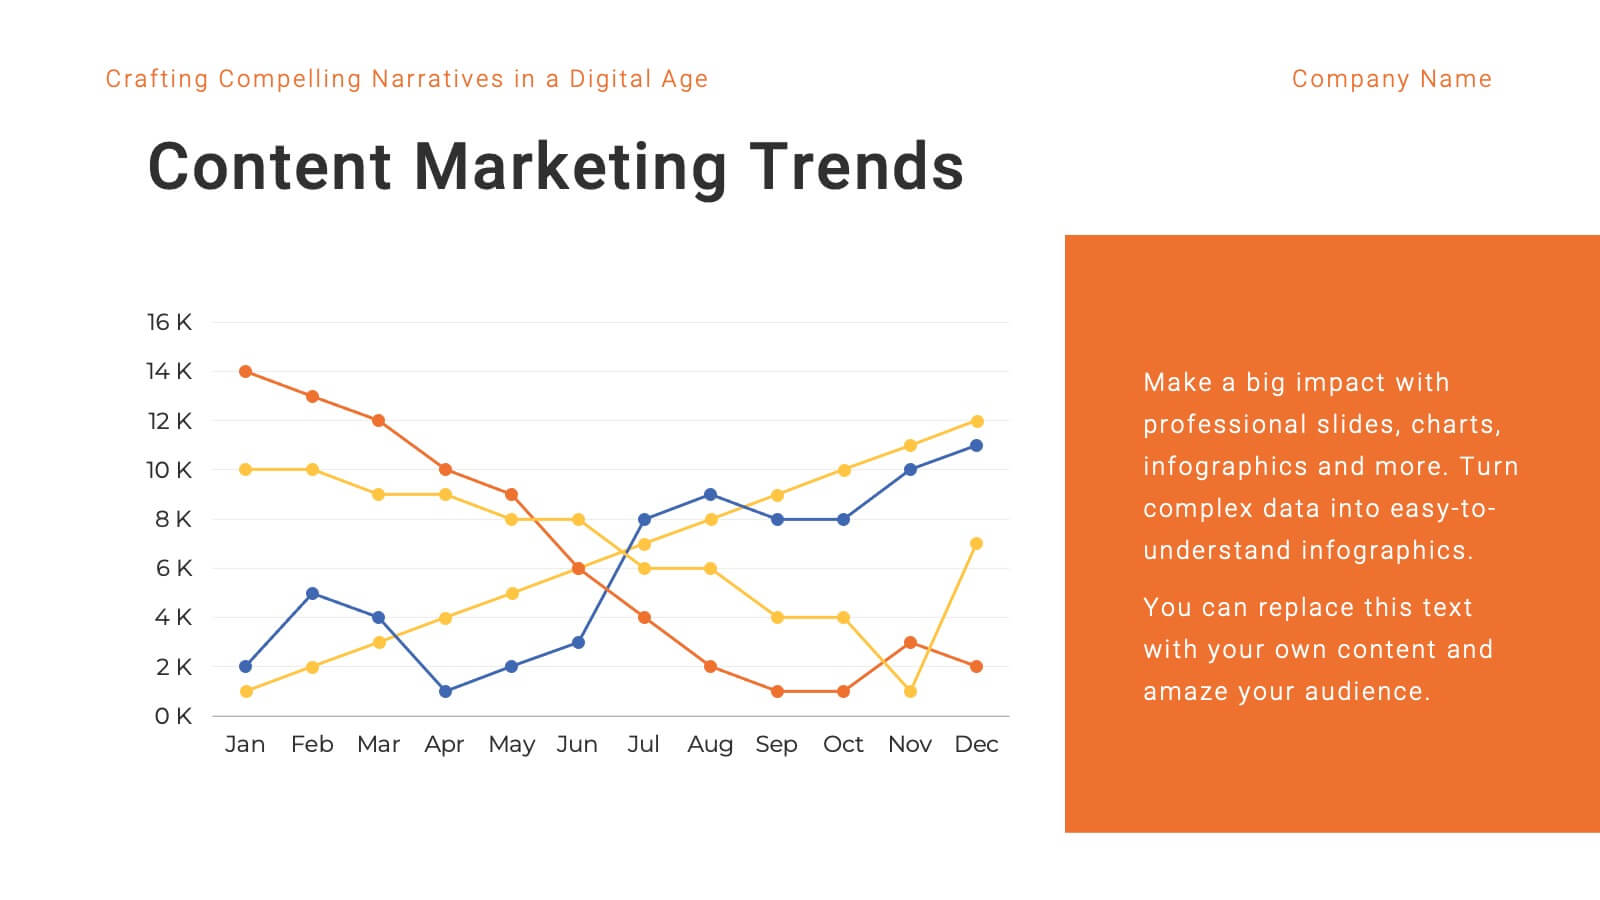
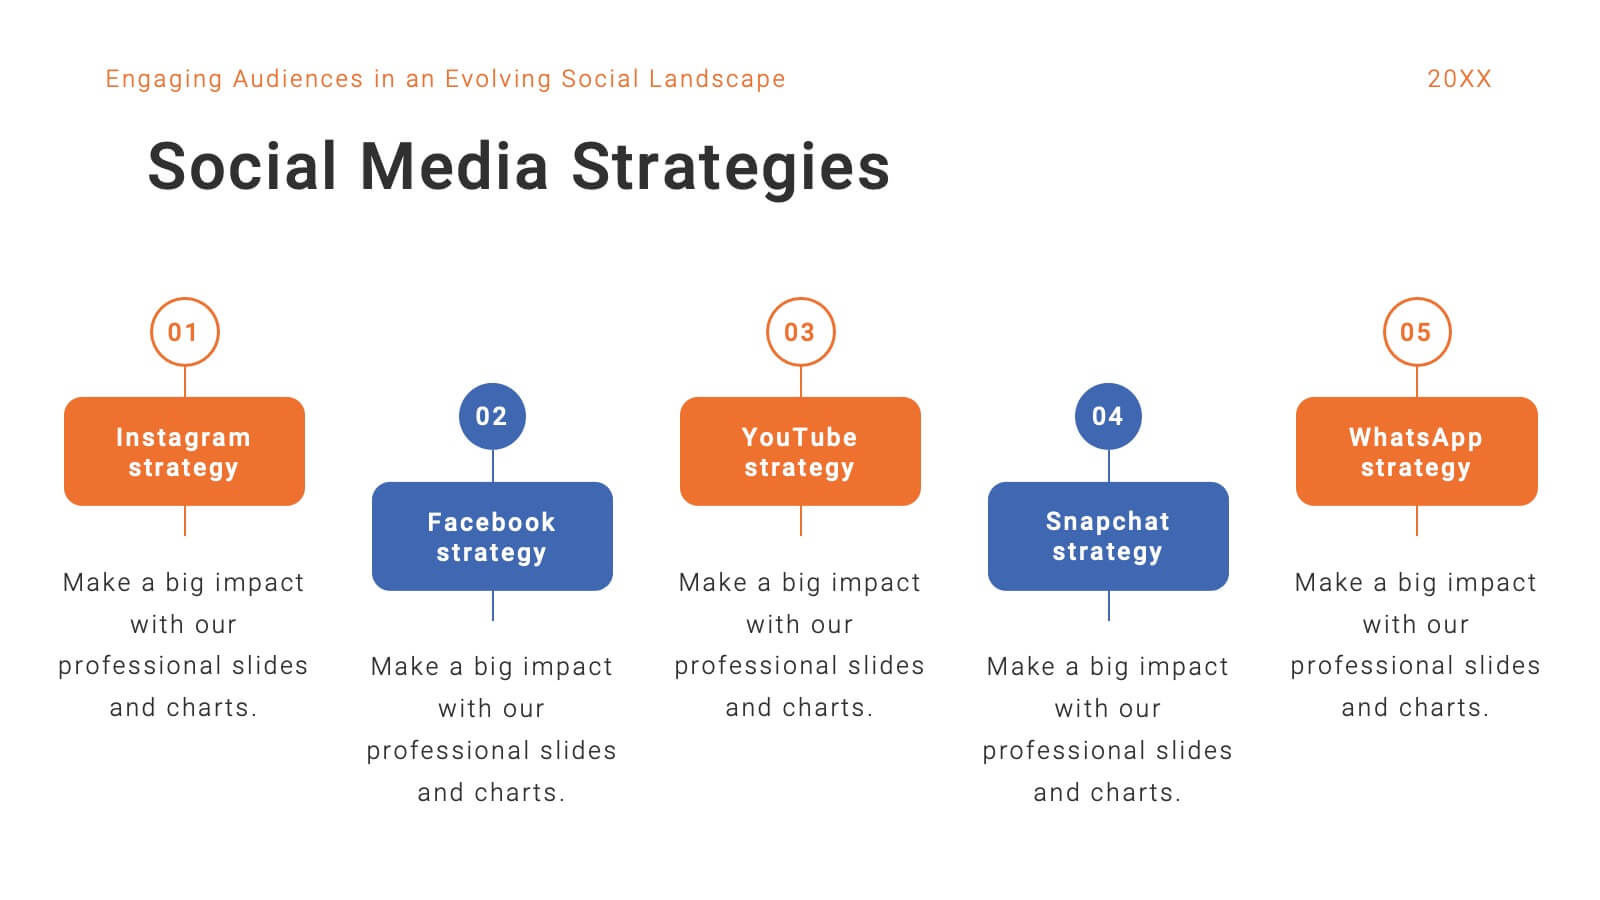
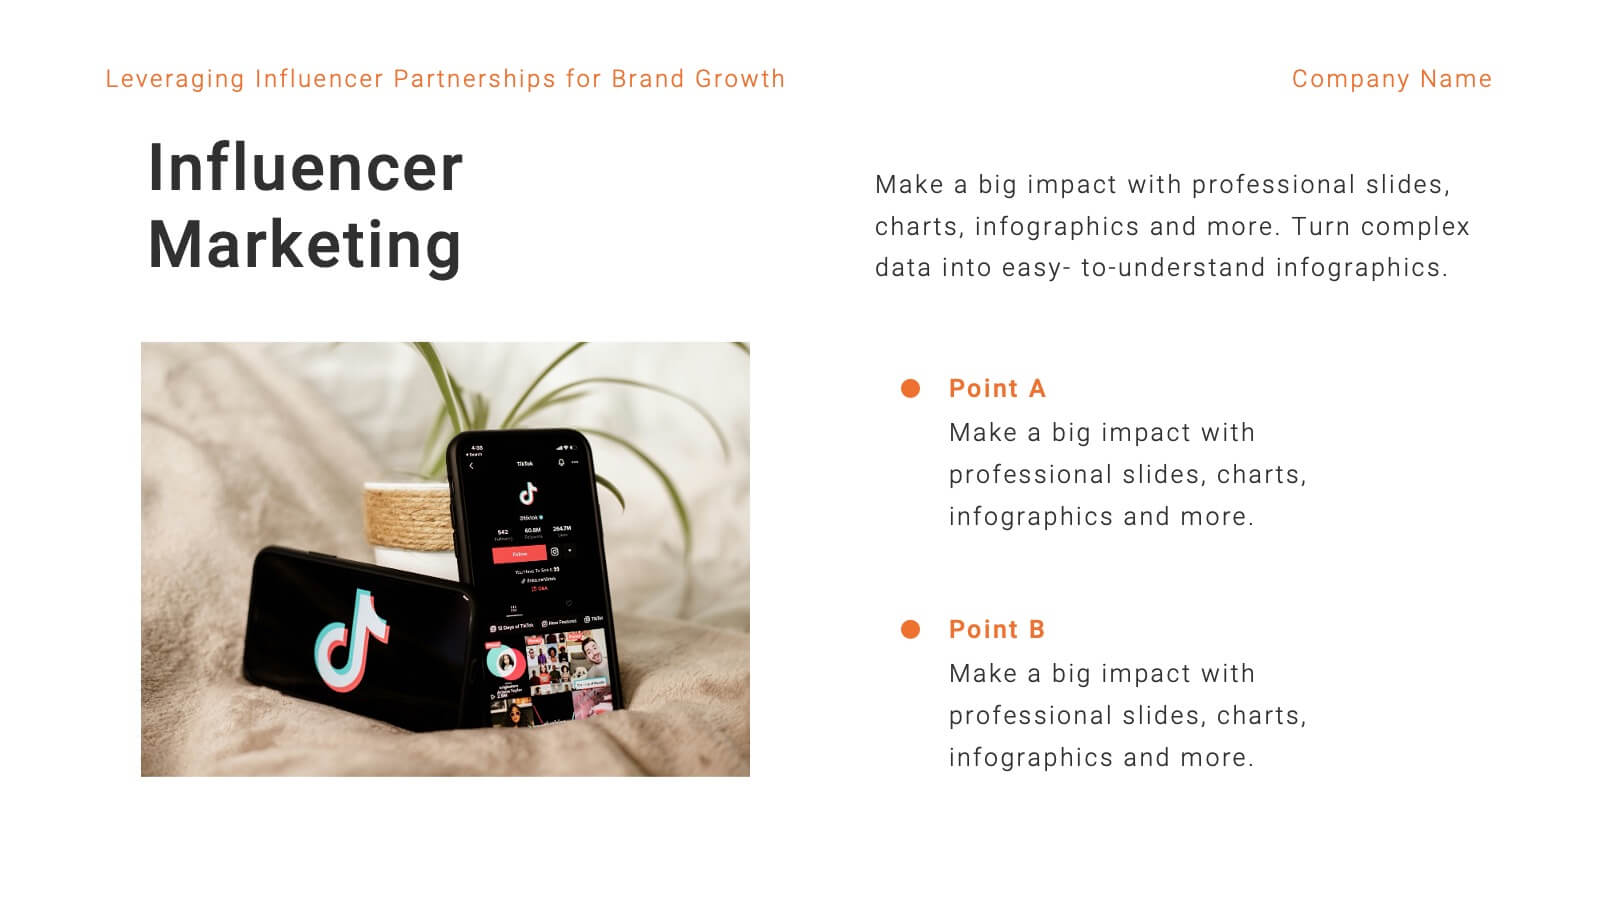
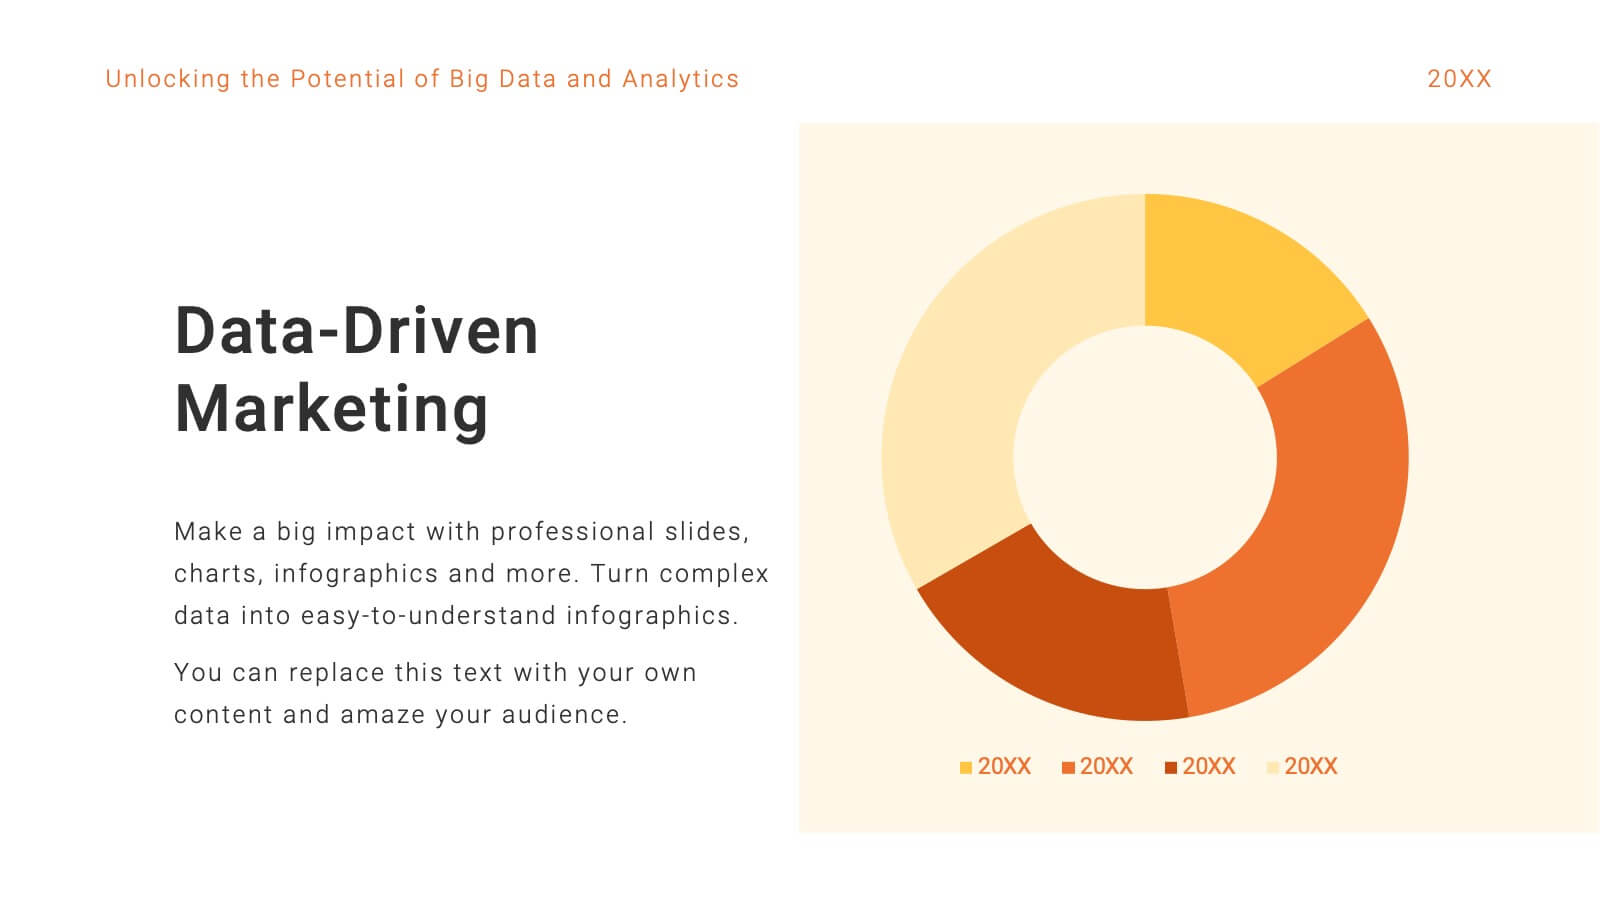
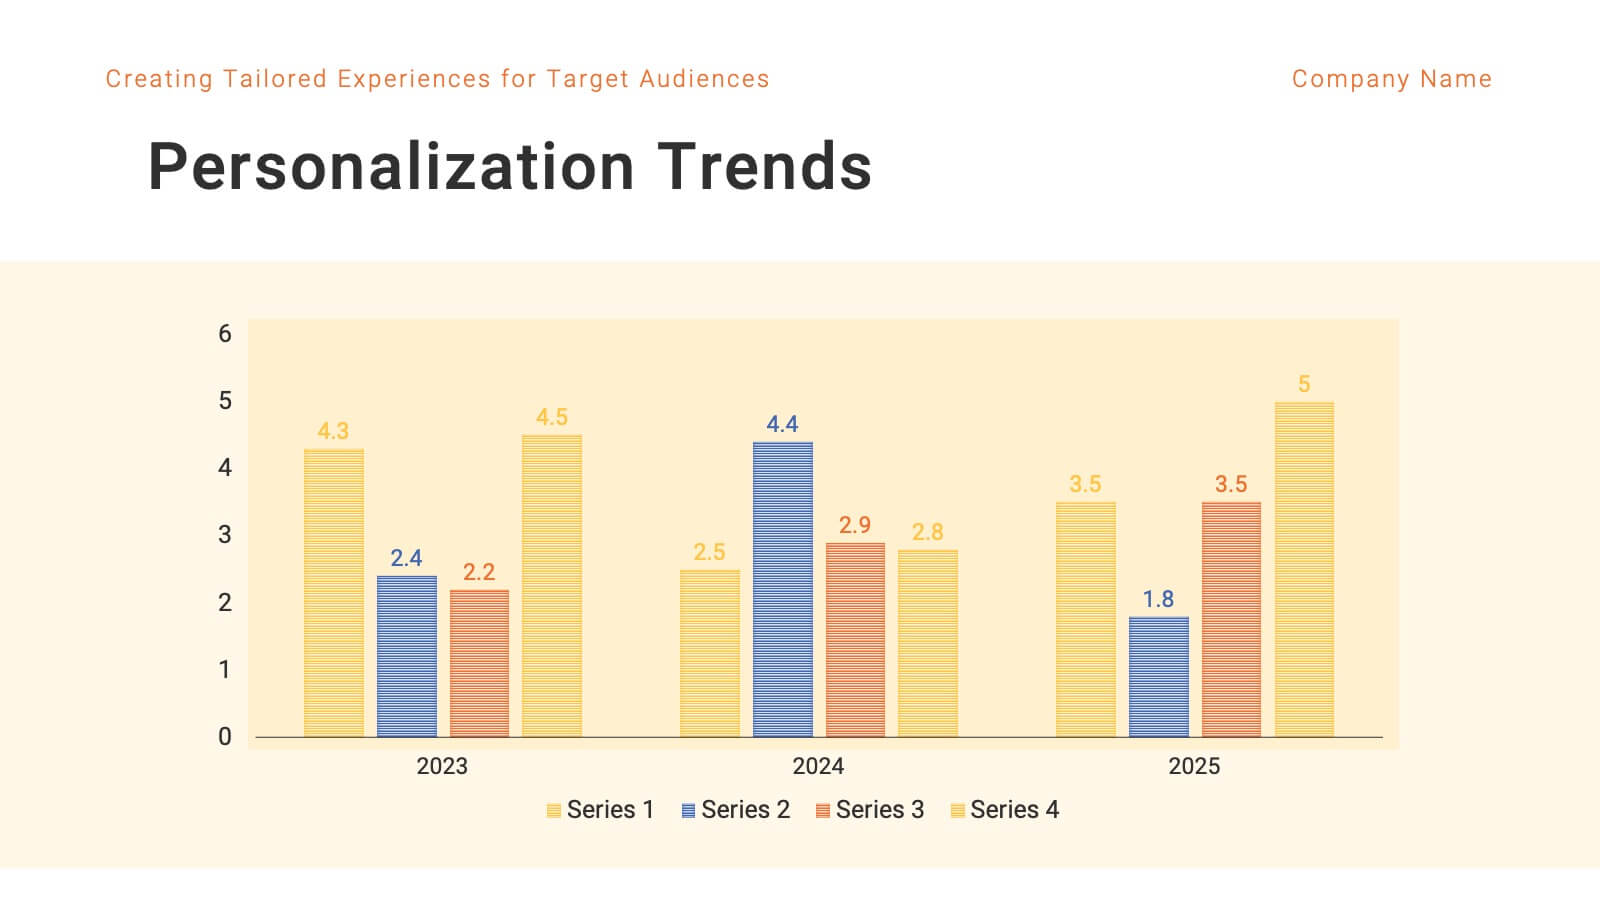
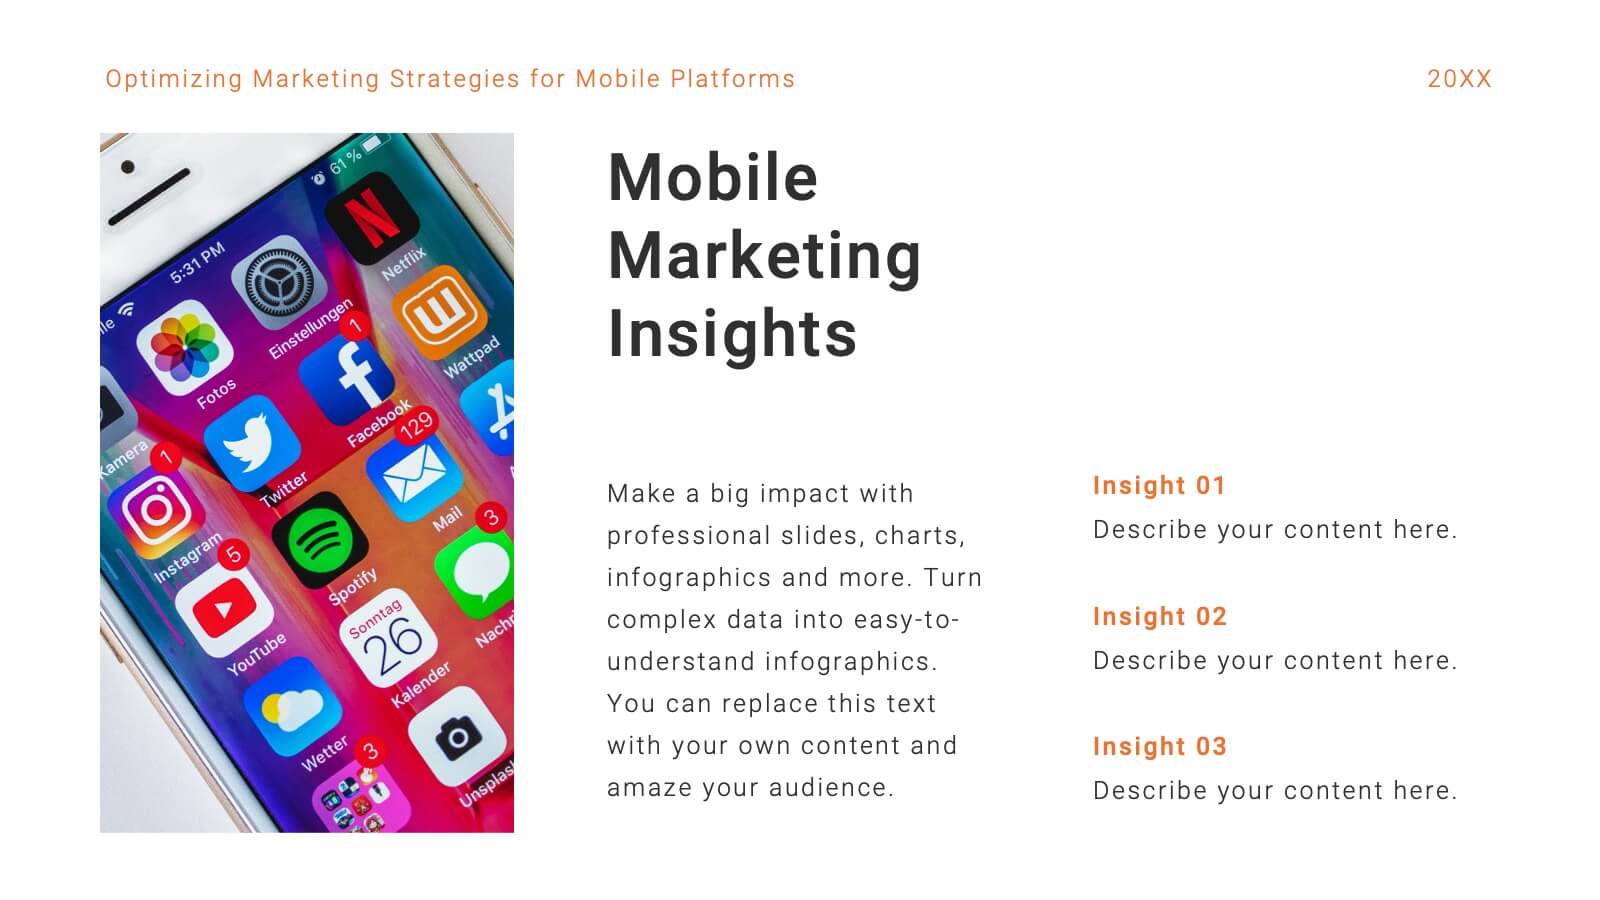
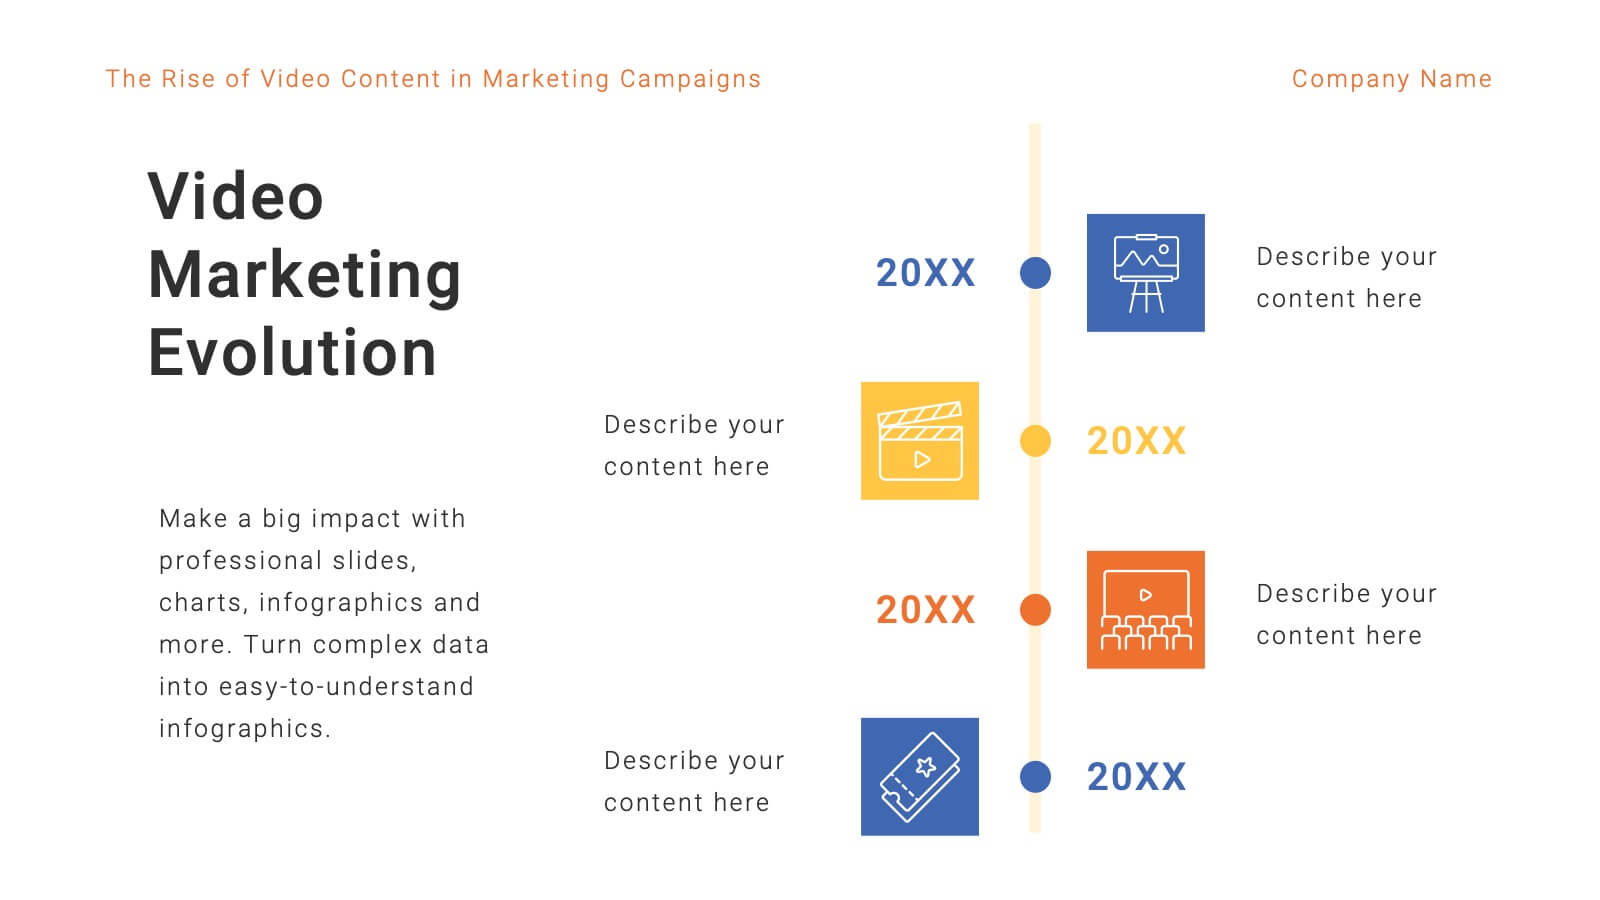
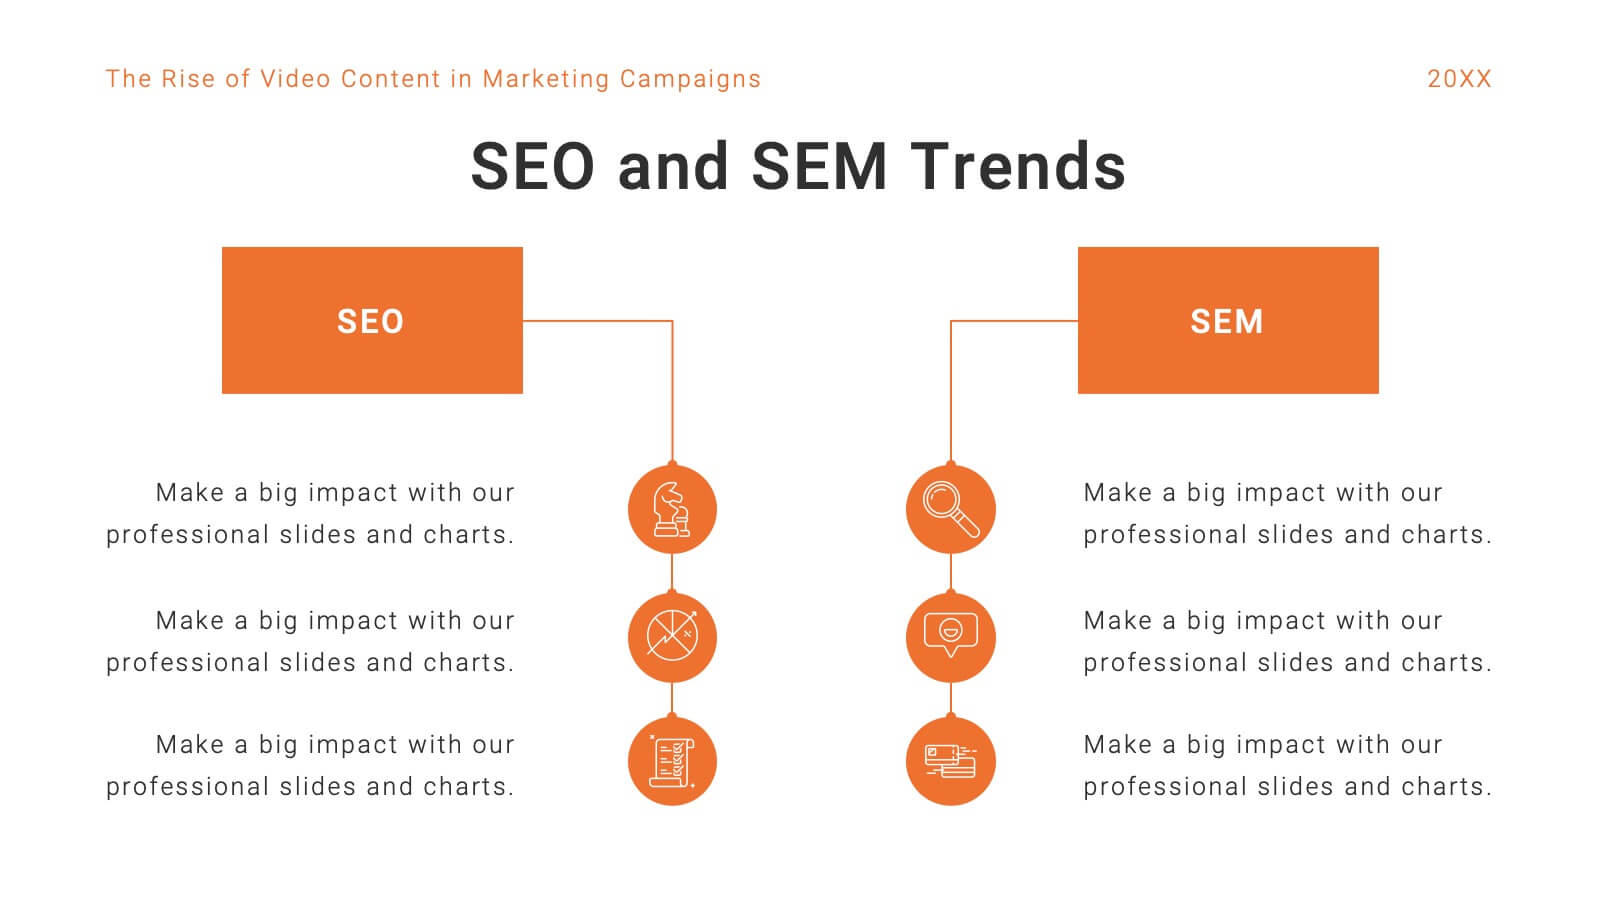
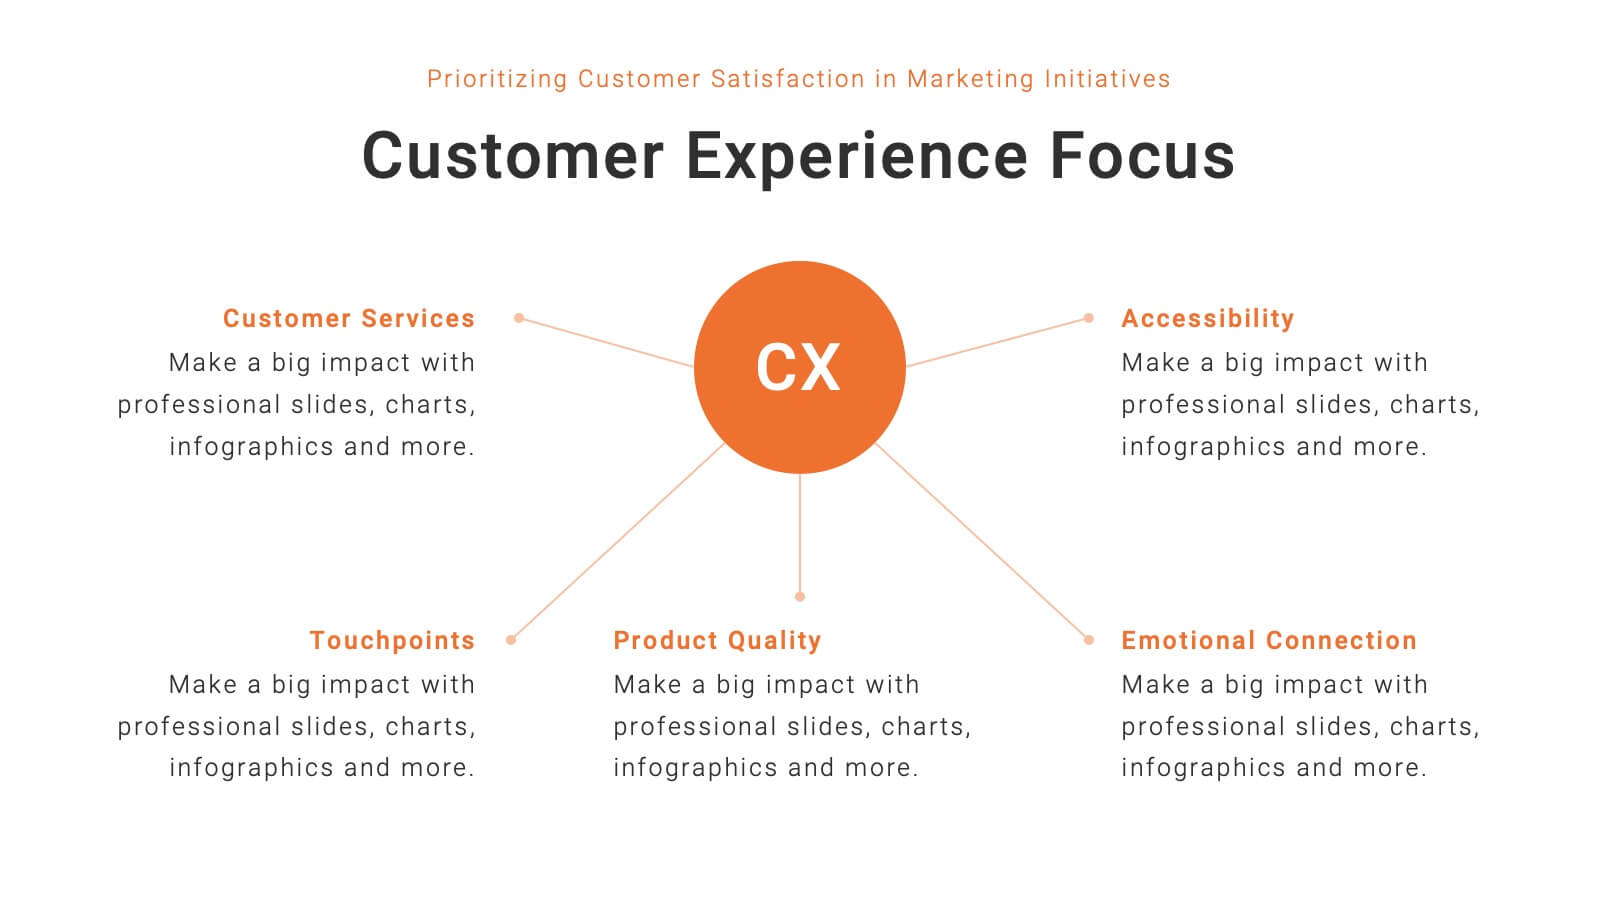
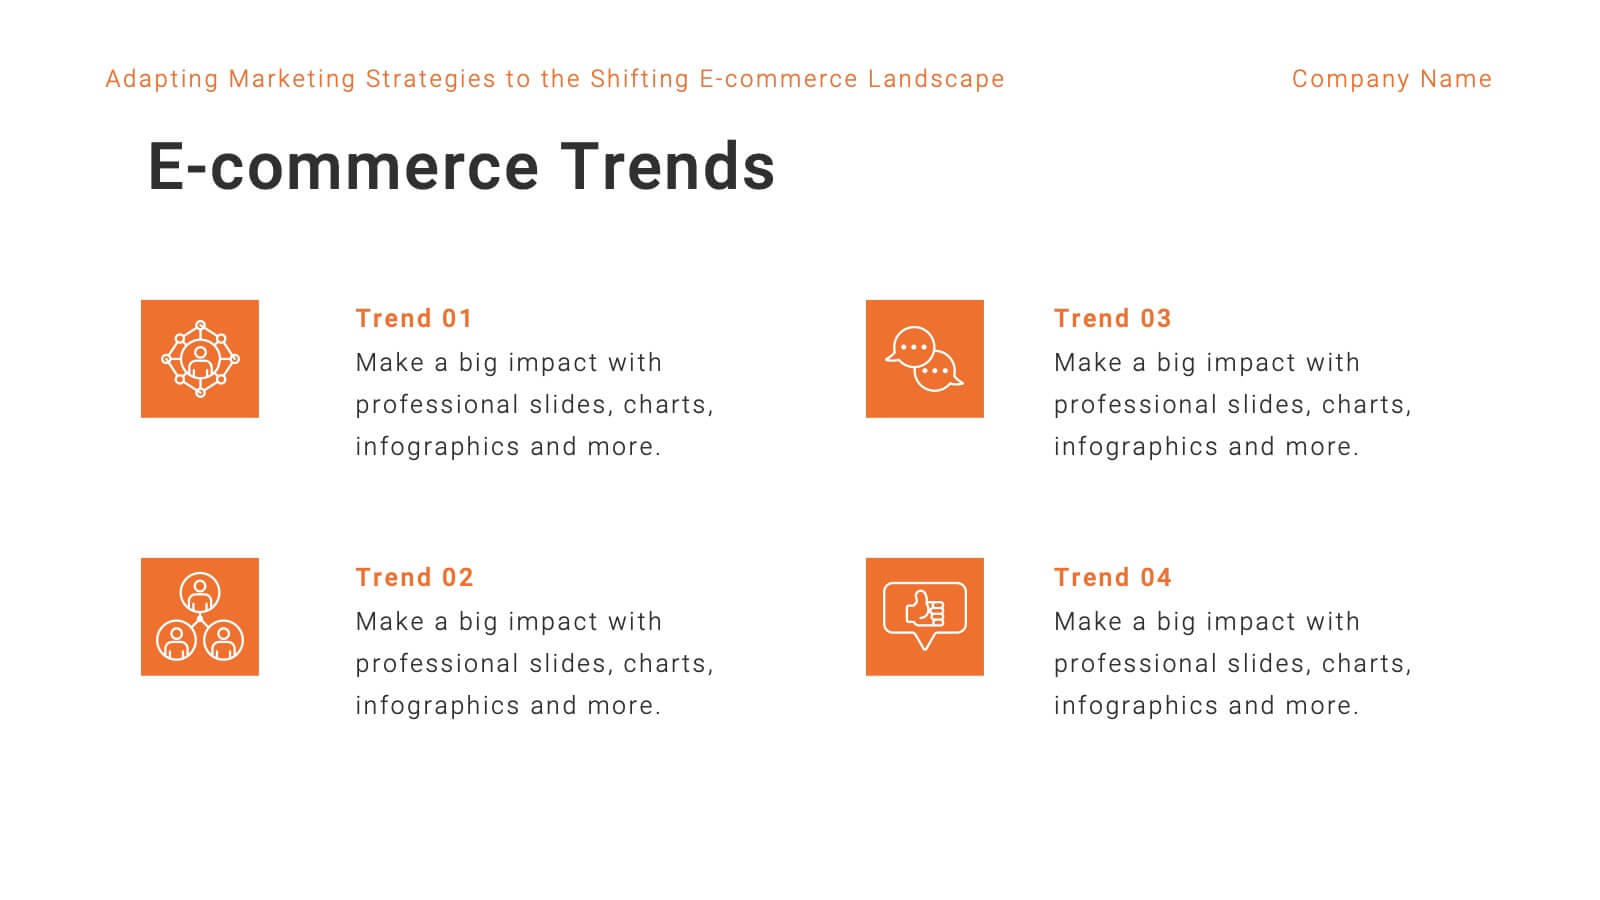
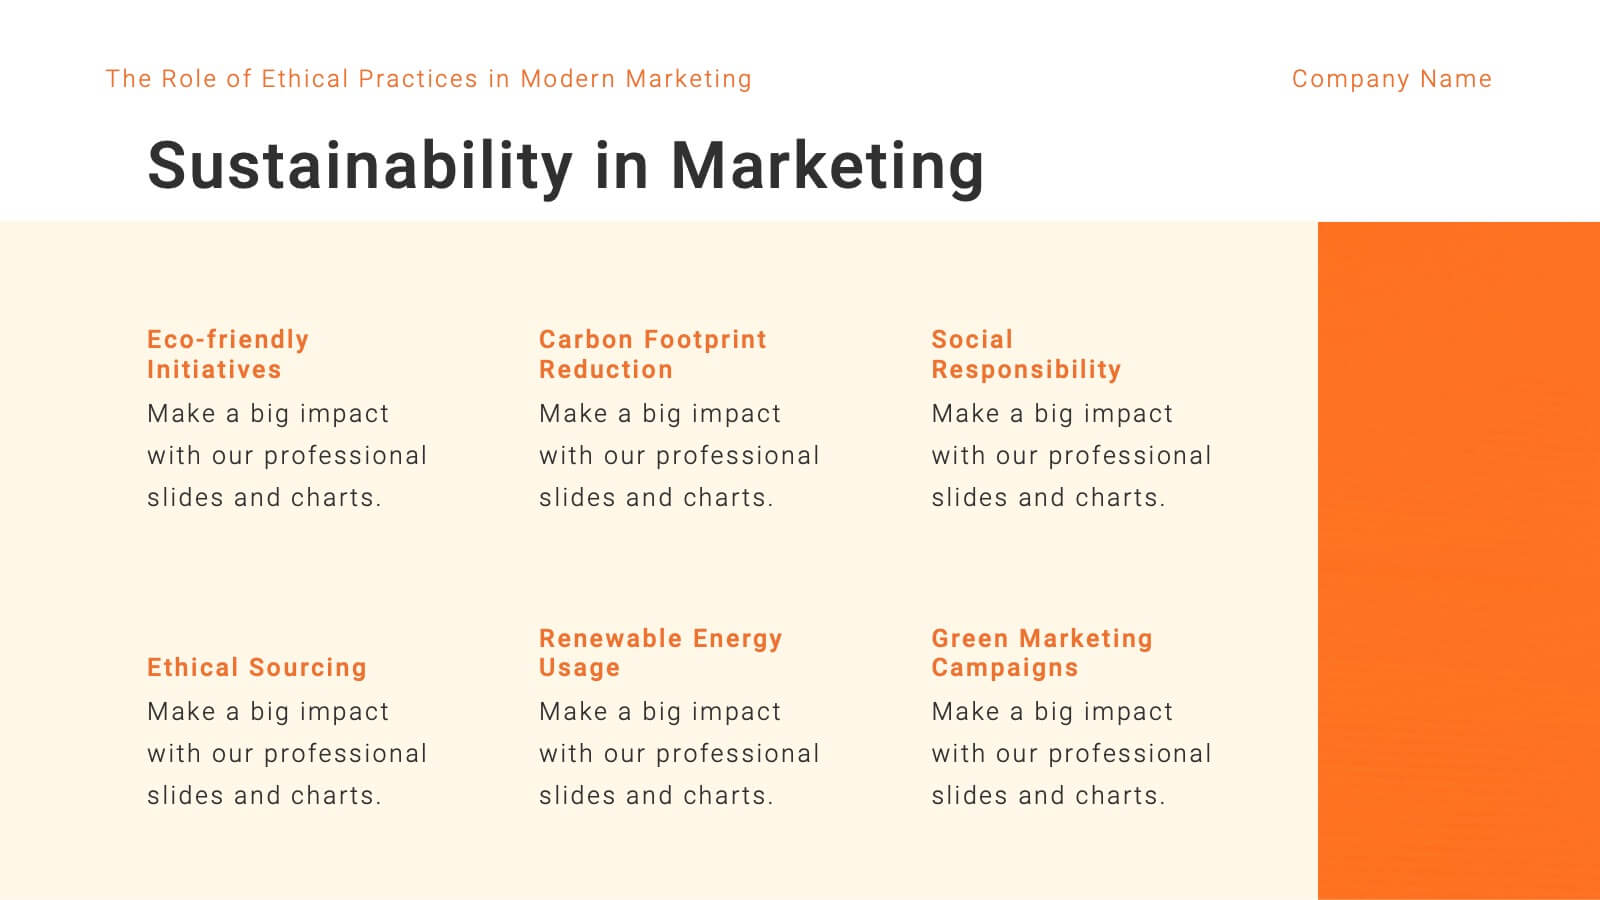
Mercury Marketing Research Report Presentation
Elevate your marketing strategy with this insightful and data-driven presentation template! Perfect for analyzing trends, consumer behavior, and emerging technologies, this template provides a thorough overview of today’s marketing landscape. From social media strategies to e-commerce trends, it covers all key areas. Fully customizable and compatible with PowerPoint, Keynote, and Google Slides for easy use.


26 slides
Treye Presentation Template
Are you looking for your next template? Treye is a fun professional presentation that includes a lot of patterns and fun shapes. This template is perfect for marketing, social media managers and content creators. It has charts, profit slides and venn diagrams, thus providing you with all the slides needed for an awesome presentation. This templates features a high-impact color scheme that will grab the attention of your audience. Its simple yet fun design makes this template stand out and at the same time keep your audience engaged. Get started creating your next report today with Treye!


23 slides
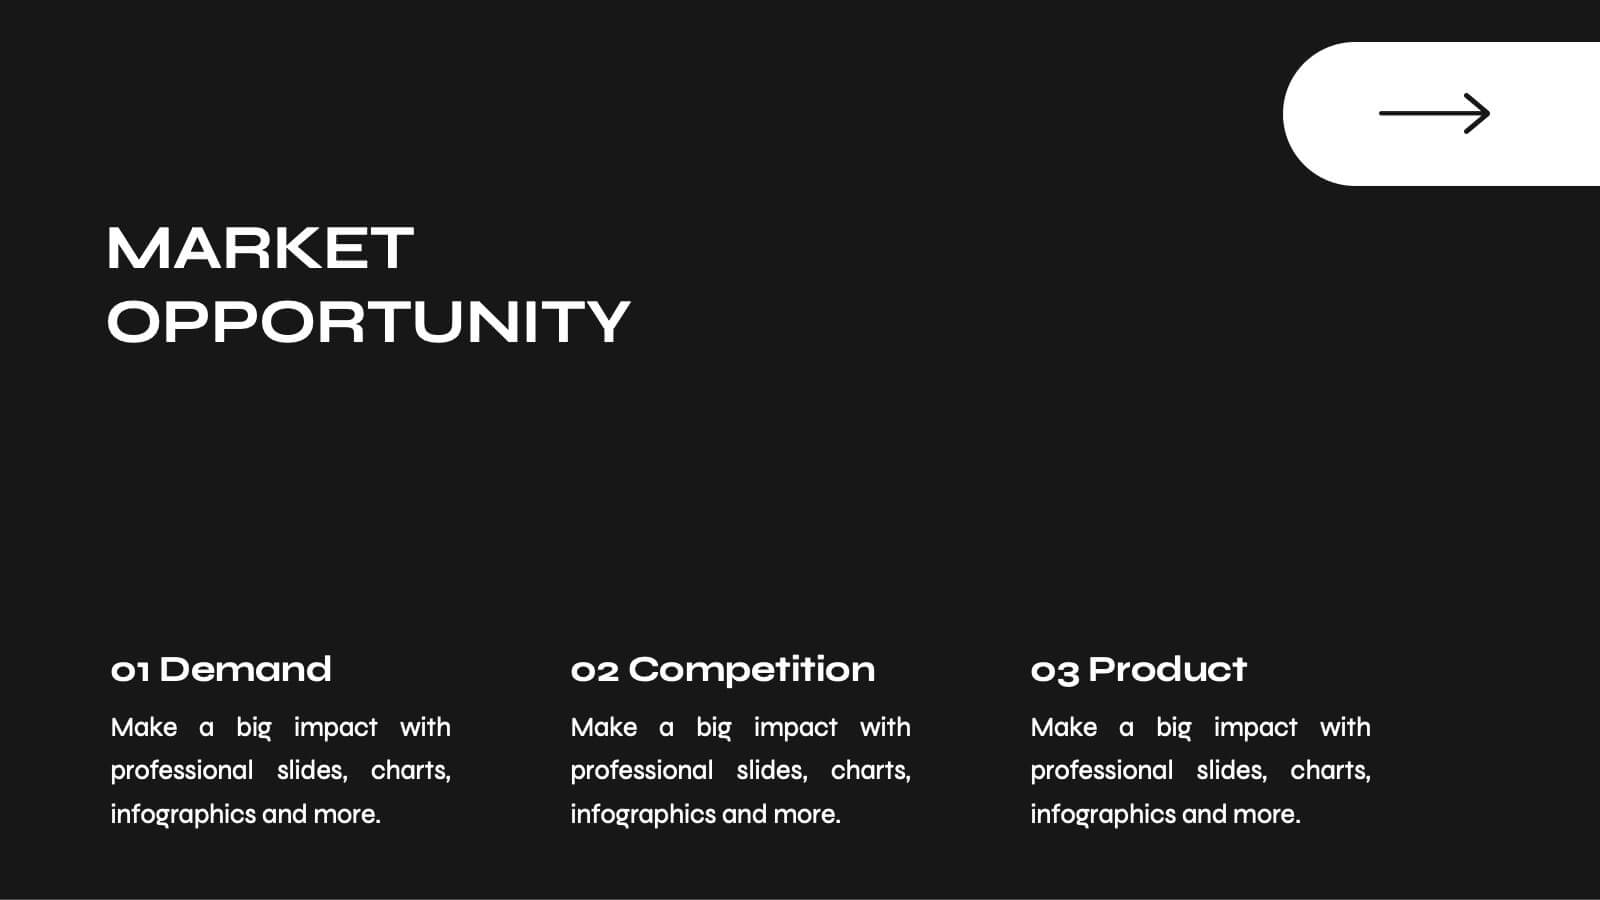
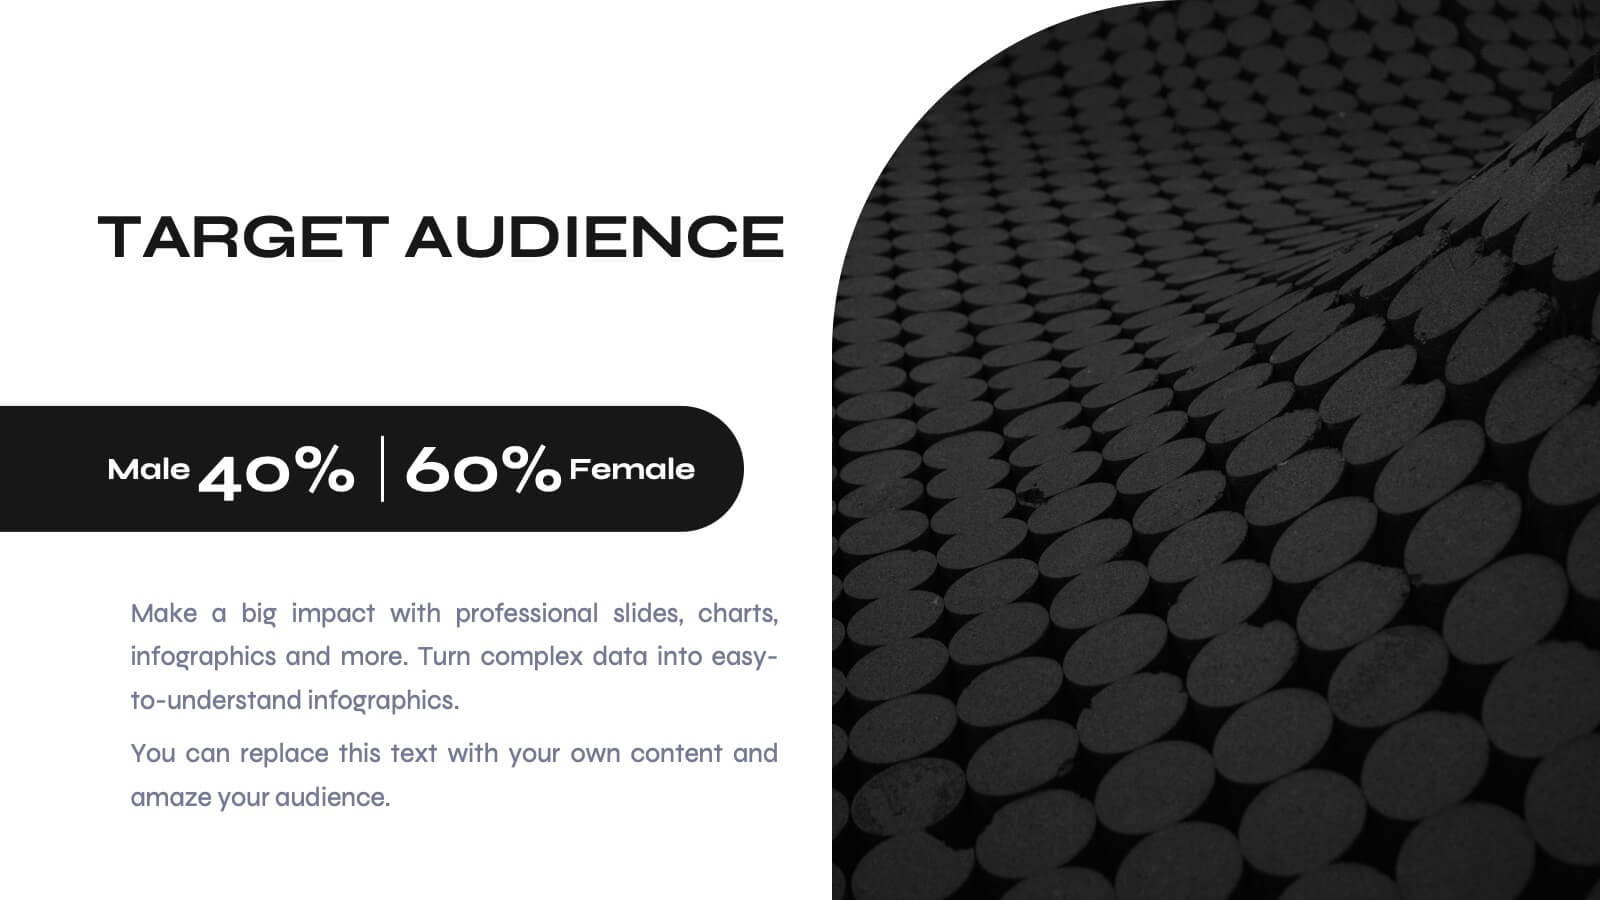
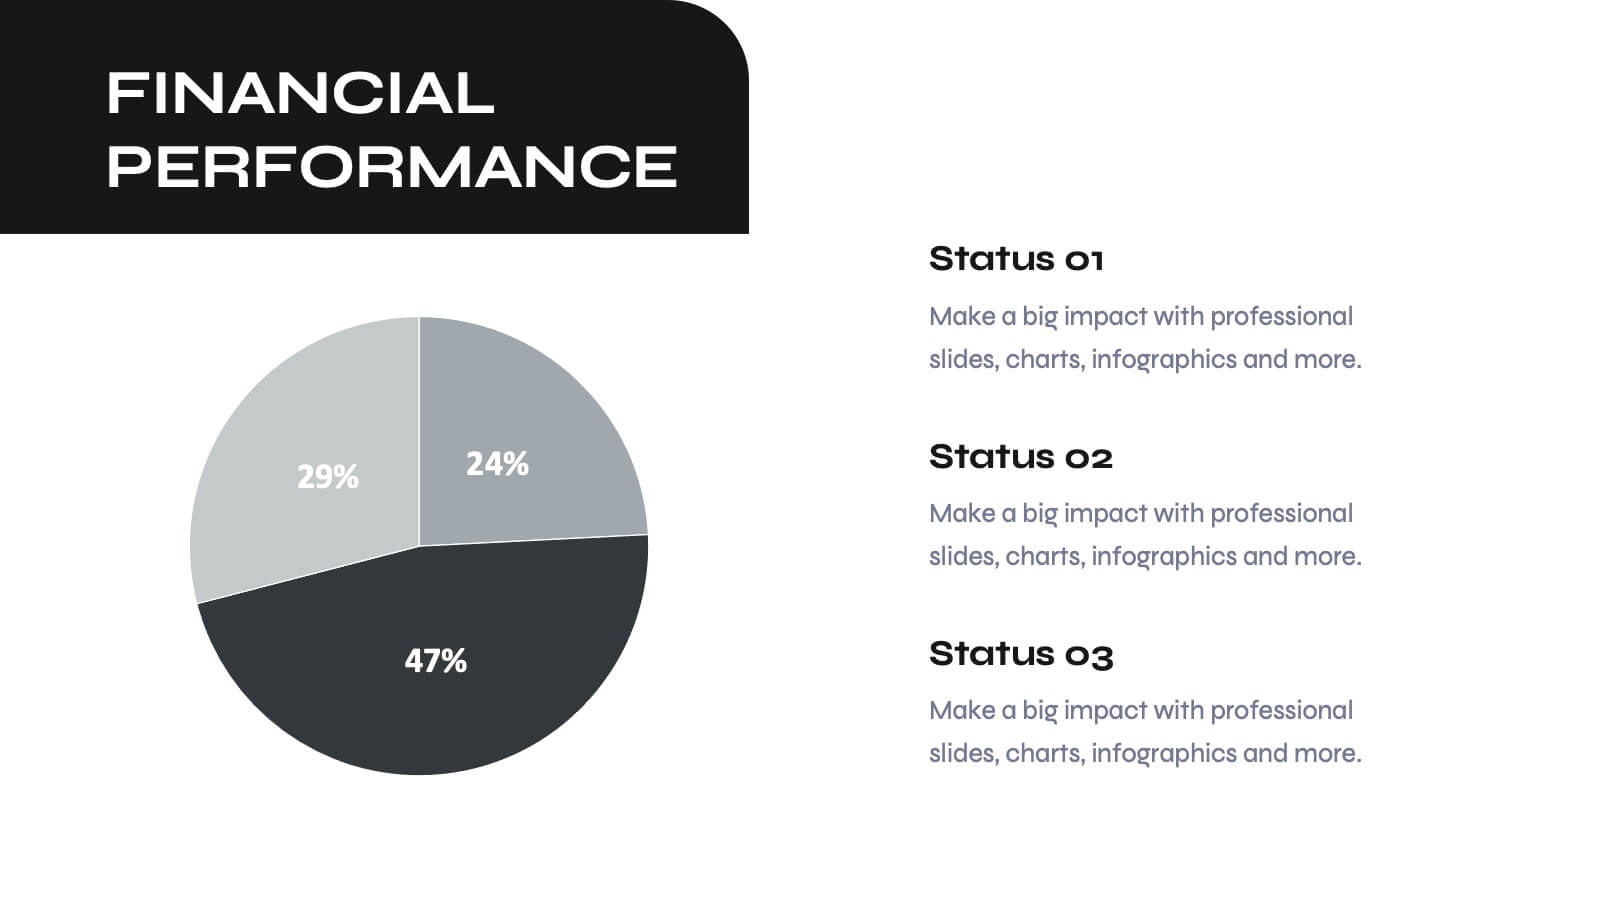
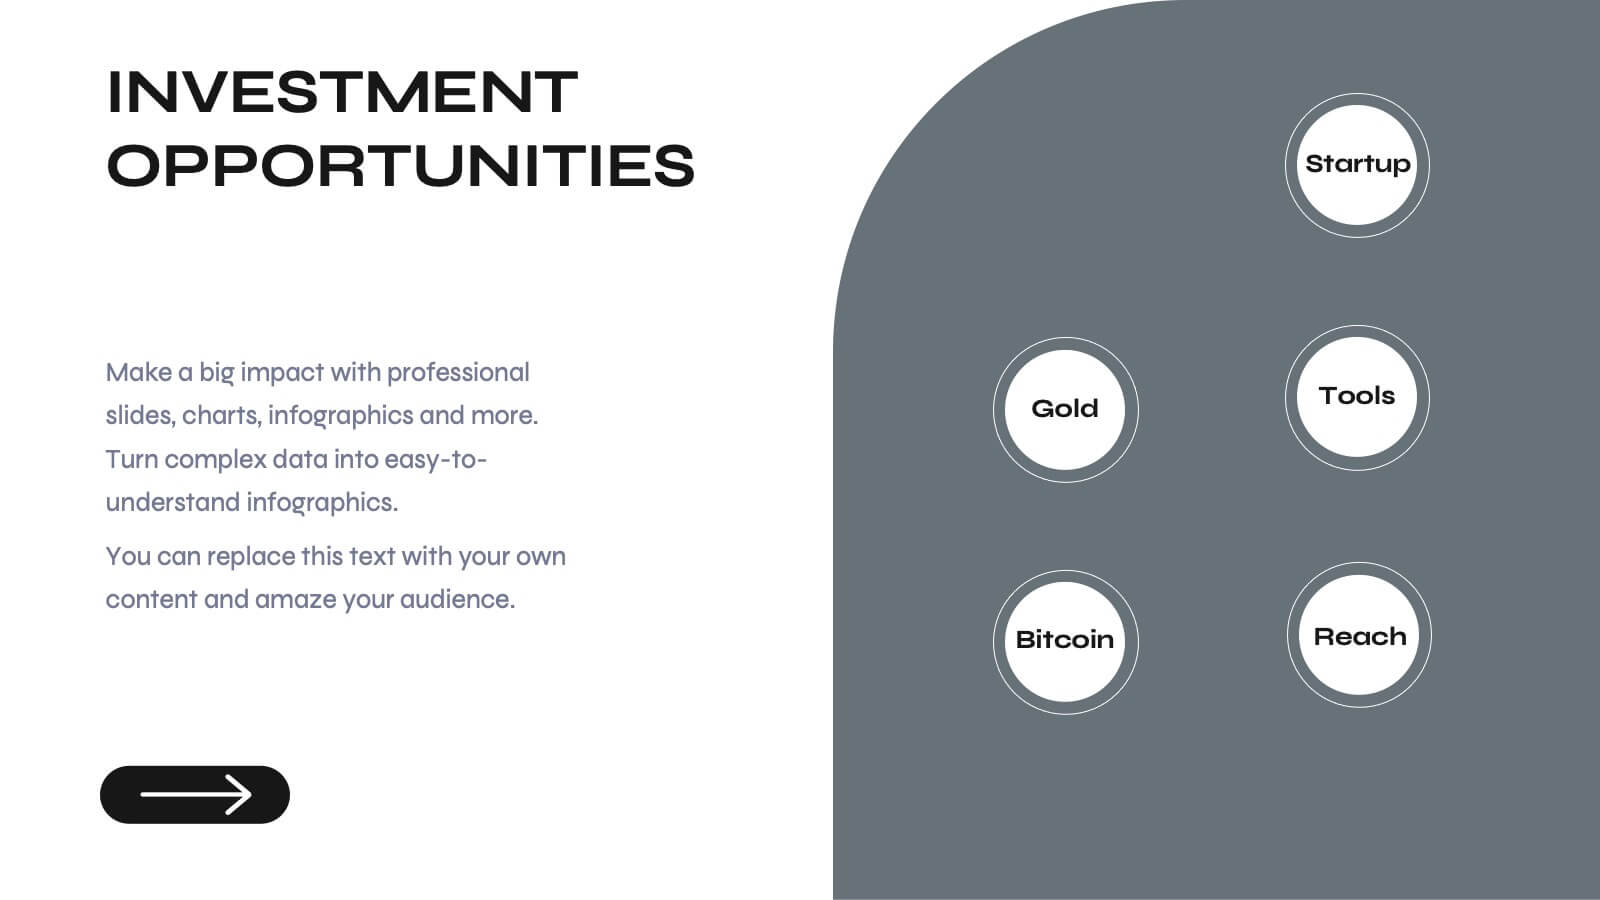
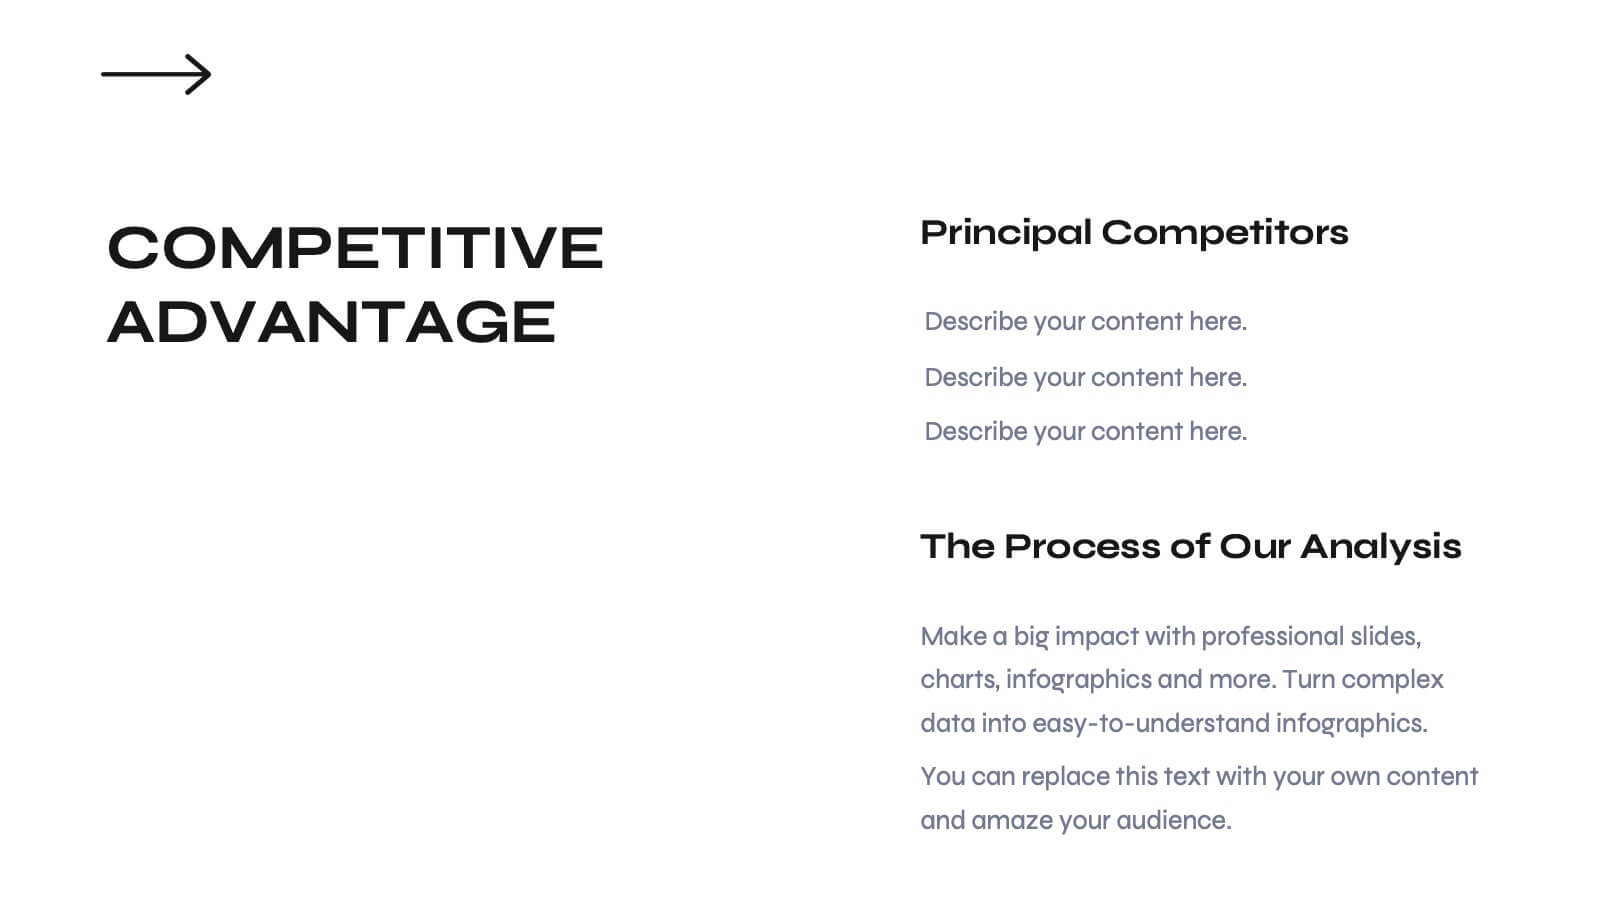
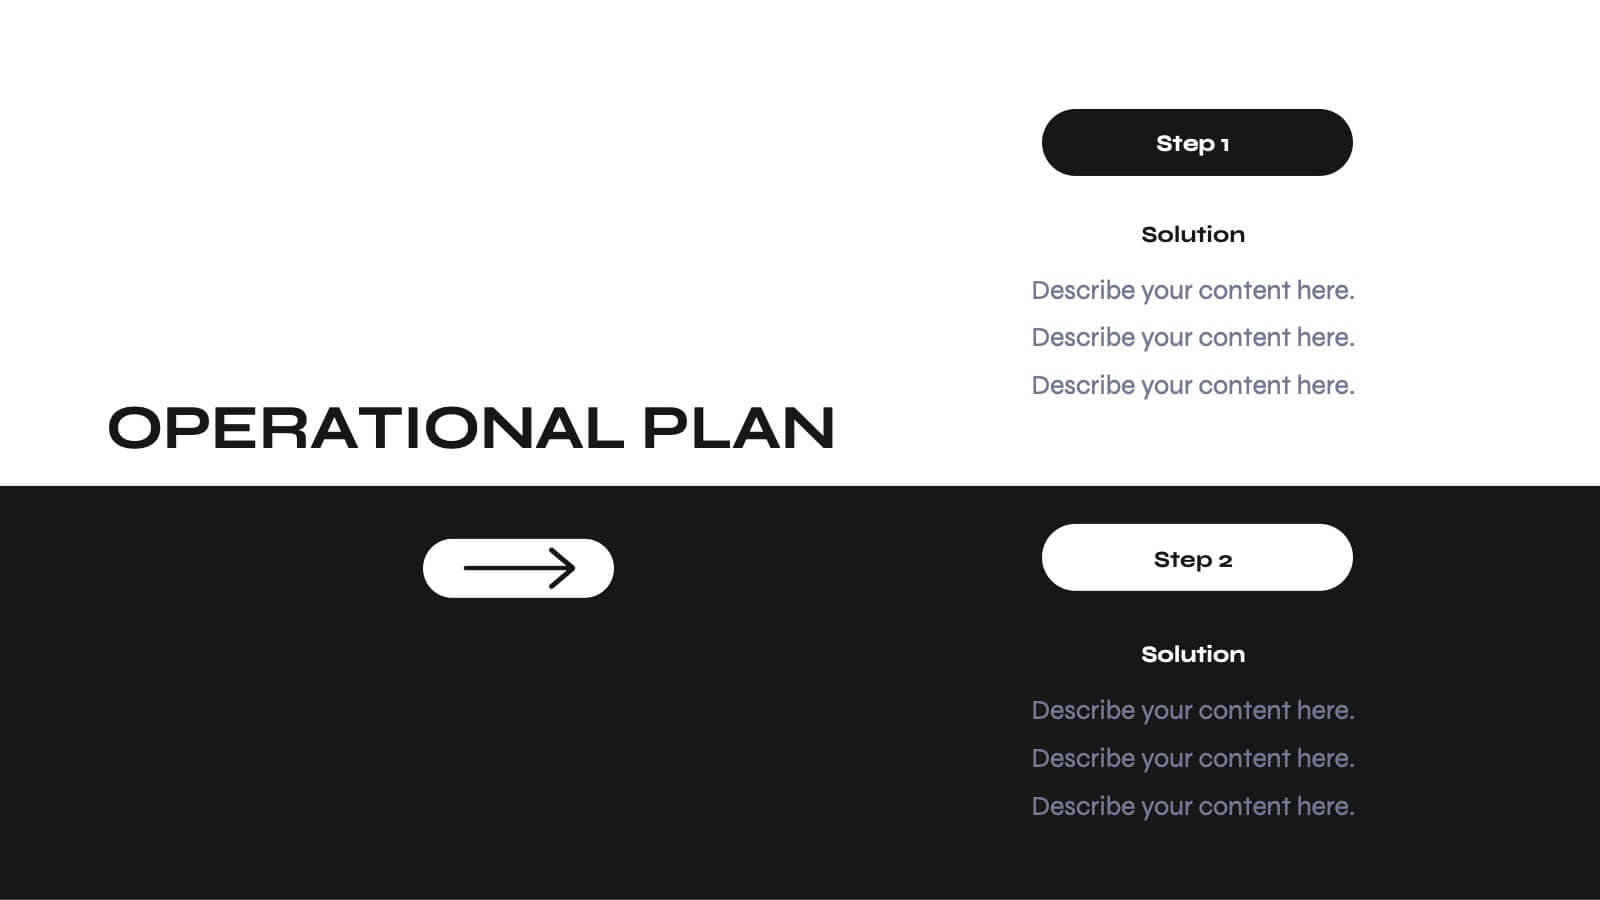
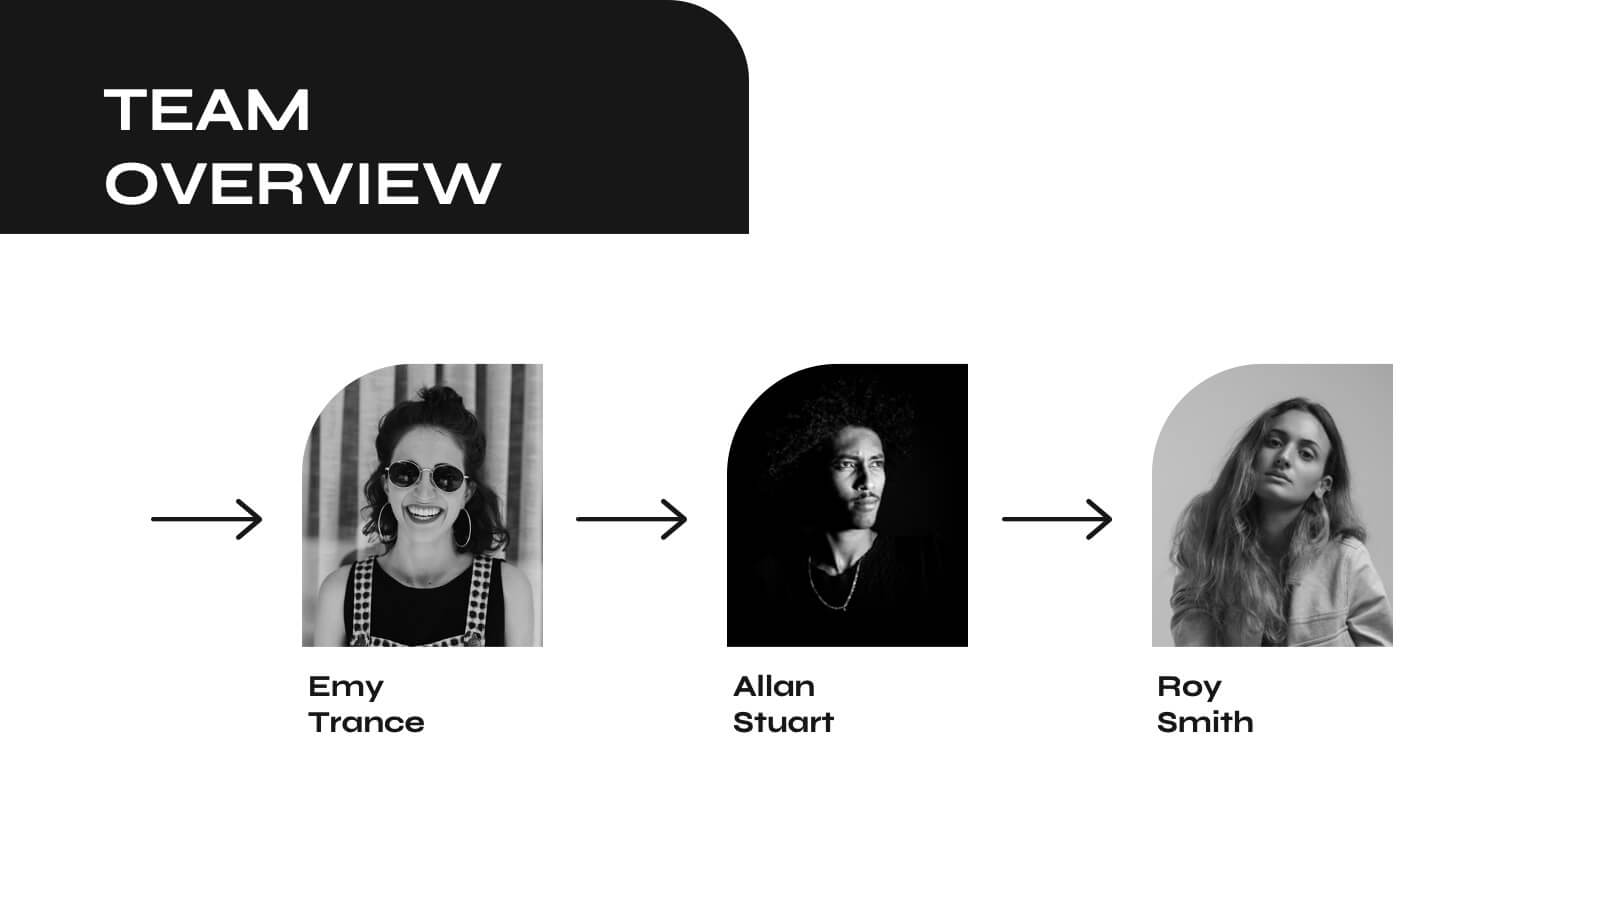
Odyssey Small Business Pitch Deck Presentation
Elevate your business pitch with this sleek, monochrome presentation template. Perfect for presenting company backgrounds, market opportunities, and financial performance, it features a minimalist design that enhances clarity and impact. Highlight your value proposition and strategic plans to captivate investors. Compatible with PowerPoint, Keynote, and Google Slides, it ensures seamless presentations on any platform.