


Features
- 6 Unique slides
- Fully editable and easy to edit in Microsoft Powerpoint, Keynote and Google Slides
- 16:9 widescreen layout
- Clean and professional designs
- Export to JPG, PDF or send by email


Do you have any questions?
Recommend


5 slides
USA Economic Map Infographic
Navigate the complexities of the American economy with our USA economic map infographic. Crafted in shades of blue and diverse colors, this creative, vertical infographic is a boon for economists, researchers, and educators. It's designed to dissect financial data across states, highlighting economic indicators vividly. From GDP growth, employment rates to industry-specific insights, make economic trends accessible. This template, beneficial for anyone addressing economic audiences, features intuitive graphics, state icons, and designated areas for relevant imagery, ensuring each economic facet is visually compelling and information-rich.


5 slides
Business Strategy Briefcase Presentation
Unlock the potential of strategic planning with our "Business Strategy Infographic" template! This design cleverly uses suitcase icons to represent different aspects of your strategy, making it perfect for executives and teams who aim to present their business insights and objectives clearly and engagingly. Each segment of the suitcase aligns key data points with your strategic goals, offering a visual roadmap to success. Compatible with PowerPoint, Keynote, and Google Slides, this template is a powerful tool for conveying complex business strategies in a straightforward, visually appealing manner.


7 slides
Executive Summary Business Infographic
Elevate your executive insights with our meticulously crafted executive summary infographic. Drenched in the professionalism of blue tones and accented by the prestige of gold, our template encapsulates key findings and top-tier decisions in a comprehensive yet concise manner. Enriched with pinpoint infographics, emblematic icons, and relevant image placeholders, it conveys essential details with precision. Perfectly honed for Powerpoint, Keynote, or Google Slides. An indispensable resource for business leaders, managers, and analysts seeking to distill complex information into actionable insights. Present with authority; let every slide underscore pivotal decisions.


6 slides
Organizational Change Management Presentation
Visualize transformation with clarity using this structured slide, perfect for outlining your change roadmap, initiatives, or strategic phases. The layout features six labeled steps with icons and editable text for seamless communication of your process—from awareness to adoption. Ideal for HR leaders, consultants, and operations managers. Fully editable in PowerPoint, Keynote, and Google Slides.


5 slides
Big Data Interpretation and Metrics Presentation
Break down complex data into digestible segments with the Big Data Interpretation and Metrics Presentation. Featuring a puzzle-inspired layout, this template is ideal for illustrating interconnected data points, analytics strategies, or metric-based frameworks. Fully customizable in PowerPoint, Keynote, and Google Slides.


7 slides
Strategic Business Execution Playbook Presentation
Streamline your execution roadmap with this Strategic Business Execution Playbook. Featuring a sleek, step-by-step layout, it’s ideal for showcasing business stages, workflows, or strategic planning phases. Easy to customize in PowerPoint, Keynote, and Google Slides, this template helps teams visualize priorities and align goals with precision and clarity.


21 slides
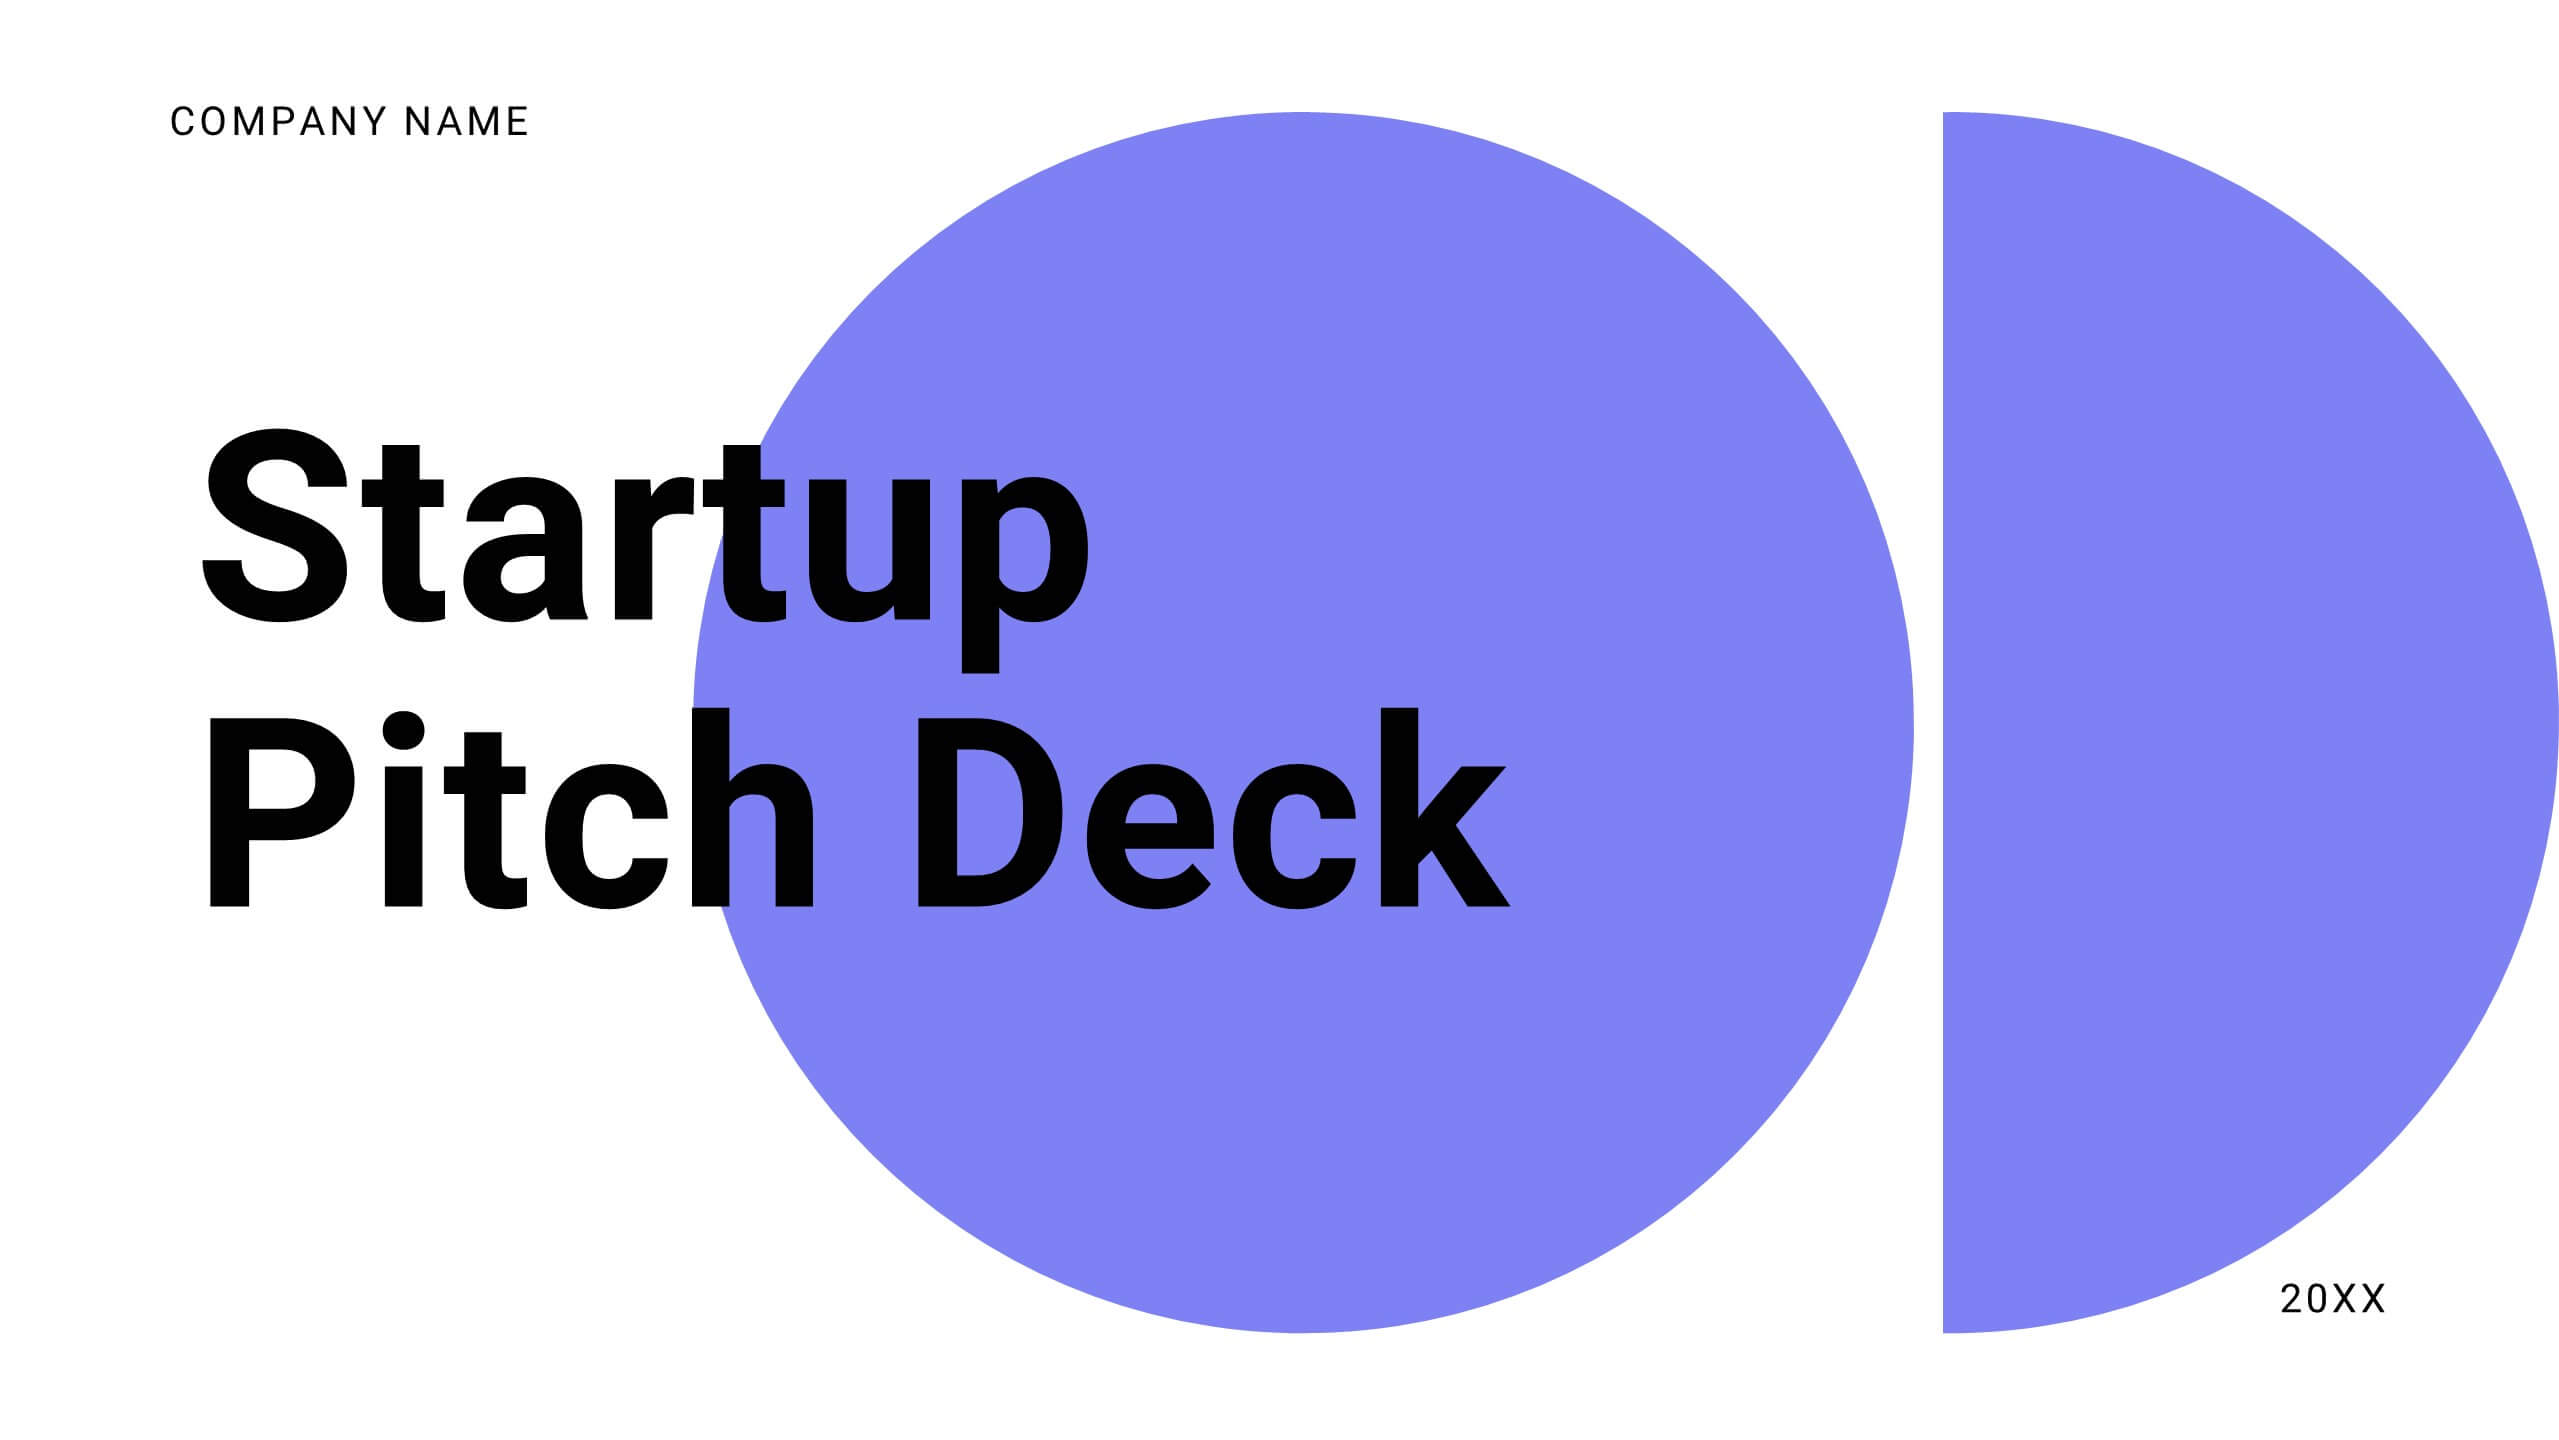
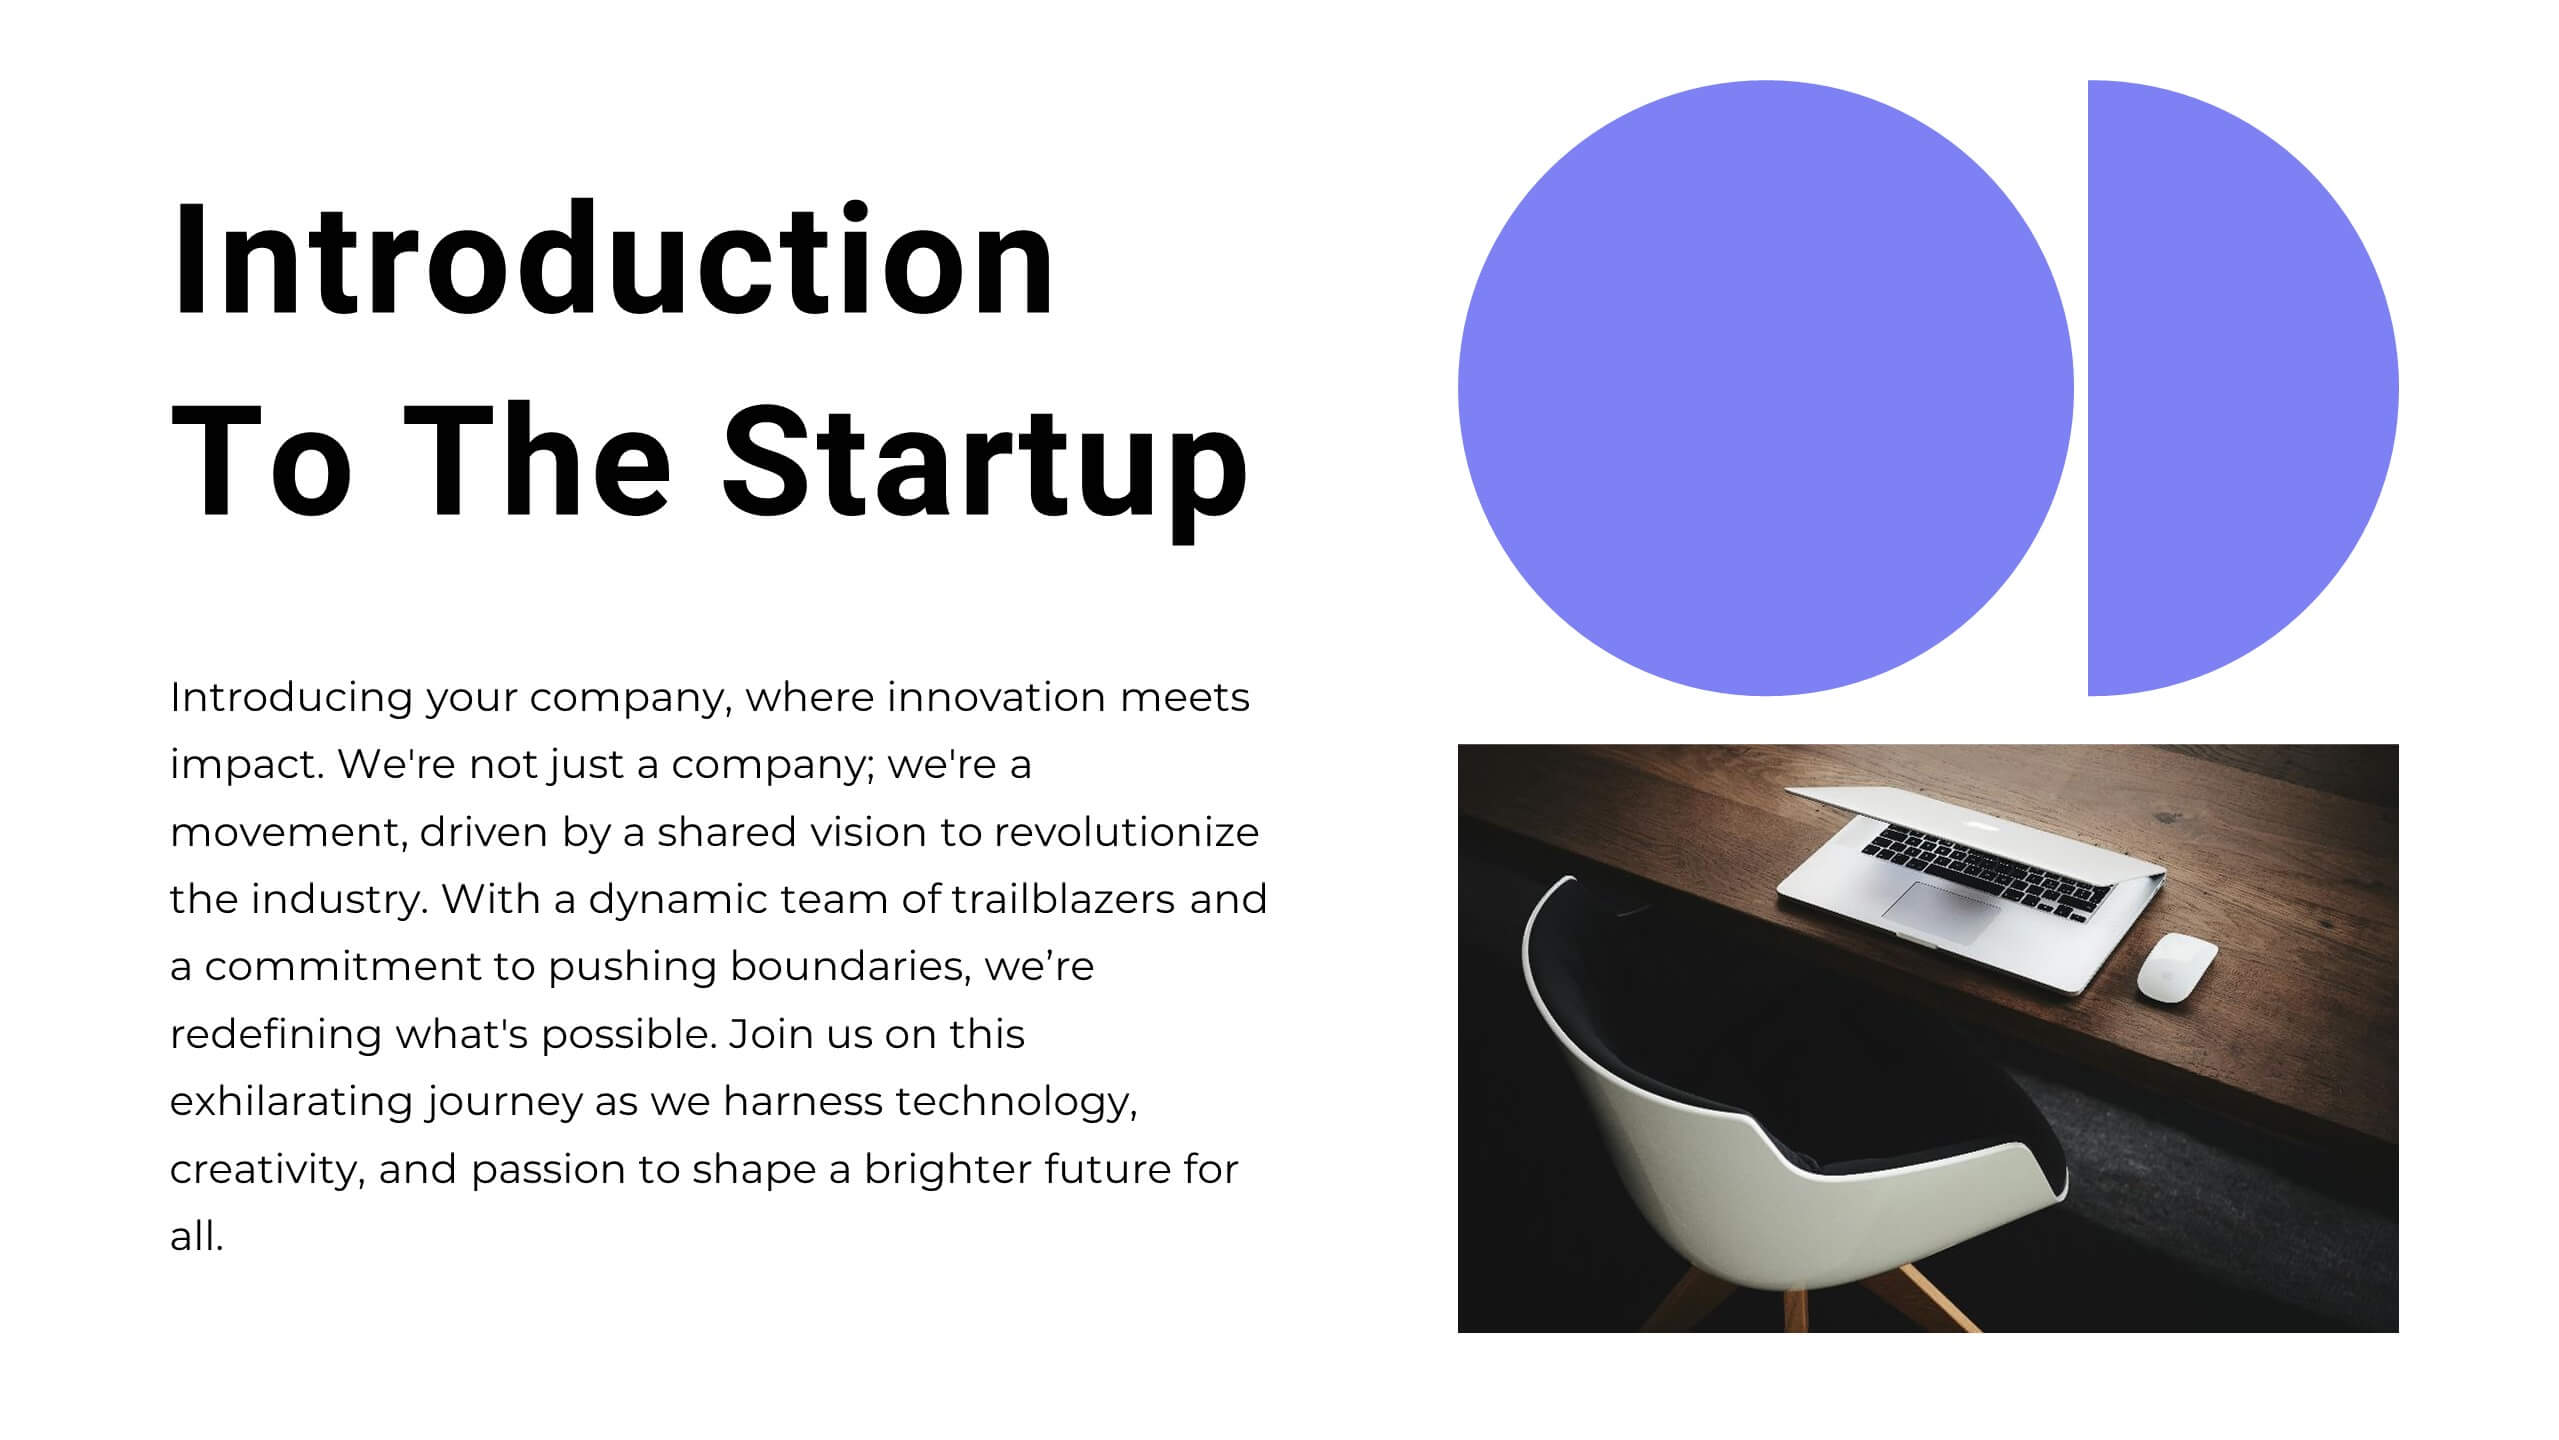
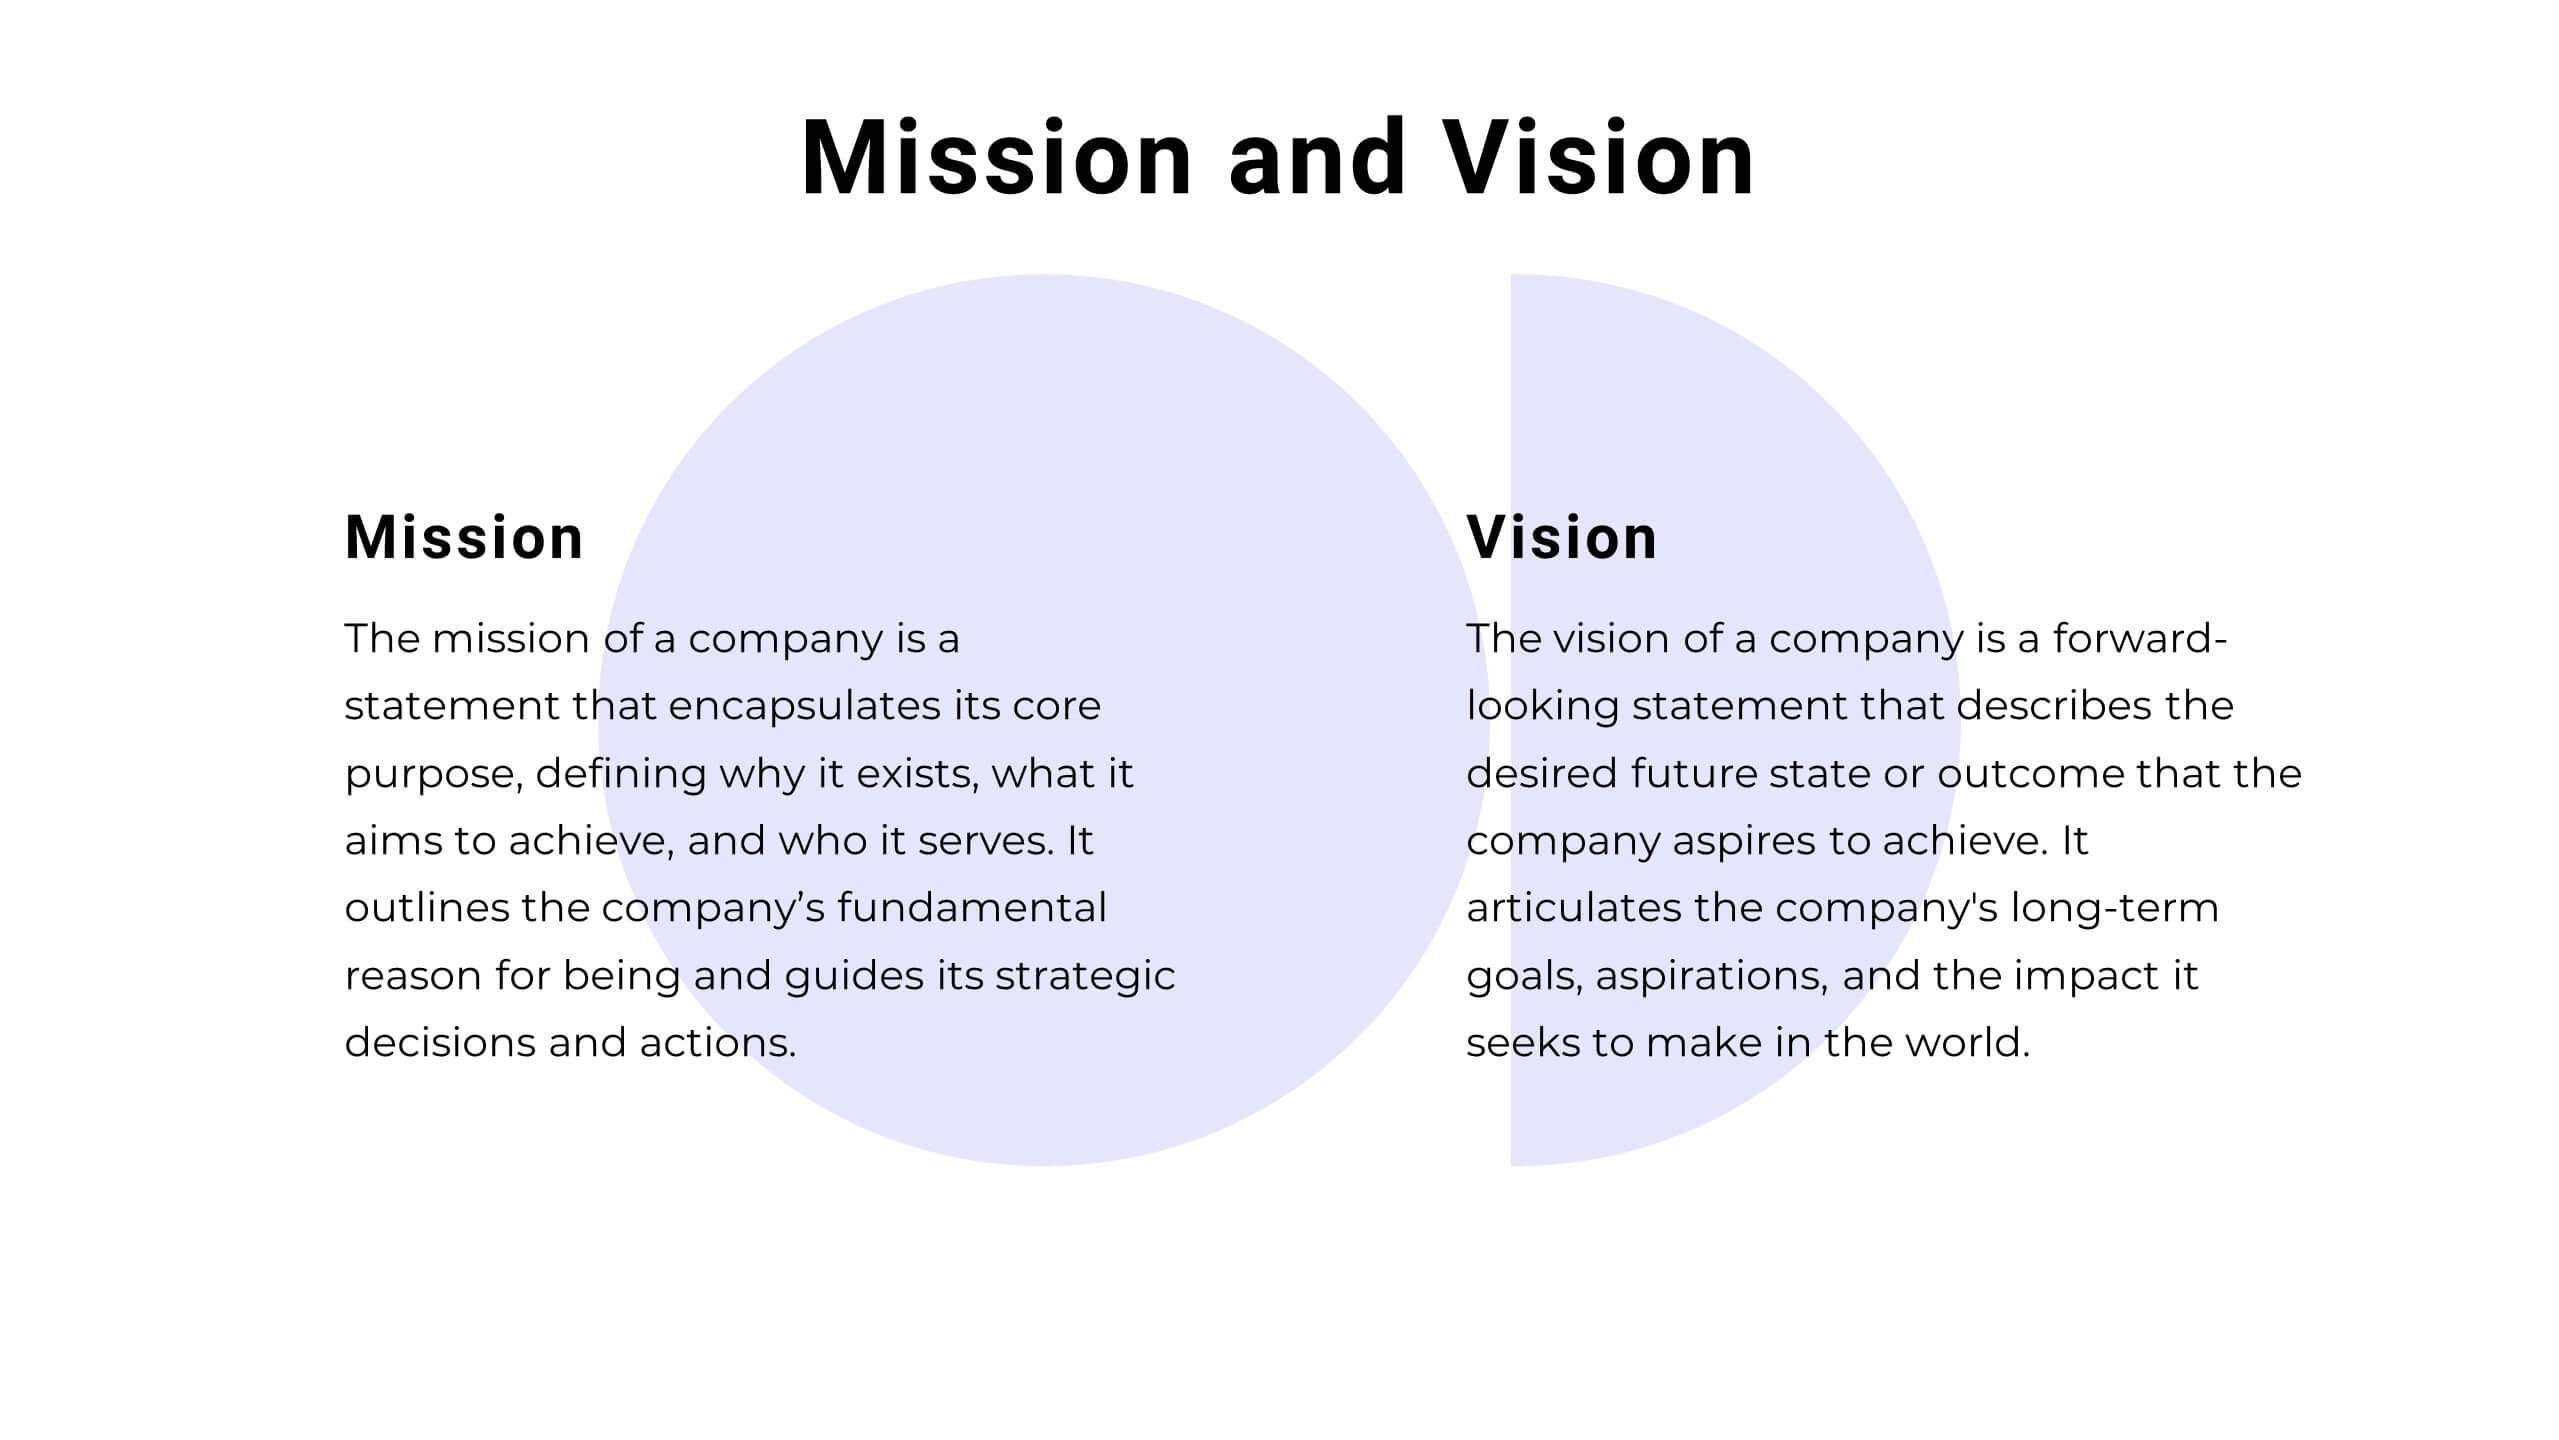
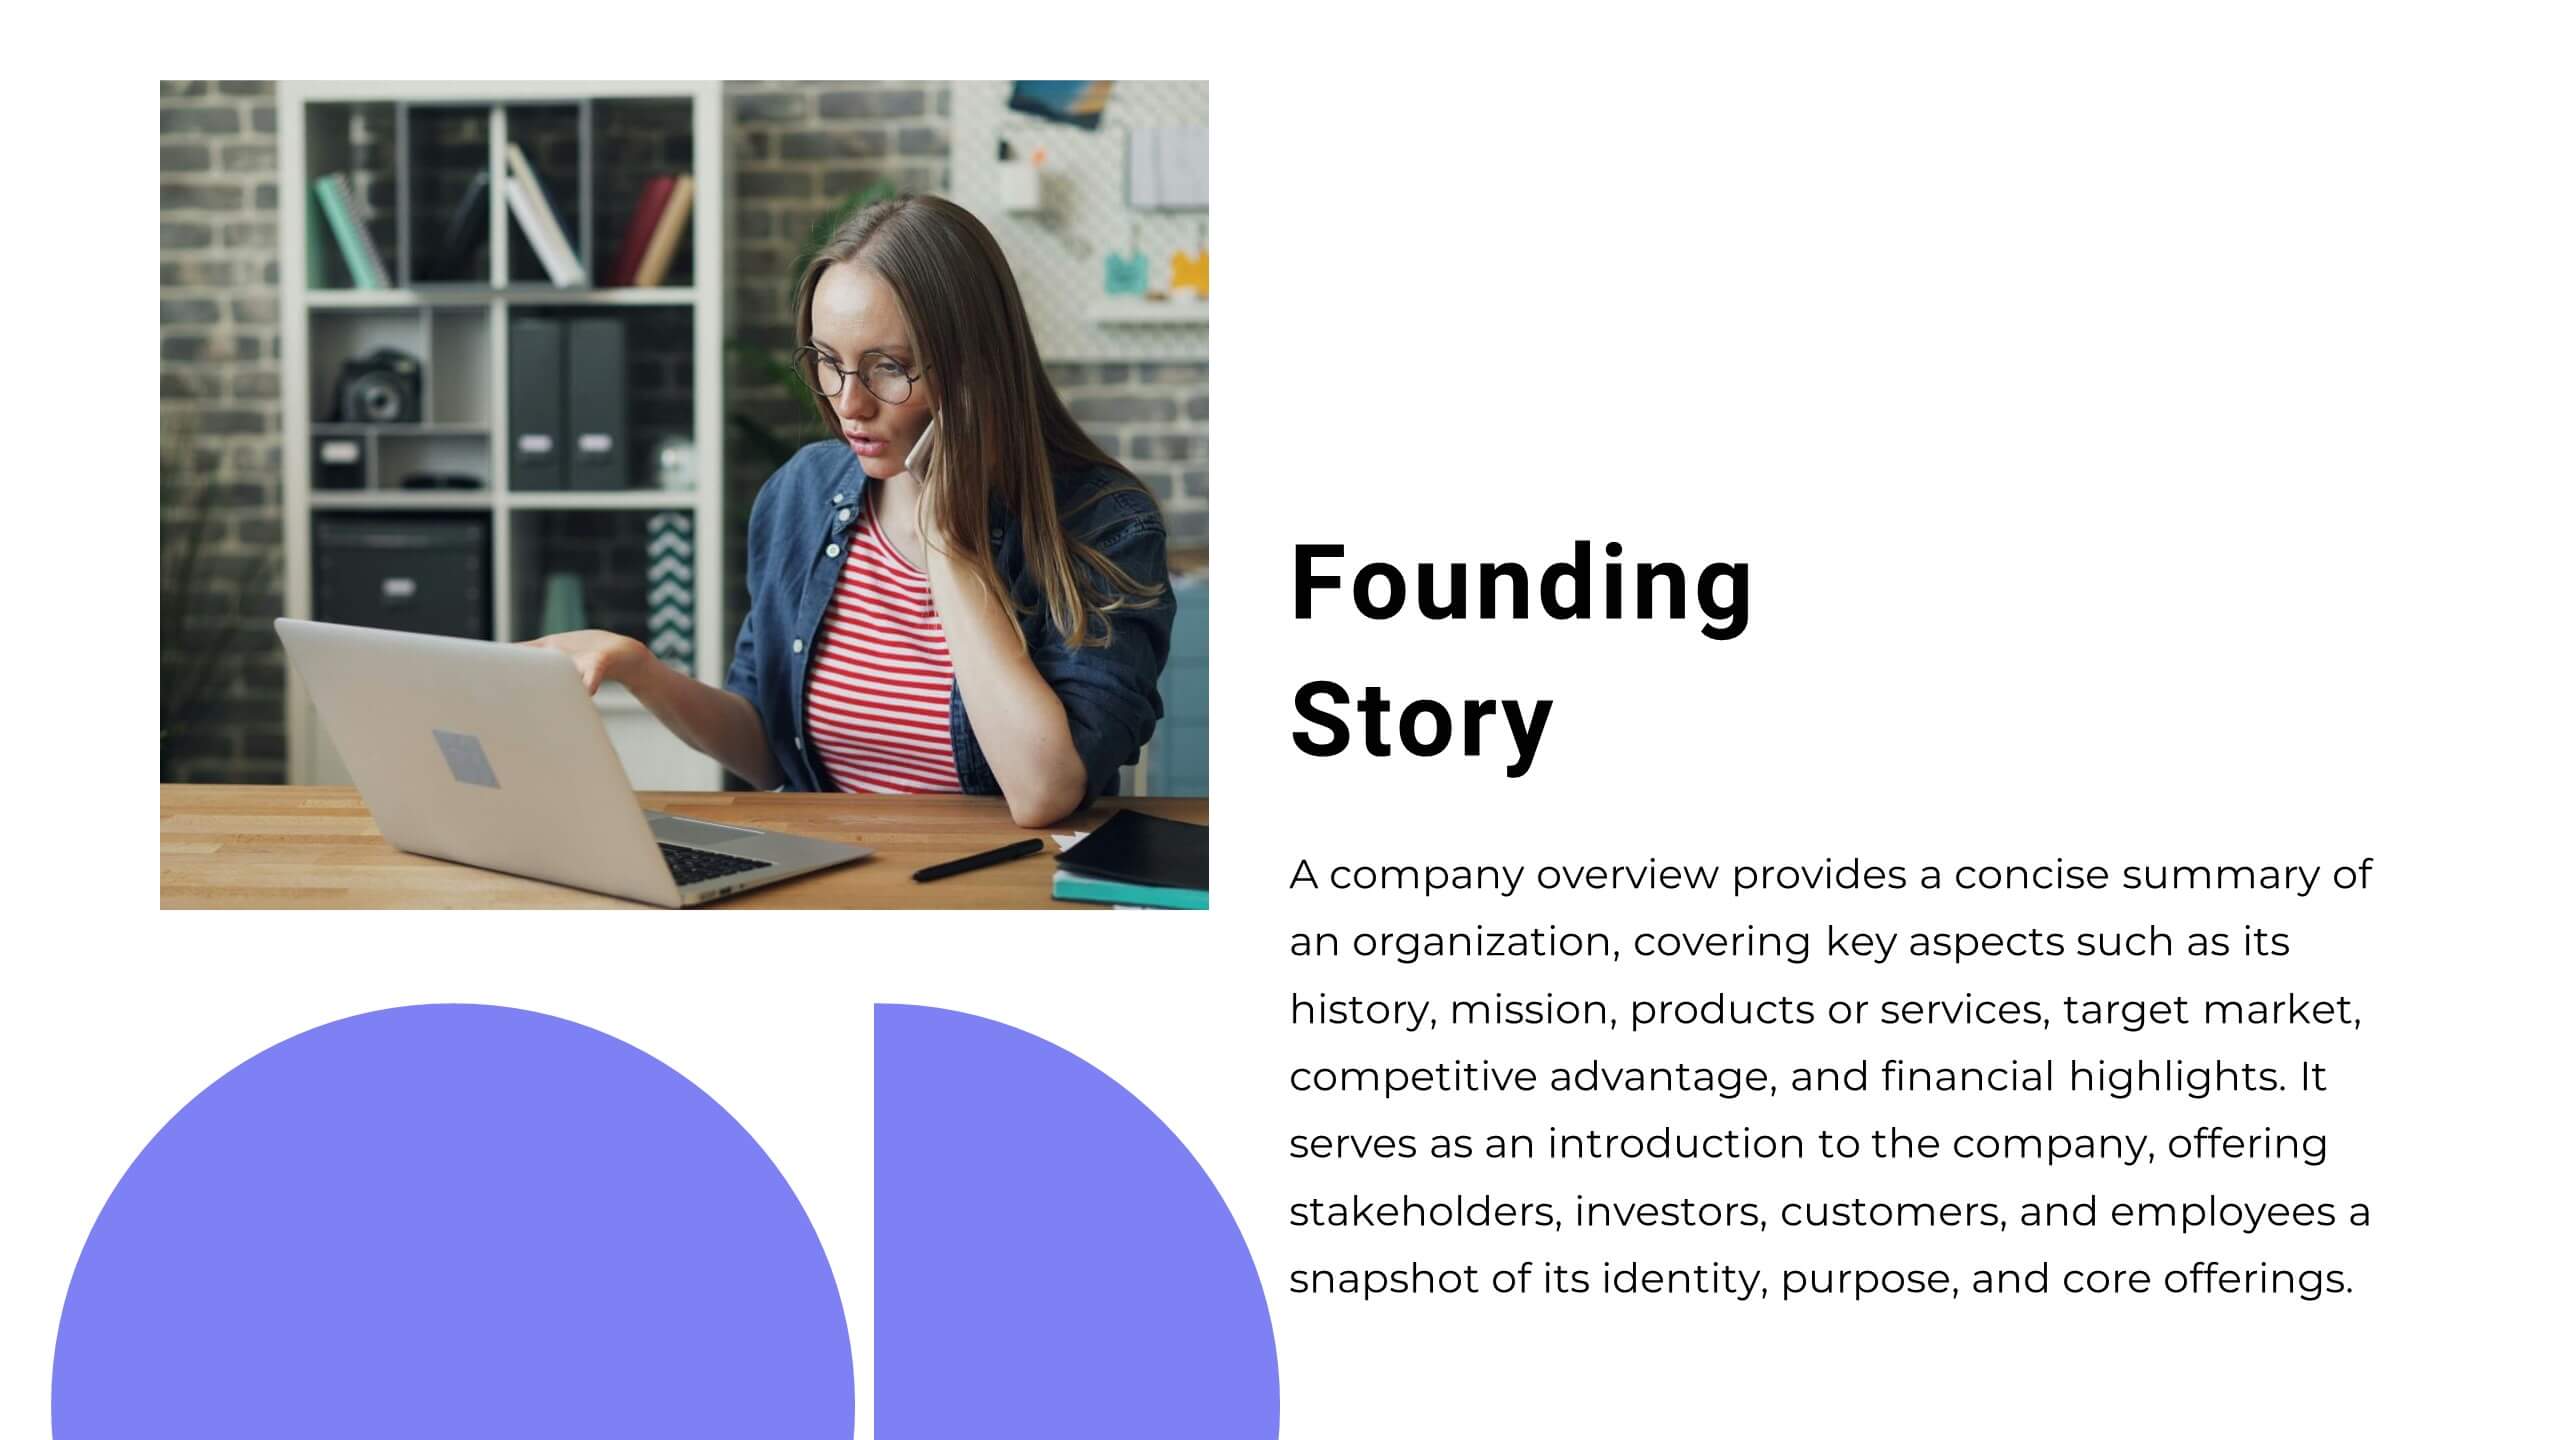
Vibrant Startup Pitch Deck Presentation
This dynamic and modern Startup Pitch Deck template is perfect for showcasing your startup's vision, strategy, and growth potential. Featuring a sleek design with bold visuals, this template guides you through key sections such as mission and vision, product/service overview, target market, and financial projections. It’s tailored to help you tell a compelling story that resonates with investors and stakeholders. The template is fully customizable in PowerPoint, Keynote, or Google Slides, ensuring you can adapt it to your specific needs and create a memorable presentation that leaves a lasting impression.


6 slides
Company Profile Insights Infographic
This set of templates is designed to convey critical company insights through a visually engaging presentation, ideal for showcasing a company’s core strengths and operational highlights. Each layout provides a structured approach to display key data points and insights that are vital to understanding the company's market position and strategic direction. The templates feature a variety of elements, such as statistical displays, financial summaries, and operational benchmarks, that provide a comprehensive snapshot of company performance. By integrating graphical representations like bar charts, pie charts, and progress indicators, these templates make complex data accessible and easily understandable. The color schemes and design elements can be customized to align with company branding, ensuring a cohesive look throughout the presentation. These are excellent tools for annual meetings, investor briefings, or internal reviews, enabling businesses to effectively communicate their achievements, identify trends in their operations, and guide strategic planning discussions. By utilizing these templates, companies can highlight their successes, areas for improvement, and future outlook in a clear and professional manner, fostering transparency and confidence among stakeholders.


7 slides
Investment Bank Infographic Presentation
An investment infographic helps investors understand complex investment concepts by presenting information in a clear and concise manner. This is a professional Investment template with all the elements you need to make a great impact. Use this presentation to help you explain a new investment opportunity, or show the benefits of your product or service. Designed for use in PowerPoint, Keynote and Google Slides, it is easy to customize and fully editable, making it a perfect starting point for any investor or financial pitch. You can change the texts, image and shapes as you wish!


26 slides
Corporate and Investment Company Profile Presentation
A corporate and investment company profile is a comprehensive document that provides detailed information about a company engaged in corporate and investment services. This presentation template is an effective way to introduce your company's services, capabilities, and track record to your audience. This template can be used to reflect your company's professionalism, expertise, and value proposition. This presentation is fully customizable and compatible with Powerpoint, Keynote, and Google Slides. This allows you to incorporate your company logo, brand colors, and relevant images that reflect your corporate identity.


6 slides
External Business Factors PESTEL Model Presentation
Present your strategic analysis with clarity using this External Business Factors PESTEL Model Presentation. Designed to break down Political, Economic, Social, Technological, Environmental, and Legal influences, this layout helps convey complex macro-environmental insights in a simple, color-coded visual format. Ideal for consultants, business analysts, and corporate strategists. Fully editable in PowerPoint, Keynote, and Google Slides.


4 slides
Athlete Performance Metrics Presentation
Track and display key performance data with this Athlete Performance Metrics slide. Featuring a semi-circular layout with sports icons, percentages, and editable text areas, this template helps visualize stats clearly. Ideal for coaching reports or sports analysis. Compatible with PowerPoint, Keynote, and Google Slides for easy customization and use.


7 slides
Target Customer Profile Infographic
This Target Customer Profile infographic template is designed to help businesses clearly define and present their ideal customer segments. Available for PowerPoint, Google Slides, and Keynote, it includes various sections to detail demographics, customer needs, purchasing habits, and more. With a clean layout and a warm color scheme of oranges and blues, it facilitates the easy organization of customer information. Icons and comparison charts enable users to visualize customer motivations, goals, and product alignment efficiently. Ideal for marketers and business planners, this template simplifies the process of profiling target customers in a visually engaging and informative manner.


26 slides
Wedding Planner Company Profile Presentation
A wedding planner company is a specialized service provider that assists couples in planning, organizing, and coordinating their wedding day. This beautiful template is tailored for wedding planning companies looking to showcase their services and expertise. With this presentation, wedding planners can present their company's unique offerings, experience, and past successful events in an engaging and elegant manner. This presentation features an elegant and romantic design that reflects the essence of weddings. It incorporates soft colors, floral patterns, and beautiful imagery to create a sophisticated and enchanting atmosphere.


7 slides
Leadership Principles Infographic Presentation
A Leadership Infographic provides information about leadership principles, practices, and strategies. This template has been designed as a tool for presenting complex leadership concepts and ideas, using visual elements such as icons, charts, and diagrams. This infographics can be used to cover a wide range of topics related to leadership, including leadership styles, communication, decision-making, team building, and problem-solving. Use the text boxes and charts to provide information on the qualities and skills of effective leaders, such as empathy, vision, and strategic thinking.


10 slides
Agile Sprint Planning with Scrum Board Presentation
Plan and track your sprints effectively with this Agile Scrum Board Template. Featuring customizable “Stories,” “To Do,” “In Progress,” and “Testing” columns, this layout helps visualize workflow and team tasks clearly. Perfect for scrum masters and agile teams. Compatible with PowerPoint, Keynote, and Google Slides for easy editing.


2 slides
Final Gratitude Page in Deck Presentation
The Final Gratitude Page in Deck Presentation is a bold and engaging closing slide, ideal for ending your presentation with personality and professionalism. With its bright orange theme, modern photo frame, and "THANK YOU!" message in clear typography, it leaves a lasting impression on your audience. Perfect for webinars, educational talks, or business presentations. Fully customizable in PowerPoint, Keynote, and Google Slides.