


Features
- 8 Unique slides
- Fully editable and easy to edit in Microsoft Powerpoint, Keynote and Google Slides
- 16:9 widescreen layout
- Clean and professional designs
- Export to JPG, PDF or send by email


Do you have any questions?
Recommend


21 slides
Mystic UX Research Report Presentation
Present your UX research with precision using this sleek and engaging report template! It covers key elements like user research, wireframes, prototyping, testing, and branding guidelines, providing a comprehensive overview of the design process. Ideal for client reviews or team discussions, this template is fully compatible with PowerPoint, Keynote, and Google Slides.


6 slides
Logistics and Procurement Supply Chain Presentation
Optimize your supply chain strategy with the Logistics and Procurement Supply Chain template. Designed to illustrate key logistics processes, procurement flows, and operational efficiency, this structured layout helps you present crucial data with clarity. Fully customizable and compatible with PowerPoint, Keynote, and Google Slides for seamless business integration.


5 slides
End-to-End Value Chain Map Presentation
Bring clarity to complex operations with a smooth, visual flow that makes every stage of your process easy to follow. This presentation maps activities from start to finish, helping teams understand dependencies, improve efficiency, and spot opportunities for optimization. Fully compatible with PowerPoint, Keynote, and Google Slides.


4 slides
Digital Funnel and Lead Generation Presentation
Visualize your customer journey clearly with the Digital Funnel and Lead Generation Presentation. This template uses stacked 3D-style funnel layers to illustrate each step—from awareness to conversion—making it perfect for marketing strategy, sales pipelines, or automation flows. Clean layout, customizable text, and icons included. Compatible with PowerPoint, Keynote, and Google Slides.


21 slides
Whisperleaf Startup Strategy Presentation
This vibrant startup strategy template sets the stage for success with structured content and bold design. Highlight your mission, vision, product overview, and competitive landscape all in one place. Perfect for conveying business models, market insights, and growth strategies with clarity. Editable in PowerPoint, Keynote, and Google Slides for ultimate flexibility.


7 slides
Digital Marketing Strategies Infographic
The Digital Marketing Strategies Infographic provides a colorful and organized presentation of key performance indicators and metrics essential for evaluating the success of digital marketing campaigns. It covers various platforms and strategies, illustrating comparative engagement rates, follower counts, and other relevant data points. This infographic is an excellent resource for marketers looking to convey their campaign results in a clear, concise manner. It is suitable for use in PowerPoint, Google Slides, and Keynote presentations, ideal for illustrating progress, setting benchmarks, and sharing insights with team members, stakeholders, or clients.


5 slides
Brain Chemistry Infographics
Brain chemistry refers to the complex interplay of chemicals, also known as neurotransmitters, that are responsible for transmitting signals within the brain. These infographic templates are designed to illustrate the intricate workings of brain chemistry. They aim to explain complex concepts in a clear and engaging way, making it suitable for educational settings, psychology courses, neuroscience presentations, or any context where understanding brain chemistry is essential. These templates set the foundation for exploring various aspects of brain chemistry. Colorful illustrations and icons help visualize the neurotransmitters and their impact.


7 slides
Transportation & Logistics Infographic PowerPoint Template and Google Slides Theme
A transportation & logistics infographic is a visual representation of information and data related to the movement of goods and people from one place to another. This template can be used to convey complex information about a variety of topics in the transportation and logistics industry. This template includes many graphics, images, and charts to help illustrate your data, and allows you to Input your shipping routes, delivery times, and flow of goods. This template can be used for various purposes, such as educating the public and promoting efficient transportation and logistics practices.


26 slides
Natlea Presentation Template
Need help presenting your next travel destination? This template is a unique and sophisticated way to present your travel destination. The Natlea travel template is a fun, surprisingly sophisticated and easy to use template that allows you to list all the details of your trip. With bold colors, charts, budget slides and venn diagrams this template has it all. It's simple yet fun design makes it stand out and at the same time keep your audience engaged. This is the perfect choice for marketers, tourism professionals or anyone who needs to make a great looking presentation on their next trip.


26 slides
E-commerce Presentation
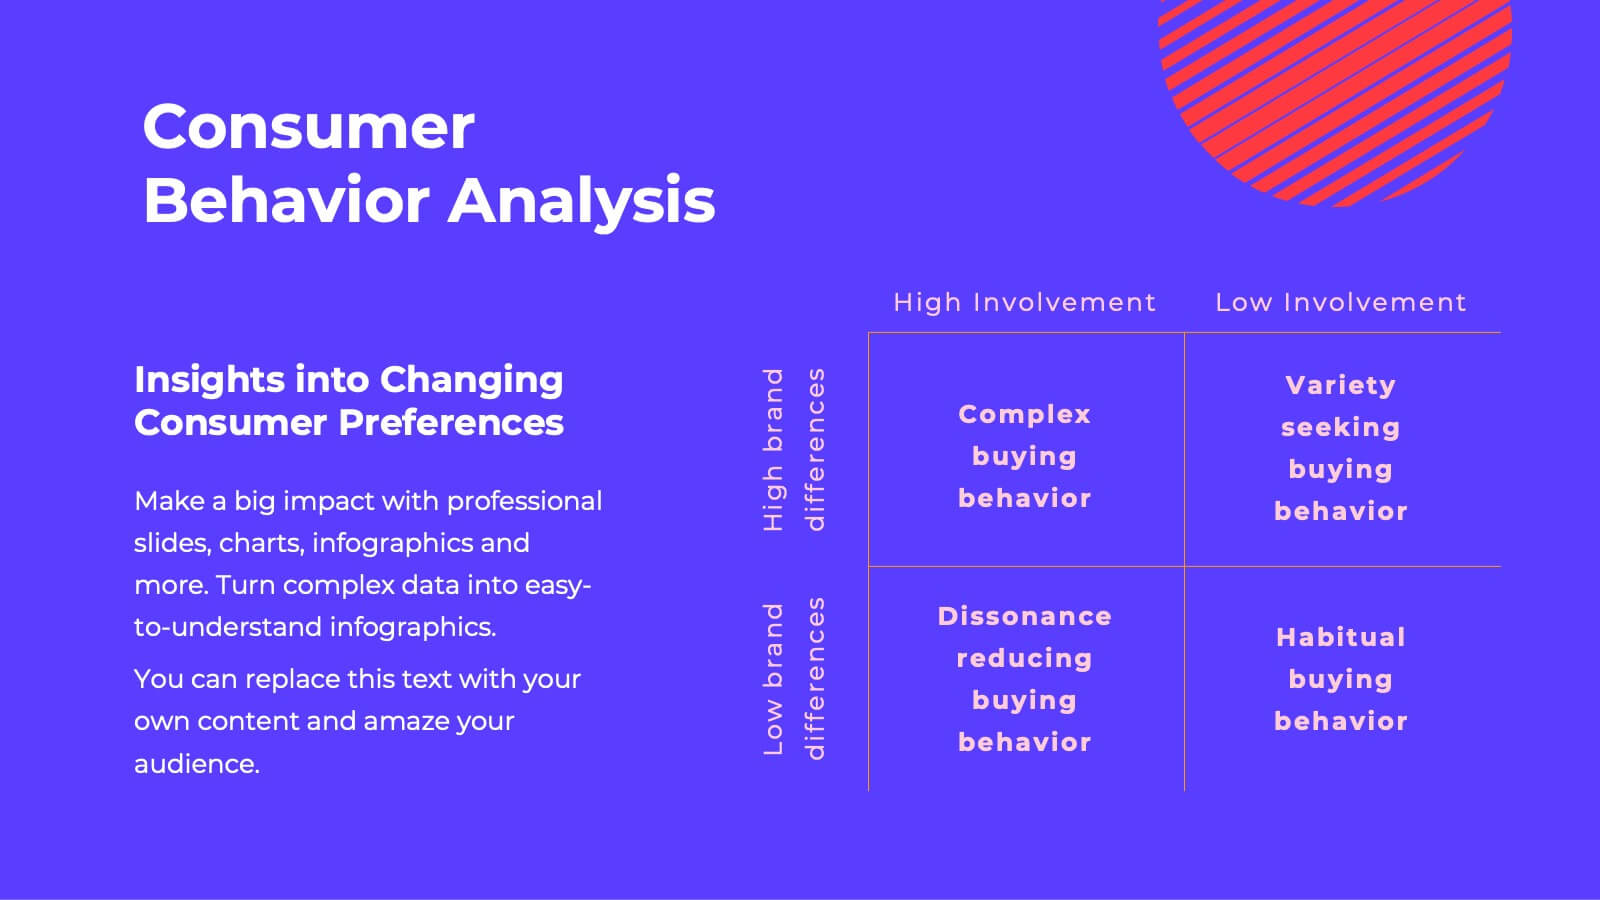
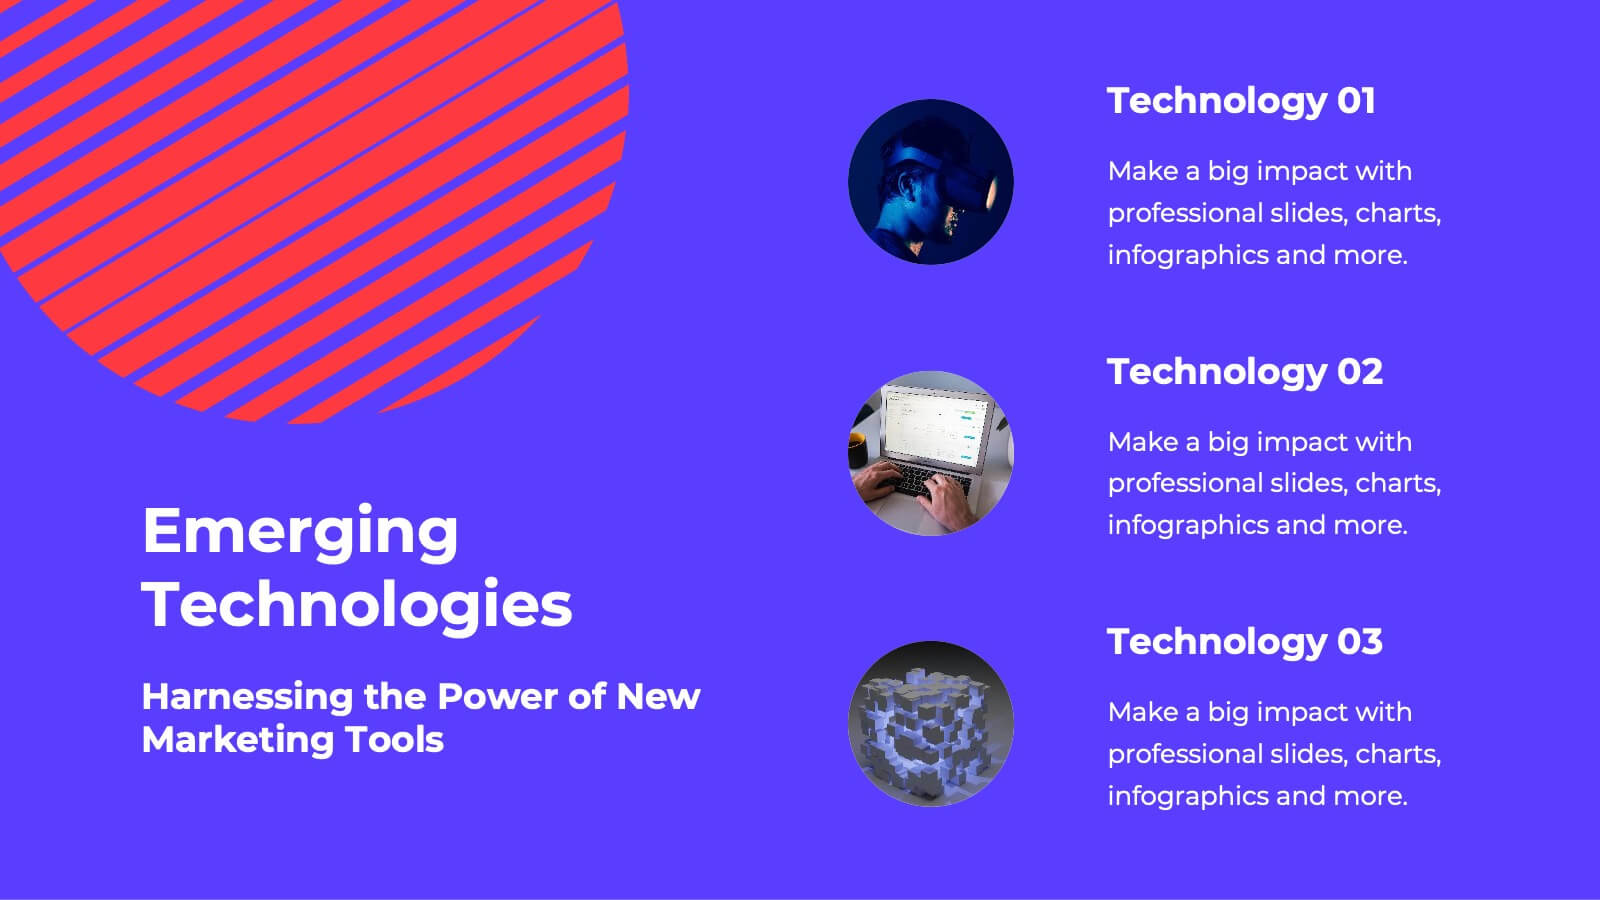
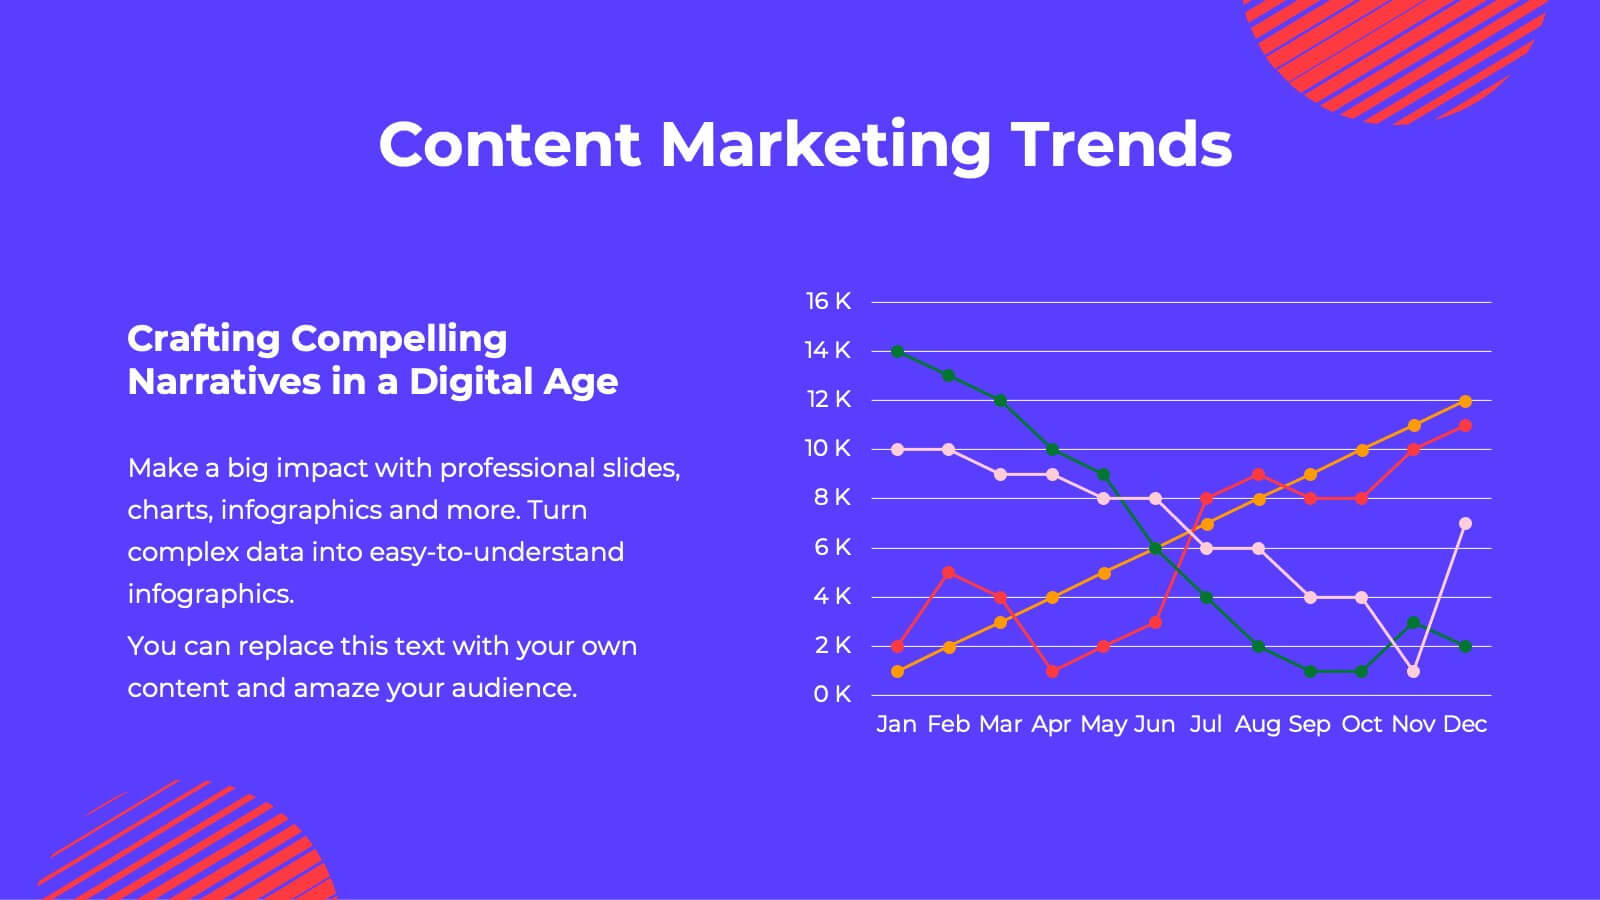
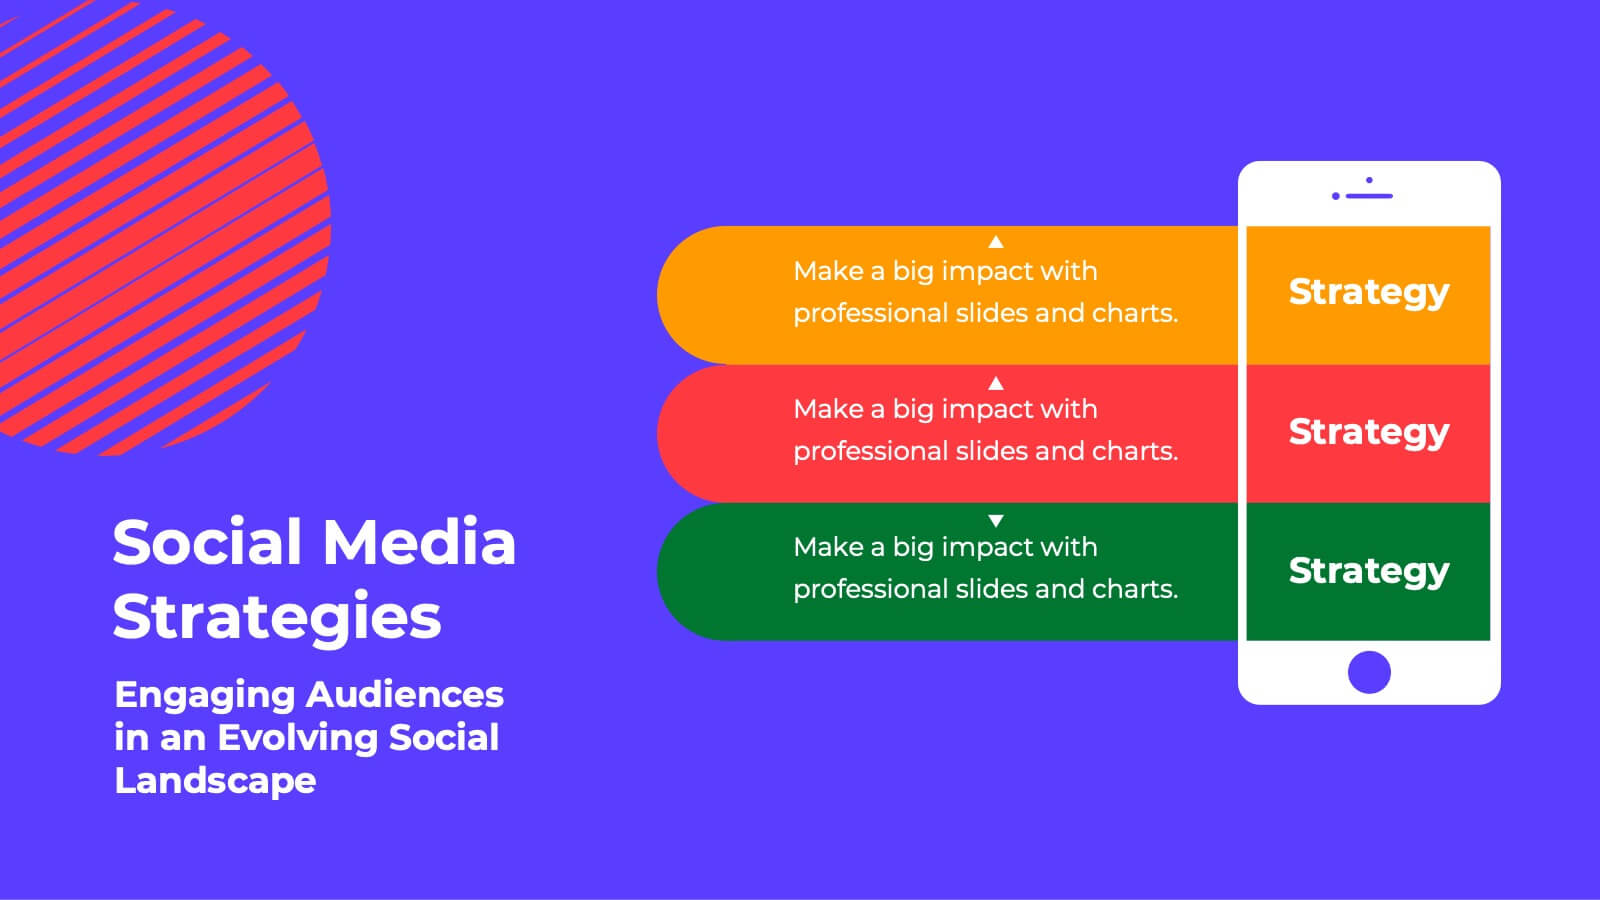
Venture into the digital marketplace with a presentation template that embodies the innovative spirit of e-commerce. This template, with its vibrant colors and modern design elements, is tailored to highlight the fast-paced world of online retail. The slides offer a digital storefront for your ideas, from introducing the creative minds behind the operation to showcasing the latest trends in online shopping. Utilize engaging layouts to compare products, outline sales strategies, or highlight consumer behavior with clear, concise infographics. With promotional slide options to announce special deals and a design that captures the convenience and excitement of shopping with a click, this collection is an essential tool for marketers, online retailers, and startups. It’s optimized for conveying complex data in a user-friendly format, ensuring your audience stays engaged and informed. Compatible with PowerPoint, Keynote, and Google Slides, it’s the perfect cart to carry your message in the bustling online marketplace.


4 slides
Healthcare Access and Preventive Care Presentation
Bring your health strategy to life with this engaging heart-themed infographic slide. Perfect for illustrating patient access points, wellness checkpoints, or preventive initiatives, each segment is cleanly organized with icons and text. Ideal for medical presentations, this template works seamlessly in PowerPoint, Keynote, and Google Slides for total flexibility.


4 slides
Welcome and About Us Introduction Presentation
Start strong with the Welcome and About Us Introduction Presentation, designed to deliver a polished, professional first impression. This clean layout features bold typography and geometric side visuals, perfect for introducing your company, brand values, or strategic vision. Easily customize the content to suit corporate profiles, startup decks, or team intros. Compatible with Canva, PowerPoint, Google Slides, and Keynote.


5 slides
Four-Step Marketing Funnel Plan Presentation
Streamline your messaging with the Four-Step Marketing Funnel Plan Presentation. This clean, vertical funnel layout highlights each stage of your strategy—ideal for visualizing lead nurturing, sales processes, or campaign progression. Each level is clearly marked and editable, helping you deliver focused insights with ease. Fully compatible with PowerPoint, Canva, Keynote, and Google Slides.


6 slides
Circular Business Wheel Model Presentation
Break down your strategy into dynamic segments with this Circular Business Wheel Model. This layout is ideal for showcasing interconnected business areas like sustainability, innovation, monetization, and market appeal. Perfect for strategy decks, business planning, and growth presentations. Compatible with PowerPoint, Keynote, and Google Slides—fully editable for your needs.

20 slides
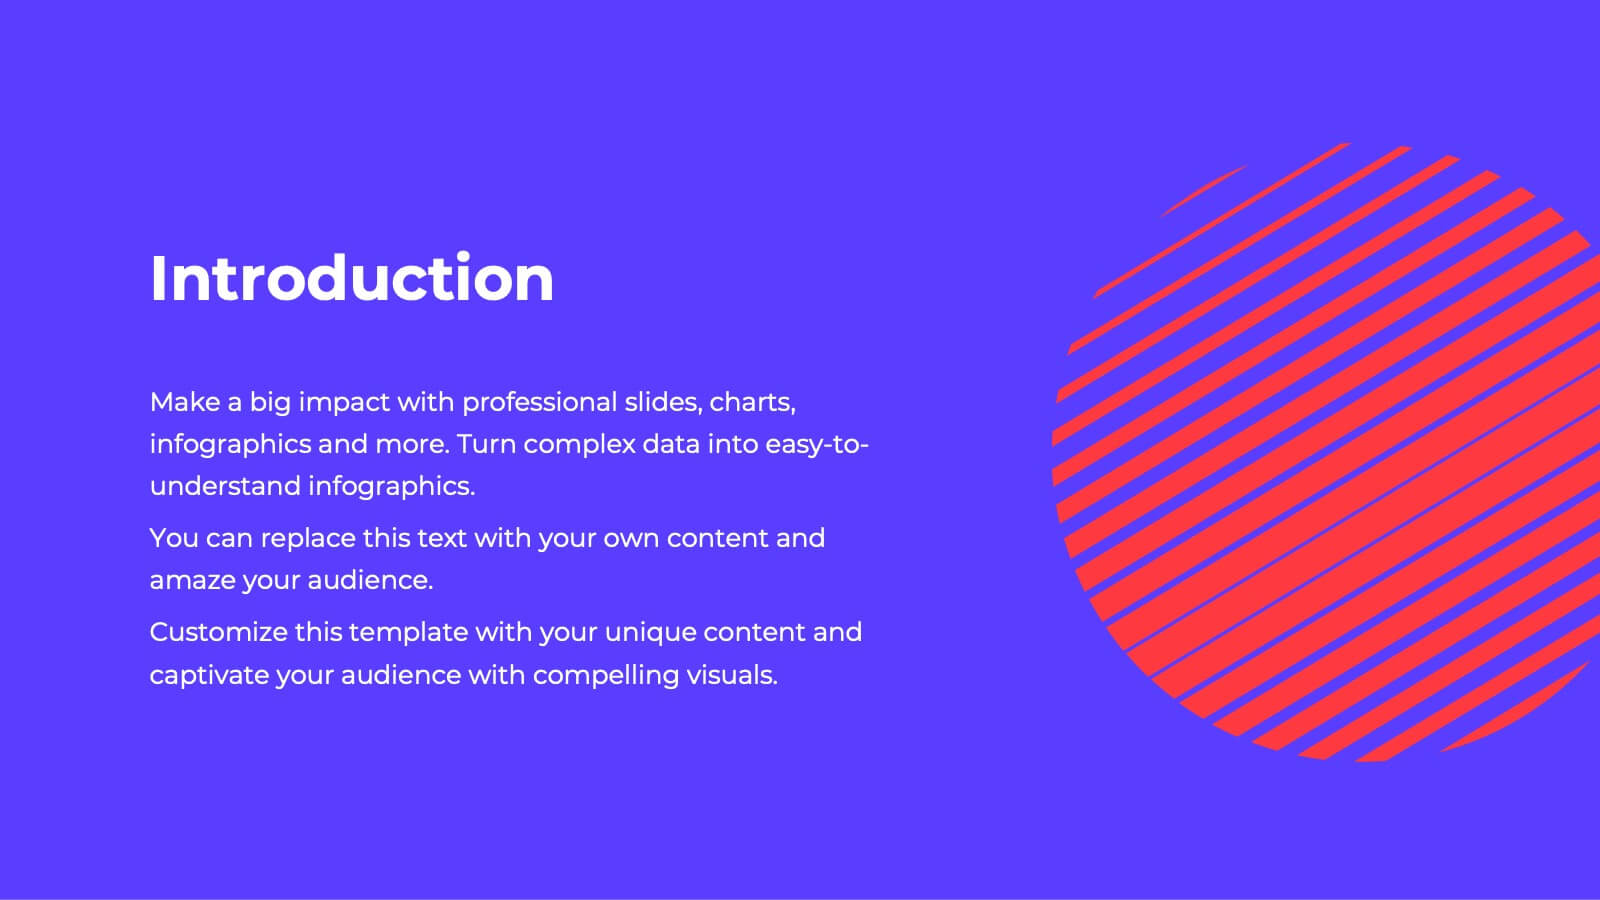
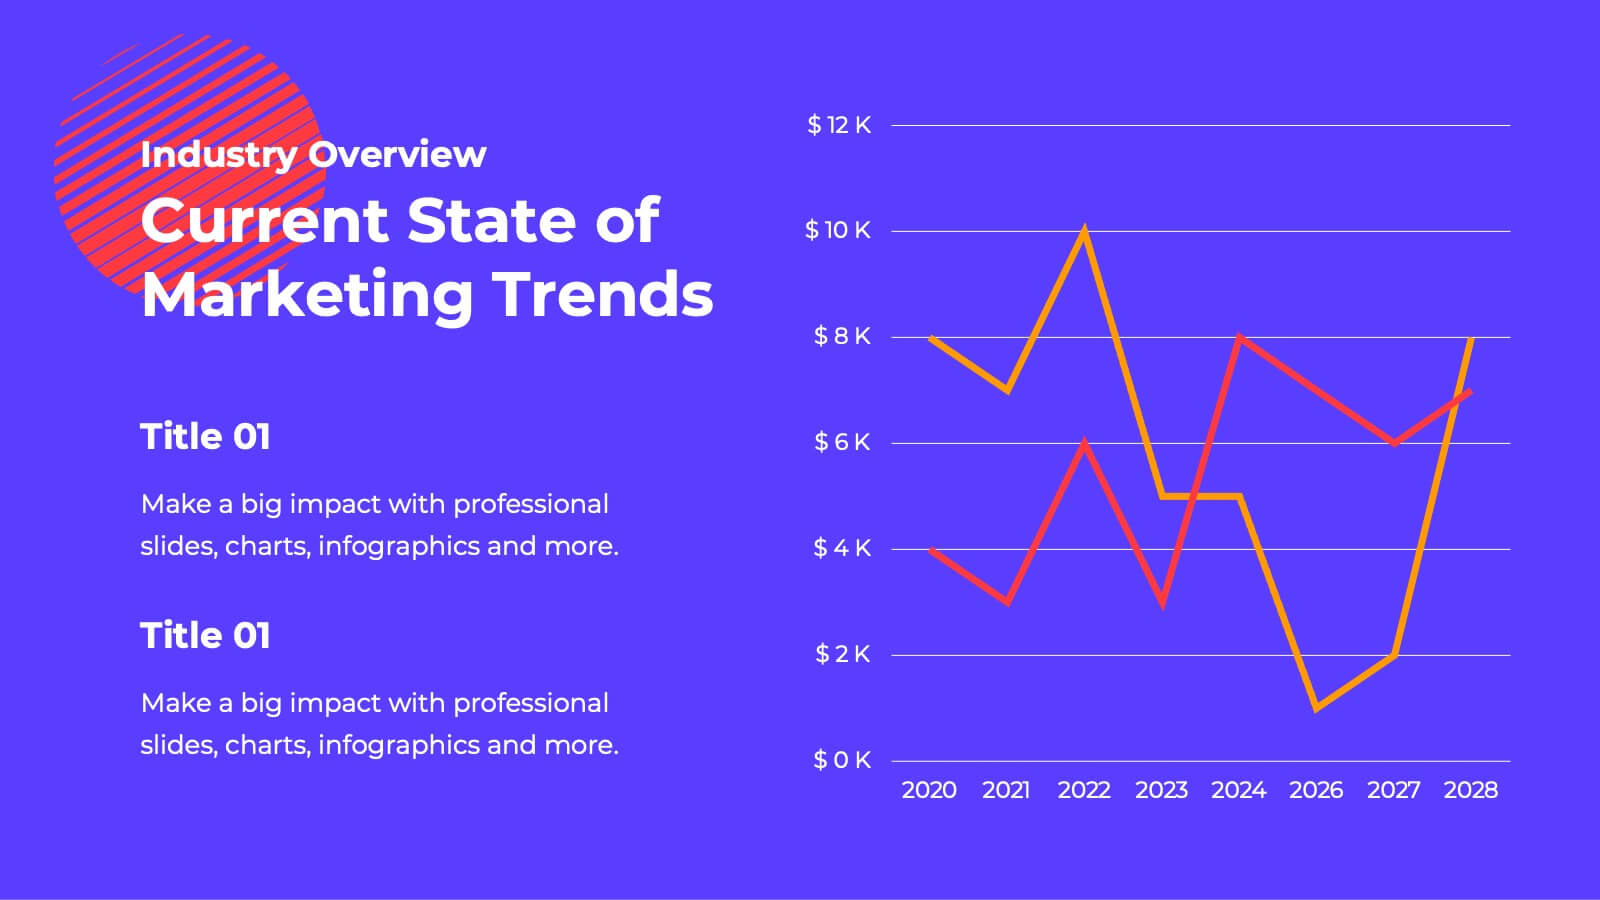
Fusion Marketing Campaign Presentation
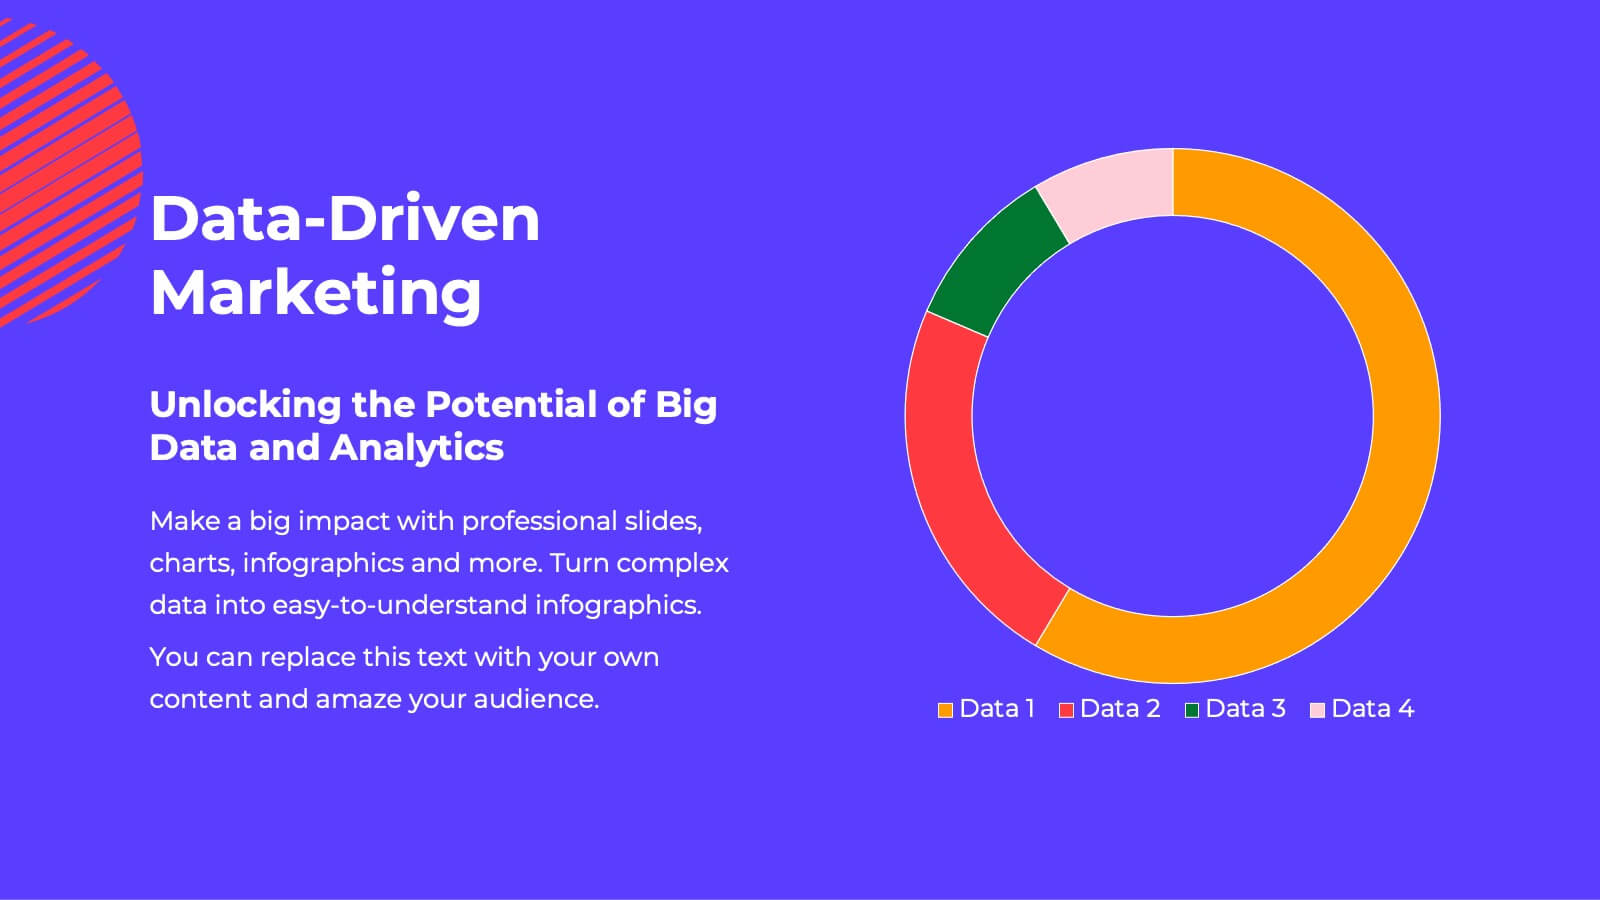
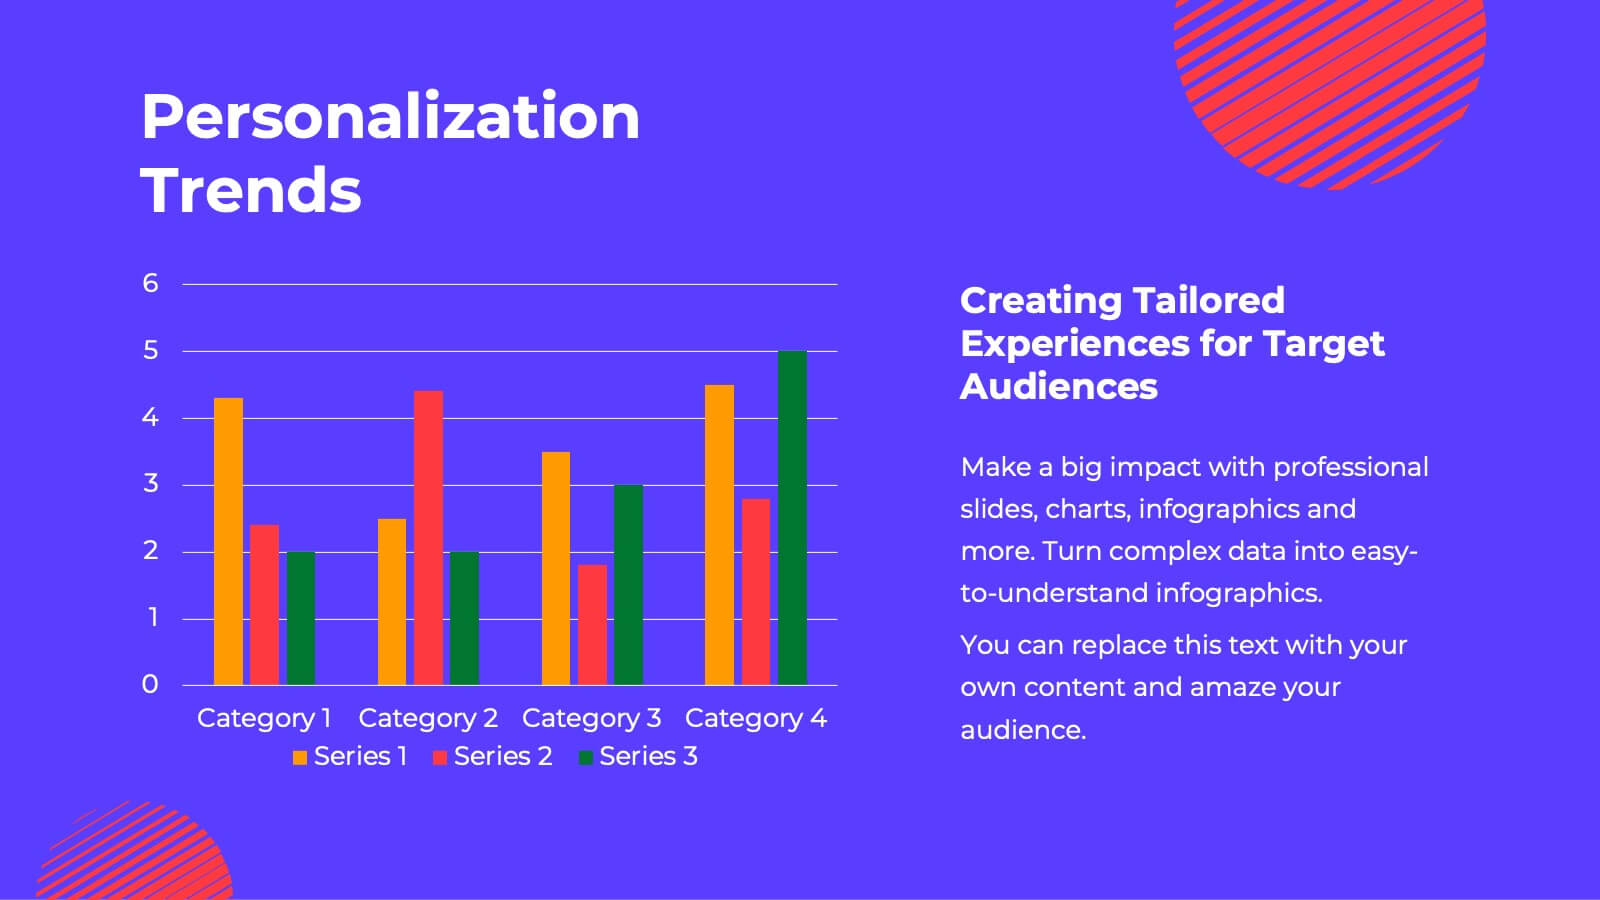
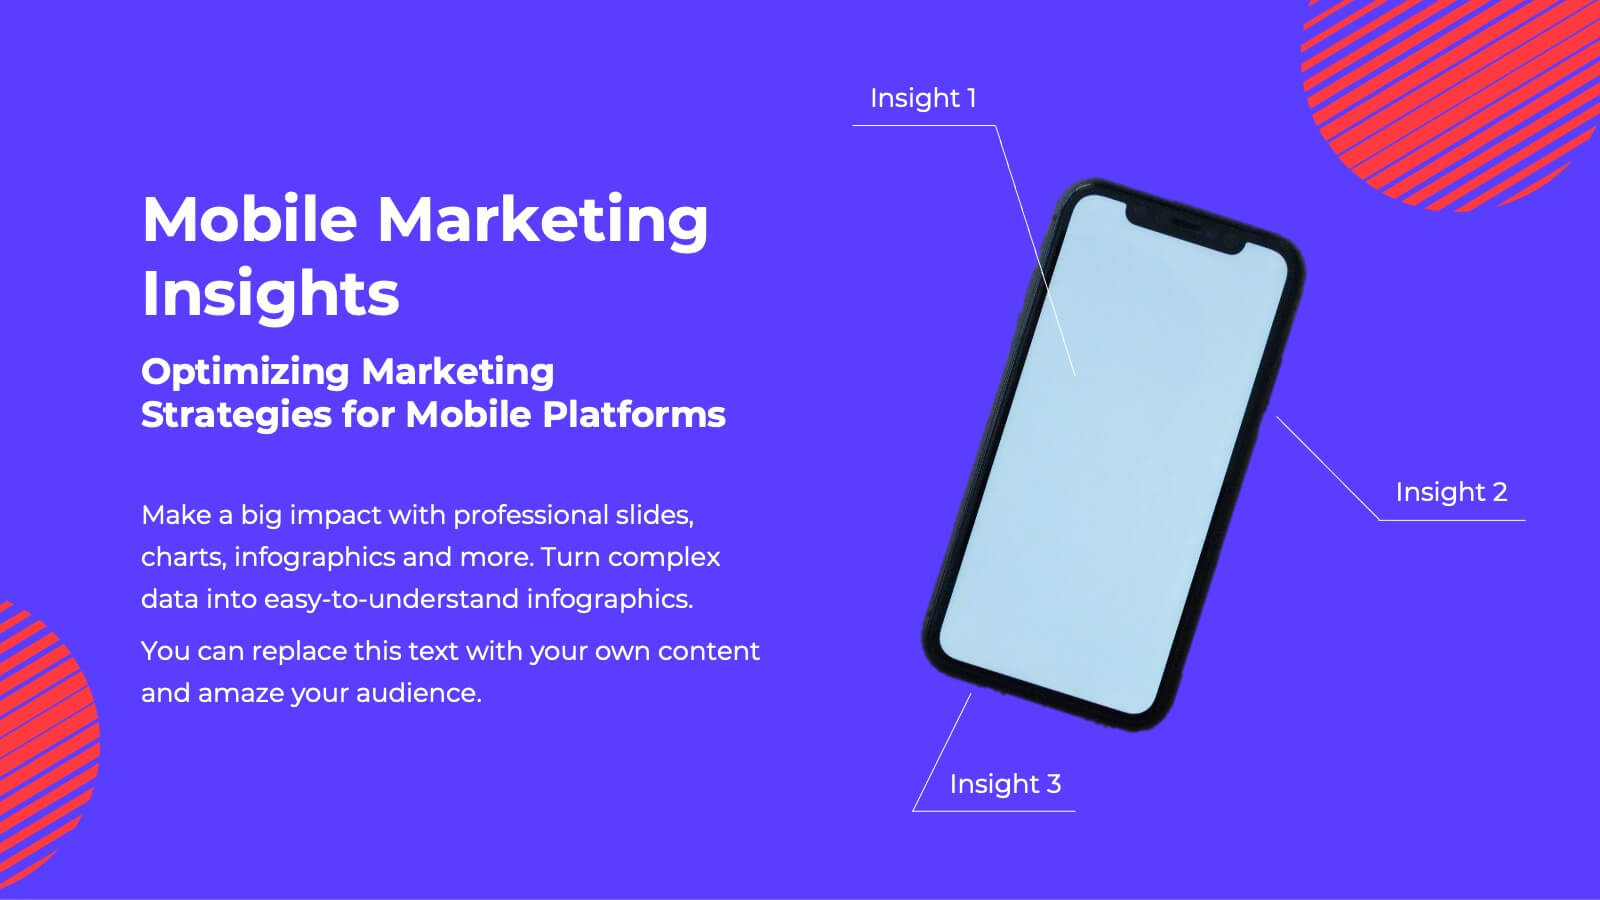
Unleash the power of your marketing campaigns with this vibrant marketing campaign template! Dive into social media strategies, influencer marketing, data-driven insights, and more. Perfect for presenting to stakeholders and team members. Fully customizable and compatible with PowerPoint, Keynote, and Google Slides.


6 slides
Social Media Metrics Dashboard Presentation
Bring your analytics to life with a bold, visual dashboard that makes social performance easy to understand at a glance. This presentation helps you showcase engagement, growth, and platform insights with clean charts and organized data sections. Fully editable and compatible with PowerPoint, Keynote, and Google Slides.


5 slides
Business Introduction and Company Profile Presentation
Introduce your business with precision and clarity using this company profile layout. Highlight your mission, vision, and key insights alongside sleek visuals and structured content. Perfect for new client onboarding, internal briefings, or stakeholder presentations. Fully editable in PowerPoint, Keynote, and Google Slides for seamless, professional customization.