


Features
- 12 Unique slides
- Fully editable and easy to edit in Microsoft Powerpoint, Keynote and Google Slides
- 16:9 widescreen layout
- Clean and professional designs
- Export to JPG, PDF or send by email


Do you have any questions?
Recommend


6 slides
30 60 90 Manager Infographic
A 30-60-90 day plan outlines an individual's goals and tasks for the first three months of a new job, project, or role. This infographic template outlines the goals and tasks a manager plans to achieve during the first 30, 60, and 90 days of their role. This is a helpful tool to communicate objectives and strategy to your team. Design the infographic so that it's easy to share. The 30-60-90 Manager Infographic serves as a roadmap for the manager's initial months and provides transparency to their team about their goals and priorities. Use a consistent color scheme that aligns with your company's branding.


27 slides
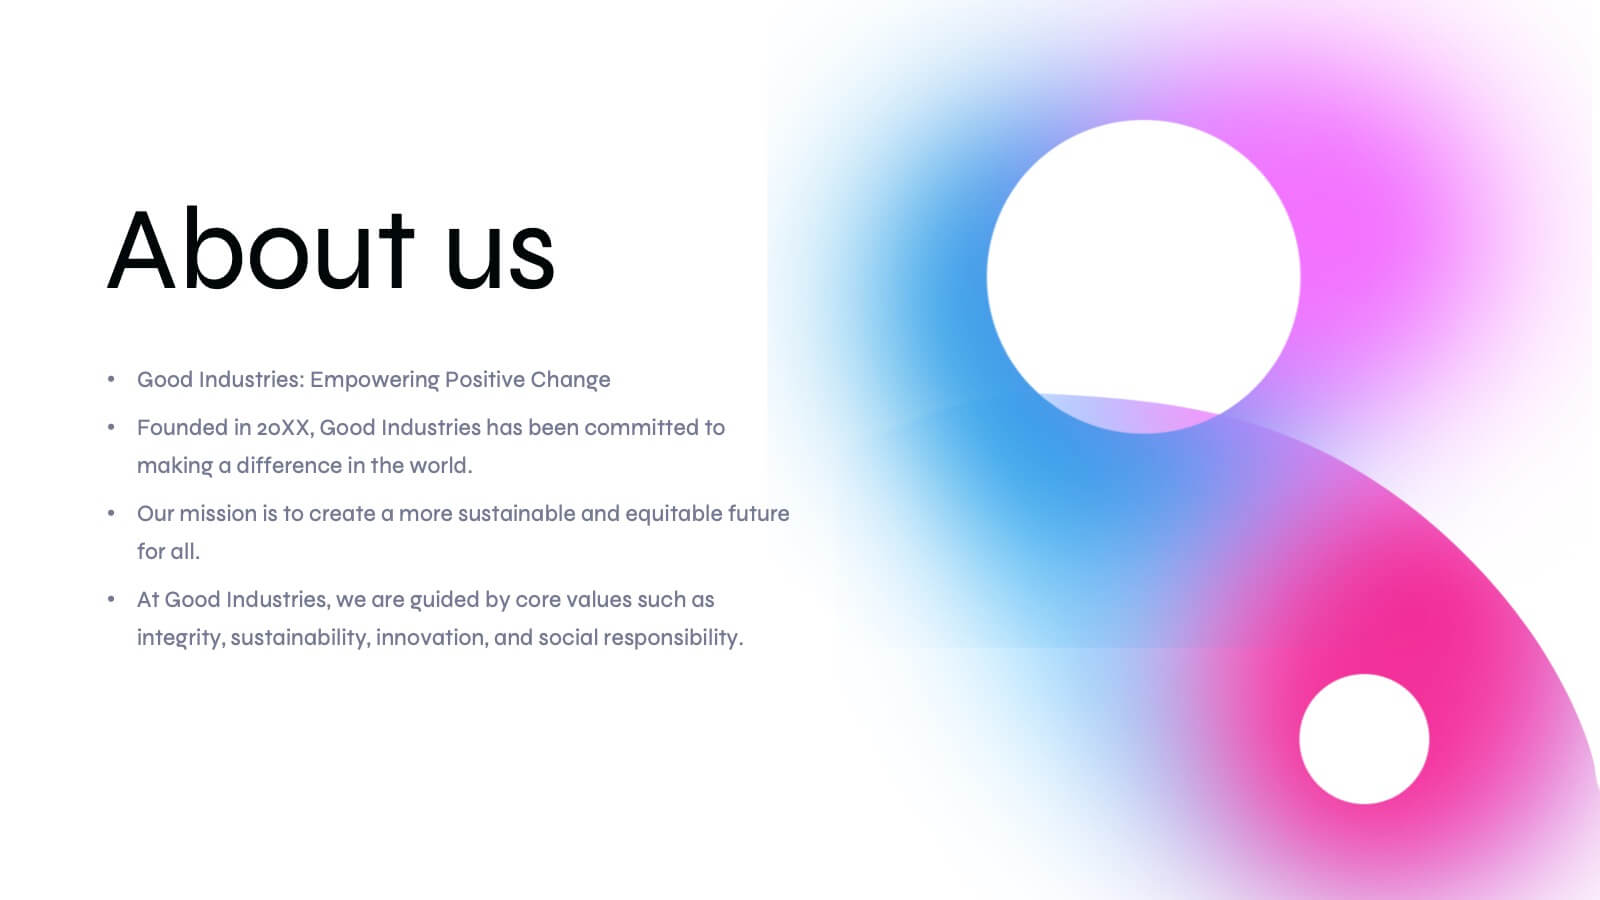
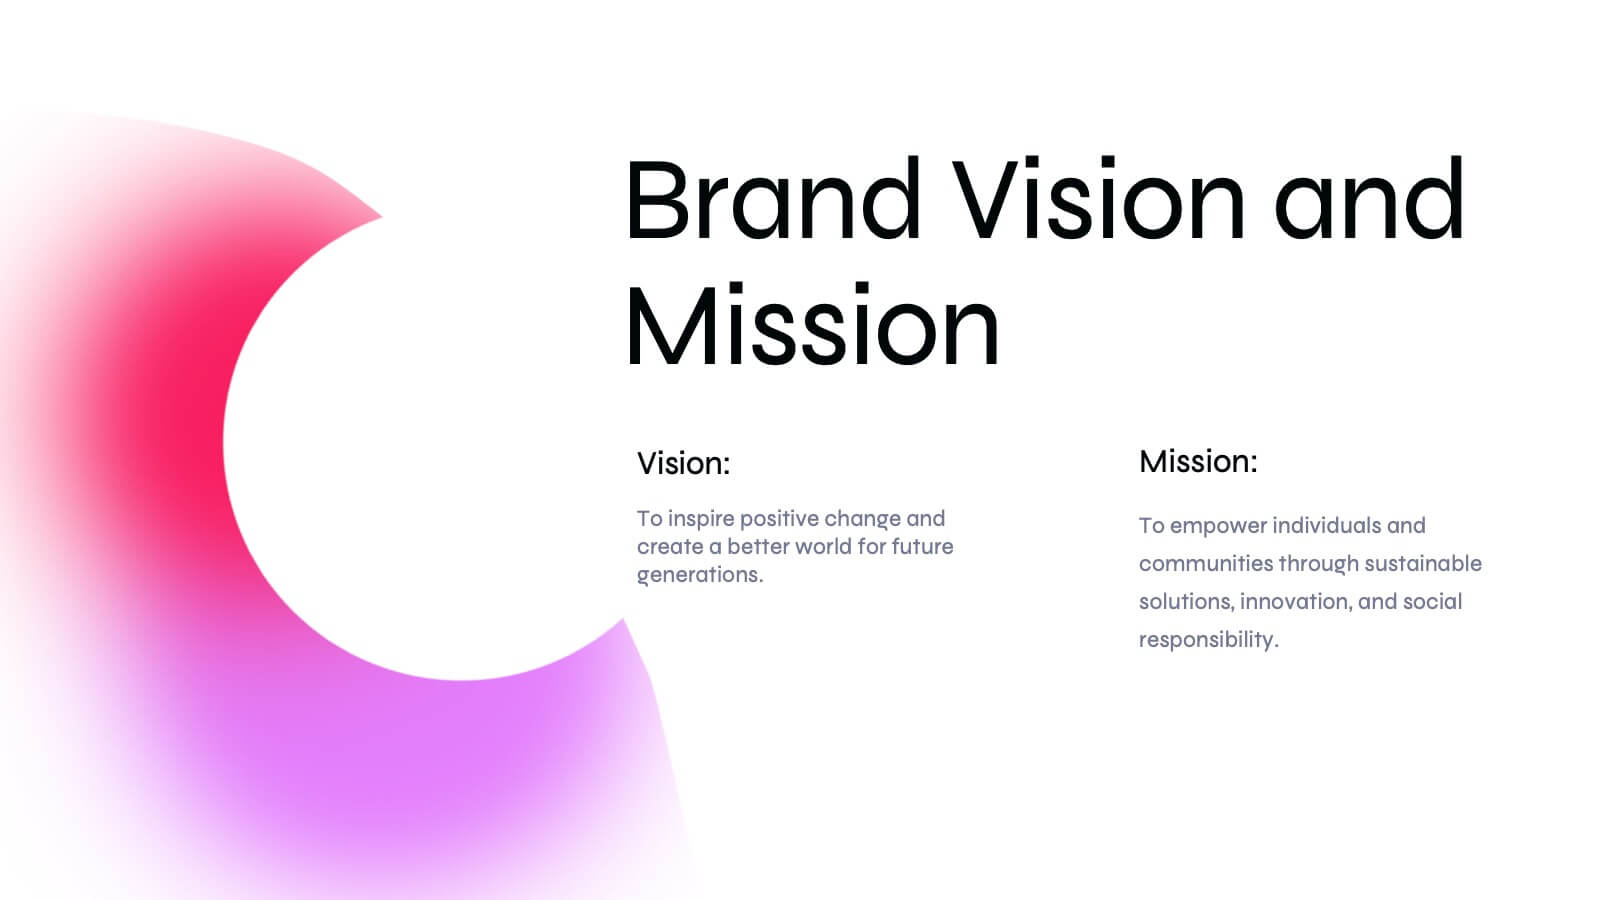
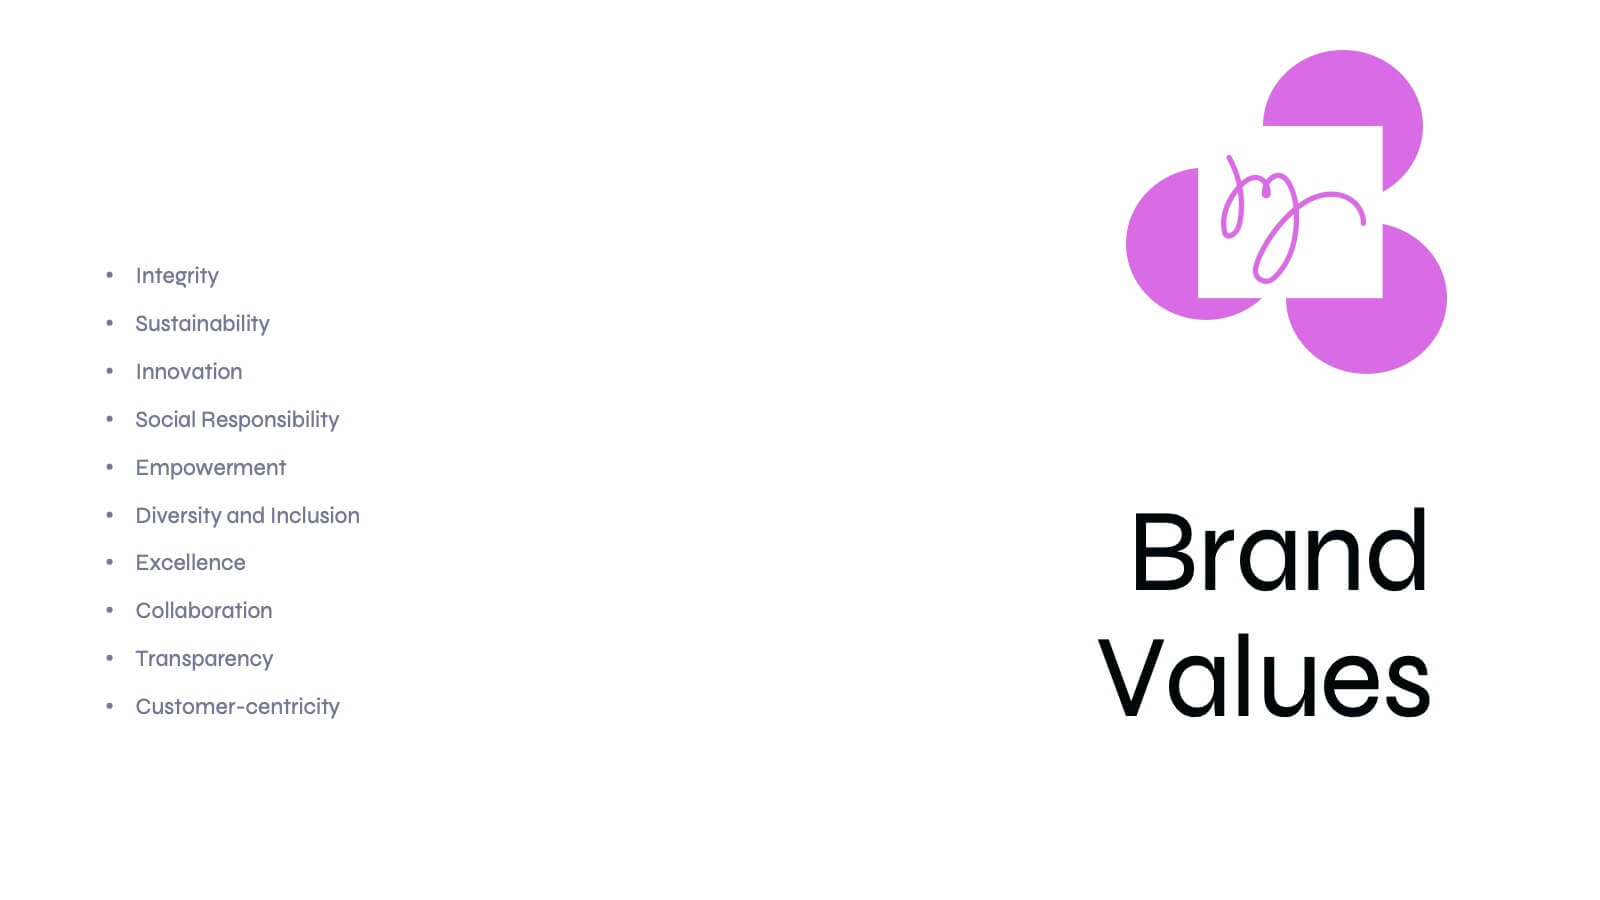
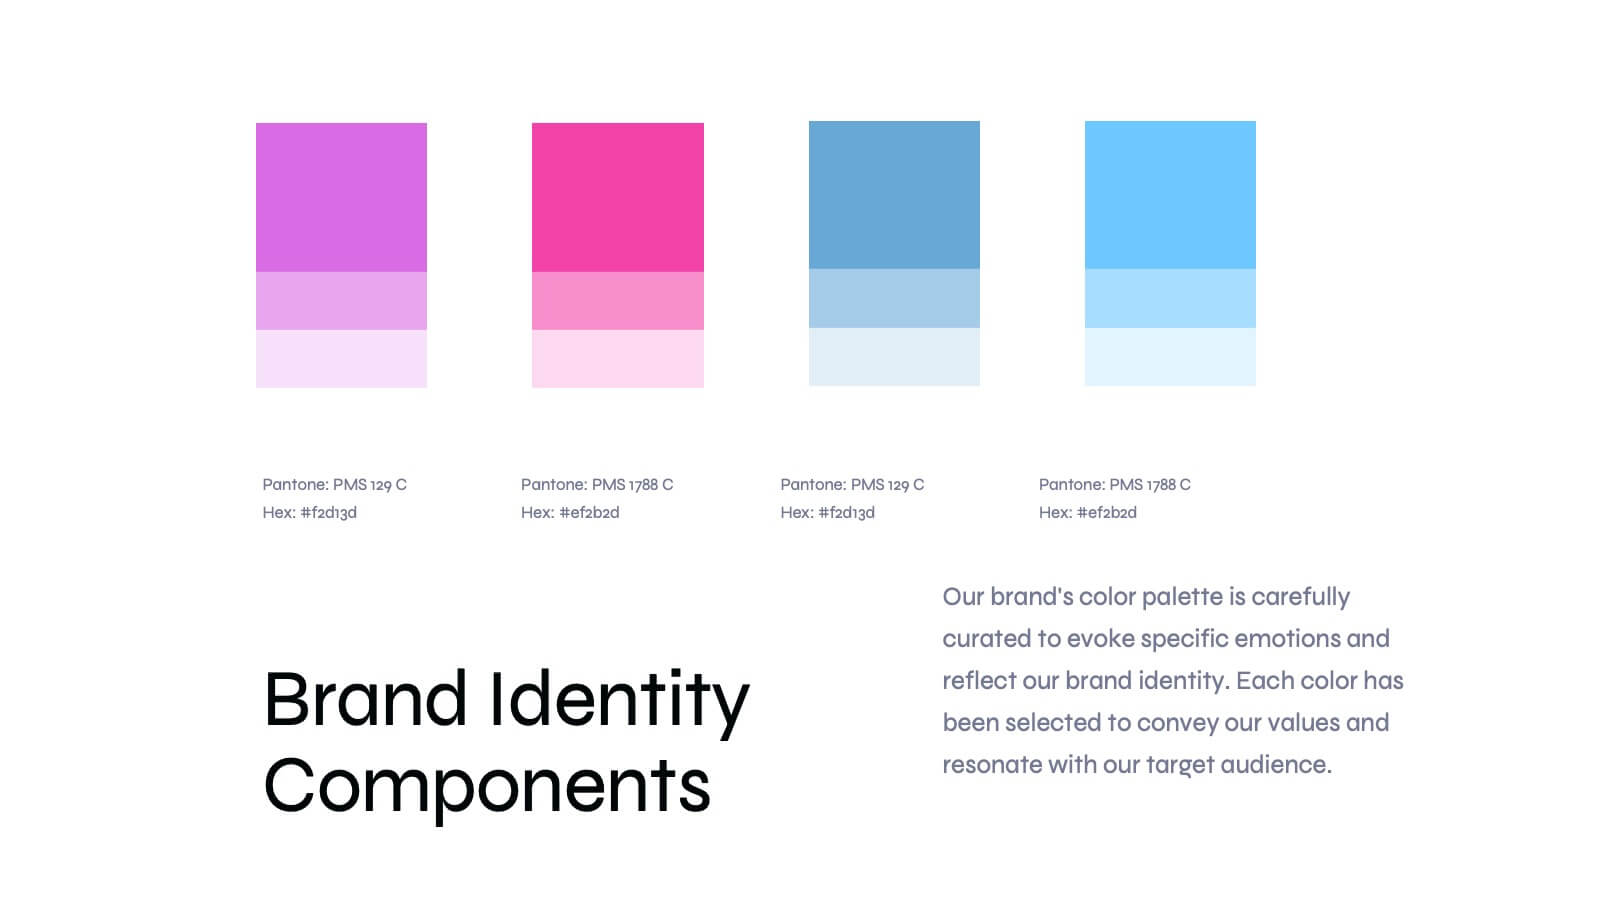
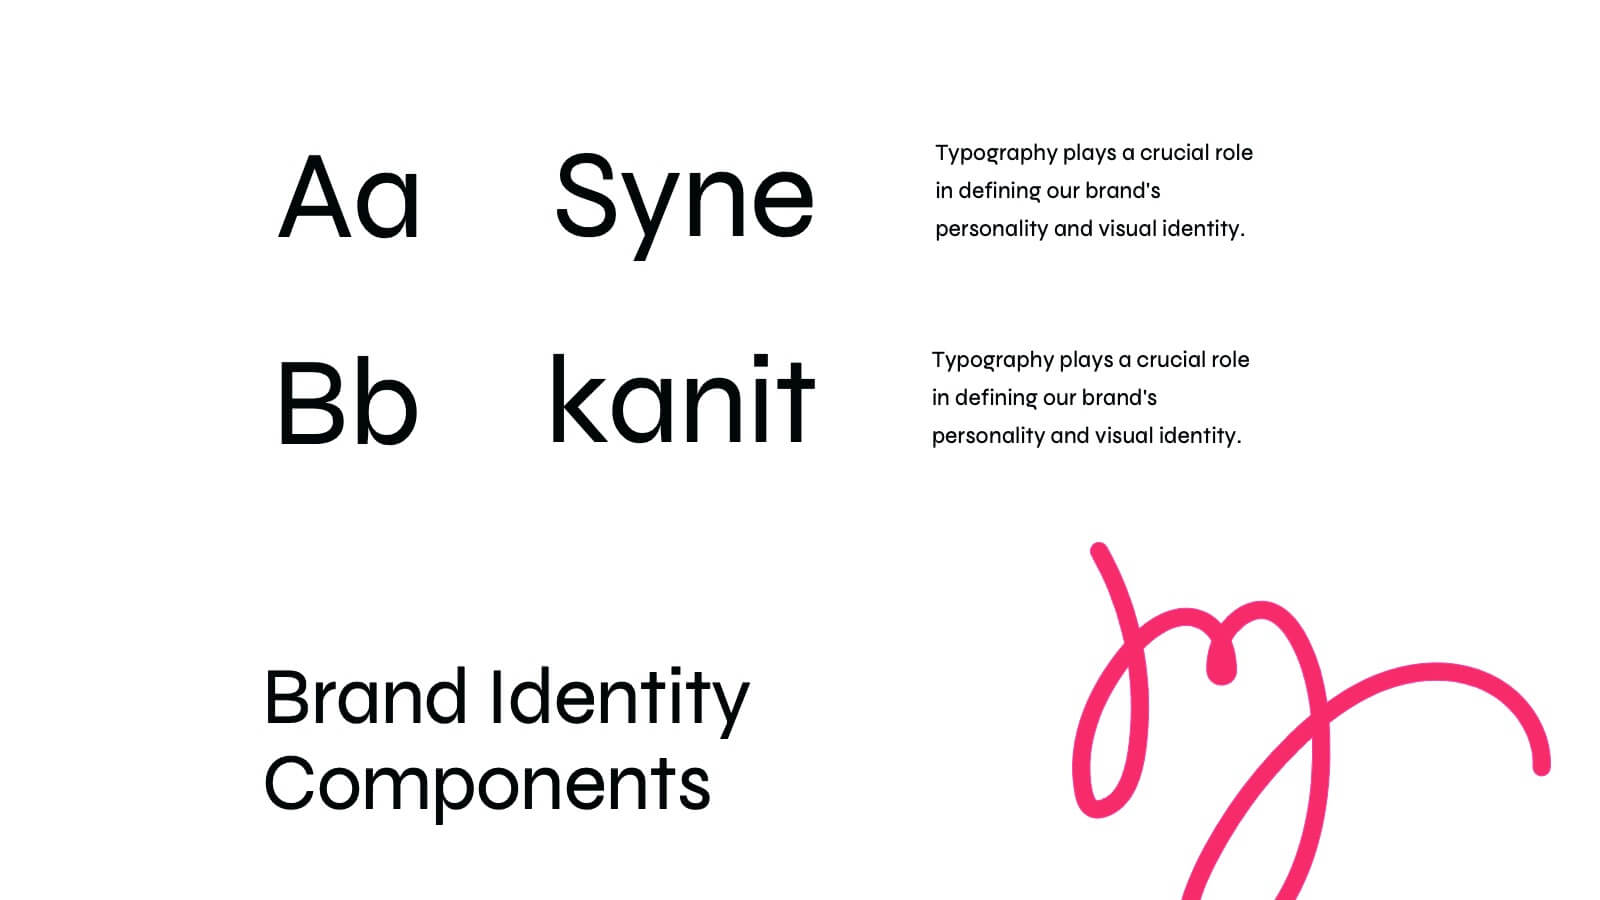
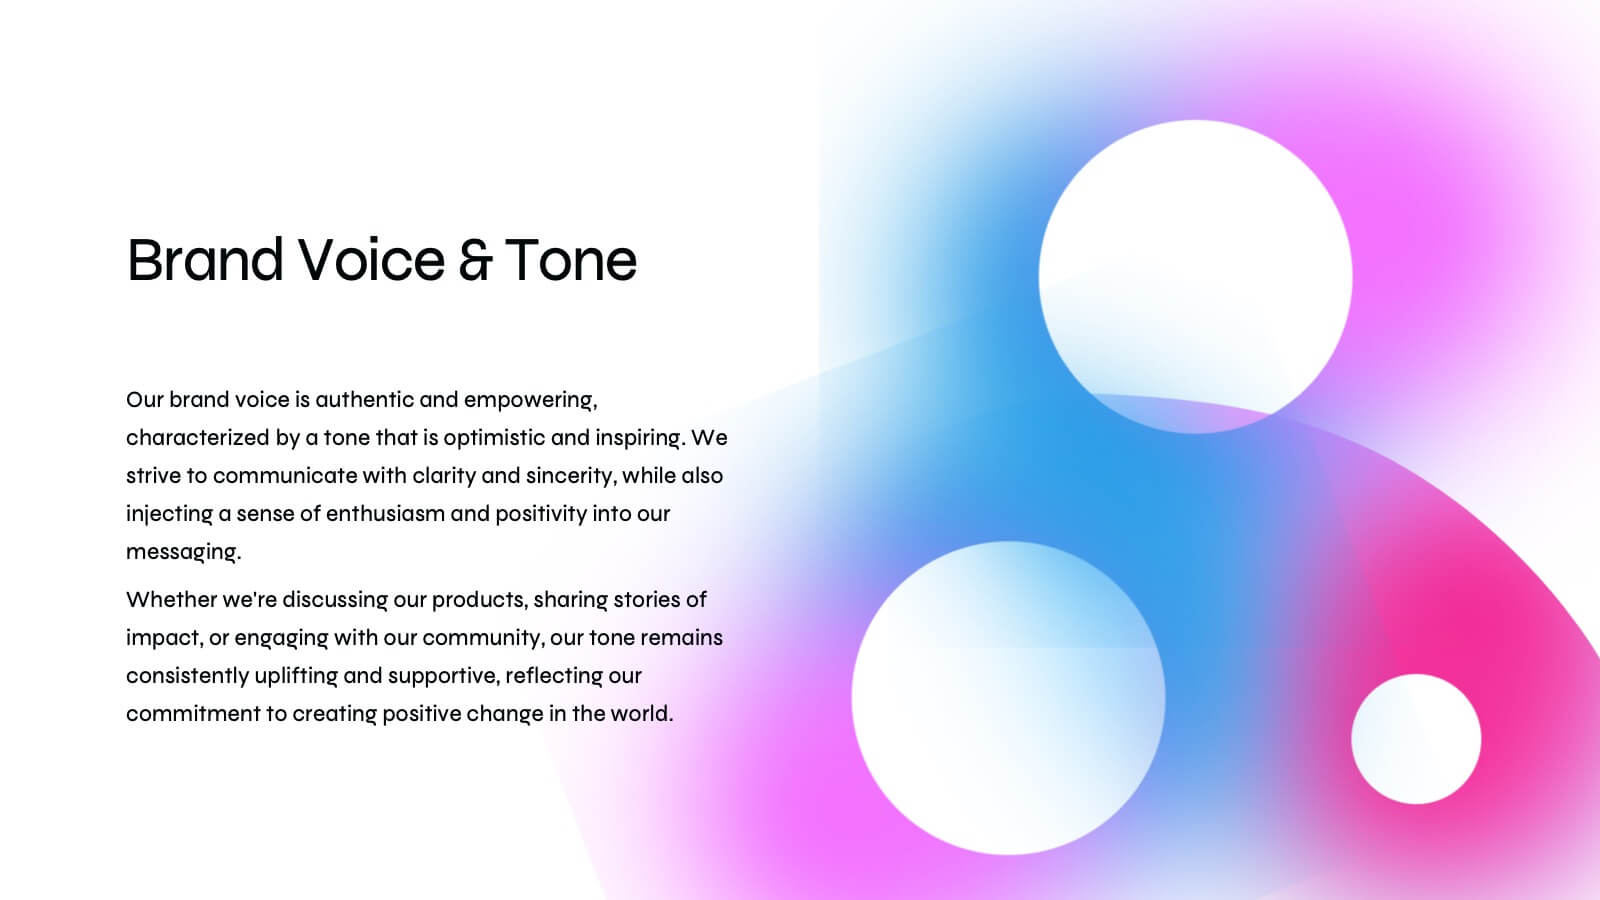
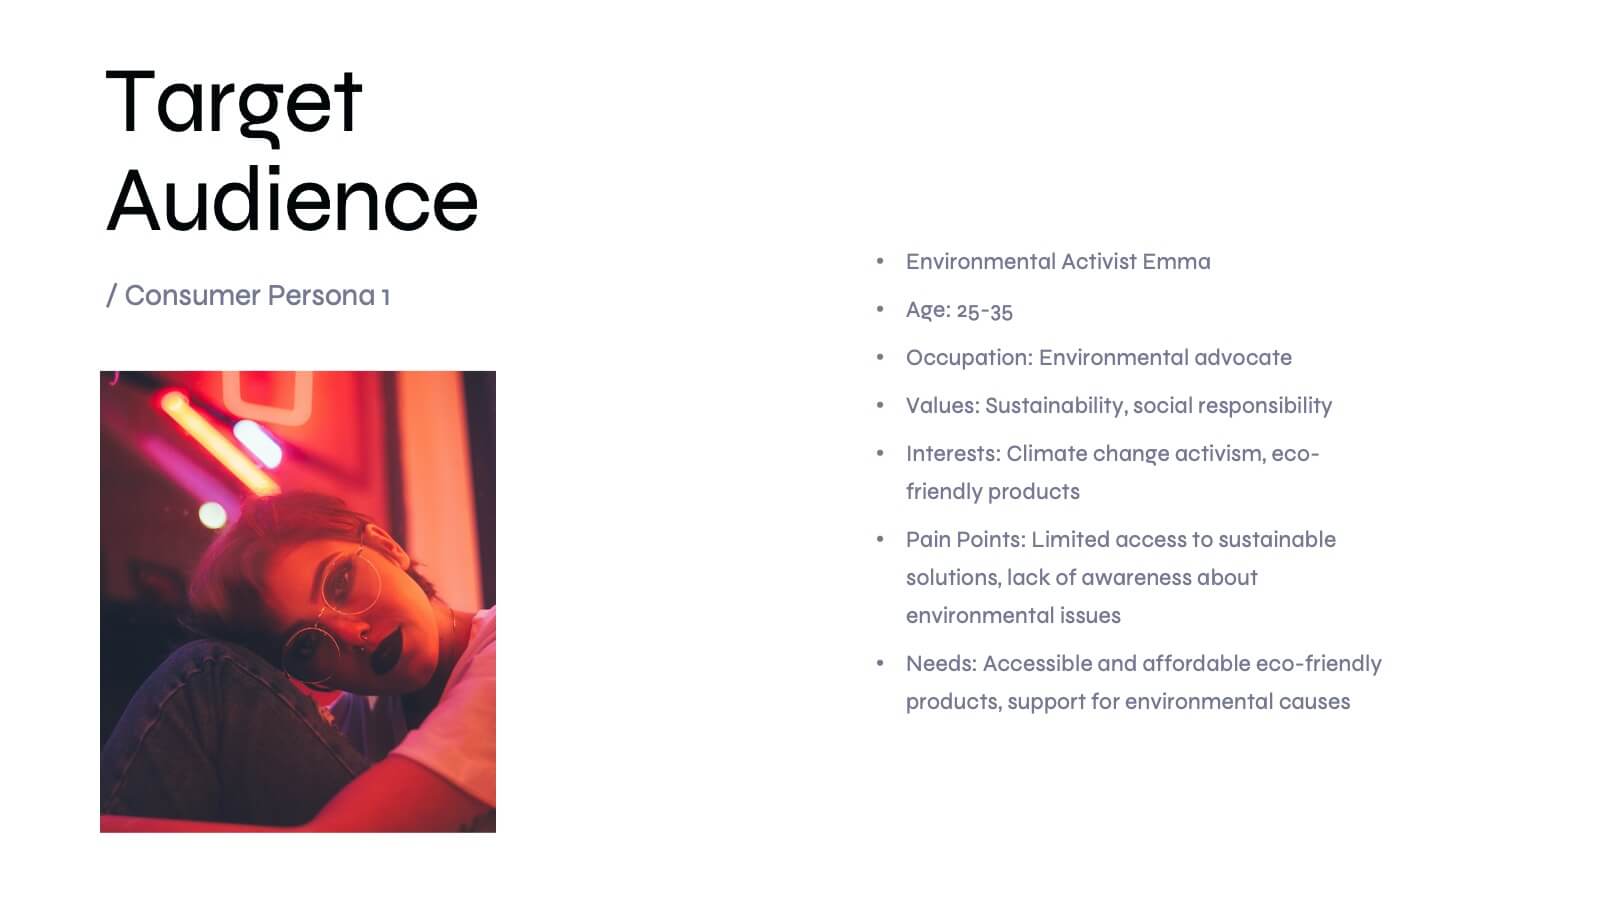
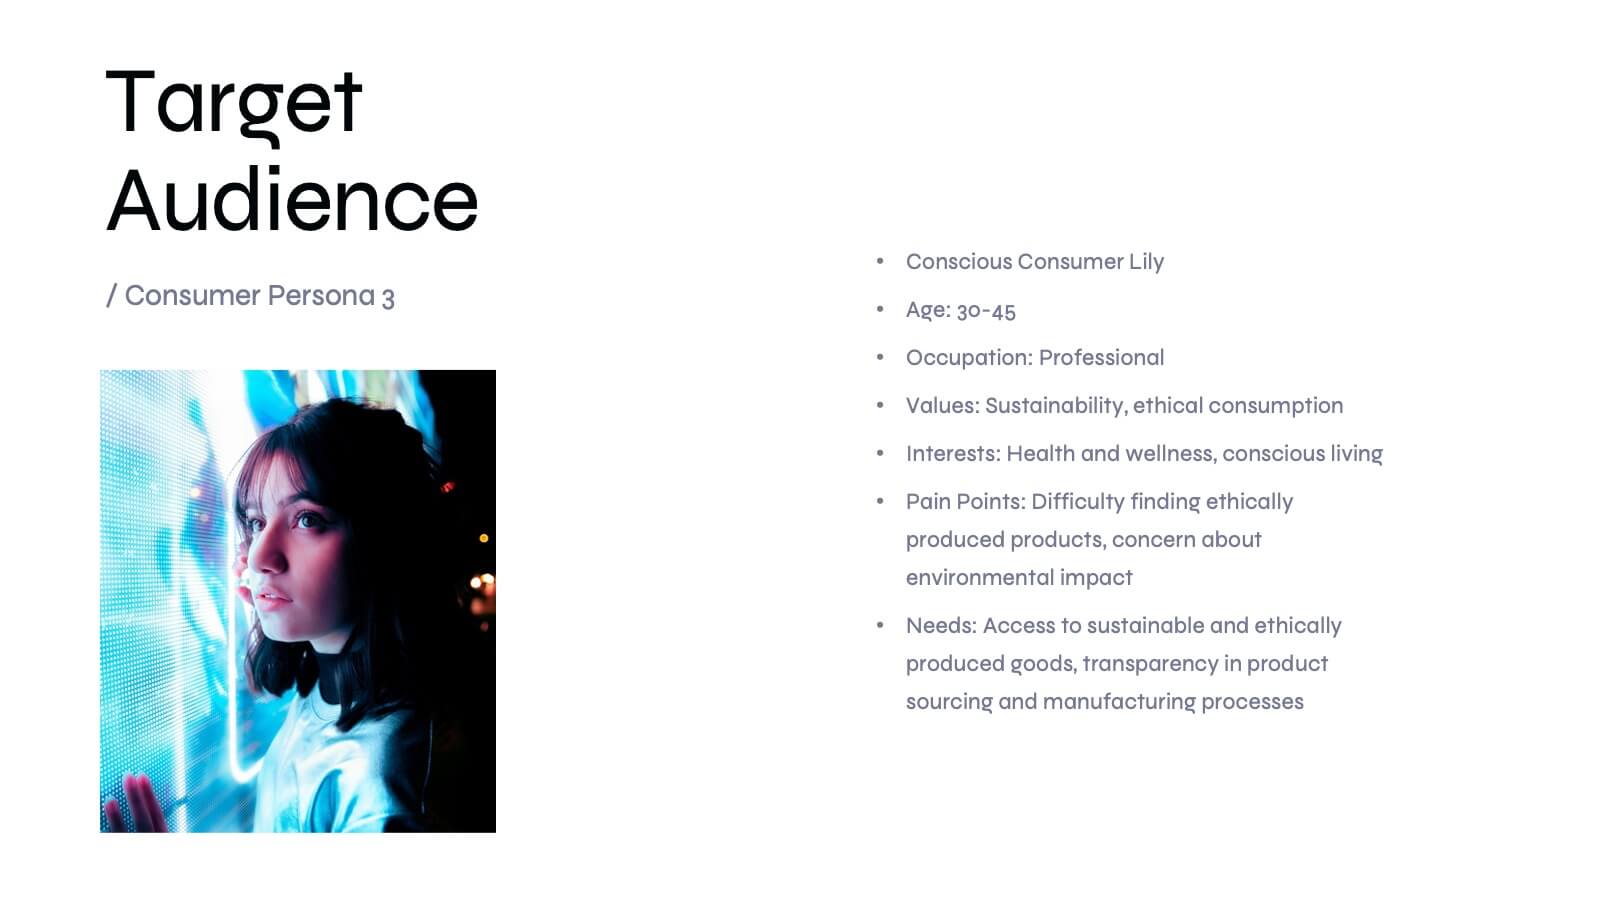
Basilisk Brand Guidelines Proposal Presentation
Present your brand strategy effectively with this modern brand guidelines proposal template! It includes sections for brand vision, values, identity, and market analysis. Fully customizable and compatible with PowerPoint, Keynote, and Google Slides, it’s perfect for showcasing your brand's identity and ensuring consistency across all platforms.


4 slides
Corporate Governance Structure Presentation
Build transparency and leadership clarity with this clean, layered presentation layout that visualizes company hierarchies and decision-making systems. Ideal for explaining organizational roles, responsibilities, and reporting flows, it simplifies complex structures into easy visuals. Fully editable and compatible with PowerPoint, Keynote, and Google Slides for professional, flexible use.


6 slides
Business Growth and Progress Metrics Presentation
Showcase milestones, trends, and business wins with this sleek bar chart and line graph combo. Designed to illustrate upward momentum, each slide highlights progress using a trophy peak icon, 5 key steps, and editable labels. Ideal for quarterly reviews, growth tracking, and strategic updates. Fully compatible with PowerPoint, Keynote, and Google Slides.


20 slides
Lullabyne Design Portfolio Presentation
Showcase your creative work with this modern and professional design portfolio presentation. Covering essential elements like design briefs, mood boards, prototypes, and implementation plans, this template helps you present your work with clarity and style. Fully customizable and available for PowerPoint, Keynote, and Google Slides.


12 slides
Banking Offers and Card Perks Overview Presentation
Showcase financial benefits clearly with this Banking Offers and Card Perks Overview Presentation. Designed with a bold payment terminal and card visual, this layout helps you highlight key rewards, cashback deals, and special cardholder perks. Ideal for banks, fintechs, and retail loyalty programs. Fully editable in PowerPoint, Keynote, and Google Slides.


5 slides
Problem-Solving and Risk Navigation Presentation
Navigate uncertainty with clarity using the Problem-Solving and Risk Navigation presentation. This slide features a winding, color-coded path that visually represents each step in a complex decision-making process—from initial analysis to final action. Each of the five stages is marked with an arrow and an icon for intuitive storytelling. Ideal for strategy meetings, risk management workshops, or project reviews. Fully editable in PowerPoint, Keynote, and Google Slides.


6 slides
Environmental Policy and Sustainability Plan Presentation
Bring your sustainability message to life with a visual that flows as smoothly as your plan. This infographic presentation template helps explain your environmental goals, action steps, and policy structure using a dynamic, easy-to-follow circular layout. Perfect for eco reports and green strategy briefs. Compatible with PowerPoint, Keynote, and Google Slides.


22 slides
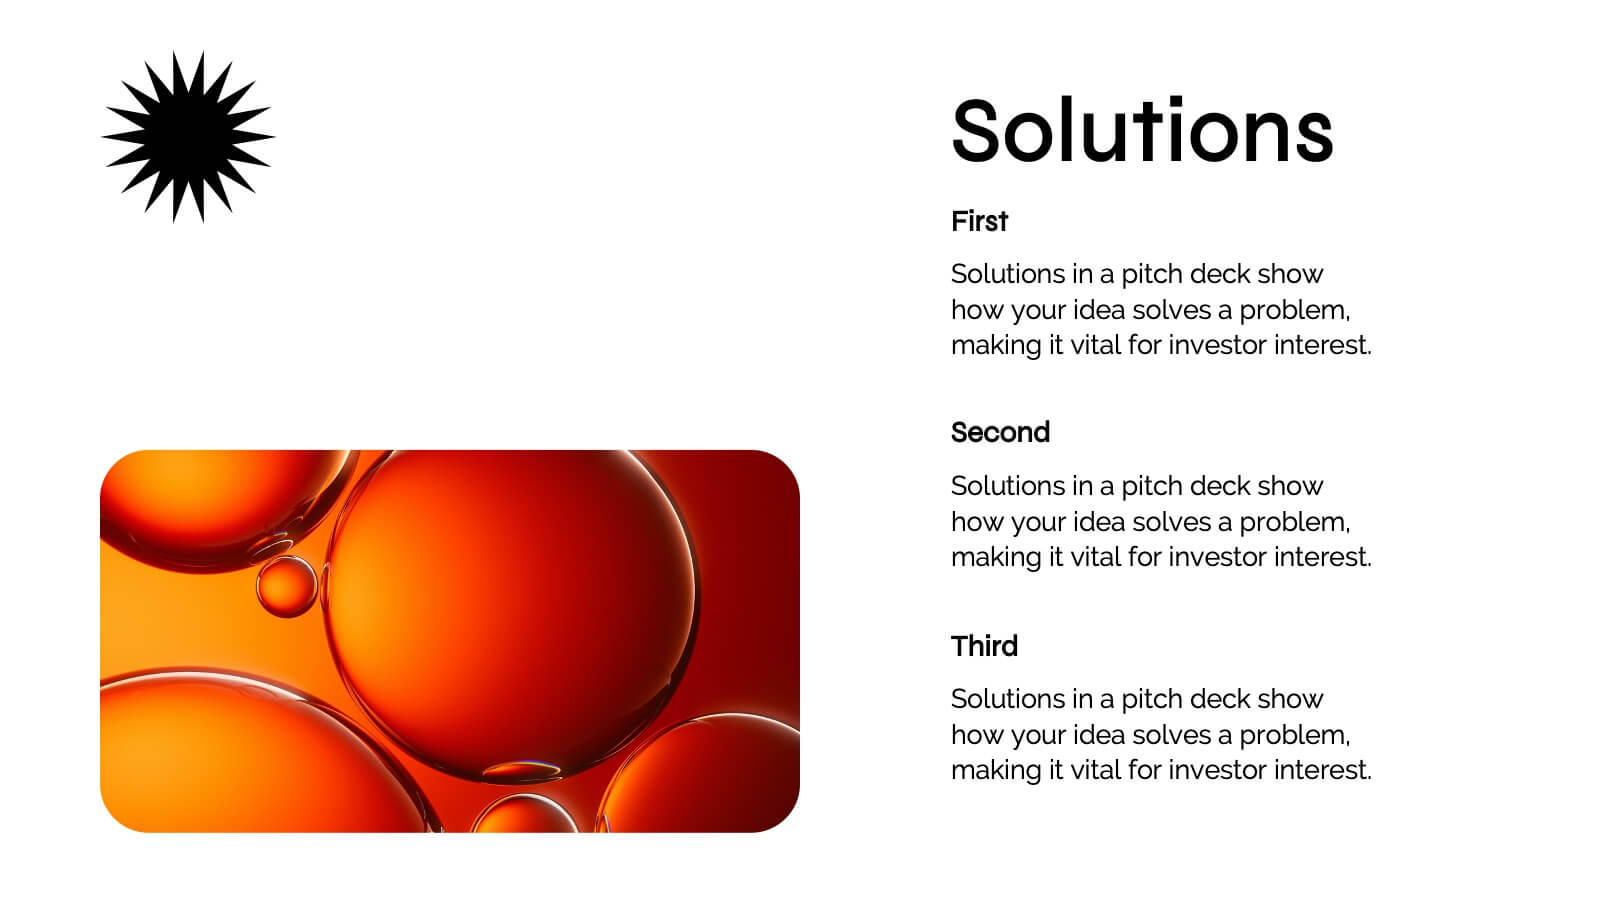
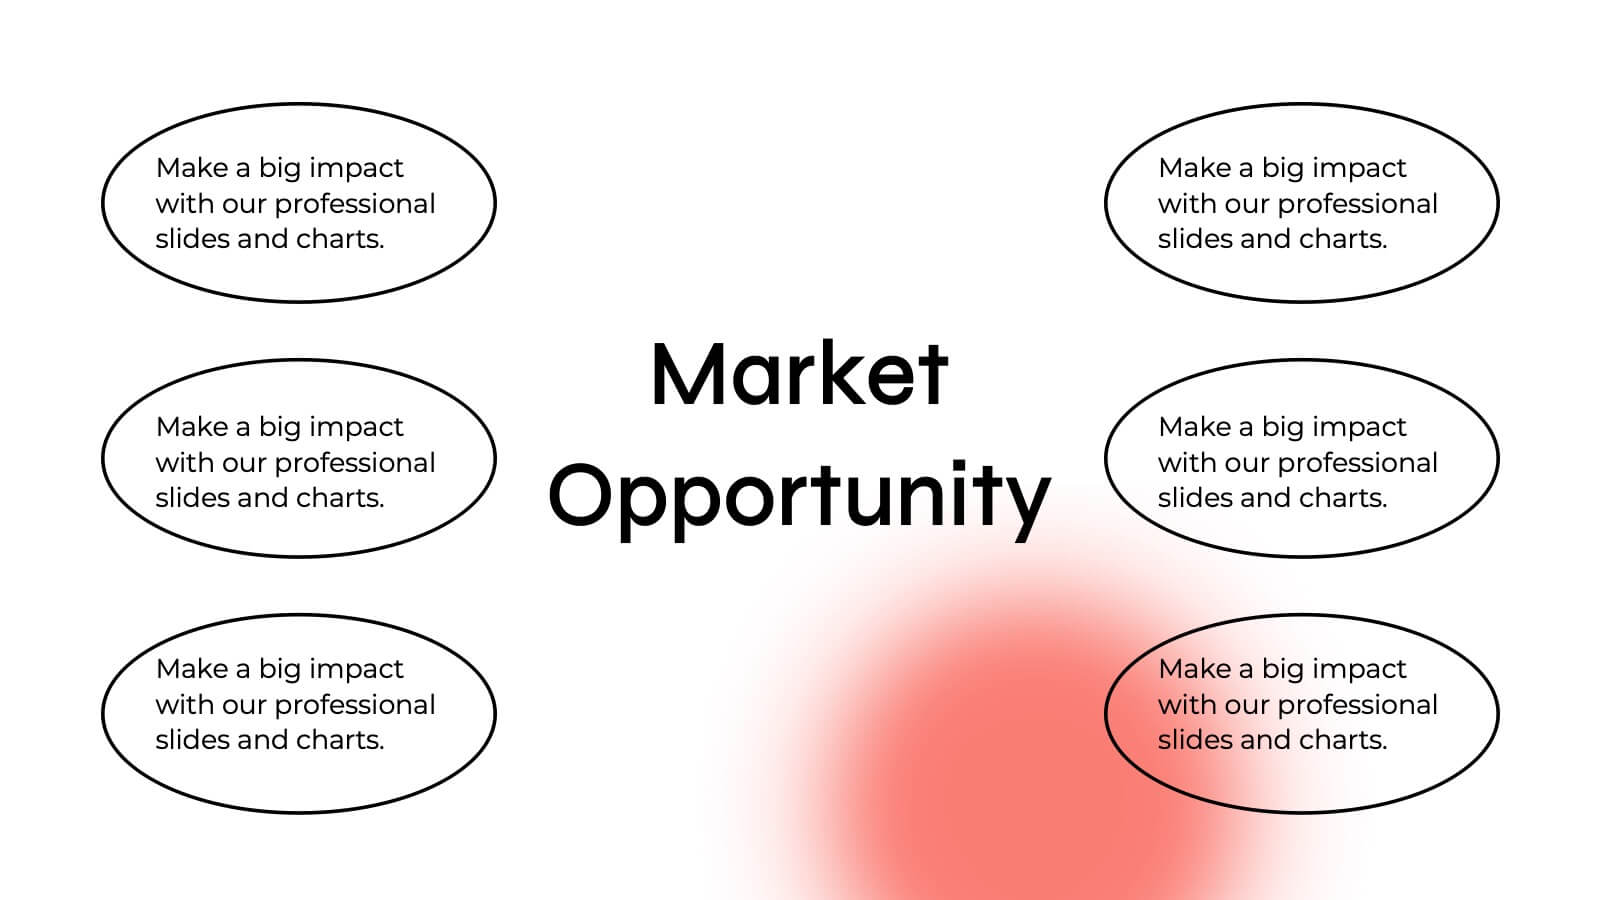
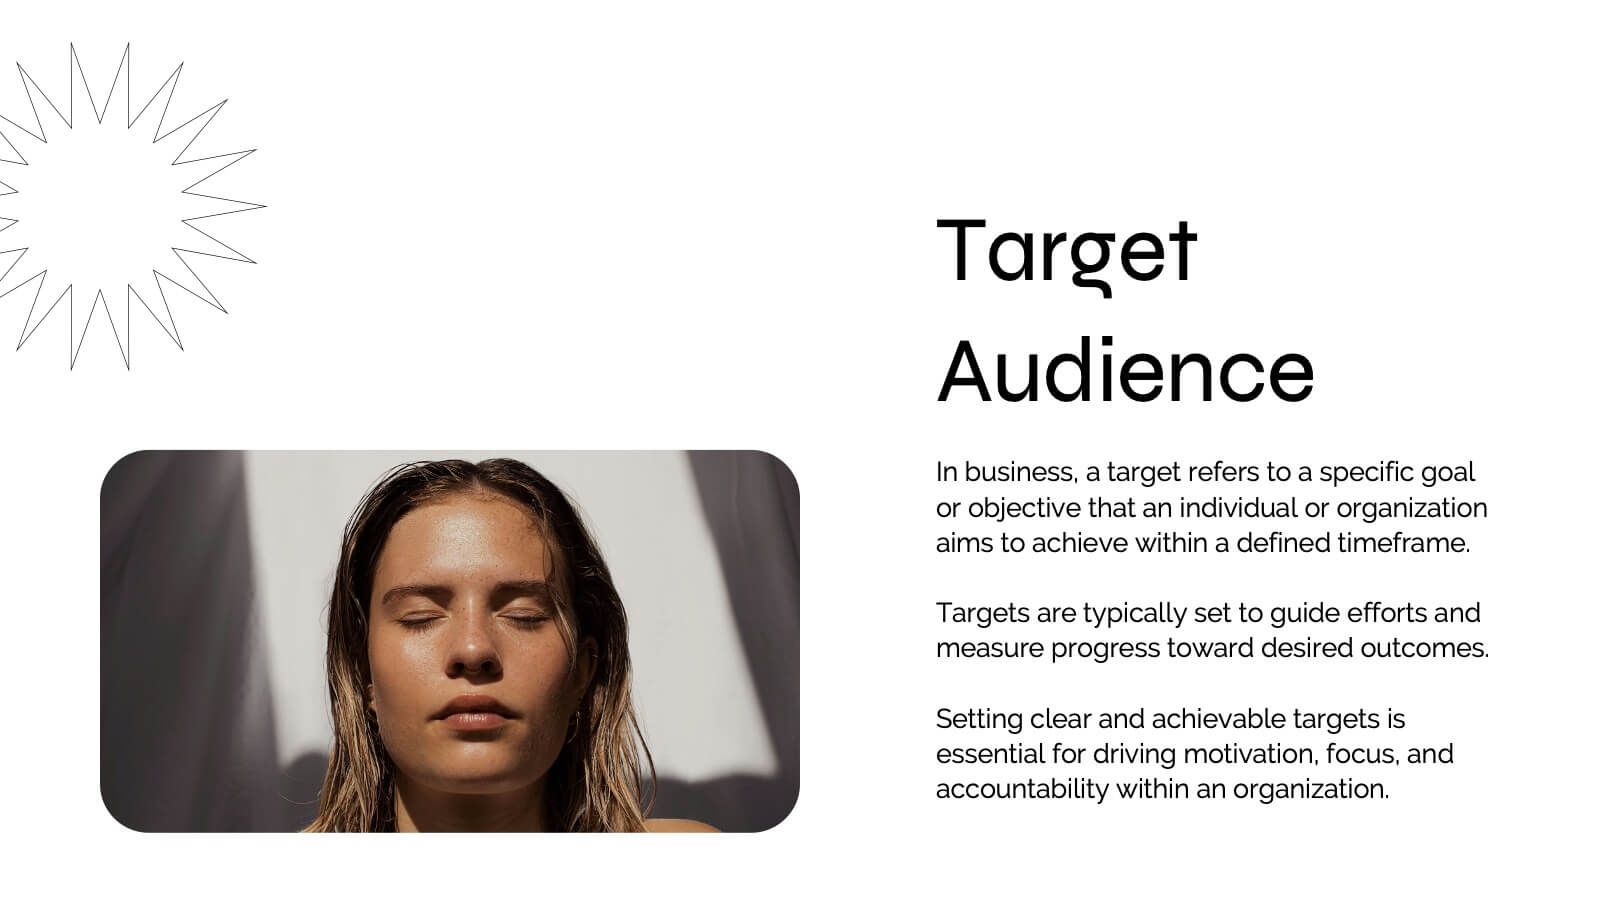
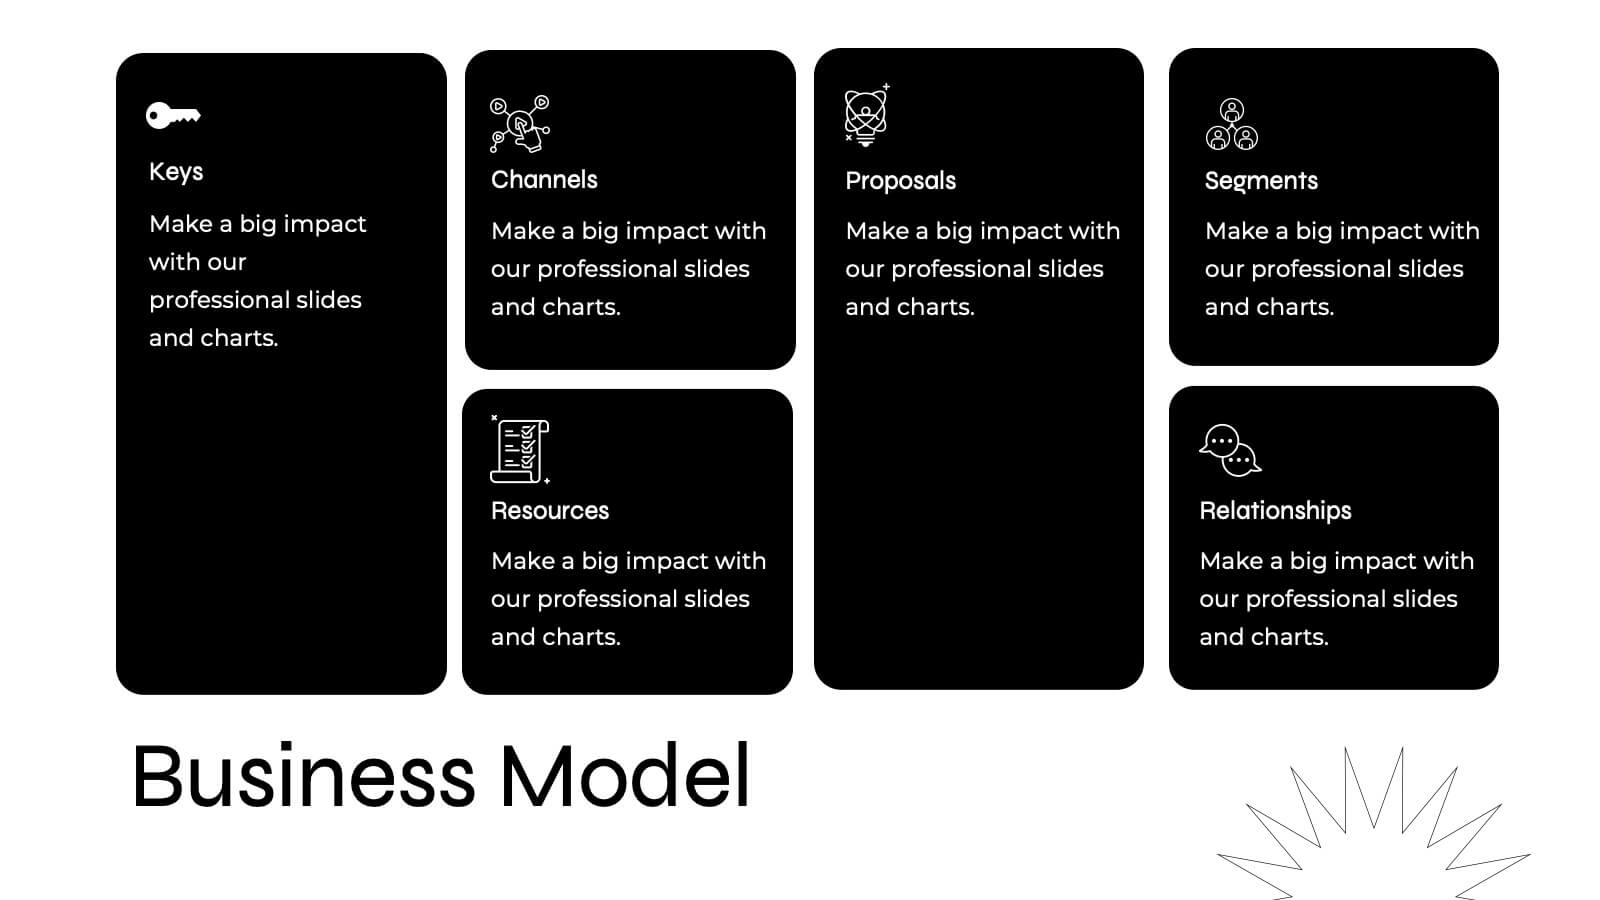
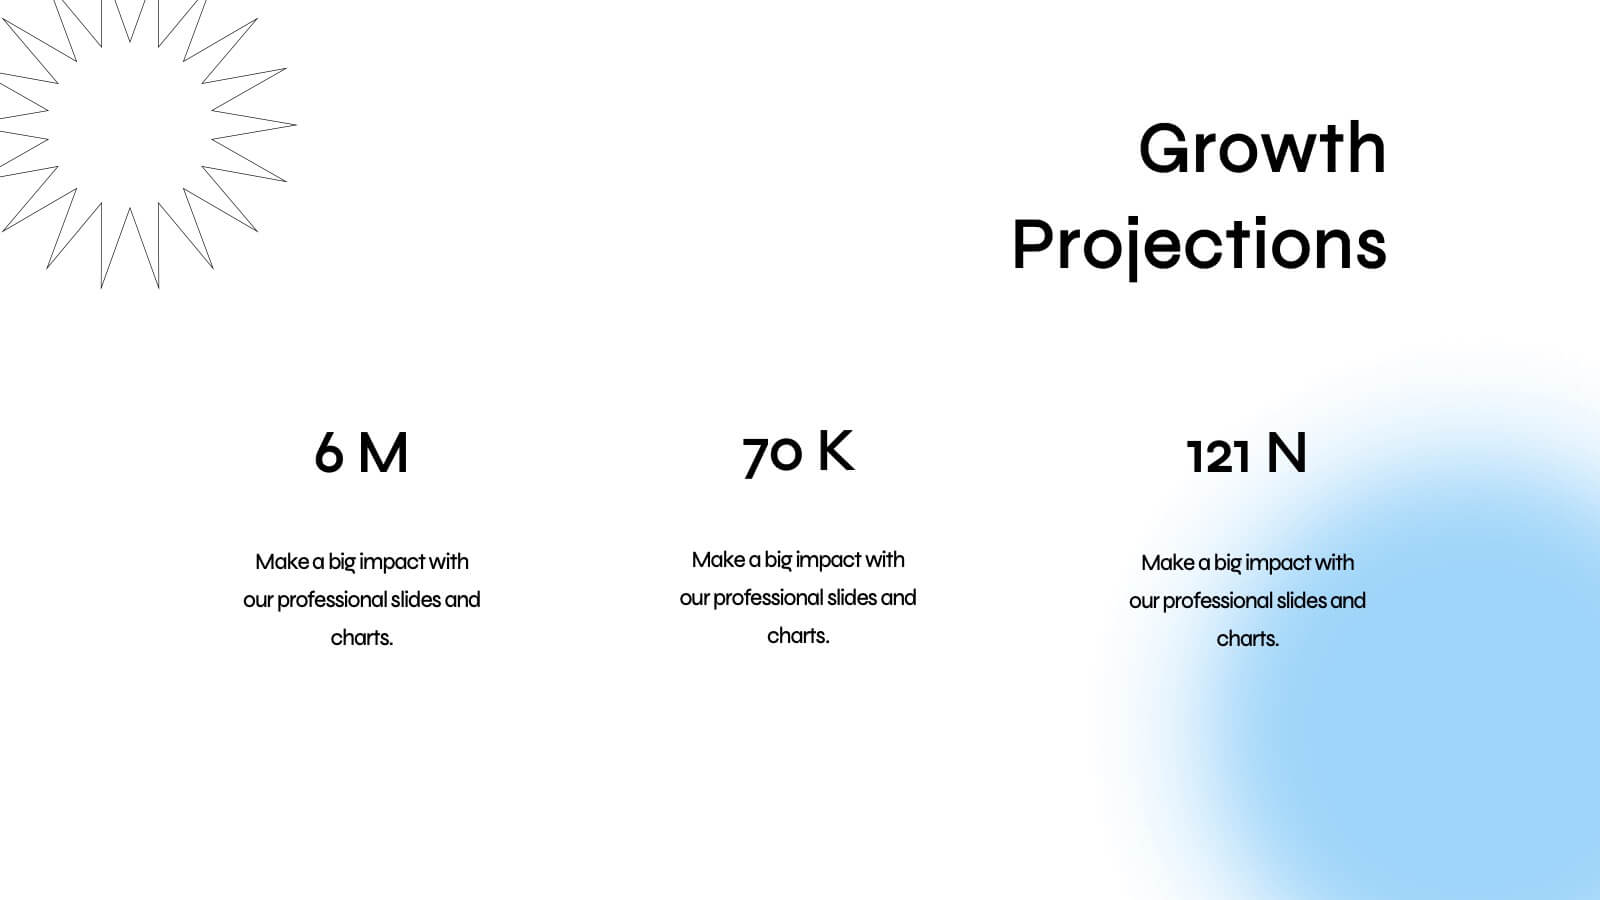
Quirinus Investor Pitch Presentation
Ready to impress investors and stakeholders? This sleek and modern pitch deck template covers all the essentials, from problem statements and market opportunities to revenue models and growth projections. Each slide is designed to convey clear and compelling information for maximum impact. Fully compatible with PowerPoint, Keynote, and Google Slides, making it the perfect tool for your next product launch!


6 slides
Travel Insurance Infographics
Our "Travel Insurance" infographic template, compatible with PowerPoint, Keynote, and Google Slides, is crafted for insurance companies, travel agencies, and financial advisors. This template is an excellent tool for explaining the benefits and details of travel insurance to clients and customers. The template comprehensively covers vital elements such as coverage options, emergency assistance services, and claim procedures. Its clear and organized layout makes it easy to convey complex insurance information in a manner that is both accessible and engaging. This is particularly useful for presentations aimed at educating travelers about the importance and benefits of travel insurance. Designed with a bright and inviting travel-themed color scheme, the template incorporates elements that reflect global travel and security. This not only makes the presentation visually appealing but also resonates with the theme of travel and protection. Whether used in client consultations, marketing materials, or informational workshops, this template ensures that the key aspects of travel insurance are presented clearly and attractively.


5 slides
Business Growth and Expansion
Visually communicate each stage of business development with this Business Growth and Expansion diagram. Featuring a dynamic circular flow, this editable slide is perfect for showcasing progress, scaling strategies, or roadmap milestones. Fully compatible with PowerPoint, Keynote, and Google Slides—ideal for business plans and strategic presentations.
4 slides
Objectives and Results Strategy Tracking Presentation
Track progress with clarity using the Objectives and Results Strategy Tracking Presentation. This sleek, minimalist layout helps visualize how each objective connects to measurable outcomes along a strategic path. Ideal for OKR reviews, quarterly goal updates, and performance check-ins. Fully customizable in PowerPoint, Canva, Keynote, and Google Slides.


5 slides
Risk Coverage and Claims Process Presentation
Visualize your risk levels and claims procedures with this Risk Coverage and Claims Process slide. The thermometer-style graphic clearly represents stages of coverage or escalation. Ideal for insurance, compliance, or legal teams. Fully editable and compatible with PowerPoint, Keynote, and Google Slides to match your branding and workflow needs.


6 slides
Office Scenes Season Infographic
"Office Scenes" typically refer to the environments and activities that take place within an office setting. This Infographic template is a visual representation that showcases different scenarios and activities that commonly take place in an office environment. This type of infographic can be used to illustrate various aspects of office life, work culture, and interactions. This template provide insights into the day-to-day activities and culture of your workplace. Fully customizable and compatible with Powerpoint, Keynote, and Google Slides. Include your company logo or branding elements in the infographic.


4 slides
Agricultural Market Trends Presentation
Highlight industry insights with this Agricultural Market Trends presentation template, featuring tractor and landscape graphics for a modern, rural-inspired look. Perfect for market reports, crop production analysis, or agribusiness proposals. Fully editable in Canva, PowerPoint, and Google Slides, allowing you to customize icons, text, and colors to match your brand.


6 slides
World Market Presence and Expansion Map Presentation
Showcase your company’s global footprint with this World Market Presence and Expansion Map. Visually highlight key regions, market activity, or strategic territories. Perfect for investor decks, global overviews, or international growth strategies. Fully editable in PowerPoint, Keynote, and Google Slides for seamless integration into your professional presentation workflow.


12 slides
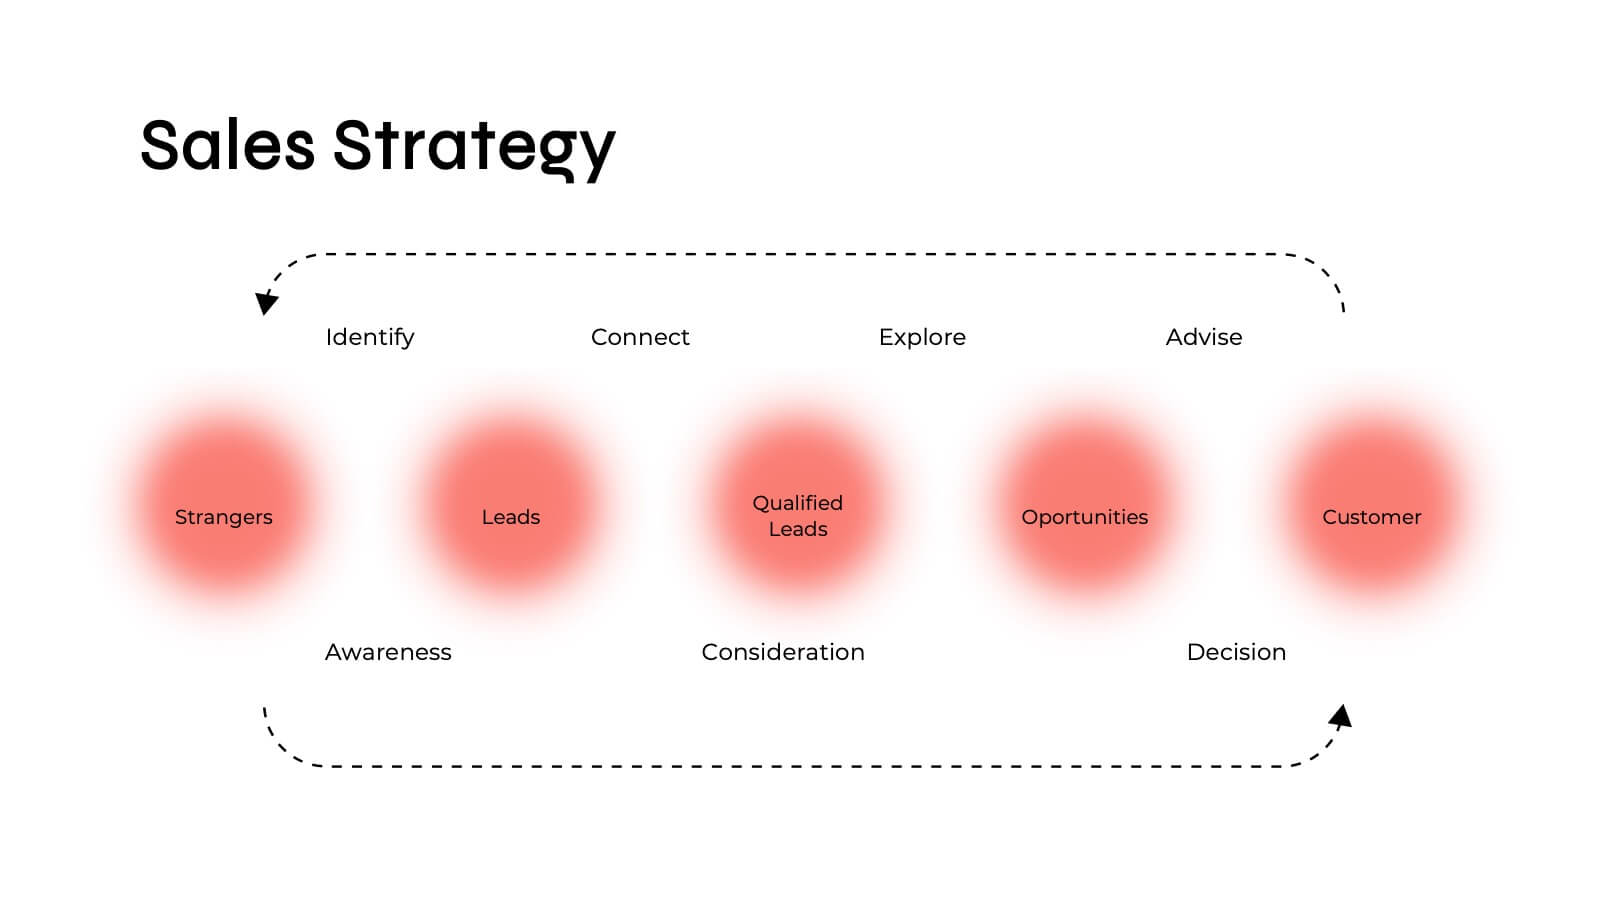
5-Step Growth Strategy Presentation
Map out your success with this 5-step growth strategy template. Designed for business professionals, this layout simplifies complex strategies into clear, actionable steps, guiding teams through each stage of expansion. Ideal for strategic planning, goal setting, and performance tracking. Fully customizable and compatible with PowerPoint, Keynote, and Google Slides.