


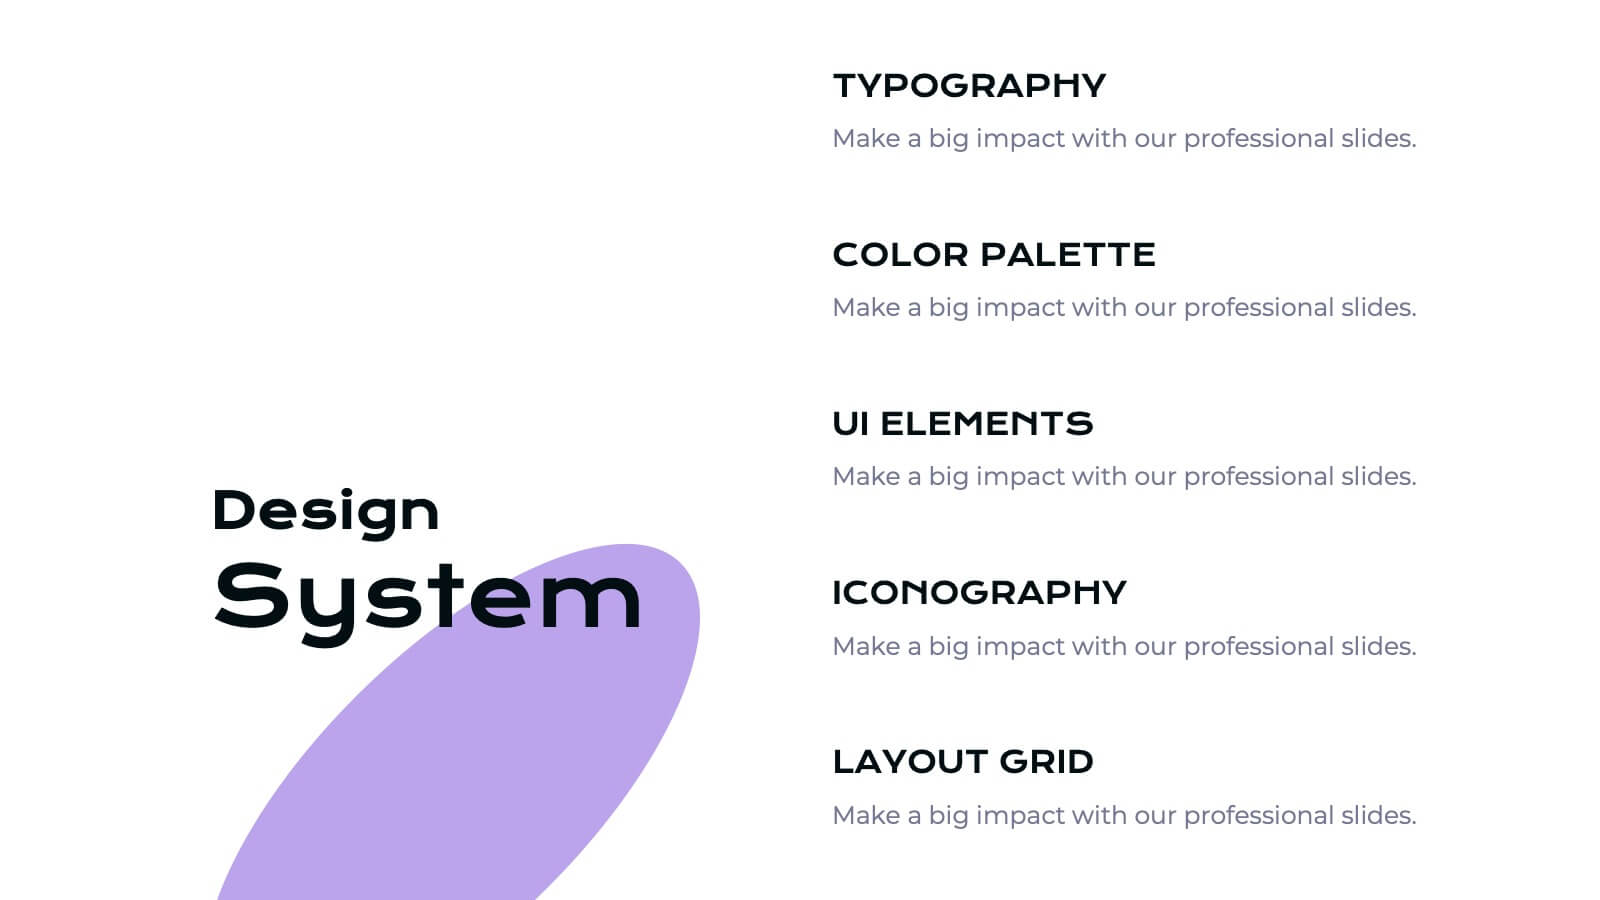
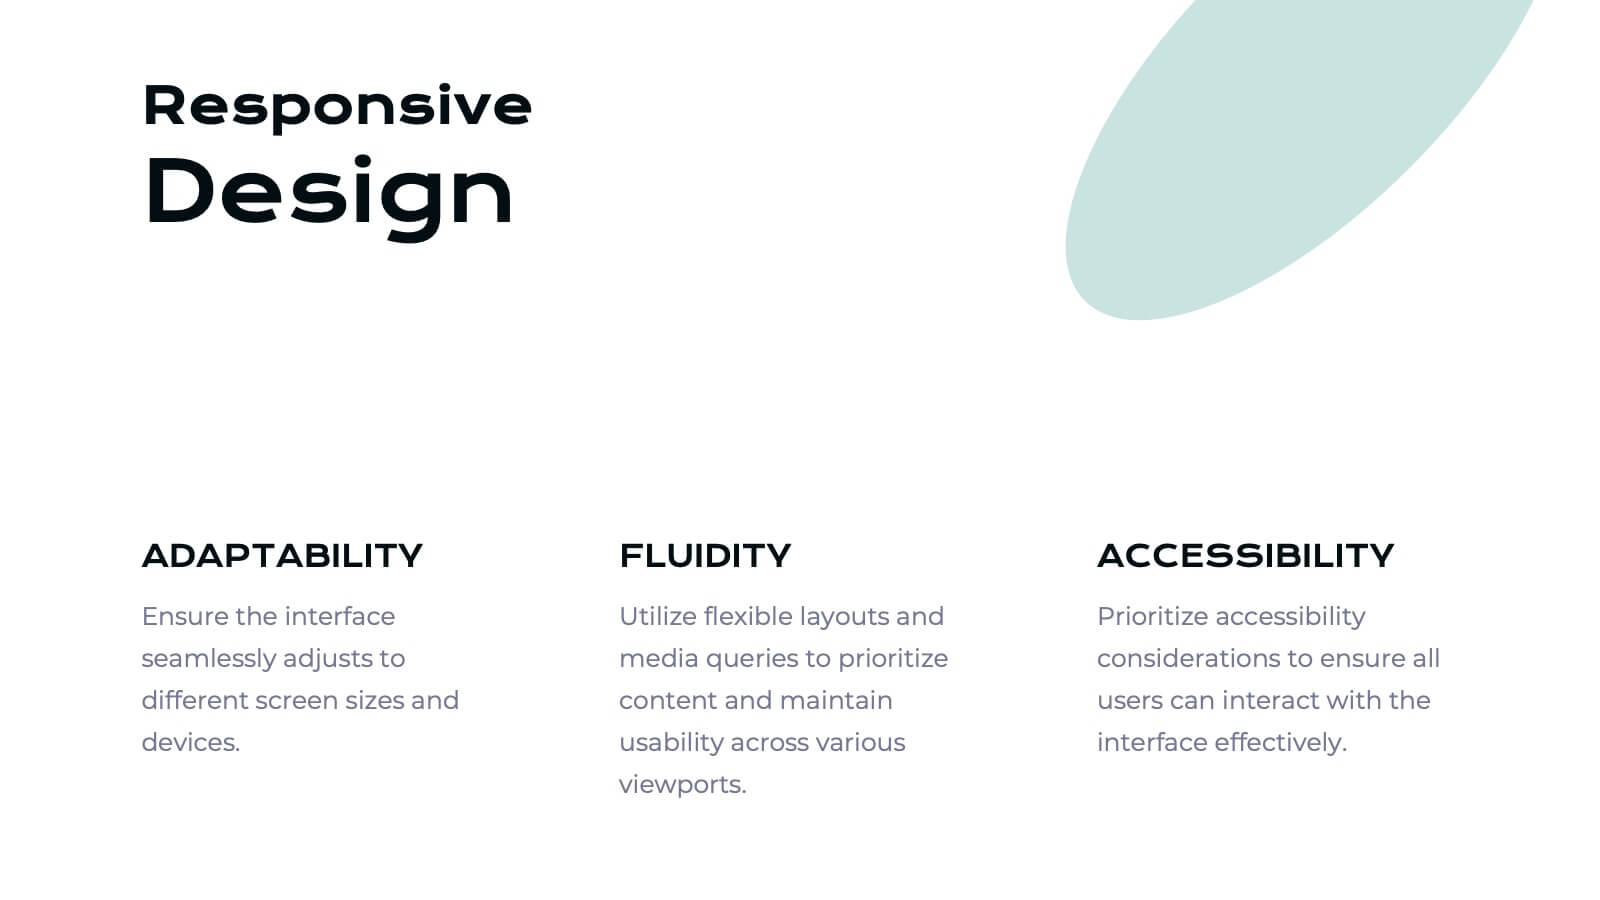
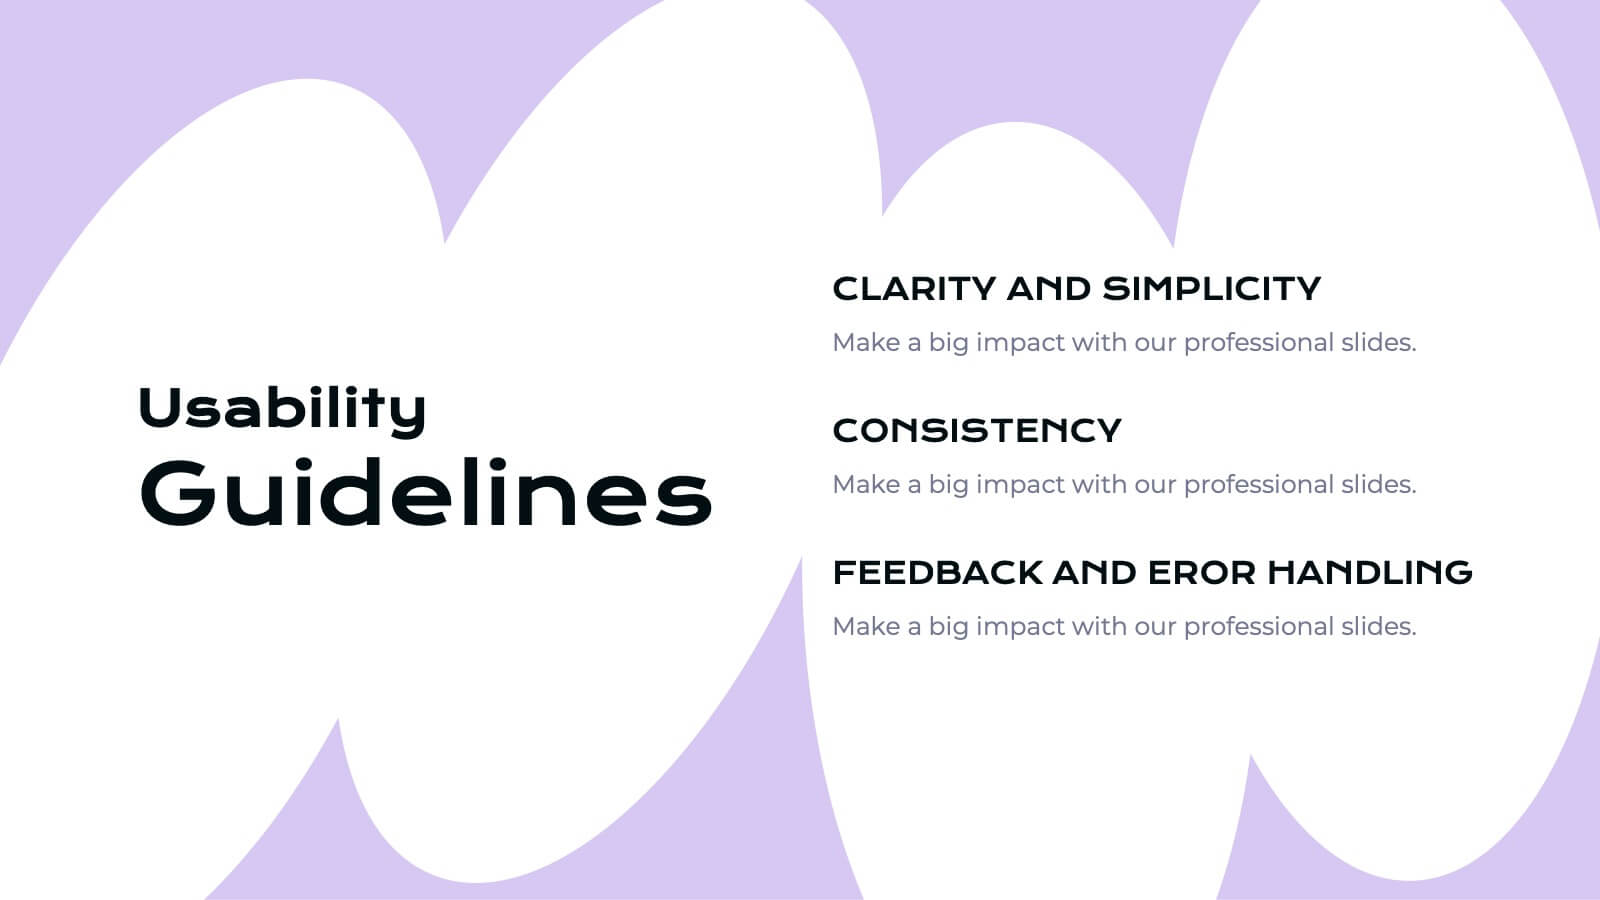
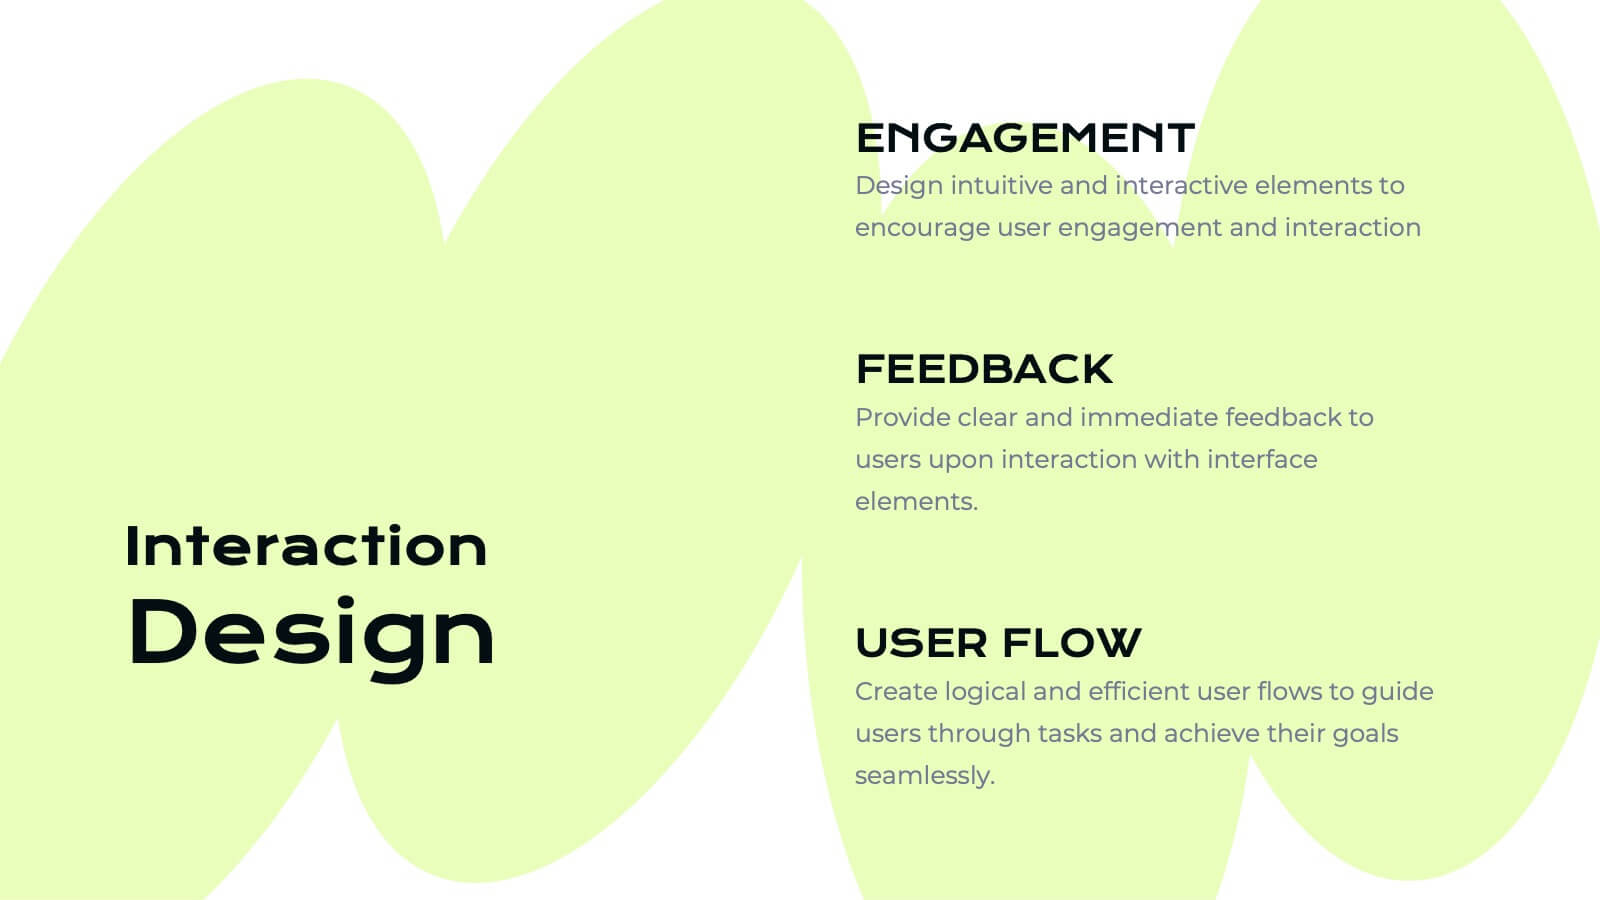
Features
- 4 Unique slides
- Fully editable and easy to edit in Microsoft Powerpoint, Keynote and Google Slides
- 16:9 widescreen layout
- Clean and professional designs
- Export to JPG, PDF or send by email


Do you have any questions?
Recommend


20 slides
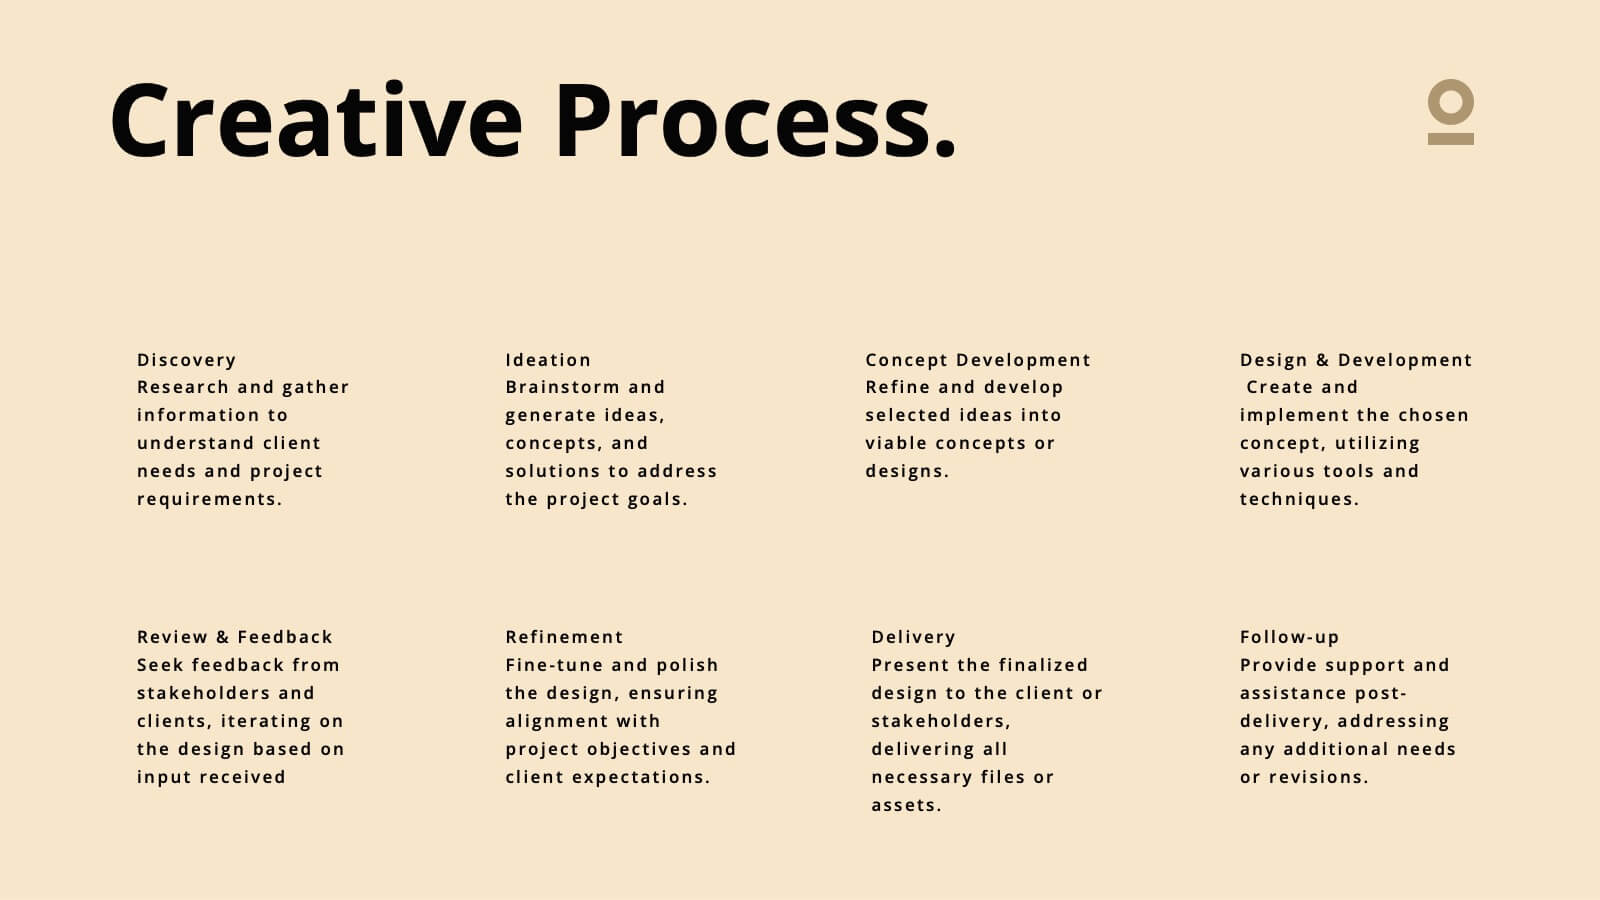
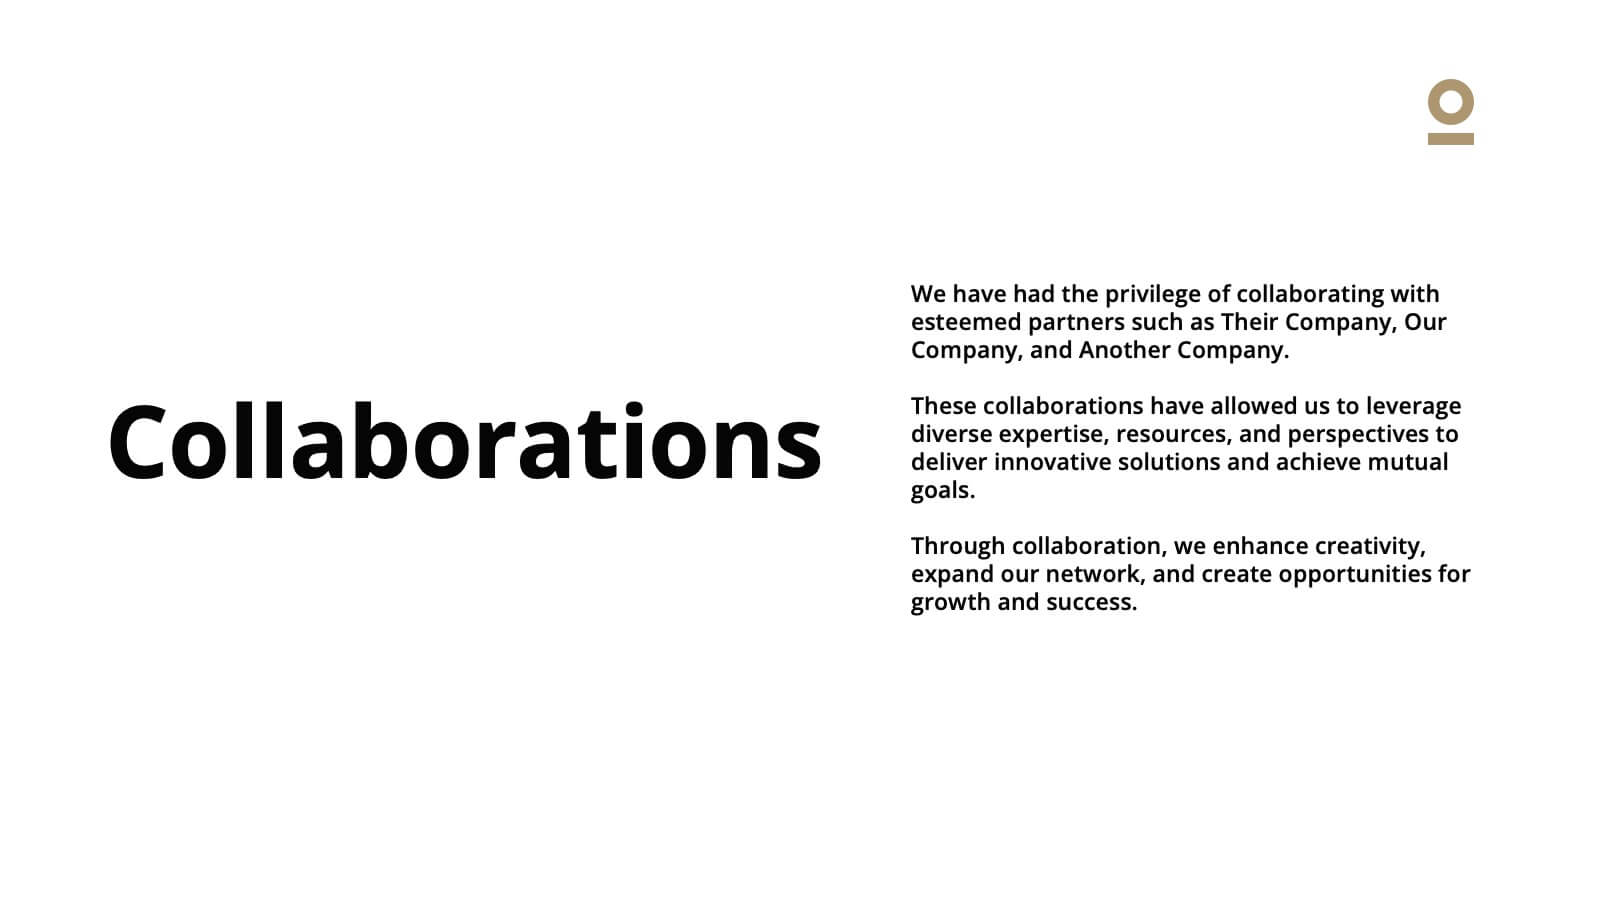
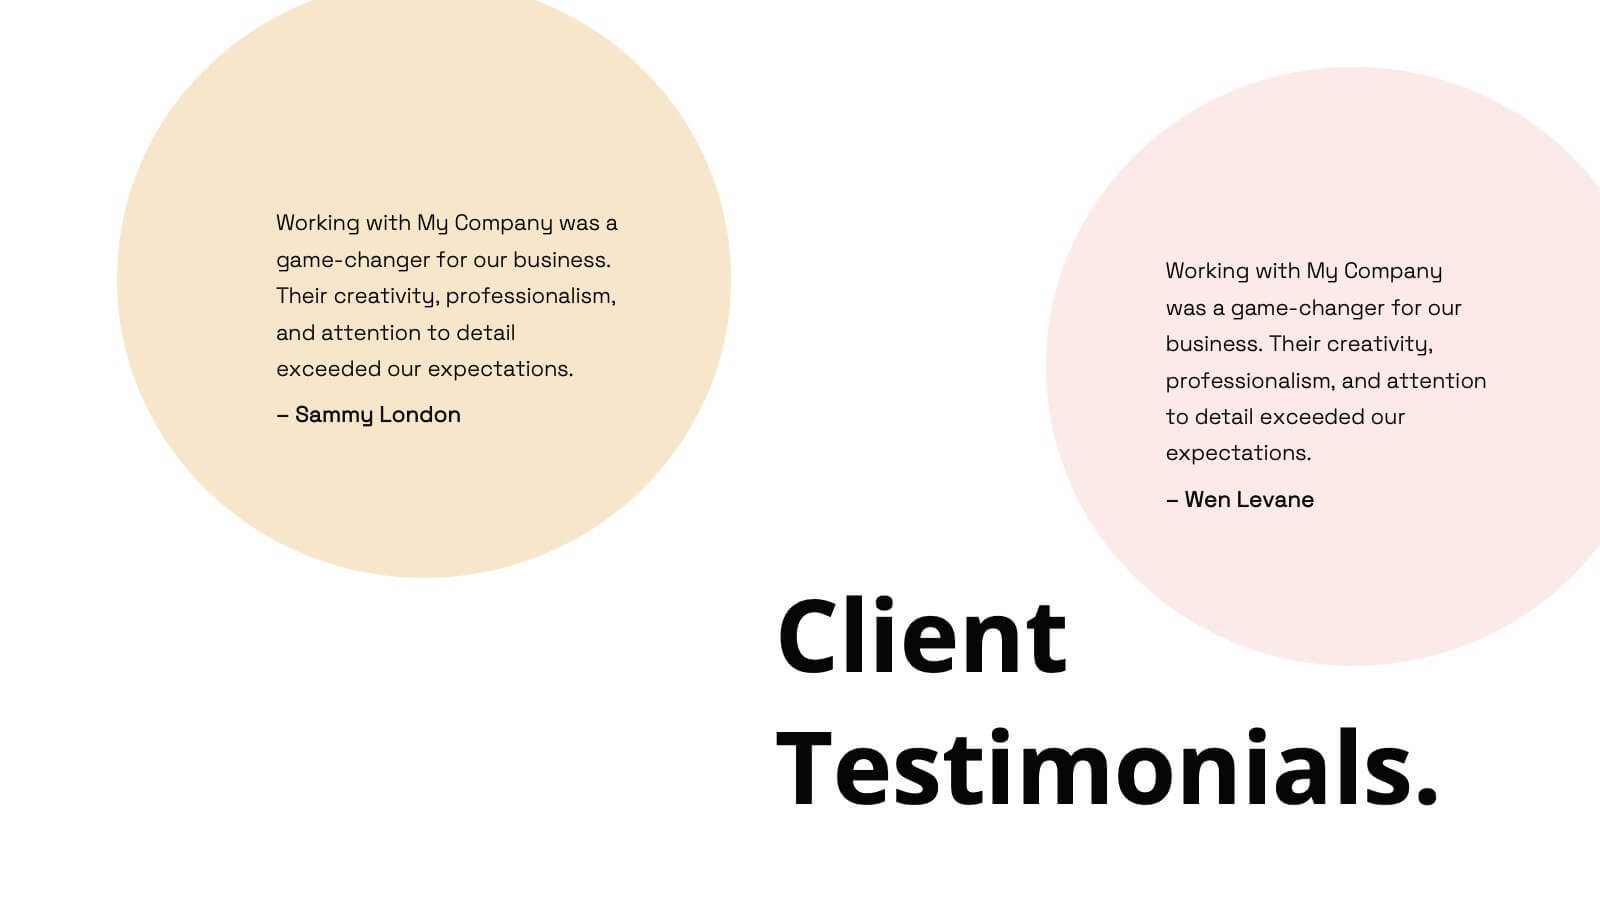
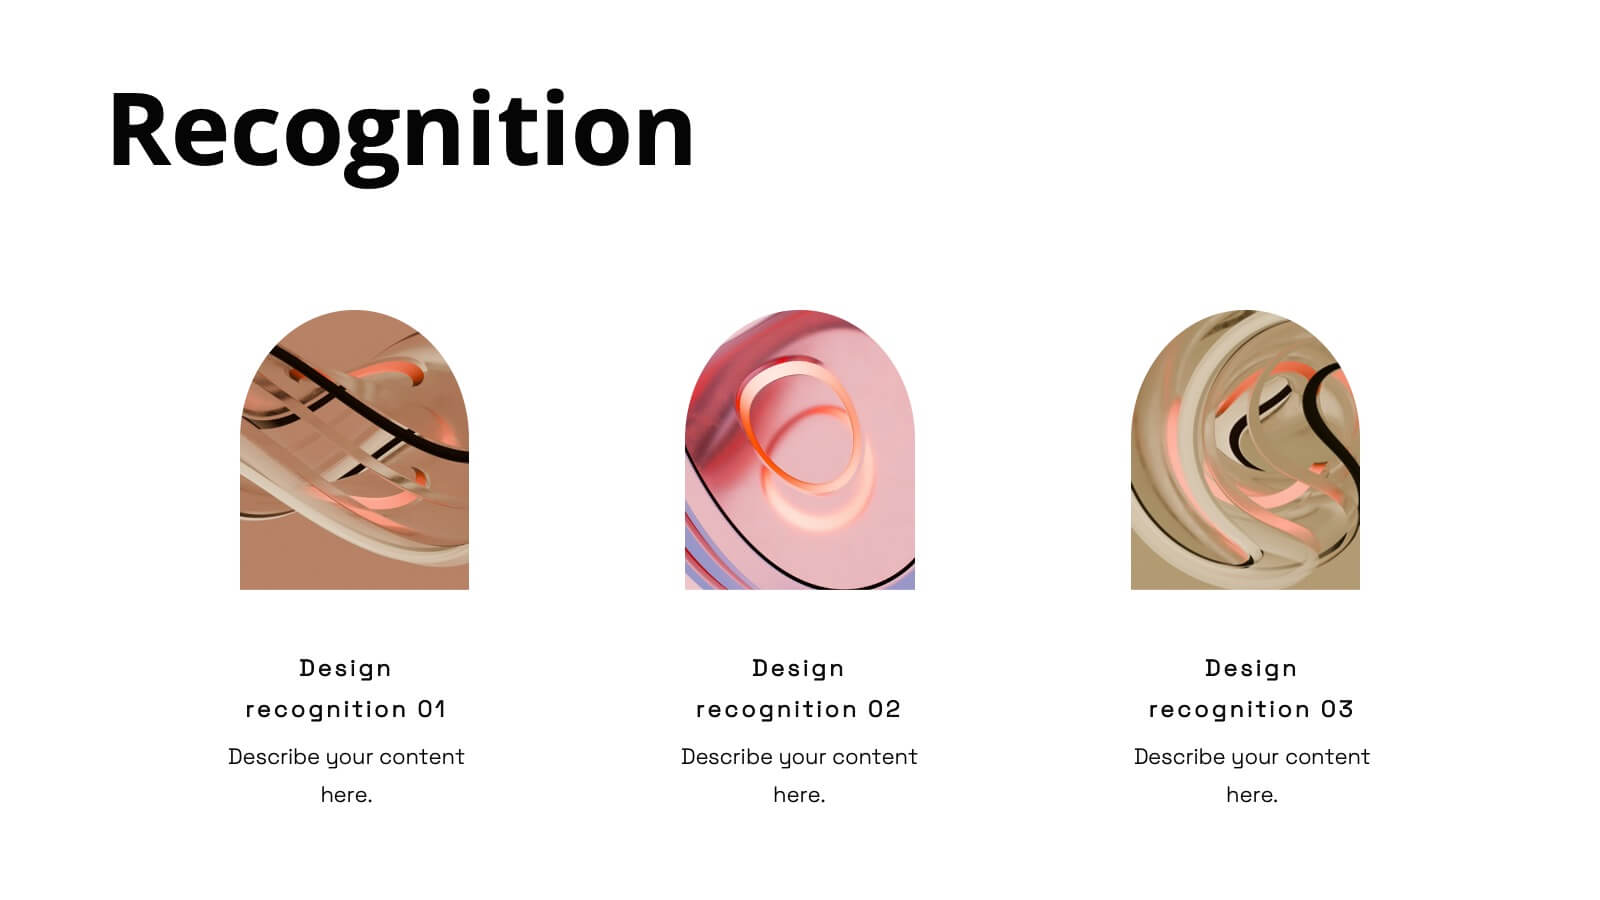
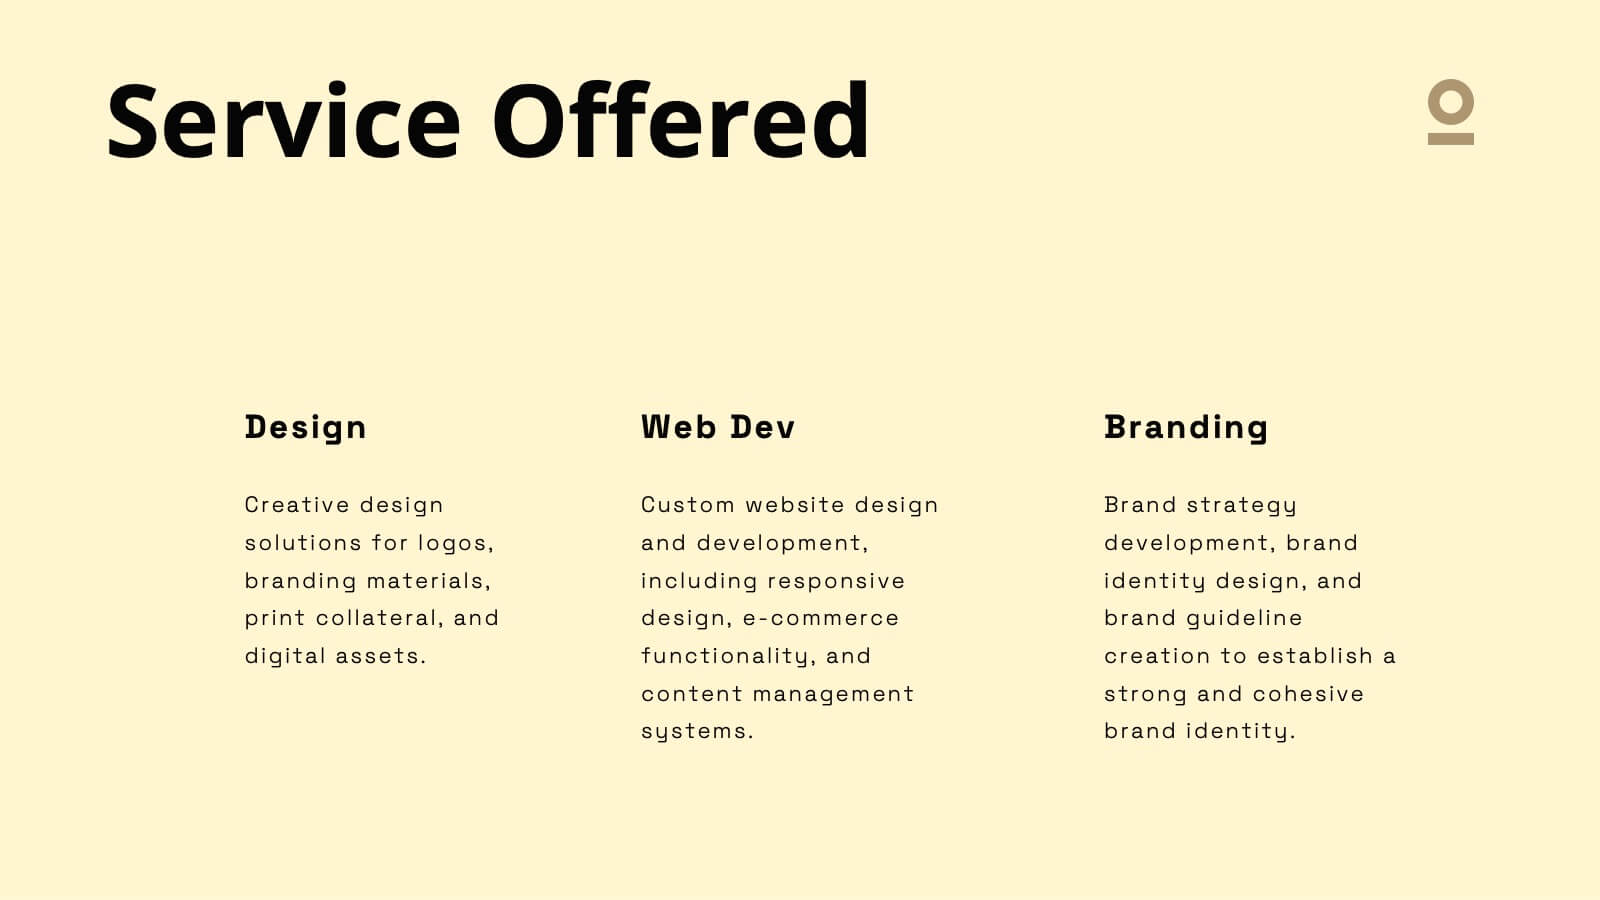
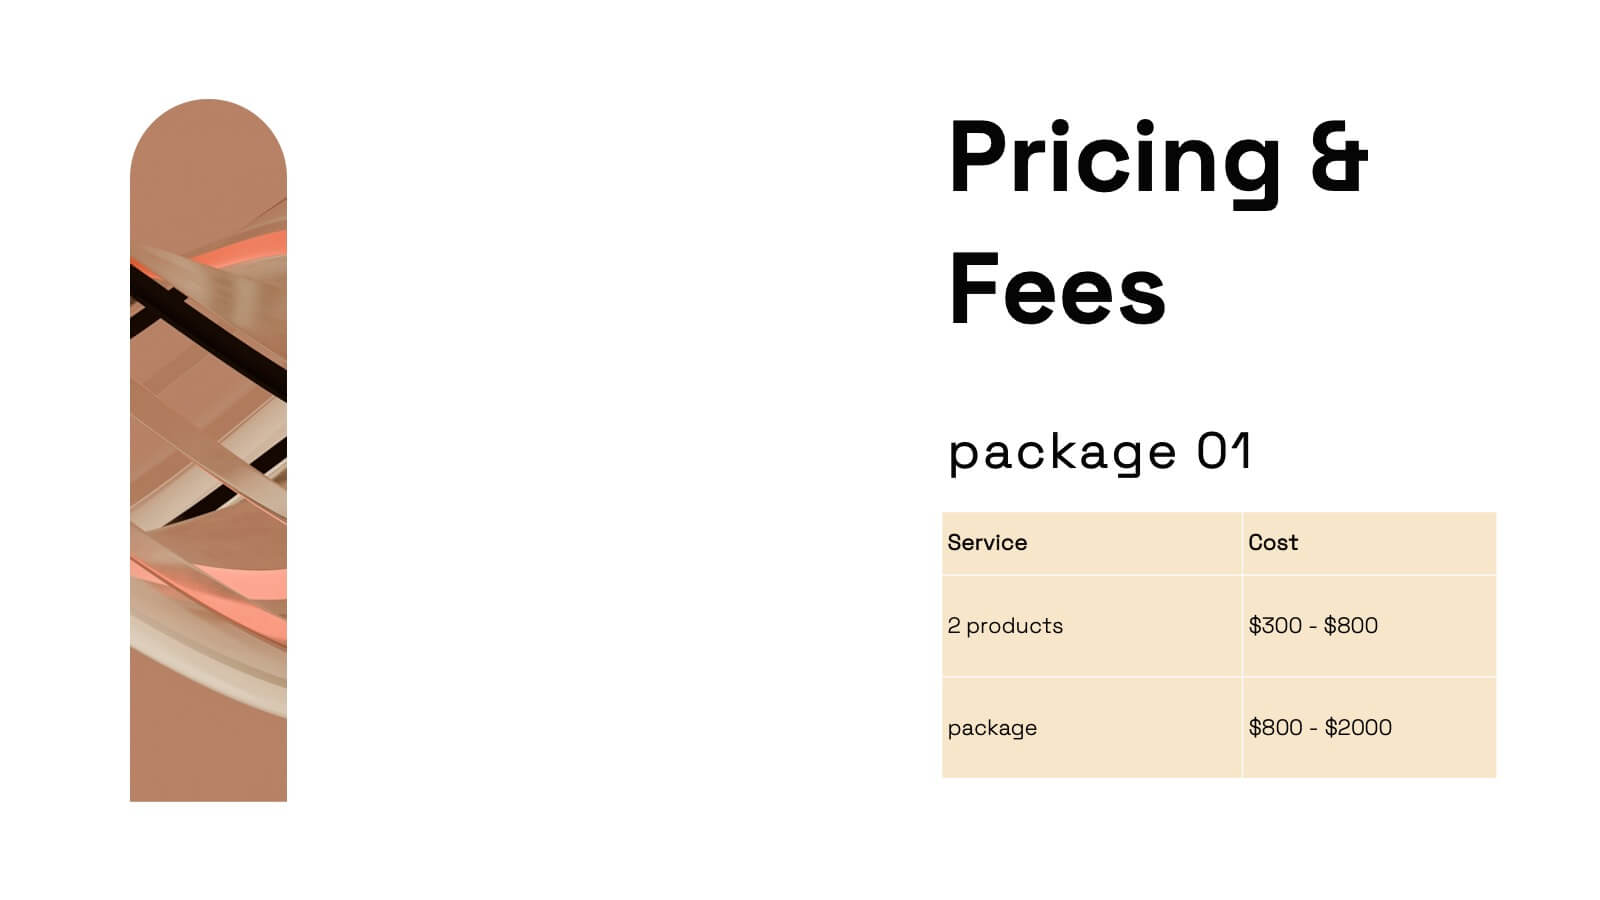
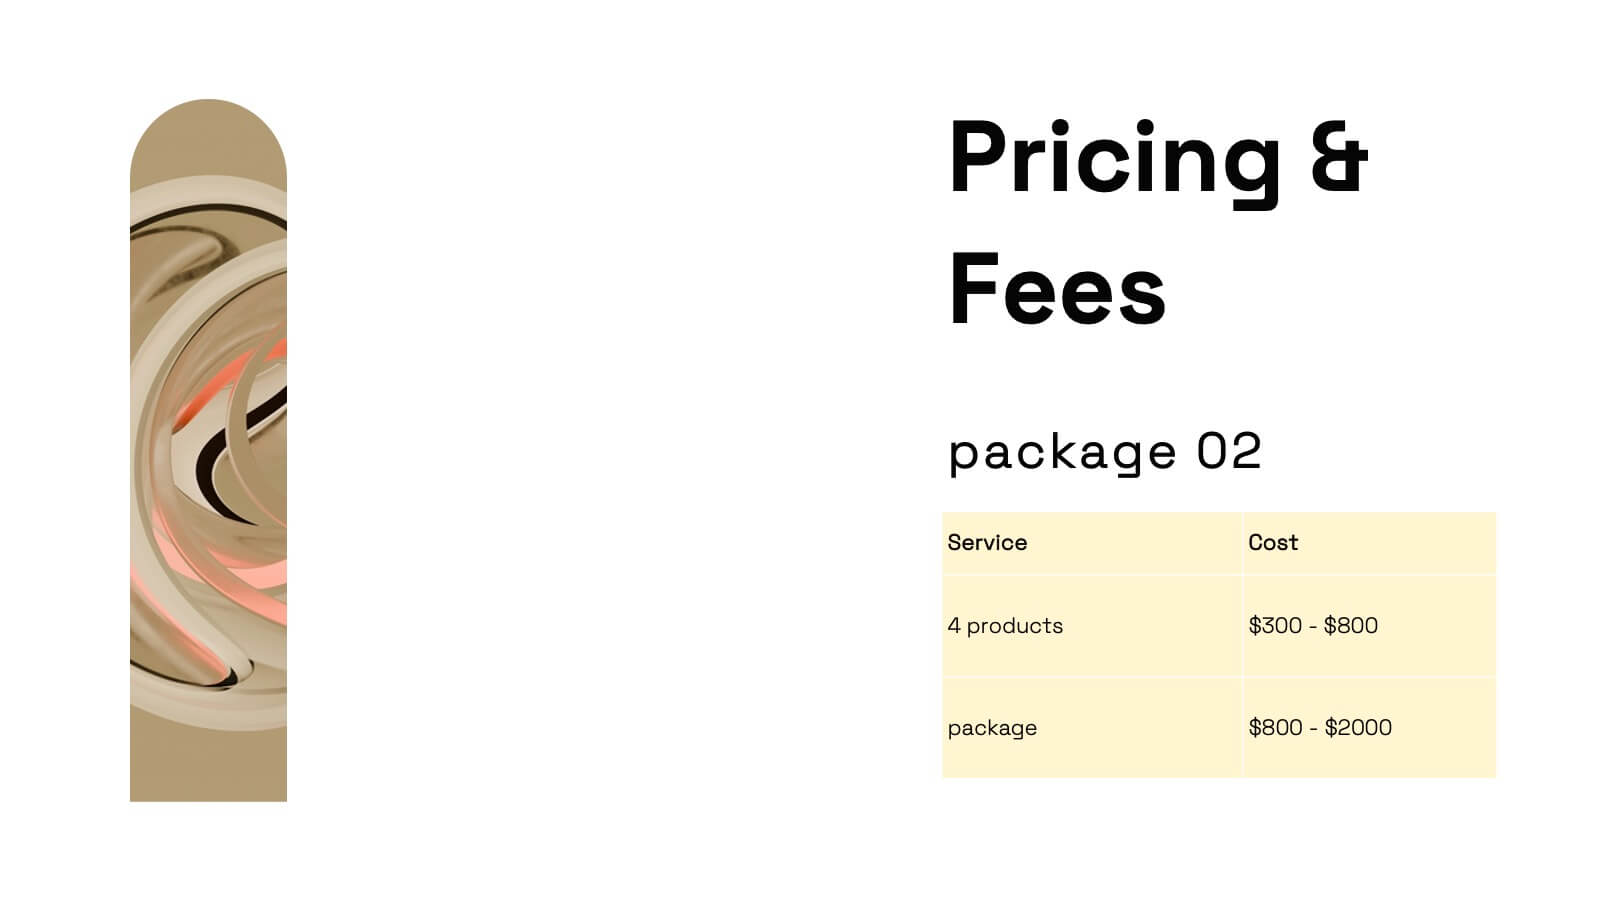
Axisflare Artist Portfolio Presentation
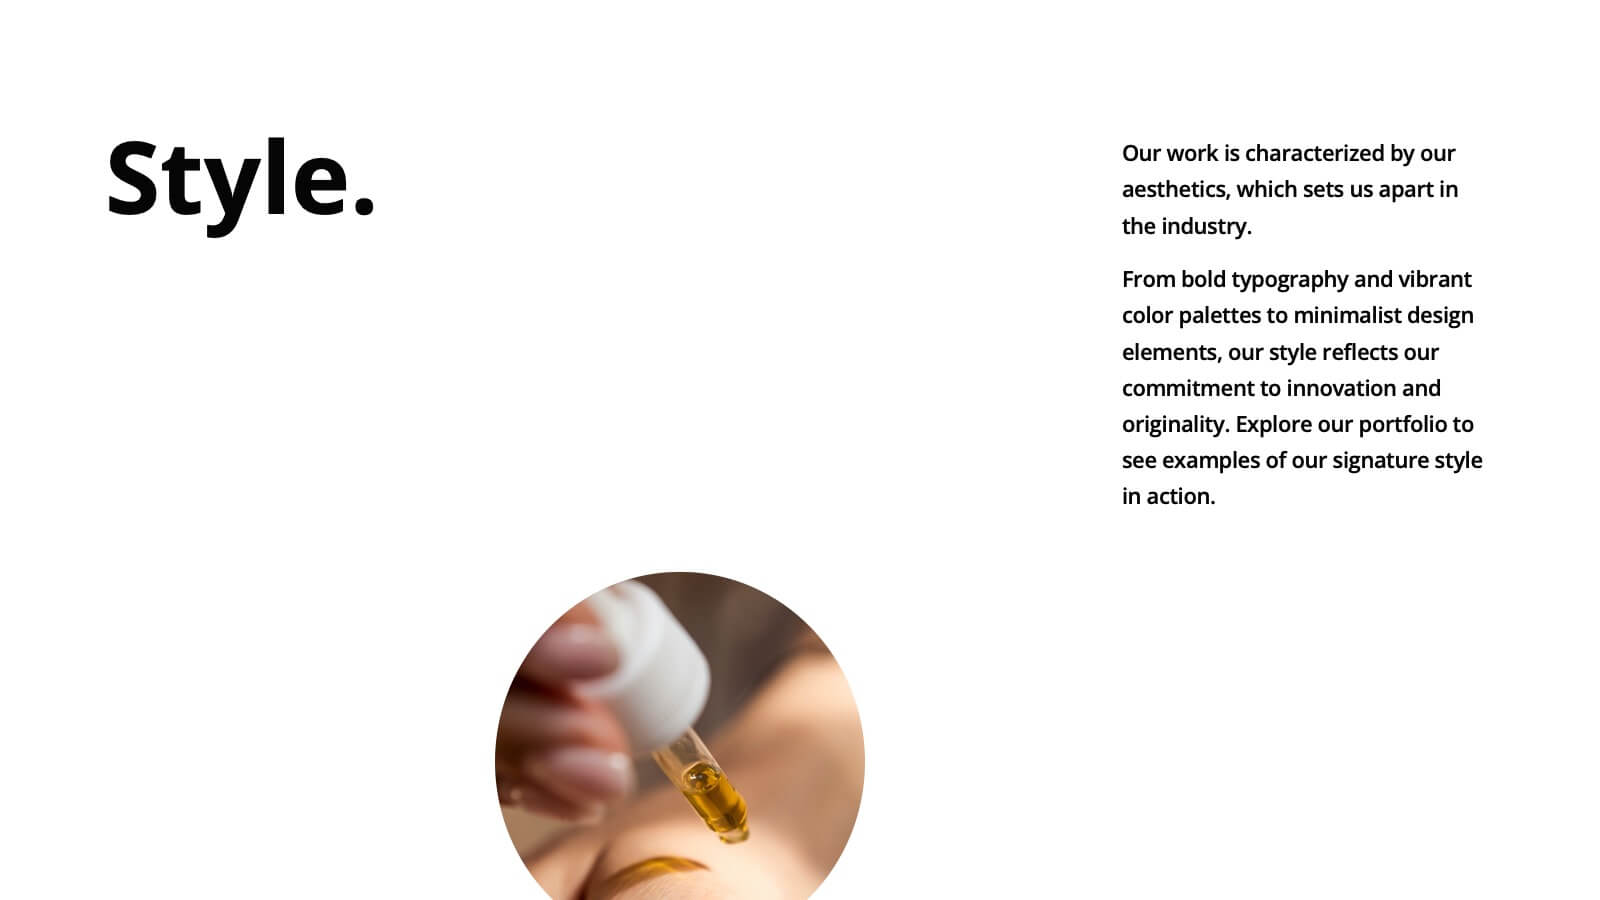
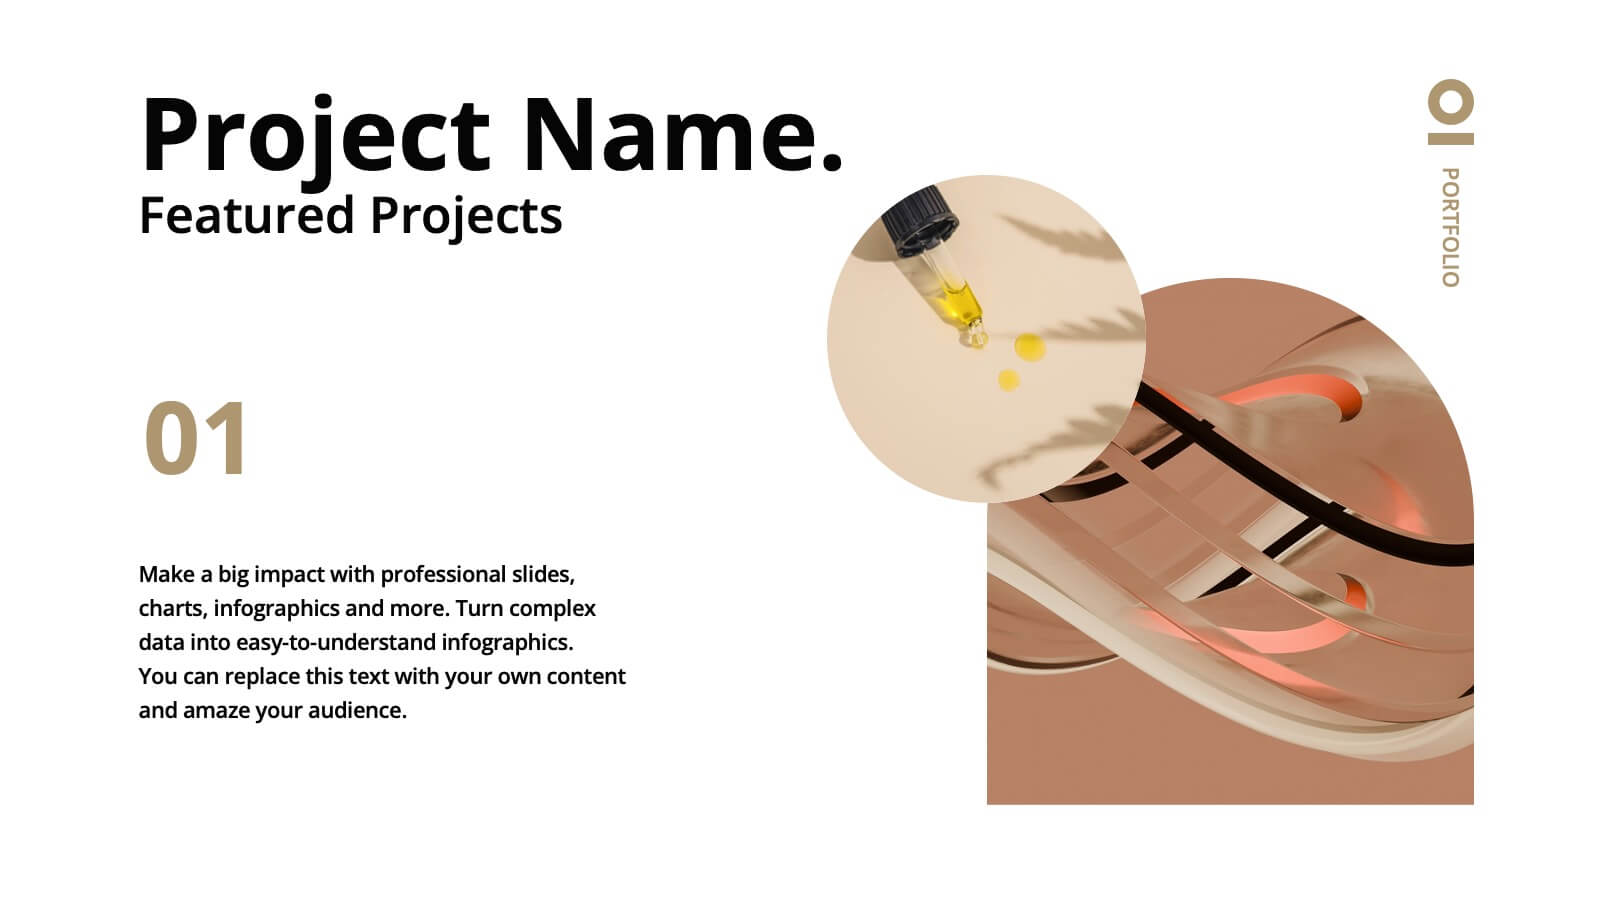
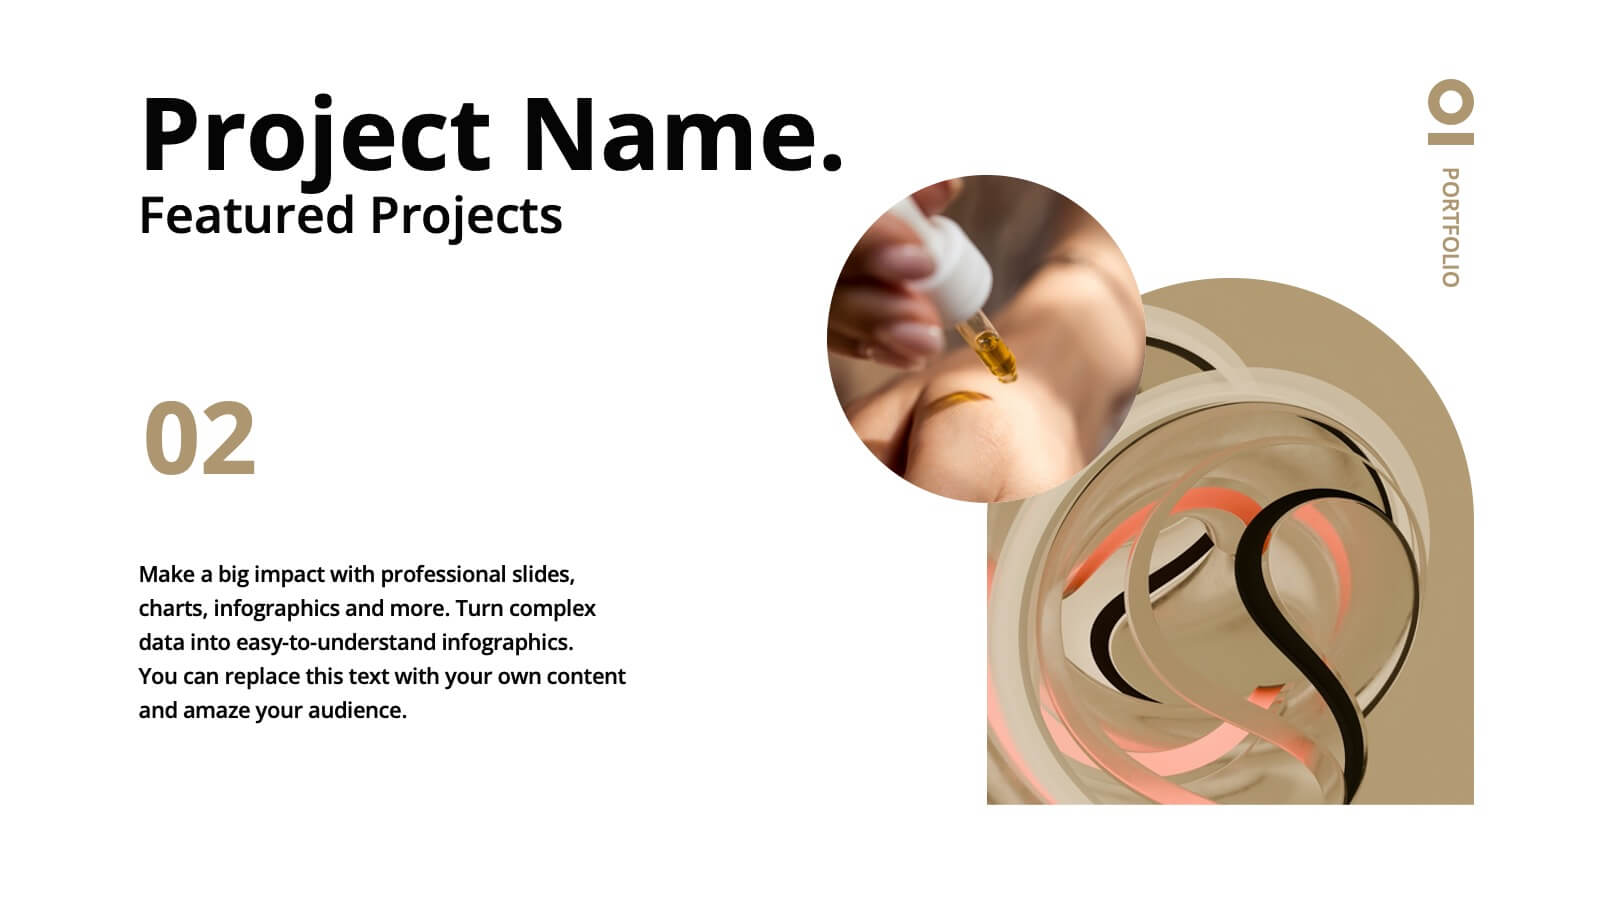
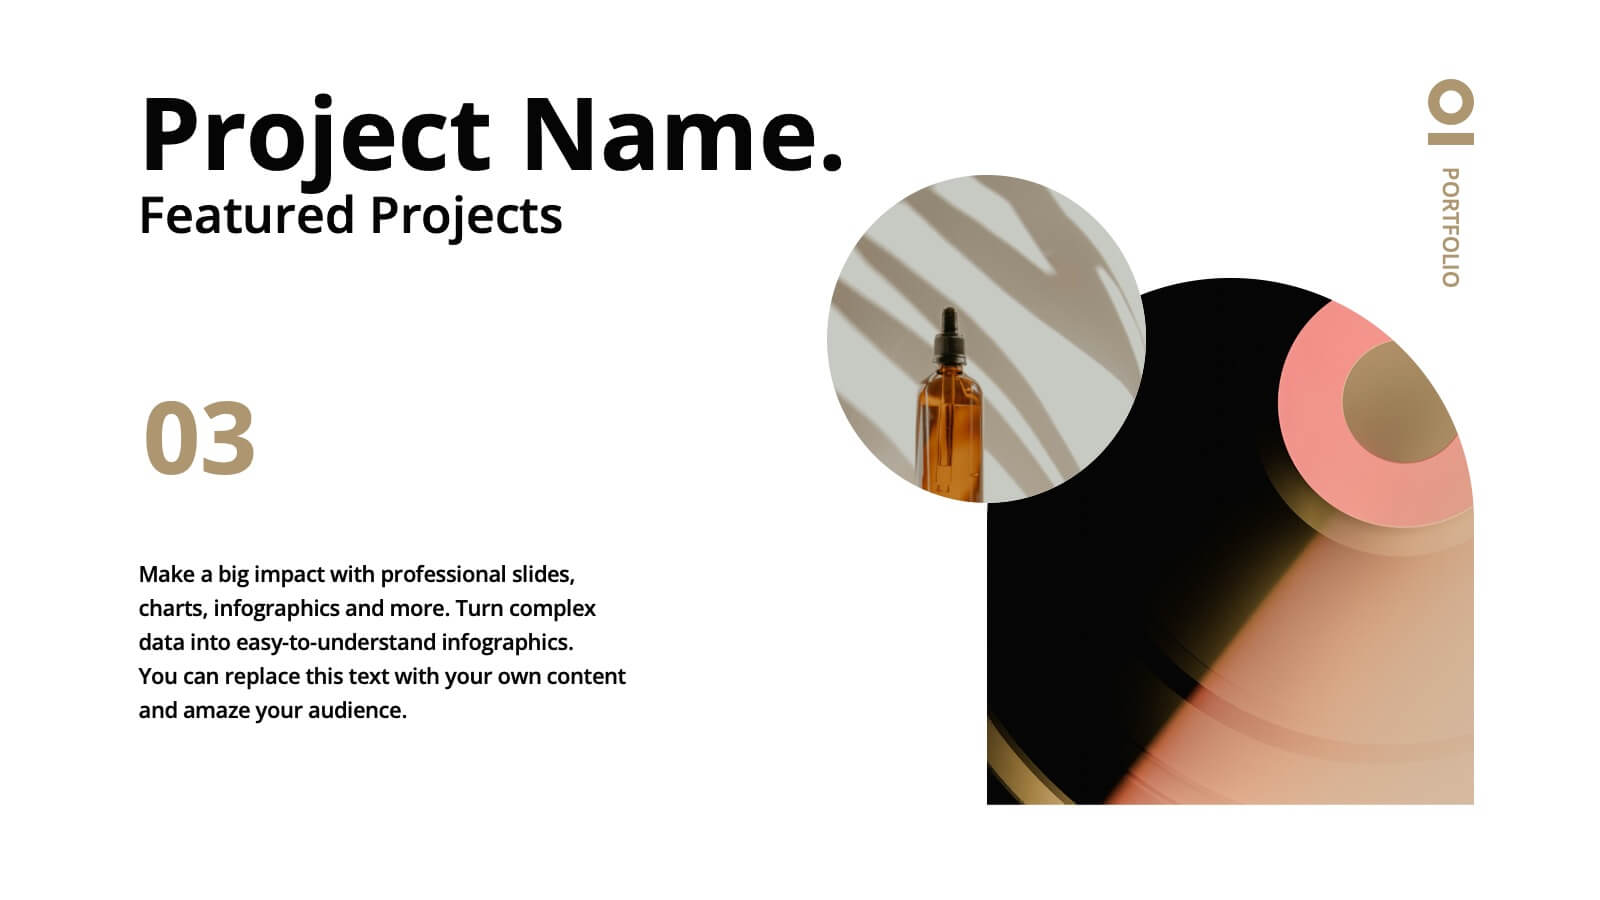
Showcase your creative journey with this vibrant artist portfolio template, featuring sections for project highlights, philosophy, style, and client testimonials. Ideal for presenting your work and artistic approach, this template is compatible with PowerPoint, Keynote, and Google Slides for seamless presentation across various platforms.


6 slides
Technology Trends Overview Presentation
Step into the future with a sleek visual that maps out emerging ideas in a way anyone can follow. This presentation helps you break down key innovations, highlight major shifts, and explain how new technologies influence your strategy. Ideal for reports and trend discussions. Fully compatible with PowerPoint, Keynote, and Google Slides.


6 slides
360-Degree Feedback System Overview
Clearly communicate your evaluation process with the 360-Degree Feedback System Overview Presentation. Featuring a circular layout with six editable segments, this template helps visualize feedback from peers, subordinates, managers, and more. Ideal for HR reviews, performance evaluations, and leadership development programs. Fully customizable in PowerPoint, Keynote, or Google Slides.


8 slides
Corporate Mission Purpose Slide
Wave your flag of purpose with this bold, banner-inspired layout—ideal for communicating your corporate mission, core principles, and company values. Each section gives space to articulate what drives your business forward in a visually unified way. Fully compatible with PowerPoint, Keynote, and Google Slides.


7 slides
Corporation Hierarchy Infographic
Discover the intricate layers of corporate structure with our corporation hierarchy infographic. Set in an appealing blend of blue, yellow, and white, this template artfully depicts the hierarchal ladder commonly seen in major corporations. From CEOs to interns, it beautifully outlines every rung. This infographic is indispensable for business students, corporate trainers, managers, and anyone seeking to understand the inner workings of a corporation. Designed with precision and clarity, it's perfectly suited for PowerPoint, Keynote, and Google Slides, making your presentations not only informative but also visually captivating.


6 slides
McKinsey 7S Advantage Infographic
The McKinsey 7S model is a strategic management framework developed by consulting firm McKinsey & Company in the 1980s. This infographic template helps explain and understand the McKinsey 7S framework, a widely used management model for organizational effectiveness. This template provides an informative overview of the seven key elements of the framework, their interrelationships, and their impact on organizational performance. This template is designed for professionals, consultants, or anyone interested in understanding and applying the McKinsey 7S framework. Fully customizable and compatible with Powerpoint, Keynote, and Google Slides.


23 slides
Halo Digital Strategy Presentation
Elevate your digital strategy presentations with this vibrant, professional template. Perfect for showcasing market trends, SWOT analysis, and strategic objectives, it features a modern layout with a cohesive color scheme. Highlight key elements like growth opportunities, value propositions, and performance metrics to captivate your audience. Compatible with PowerPoint, Keynote, and Google Slides, it ensures seamless presentations on any platform.


5 slides
Effects of Cyberbullying Infographics
Cyberbullying refers to the use of electronic communication platforms, such as social media, text messages, or online forums, to harass, intimidate, or target individuals. With these infographics, you can effectively communicate the seriousness of cyberbullying and its detrimental effects on individuals. Whether you're delivering a presentation, creating educational materials, or sharing information online, this template provides a visually impactful way to raise awareness and promote conversations about cyberbullying prevention and support for victims. They incorporate eye-catching visuals, icons, and color schemes to effectively convey information and engage your audience.


5 slides
OKR-Based Goal Setting Approach
Clarify your objectives and key results with this visual OKR-Based Goal Setting slide. Each target icon represents a focused initiative, helping teams align and measure progress clearly. Fully editable in PowerPoint, Keynote, and Google Slides.


21 slides
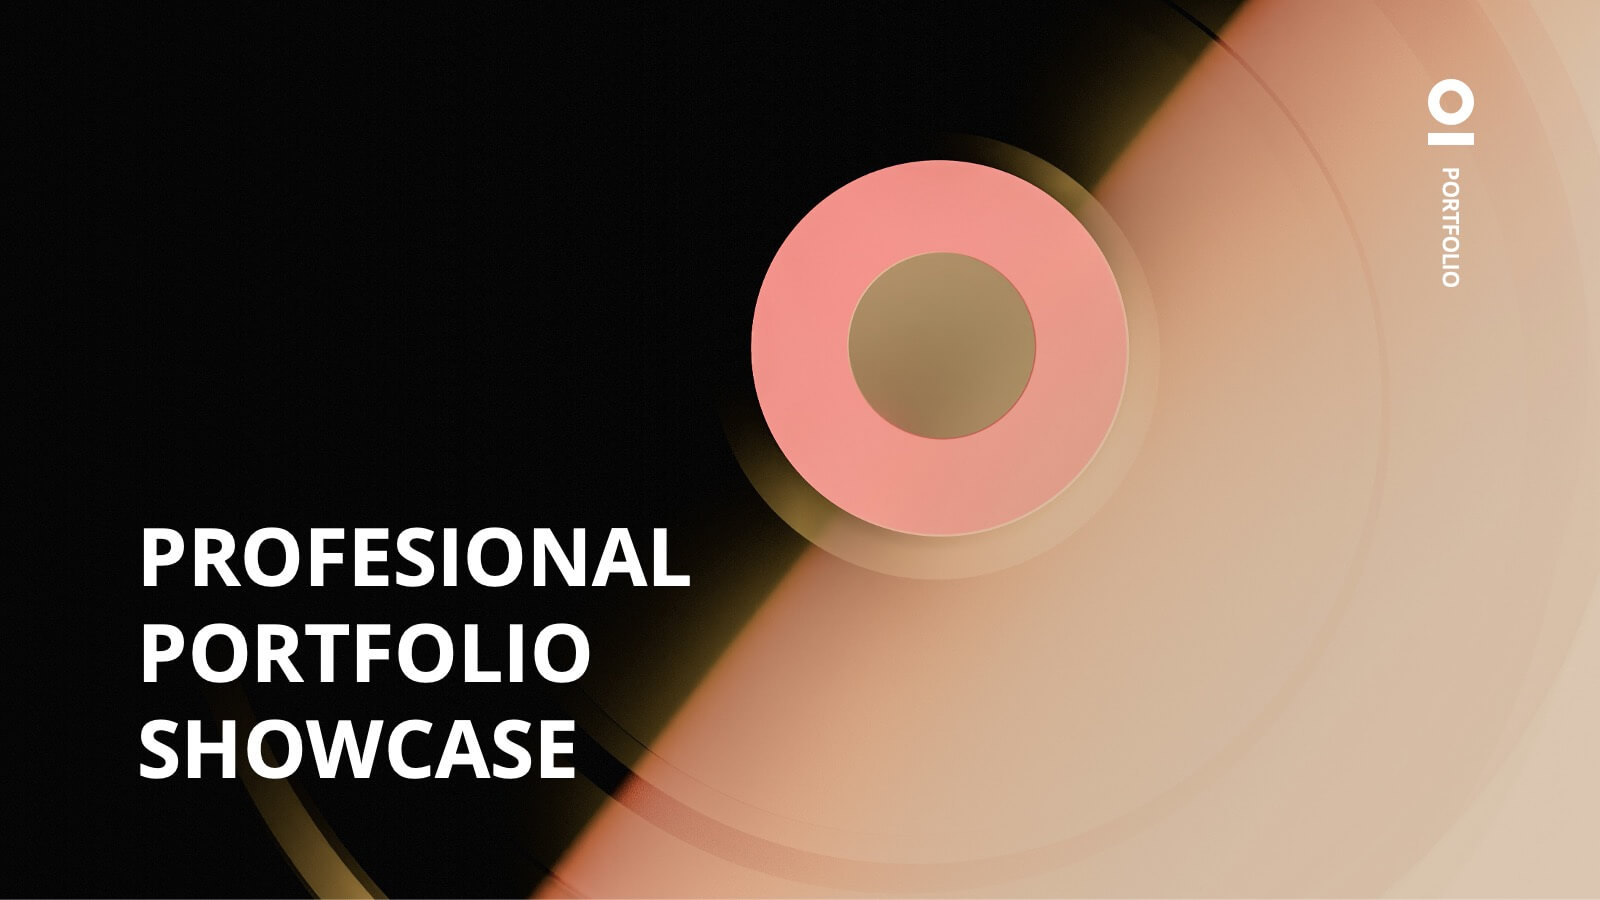
Haze Professional Portfolio Showcase Presentation
Elevate your professional presence with this stunning haze-inspired presentation template! Ideal for showcasing your portfolio, it beautifully highlights your skills, projects, and achievements with a clean and sophisticated design. This template ensures your work stands out, captivating potential clients and employers. Compatible with PowerPoint, Keynote, and Google Slides.


7 slides
National Survey Results Infographics
Survey Results can provide valuable insights and data that can be used to make informed decisions, improve offerings, and stay ahead of the competition. This survey results template features a clean design and is a completely customizable presentation that allows you to easily change the colors, fonts and graphics. You can use this infographic as a tool to insert into your product and marketing presentations. This presentation is compatible with Powerpoint, Keynote and Google Slides. Simply add your information and have it customized with your text and chart options to suit your needs.

22 slides
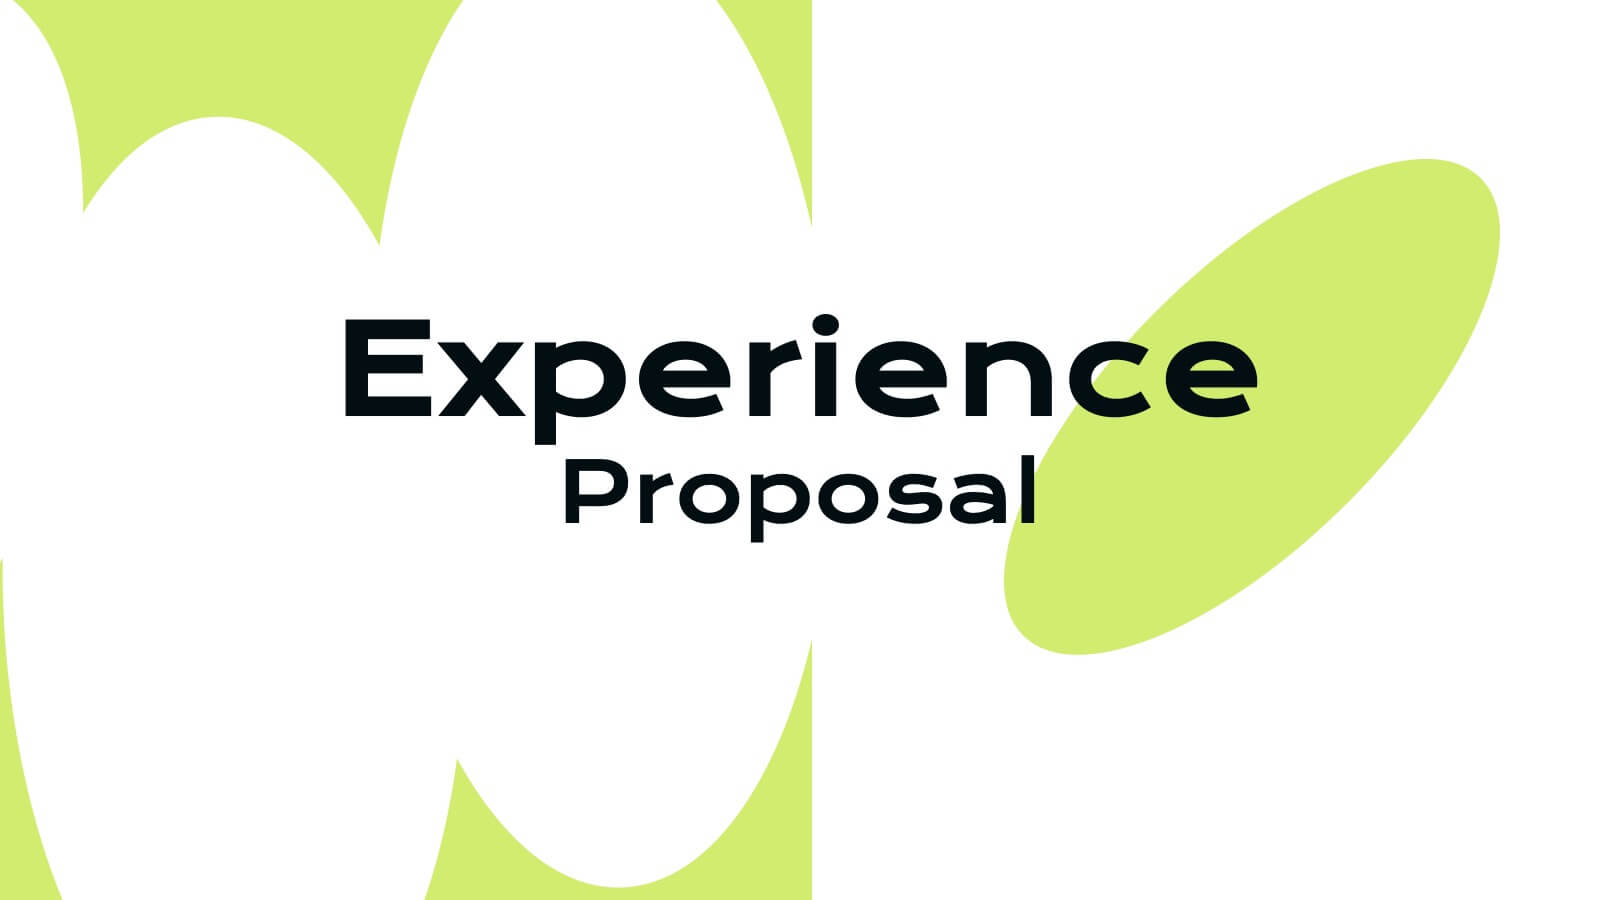
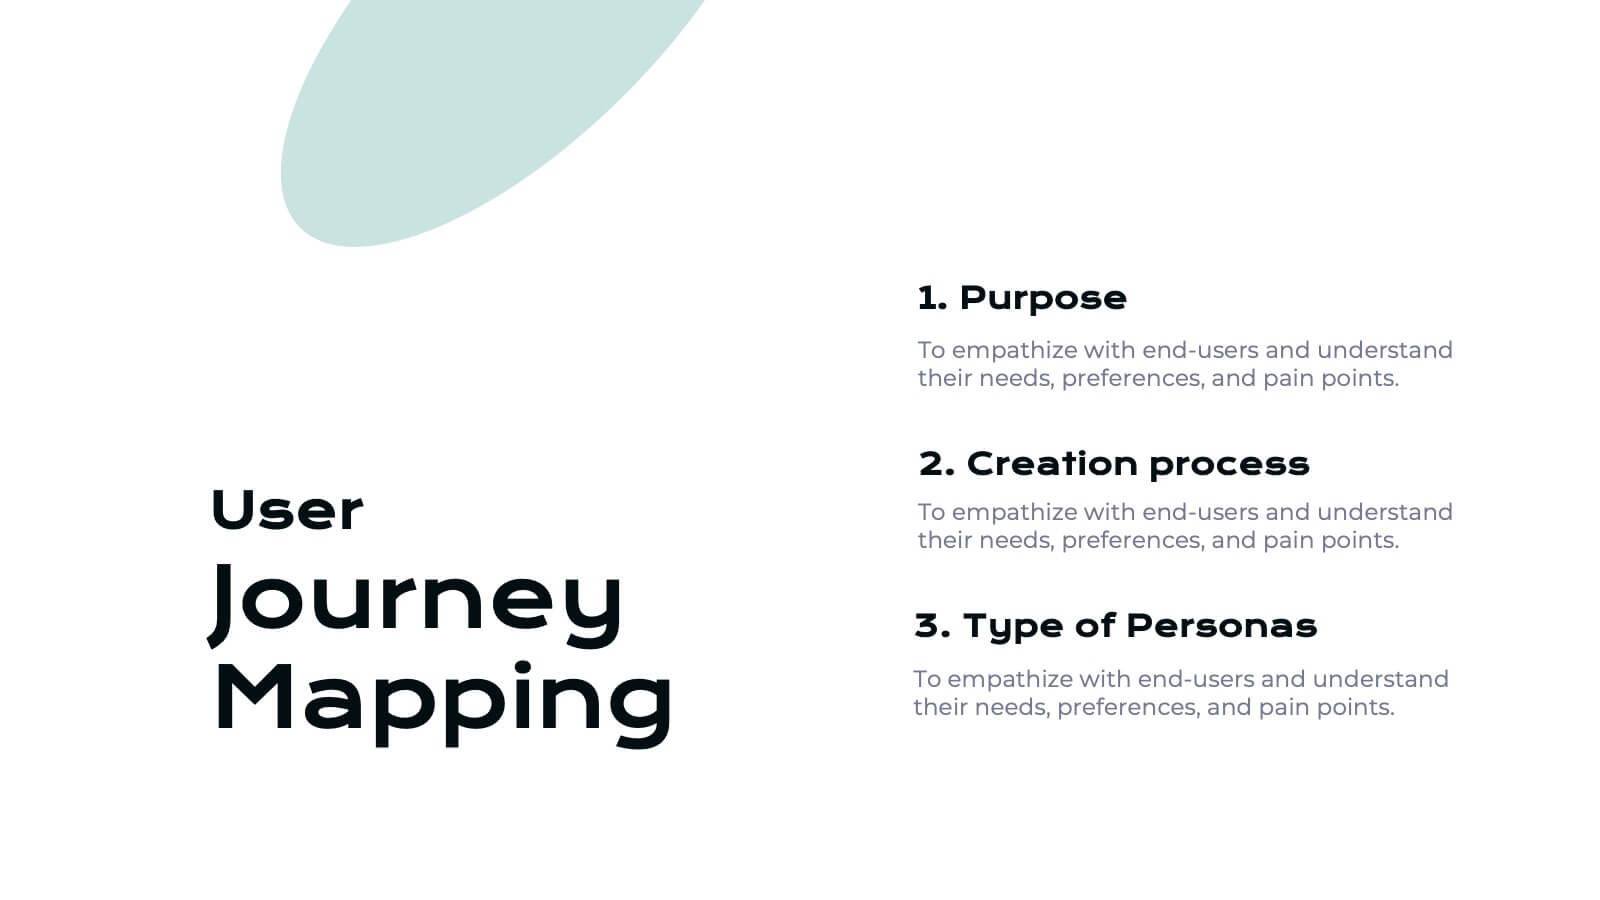
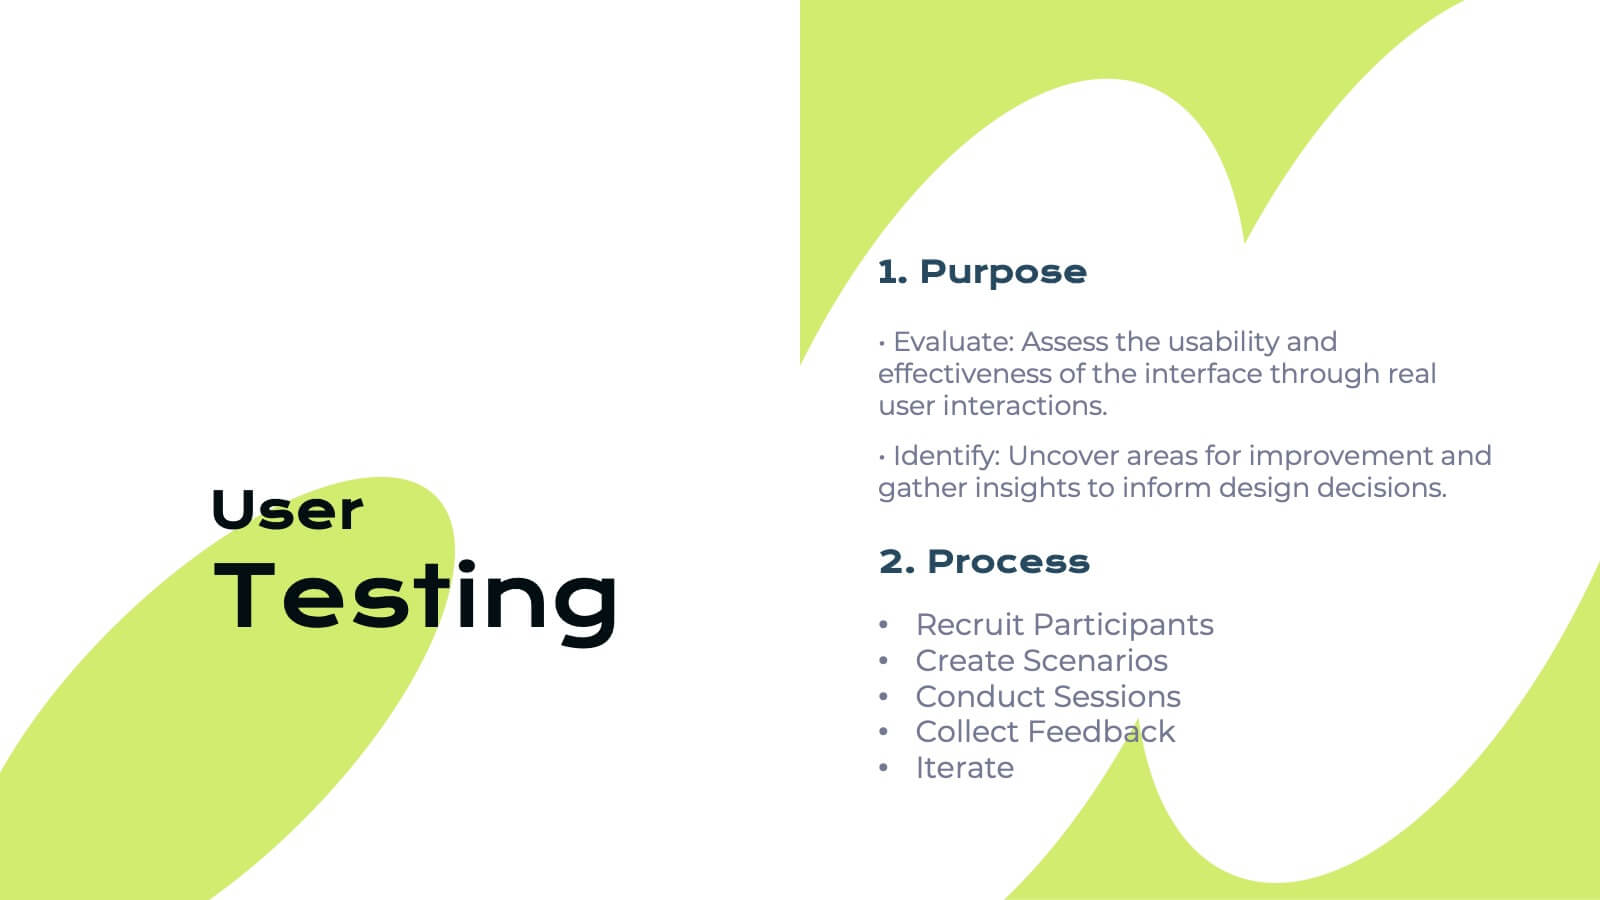
Ifrit User Experience Proposal Presentation
Unleash the power of great design with this fiery Ifrit-inspired presentation, perfect for delivering your user experience proposal! This template lets you showcase your UX strategies, research, and design process in a visually striking and well-organized format. Impress stakeholders with every slide. Compatible with PowerPoint, Keynote, and Google Slides.


7 slides
Watercolor Infographic Presentation Template
A Watercolor Infographic is a type of visual representation that combines elements of traditional watercolor paintings with information and data. This template uses soft, flowing lines and splashes of color to create an eye-catching design that communicates information in a unique and creative way. This Watercolor infographic can be used to showcase statistics, trends, or other information in a visually appealing way, making them ideal for presentations, reports, and marketing materials. This template is perfect for teachers, students, or anyone who wants to make their information stand out.


7 slides
Communication Styles Infographic
Dive into the diverse world of communication with our communication styles infographic. Set against a palette of blue, yellow, and white, this template offers a visual exploration of different communication methods and their nuances. Whether it's assertive, passive, aggressive, or passive-aggressive, understanding these styles is vital in both personal and professional settings. Ideal for corporate trainers, educators, students, or anyone aiming to improve their interpersonal skills. Crafted for clarity and compatibility, this infographic is an excellent addition to PowerPoint, Keynote, and Google Slides, ensuring your presentations resonate with both substance and style.


5 slides
Student Progress Report Presentation
Track academic milestones with this Student Progress Report Presentation. Featuring a stair-step puzzle layout topped with a graduation cap, it visually represents growth across four key areas. Ideal for educators, counselors, or school administrators. Fully editable in PowerPoint, Keynote, and Google Slides.

20 slides
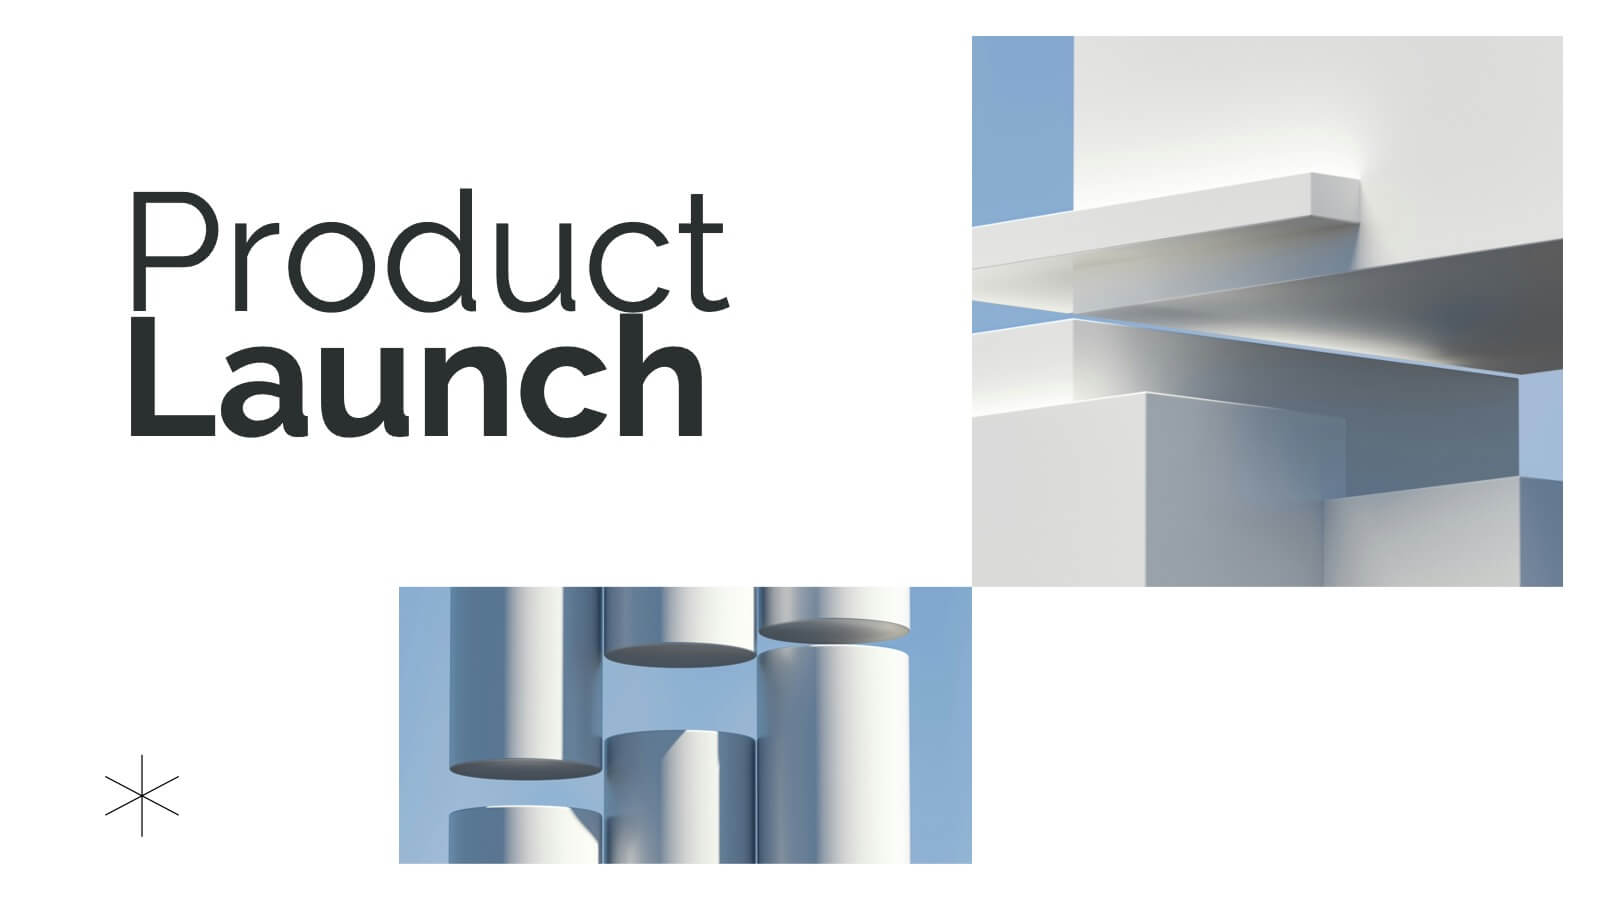
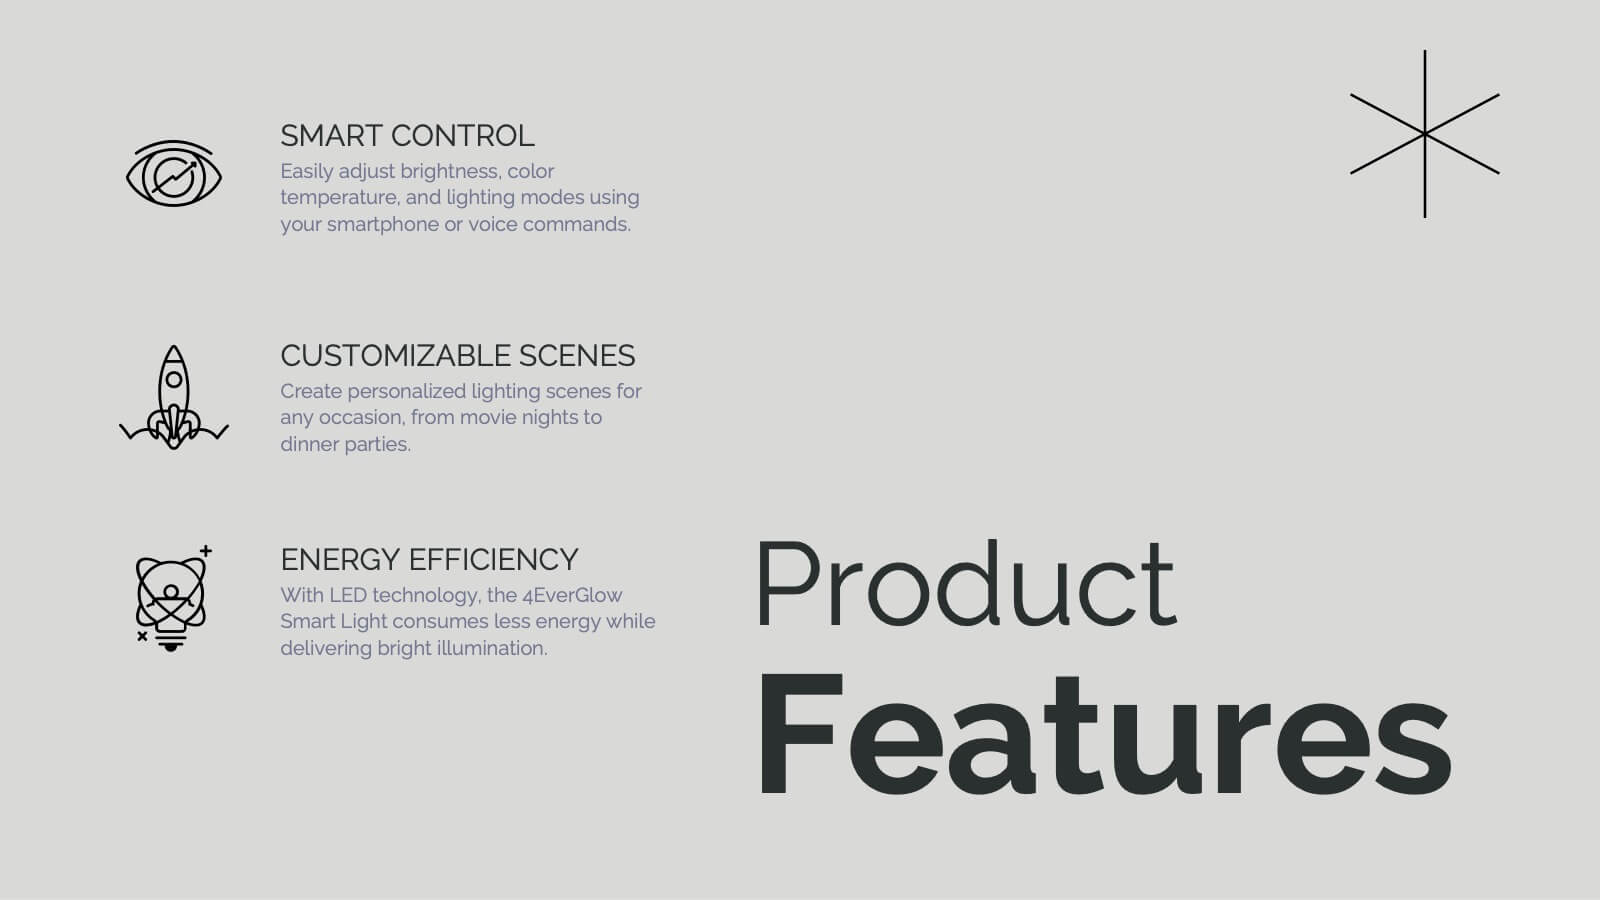
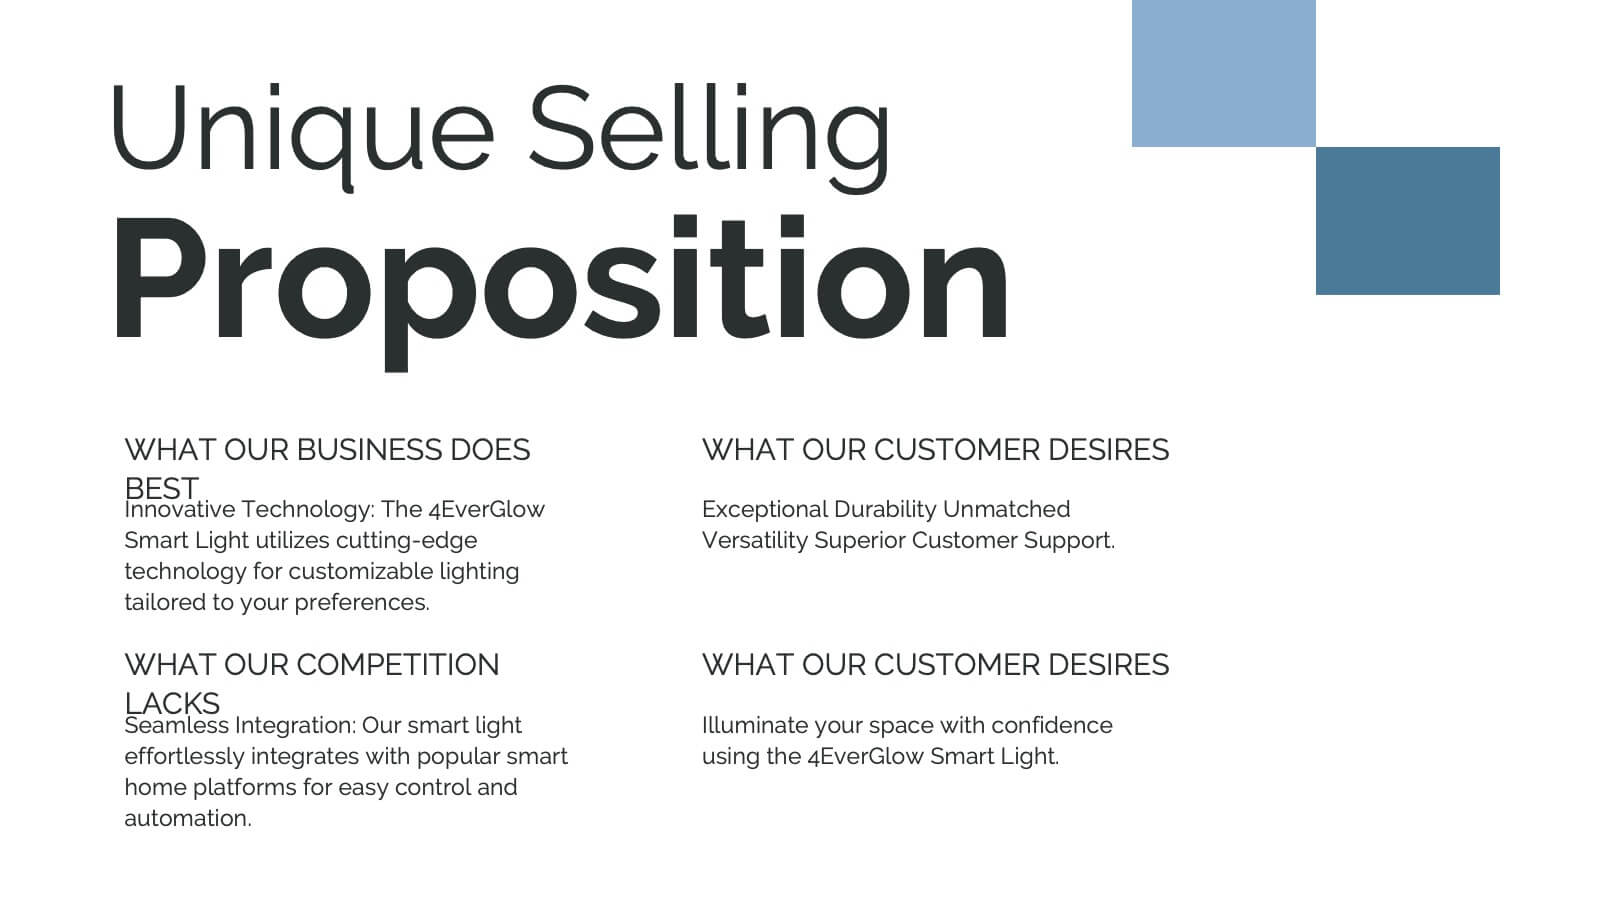
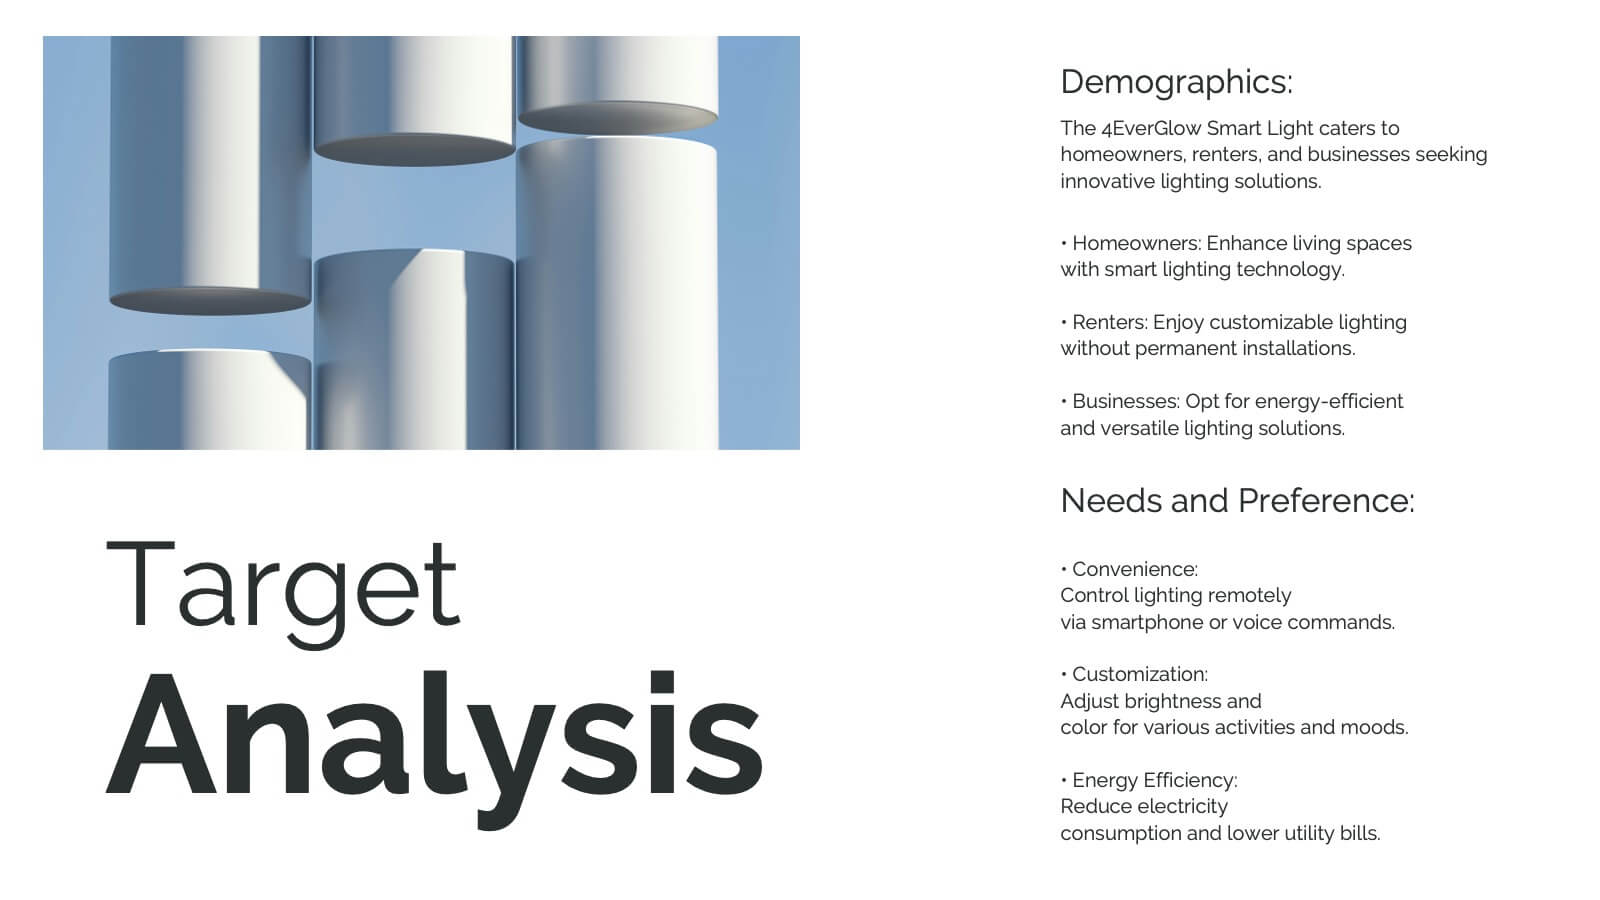
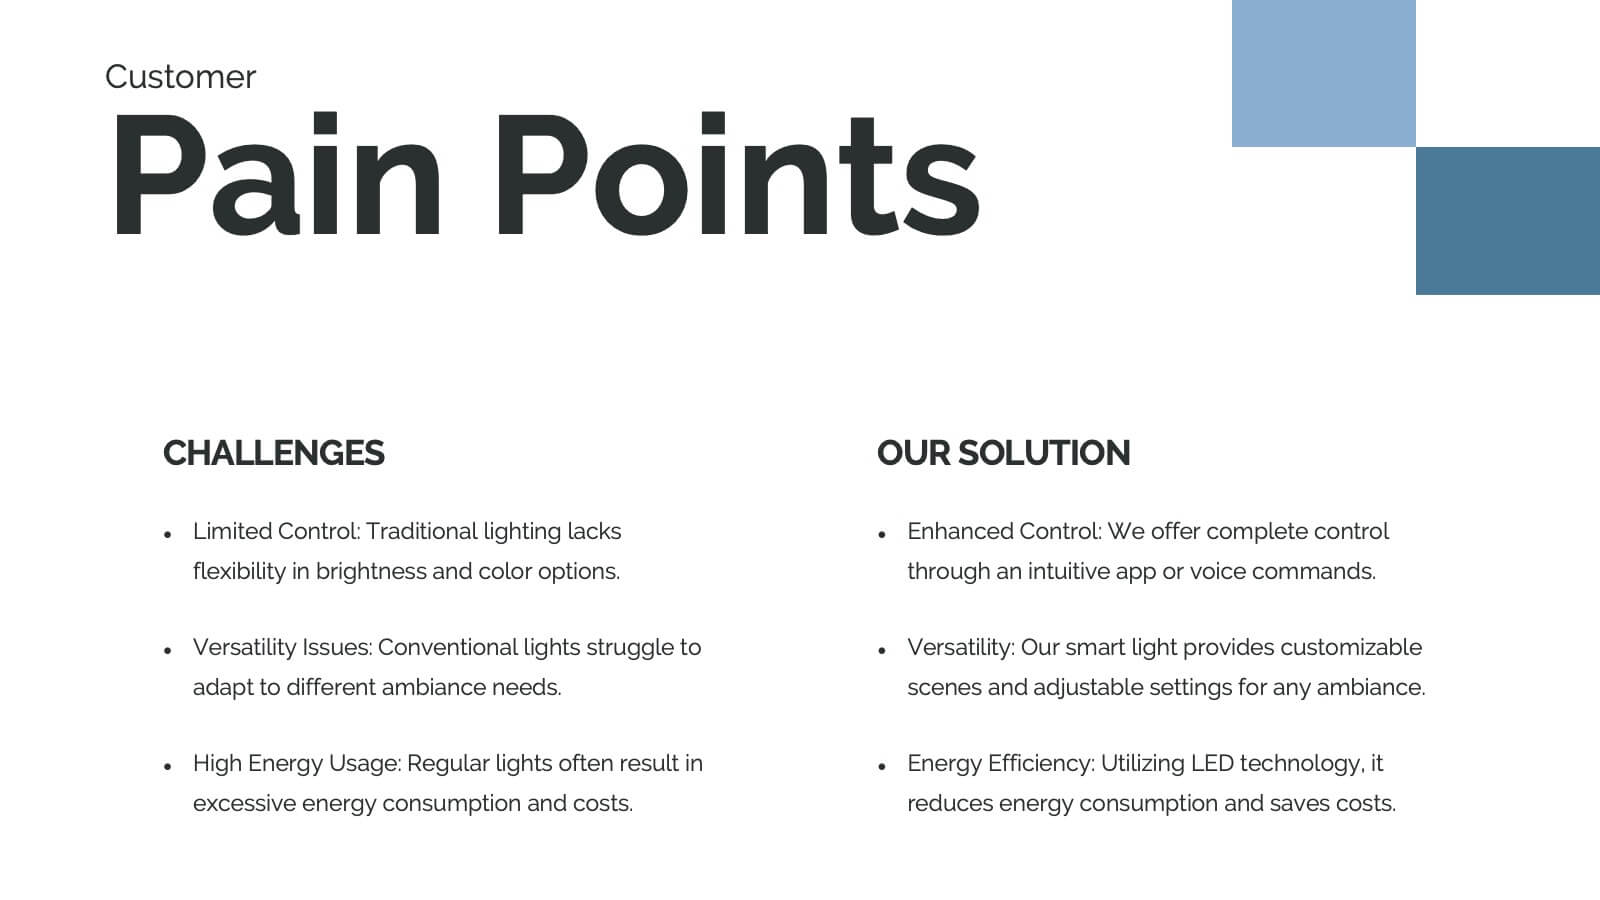
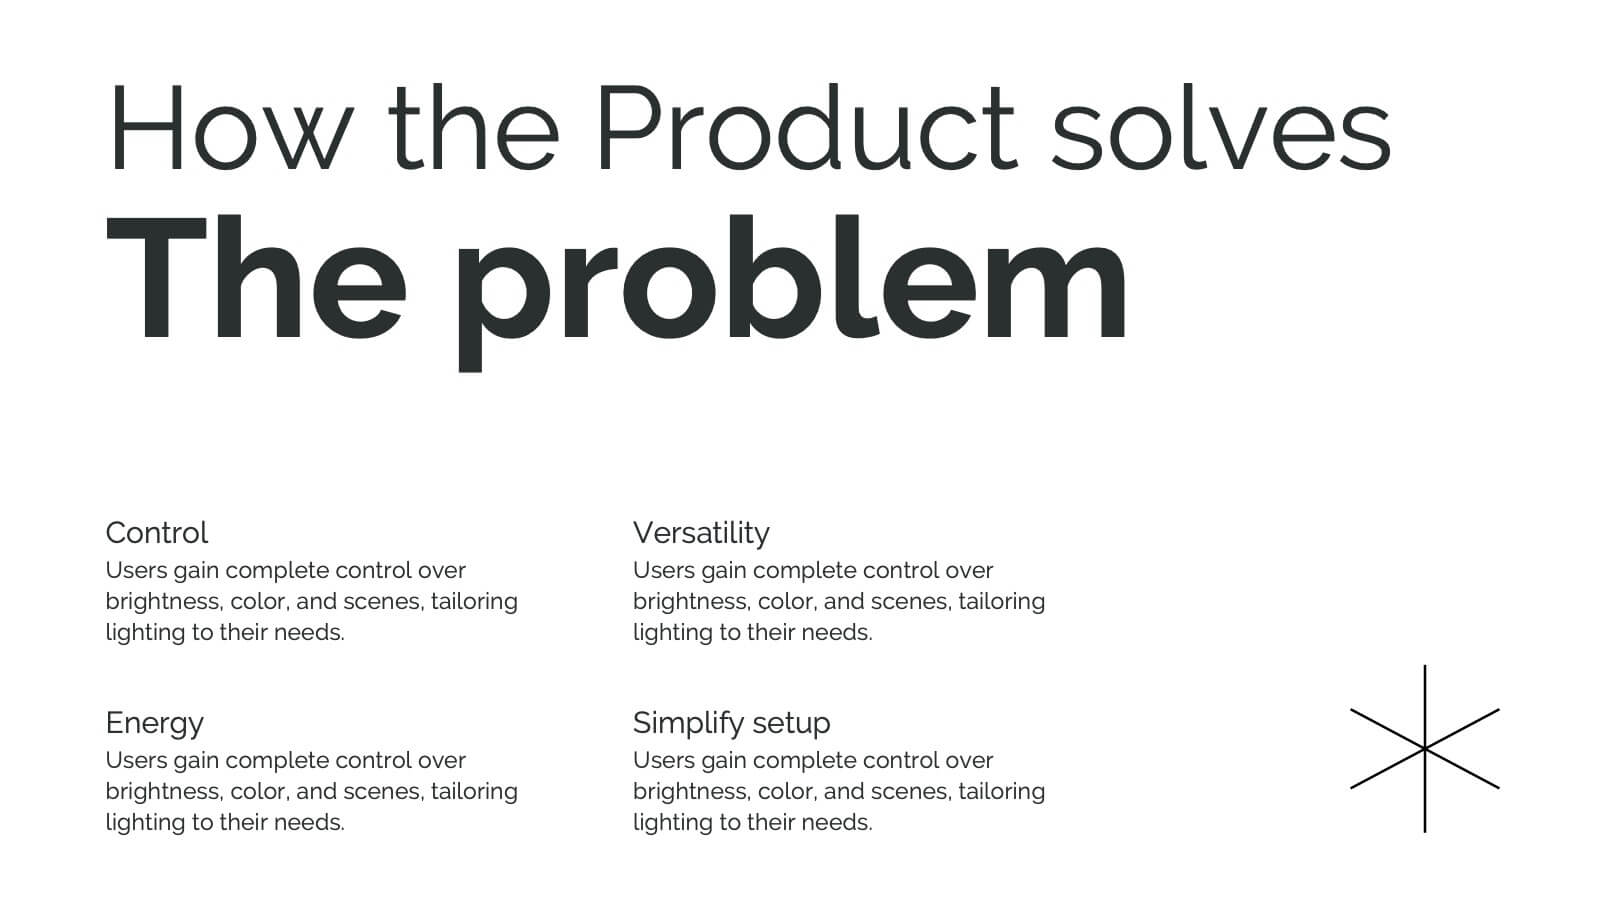
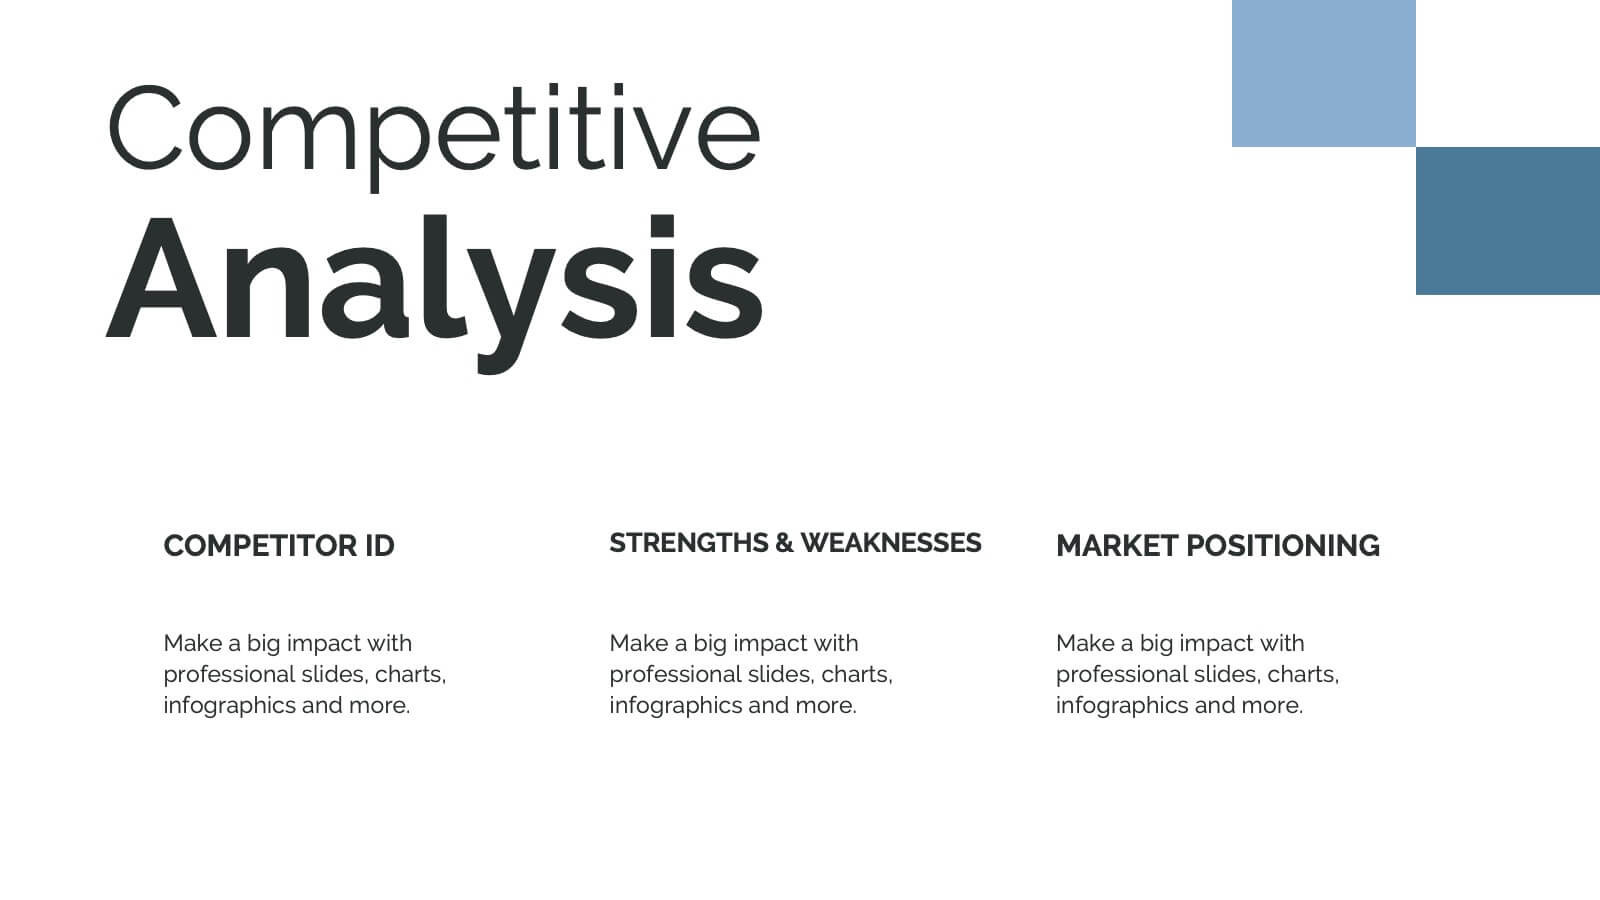
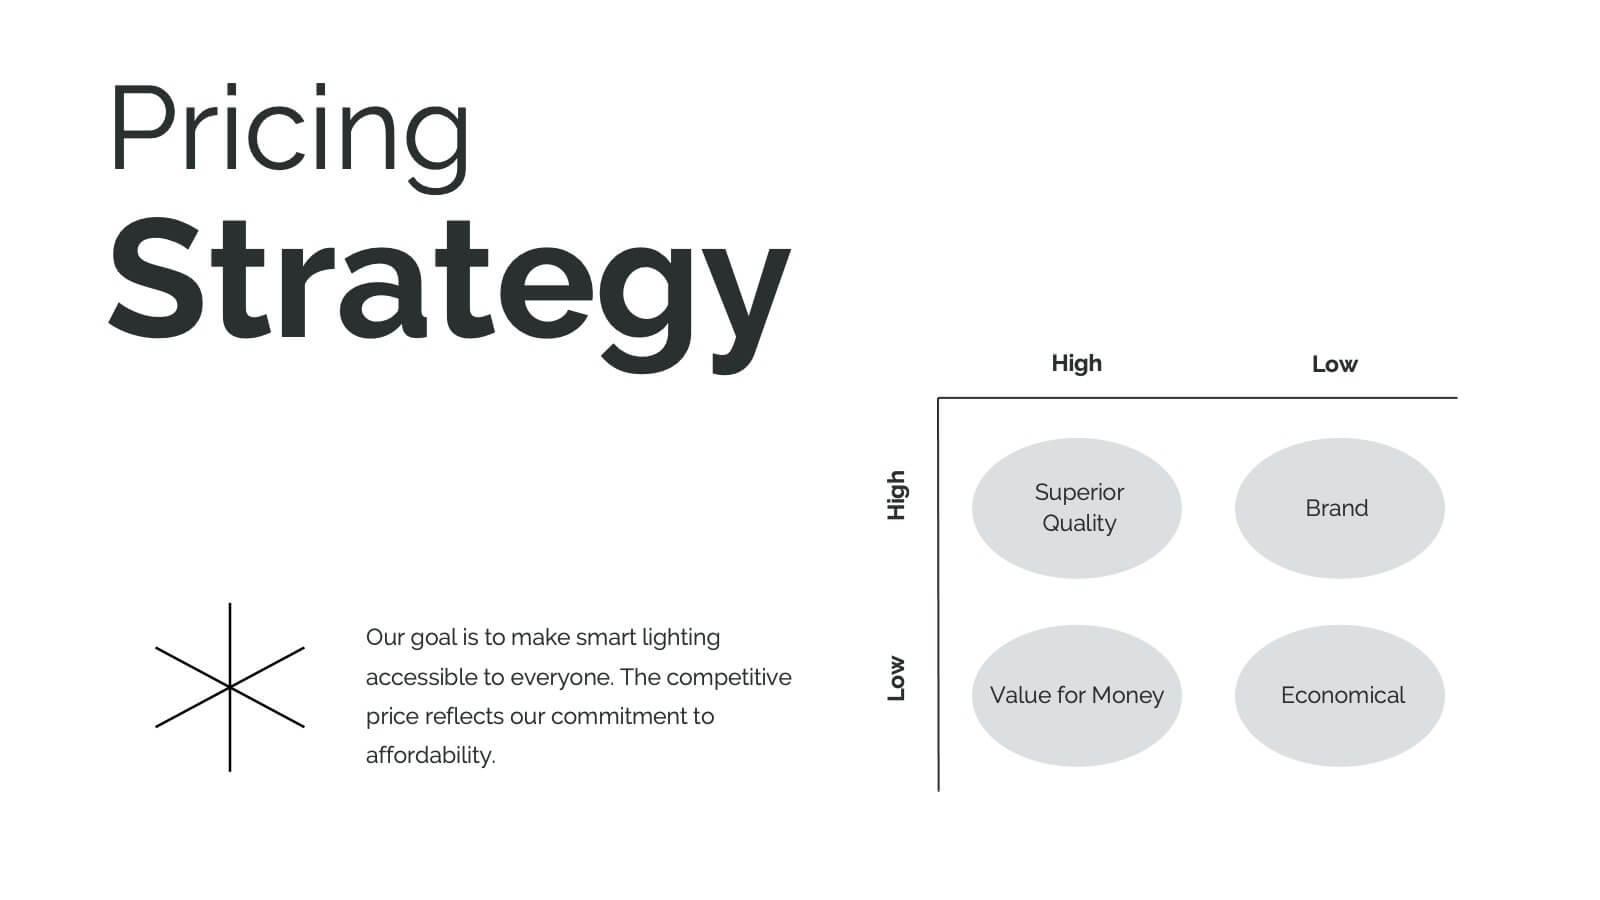
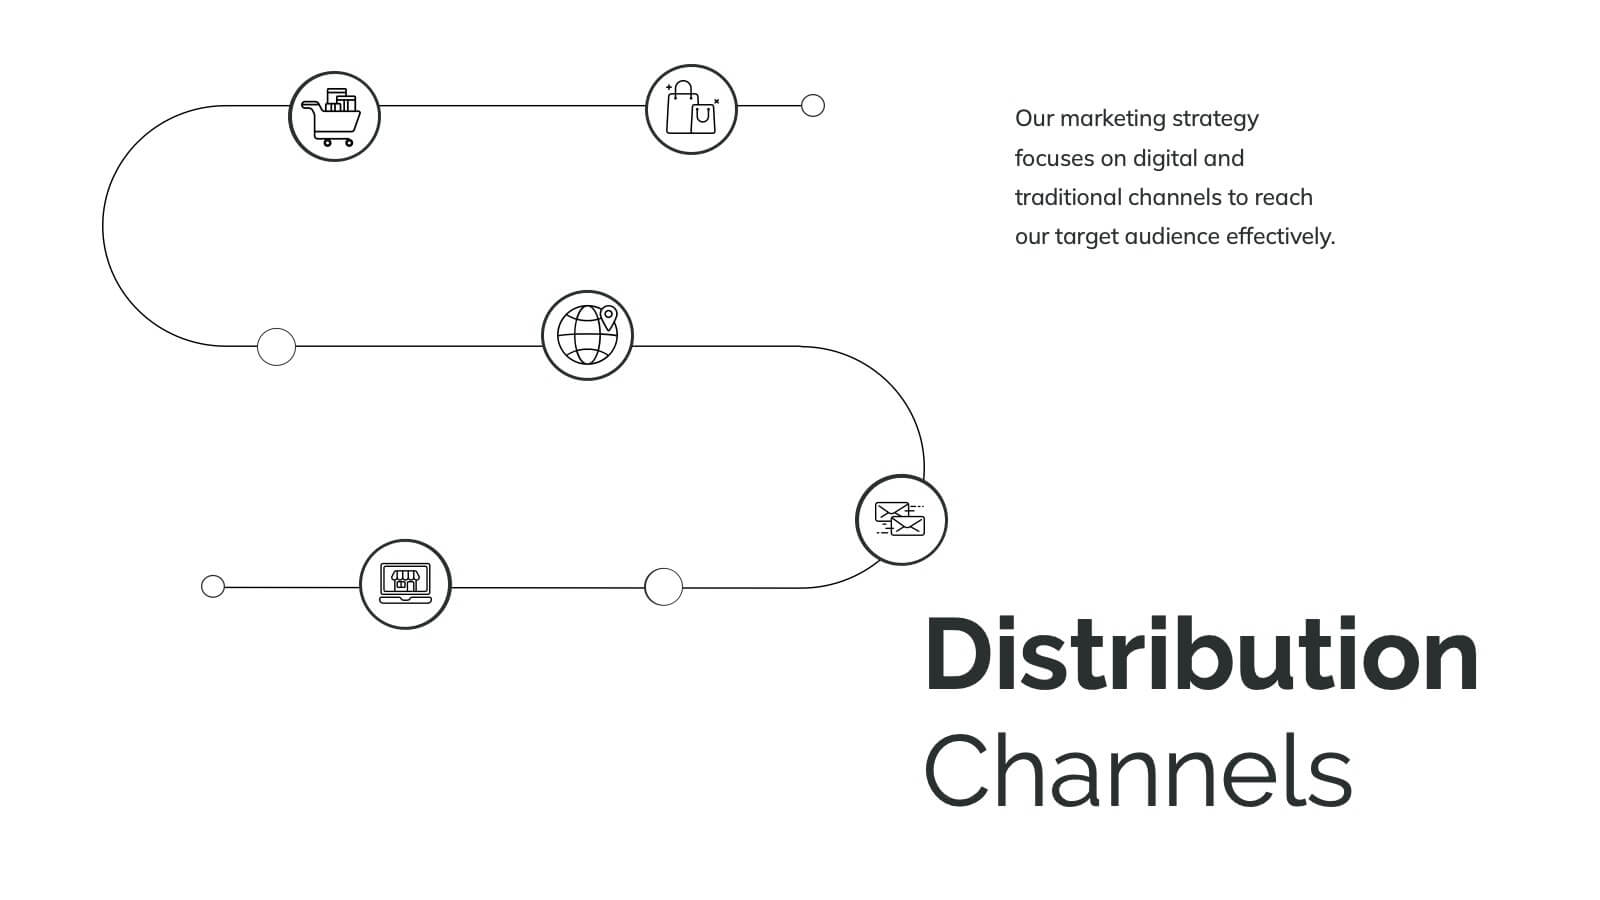
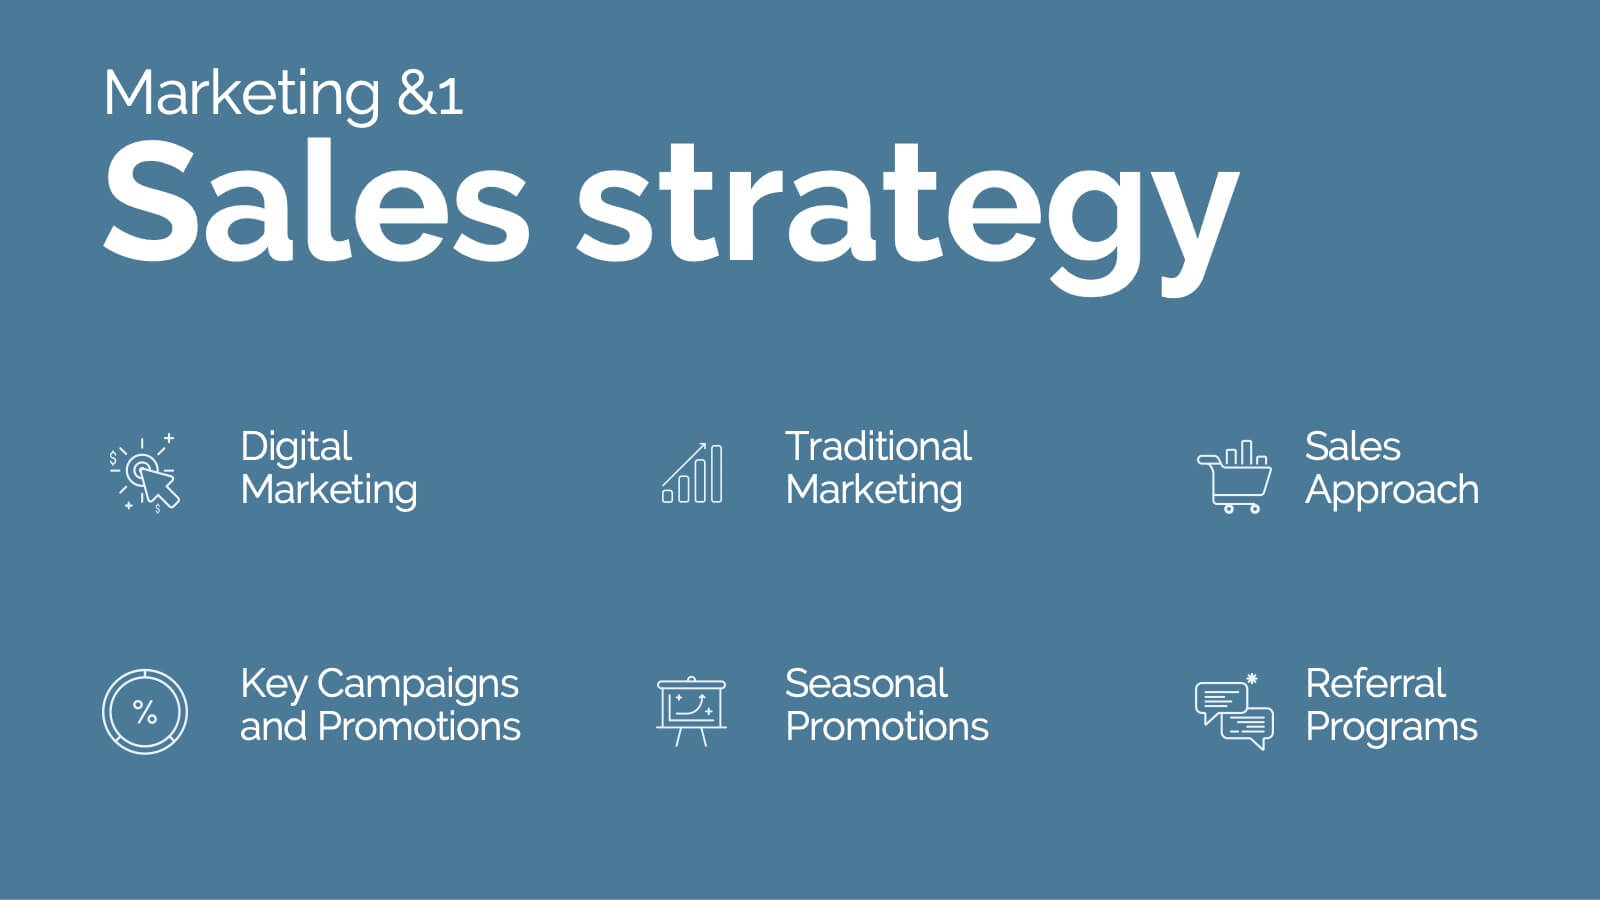
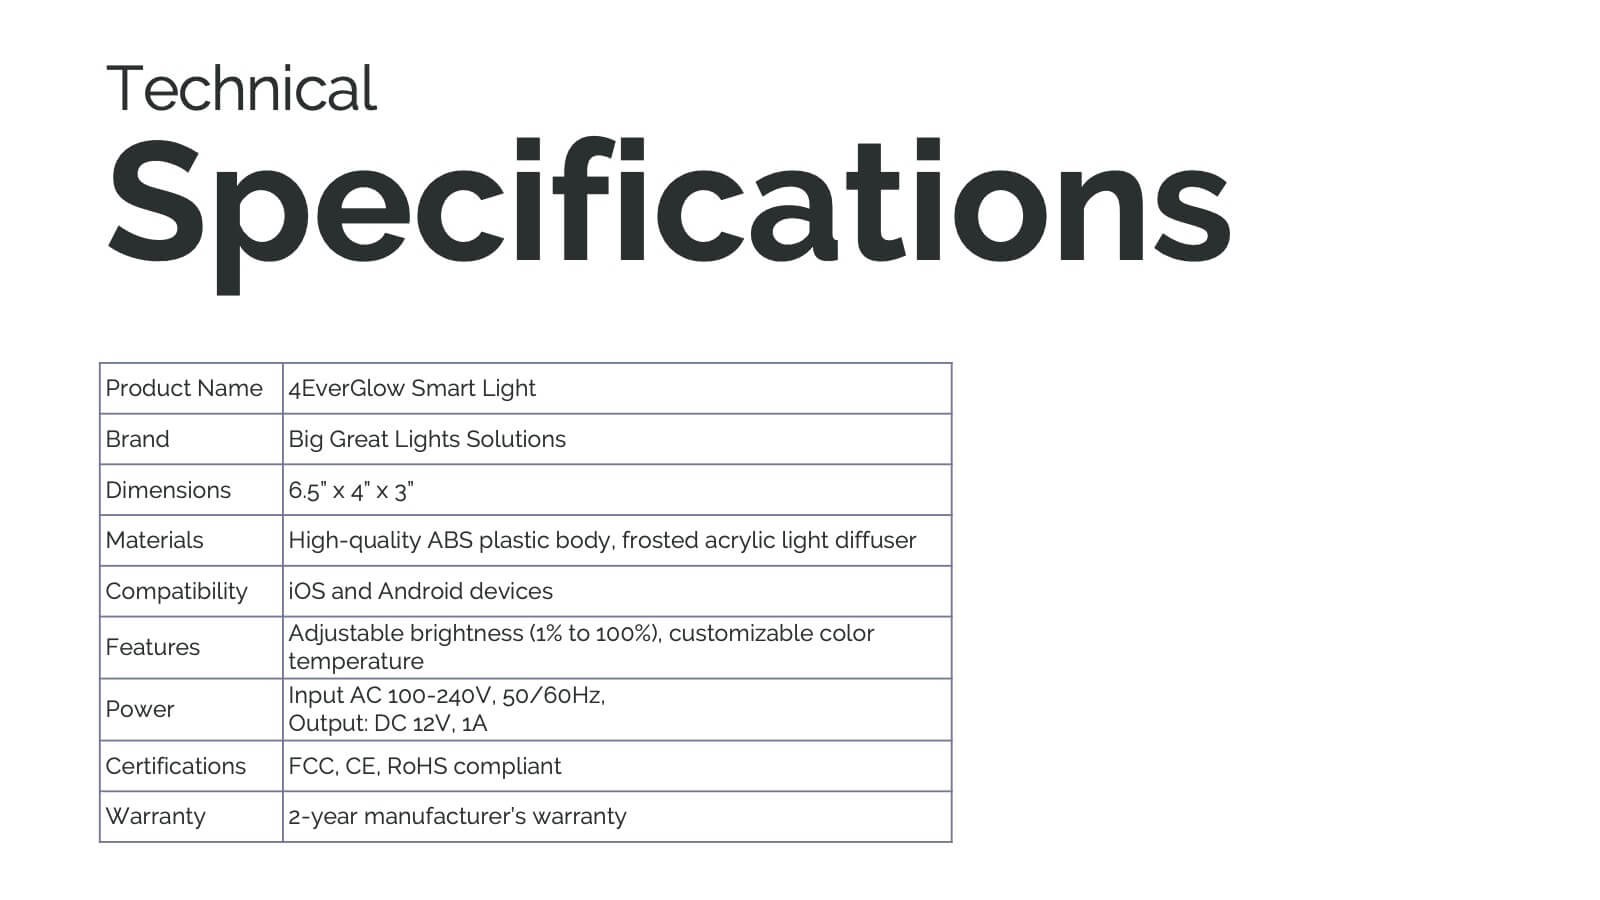
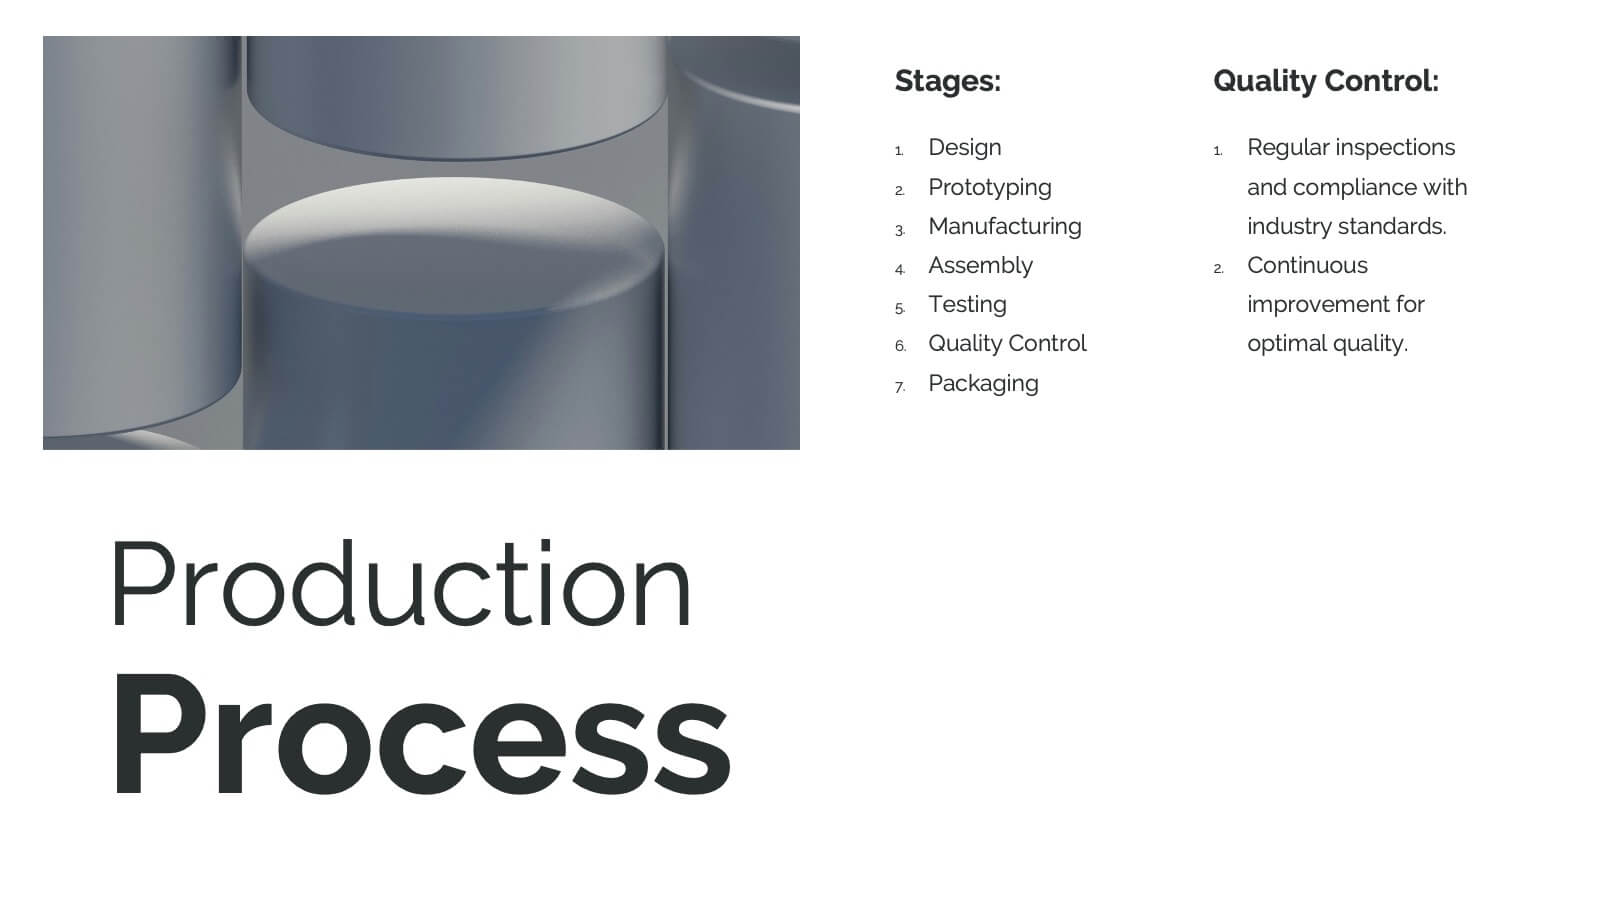
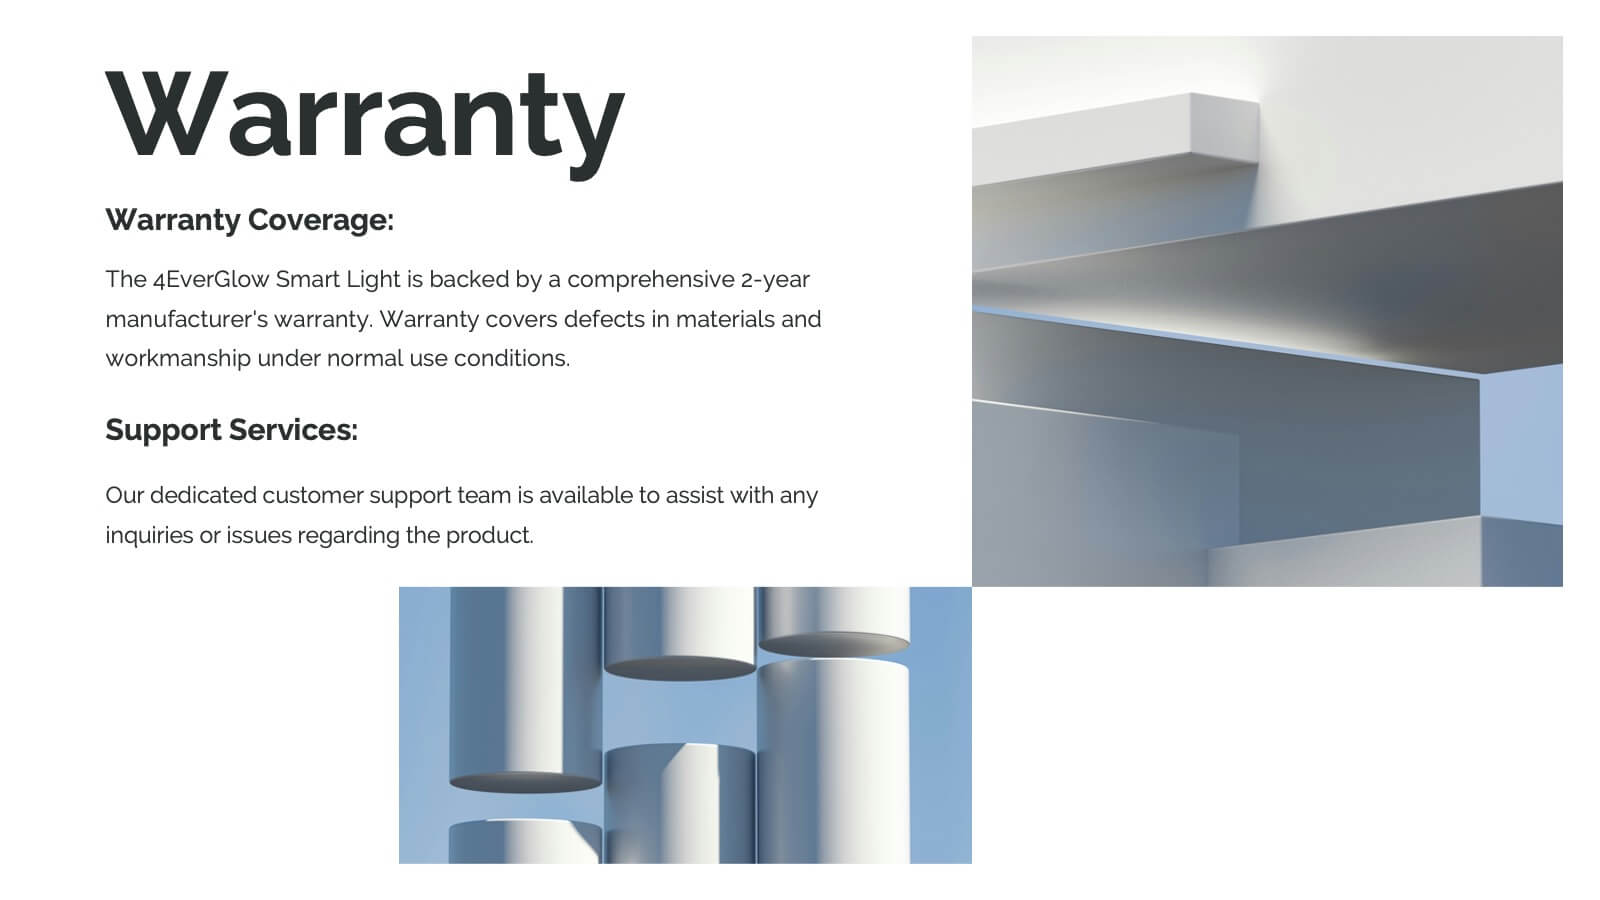
Hydra Product Launch Presentation
Unveiling your latest product has never been easier or more captivating! This comprehensive presentation template covers every aspect of your product's journey—from launch to competitive analysis. Engage your audience with detailed slides on features, target analysis, and pricing strategy. Seamlessly compatible with PowerPoint, Keynote, and Google Slides for maximum flexibility and impact.


20 slides
Fluxion Product Launch Pitch Deck Presentation
Launch your next big idea with this sleek and impactful pitch deck! Featuring sections like market opportunities, business model, revenue streams, and team introductions, it ensures a persuasive narrative for investors. Perfect for startup launches or product pitches, this deck works seamlessly with PowerPoint, Keynote, and Google Slides.