


Features
- 21 Unique Slides
- Fully editable and easy to edit in Microsoft Powerpoint, Keynote and Google Slides
- 16:9 widescreen layout
- Clean and professional designs
- Export to JPG, PDF or send by email


Do you have any questions?
Recommend


5 slides
Data Distribution with Pie Chart Visuals Presentation
Visualize complex metrics with ease using the Data Distribution with Pie Chart Visuals Presentation. This slide design integrates a clean side-by-side layout of a colorful pie chart and a five-point legend, making it ideal for showcasing proportions, segments, or performance breakdowns. Each item features an icon and customizable text to clearly label your data points. Perfect for business analysts, marketers, and financial teams, the slide is editable in PowerPoint, Keynote, and Google Slides. It’s a great choice for delivering data-driven insights in a simple, visual format.


6 slides
Startup Business Launch Framework Presentation
Showcase your startup journey with the Startup Business Launch Framework Presentation. This step-by-step visual illustrates four key stages in your business launch process—from ideation to execution—using ascending blocks and modern icons. Ideal for founders, incubators, and pitch decks. Fully customizable in PowerPoint, Keynote, Google Slides, and Canva.


6 slides
Cloud IT Infrastructure Design Presentation
Transform the way you explain cloud systems with this modern, data-driven presentation. Ideal for outlining infrastructure layers, deployment strategies, or network operations, it uses a clean, cloud-inspired layout for clarity and impact. Fully customizable and compatible with PowerPoint, Keynote, and Google Slides for a smooth, professional presentation experience.


8 slides
2x2 Matrix Chart Presentation
Bring clarity to complex decisions with this clean, visually engaging layout designed for comparing four key factors at a glance. This presentation makes it easy to highlight priorities, map insights, and explain strategic choices with confidence. Fully customizable and compatible with PowerPoint, Keynote, and Google Slides.


4 slides
Food Business Concept Pitch Presentation
Bring your culinary vision to life with the Food Business Concept Pitch Presentation. This unique avocado-shaped layout helps you outline up to four key ideas—from menu innovation to service strategy. Perfect for chefs, restaurateurs, or food startups. Fully editable in PowerPoint, Canva, and Google Slides for easy customization.

22 slides
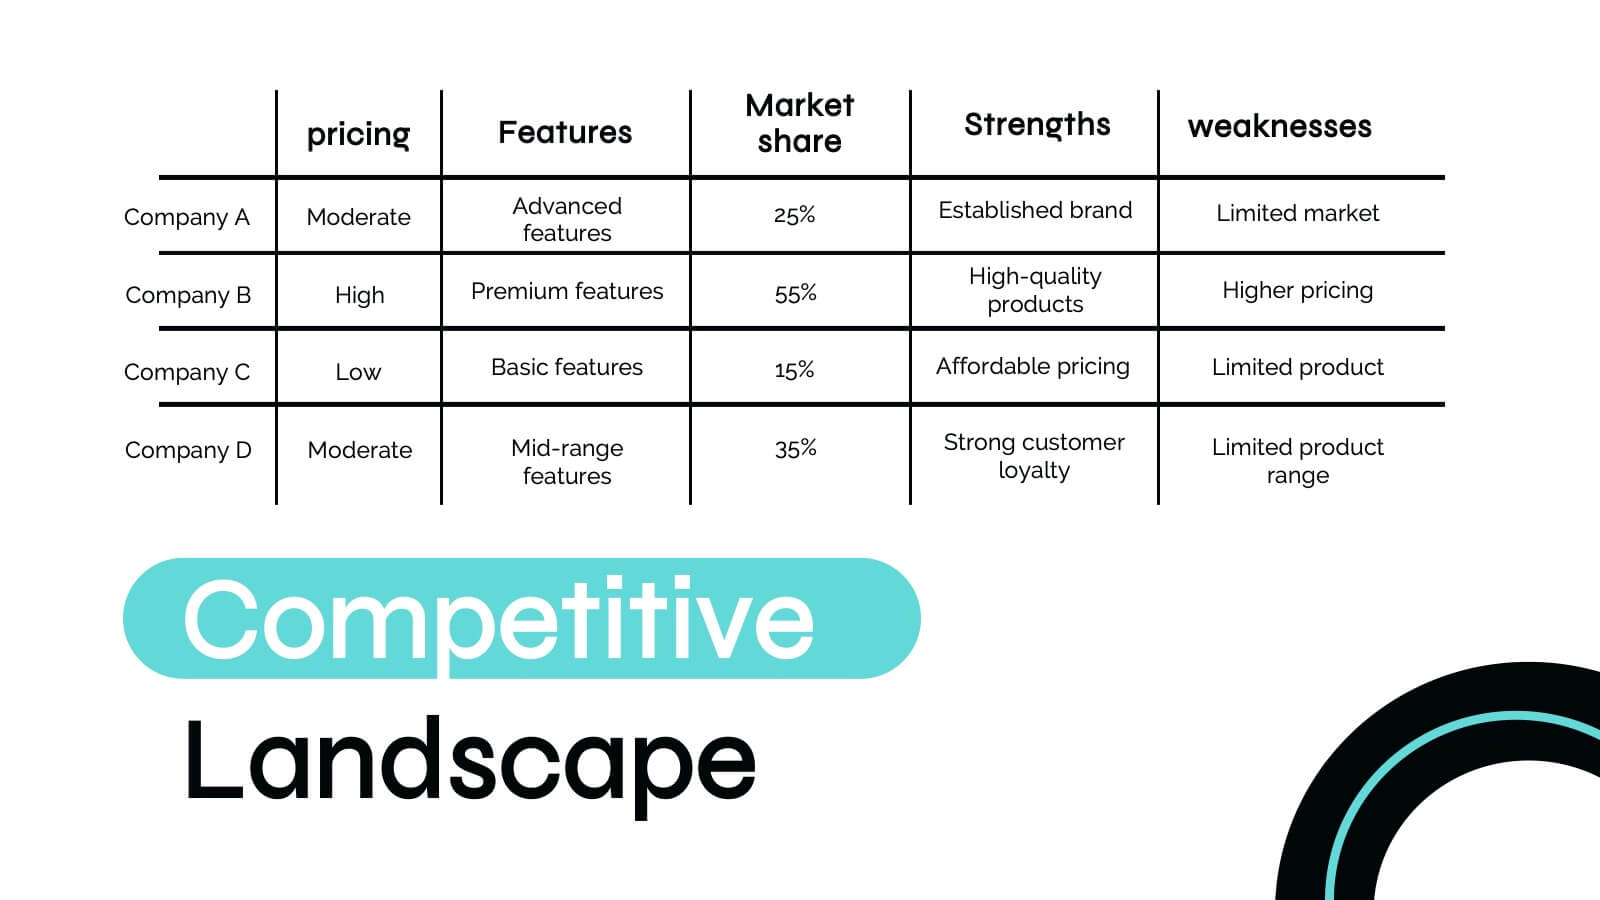
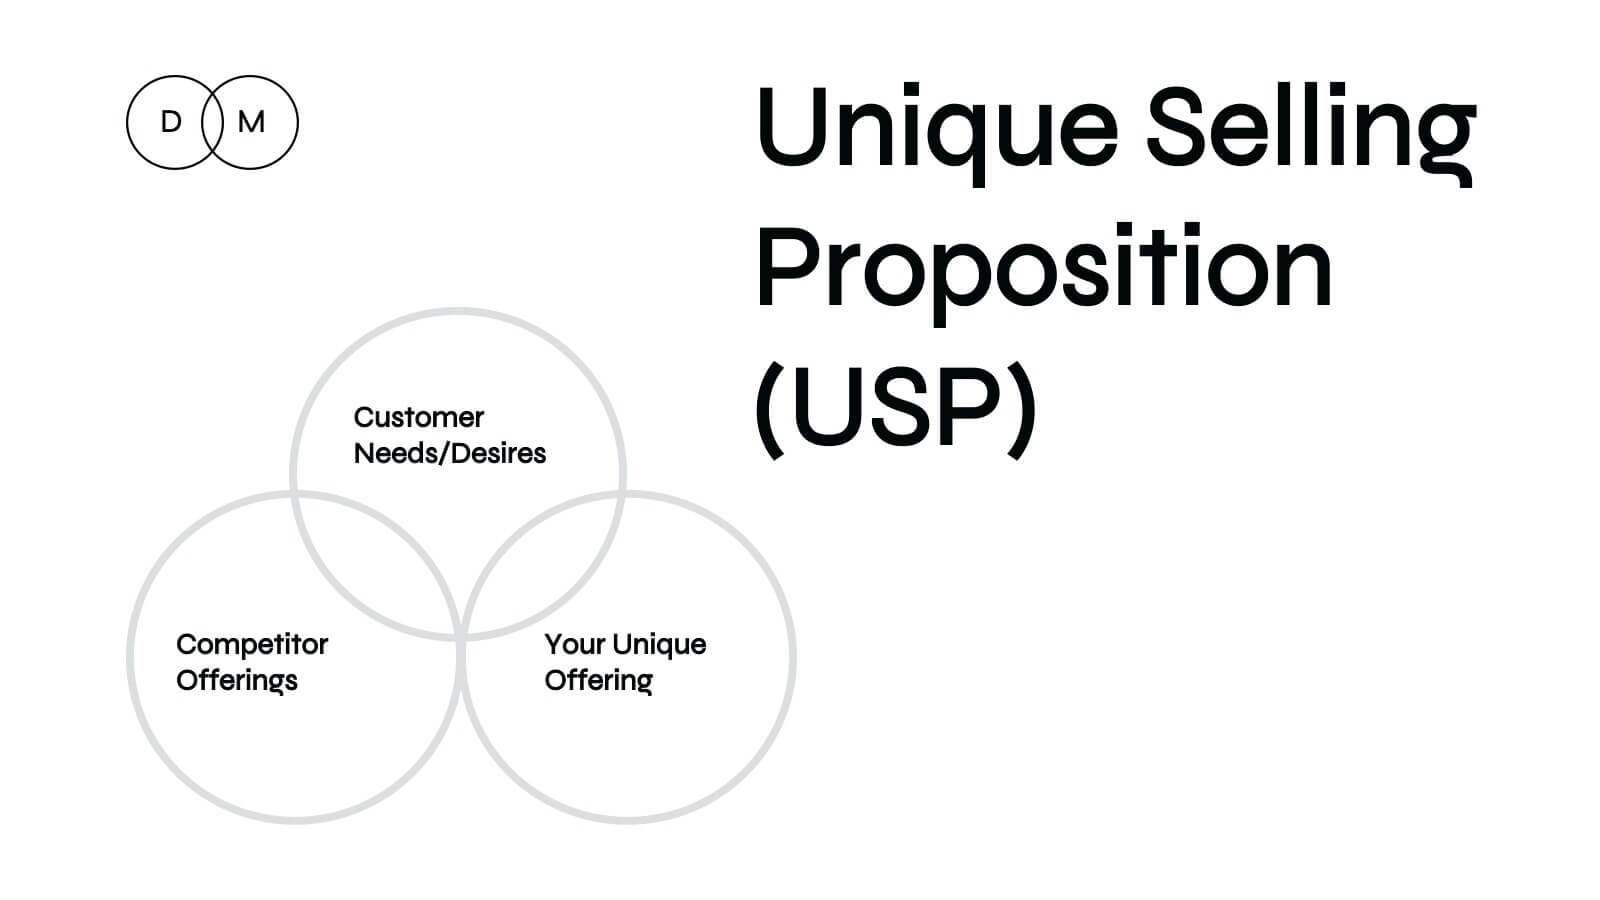
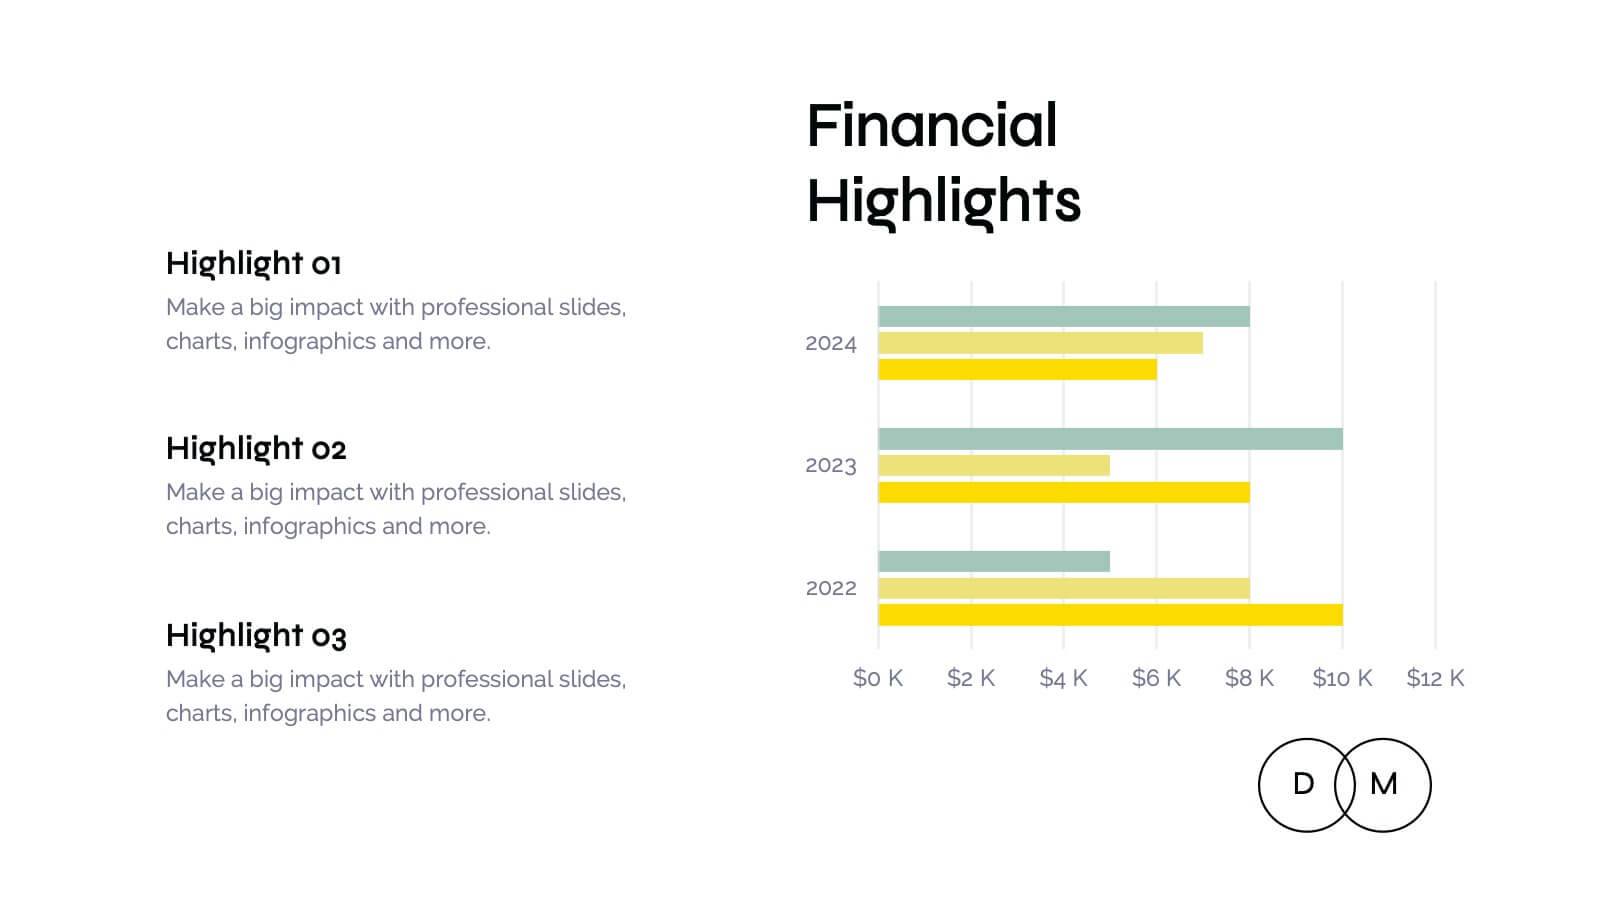
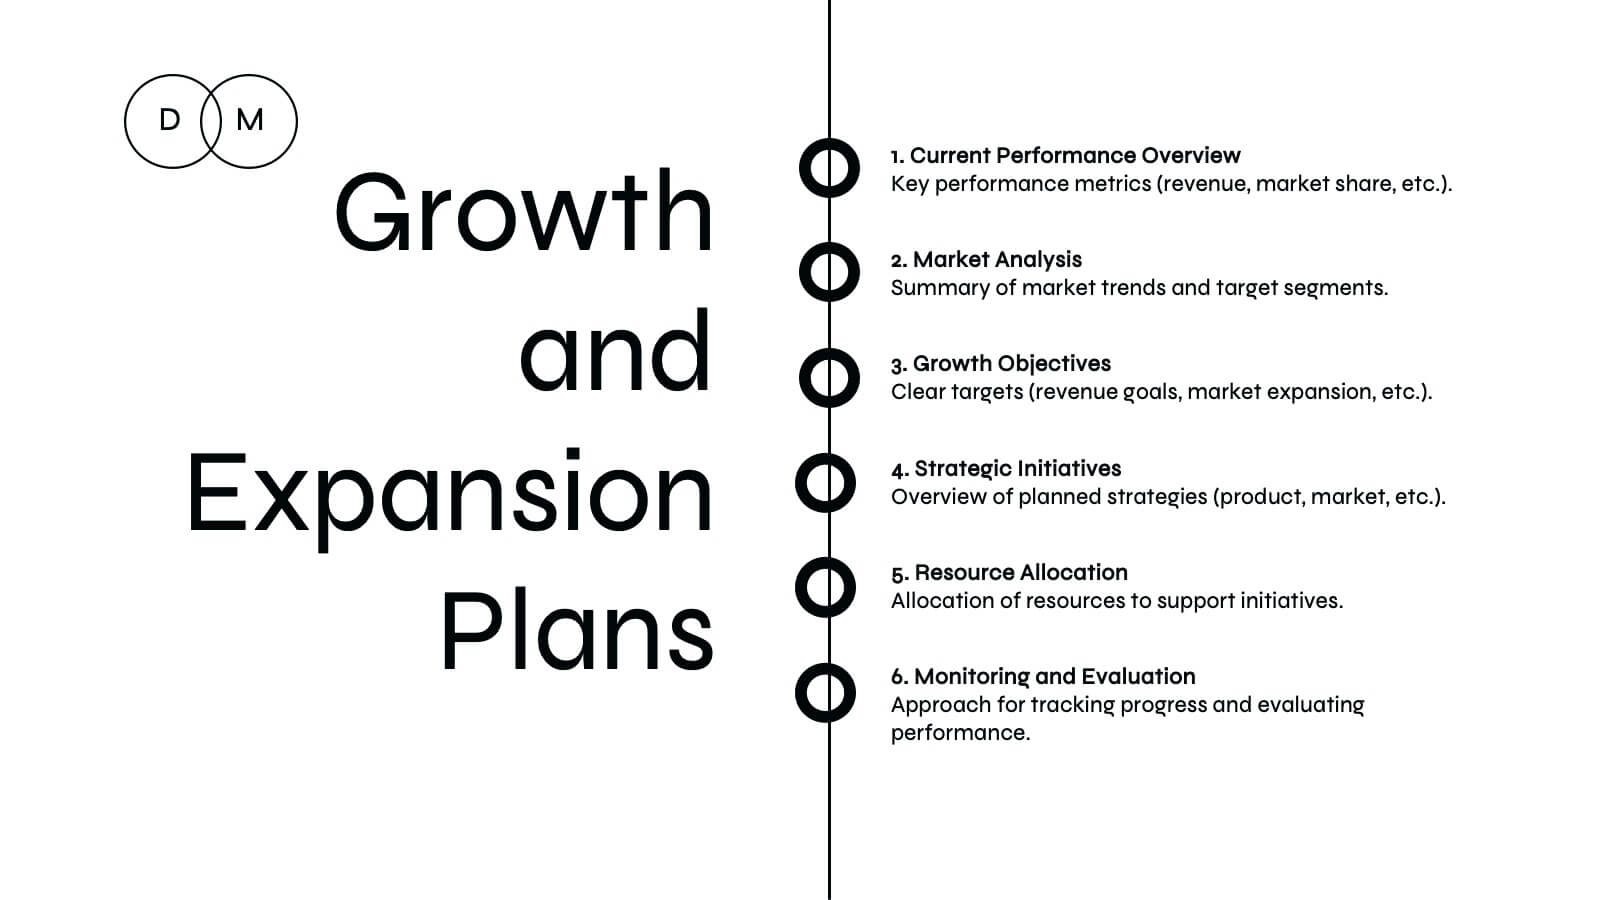
Hercules Digital Marketing Strategy Plan Presentation
Ignite your next marketing presentation with this bold, dynamic template that showcases every key element of your marketing strategy! From company history and target audience insights to competitive landscape analysis, this design makes presenting your marketing message a breeze. Perfect for professionals, it’s fully compatible with PowerPoint, Keynote, and Google Slides for seamless usage across platforms.


20 slides
Egeria Artist Portfolio Presentation
Showcase your artistry with this vibrant portfolio template, featuring sections for project displays, creative process, awards, and testimonials. Perfect for artists seeking a polished presentation of their work. Customizable and suitable for PowerPoint, Keynote, and Google Slides, this template highlights your unique style and professional journey.


23 slides
Ignifis Investor Pitch Presentation
Capture investor interest with this dynamic and professional pitch deck presentation template. It includes essential slides such as company overview, problem statement, revenue model, competitive landscape, financials, and growth projections. Designed for clarity and impact, it's fully customizable and perfect for securing funding. Compatible with PowerPoint, Keynote, and Google Slides.


21 slides
Kyanite Small Business Pitch Deck Presentation
Make your business pitch stand out with this vibrant and engaging presentation! Featuring sections like project overviews, team updates, performance metrics, and collaboration opportunities, it helps convey your ideas with clarity and impact. Whether for internal reviews or investor pitches, this template works seamlessly with PowerPoint, Keynote, and Google Slides.


5 slides
End-to-End Process Flow Framework Presentation
Visualize your operations from start to finish with the End-to-End Process Flow Framework Presentation. This clean, arrow-based layout is perfect for outlining workflows, project stages, or business processes step by step. Fully customizable in Canva, PowerPoint, and Google Slides to suit any team or strategic need.


5 slides
Interlocking Puzzle Infographic Presentation
Visually connect ideas with the Interlocking Puzzle Infographic. This design is perfect for illustrating processes, relationships, and key concepts that fit together seamlessly. Whether you're presenting business strategies, project workflows, or educational content, this template enhances clarity and engagement. Fully customizable and compatible with PowerPoint, Keynote, and Google Slides.


6 slides
Sustainability Goals and Metrics Presentation
Bring your eco-initiatives to life with a presentation that blends purpose and clarity. Ideal for showcasing environmental goals, progress metrics, and sustainability strategies, this clean design helps communicate impact with confidence. Fully editable and compatible with PowerPoint, Keynote, and Google Slides for seamless customization and professional results.


2 slides
Thank You Page for Final Impressions Presentation
Leave a lasting impression with a bold, modern layout that speaks professionalism and clarity. This presentation template is designed to wrap up your message with impact, offering space for contact details and a short message of appreciation. It’s fully editable and works seamlessly in PowerPoint, Keynote, and Google Slides.


8 slides
Environmental and Social Sustainability
Showcase your sustainability efforts with this layered pyramid slide, perfect for visualizing tiered environmental or social responsibility strategies. Ideal for ESG reporting, sustainability workshops, or stakeholder presentations. Fully customizable in PowerPoint, Keynote, and Google Slides to match your brand and message.


2 slides
Stylish Title Cover Presentation for Reports Presentation
Set the tone with a title slide that means business—without being boring. This stylish cover layout gives your report presentations a polished, modern look while keeping the focus clear and professional. Ideal for executive updates or client-facing decks, it’s fully editable and works perfectly in PowerPoint, Keynote, and Google Slides.


21 slides
Versa Product Development Plan Presentation
Bring your product ideas to life with this sleek and professional presentation template. It covers every stage of the development process: from product overviews, features, and competitive analysis to pricing strategies, marketing plans, and technical specifications. Visually striking sections like distribution channels and production processes ensure a clear and structured roadmap for your team and stakeholders. Fully customizable and compatible with PowerPoint, Keynote, and Google Slides.


4 slides
Data Analytics Heat Map Presentation
Turn complex data into clear insights with this dynamic heat map template! Ideal for visualizing trends, risks, or performance metrics, this design enhances decision-making at a glance. With fully customizable elements, it simplifies data analysis for business, finance, or research. Compatible with PowerPoint, Keynote, and Google Slides for seamless use.