


Features
- 4 Unique slides
- Fully editable and easy to edit in Microsoft Powerpoint, Keynote and Google Slides
- 16:9 widescreen layout
- Clean and professional designs
- Export to JPG, PDF or send by email


Do you have any questions?
Recommend


5 slides
Law and Justice Education Infographics
Law and Justice play a critical role in ensuring that people are treated fairly and that their rights are protected. This unique vertical Infographic template is designed to visually present information about legal education and the justice system. The template includes various graphics, charts, and icons that can be customized to fit your specific data and message. Use this to cover different topics related to law and justice, such as legal education, the court system, criminal justice, and more. The infographics are designed to make your information easy to understand and visually appealing.


6 slides
Relationship Compatibility Infographic
Relationship compatibility refers to the degree to which two individuals are well-suited for each other in a relationship. This infographic can be a fun and informative way to explore the compatibility between individuals in a relationship. This template is designed to help individuals gain a better understanding of their relationships and make informed decisions about their interactions with others. Compatible with Powerpoint, Keynote, and Google Slides. The combination of visual elements and informative content can make this topic engaging and accessible. Making it easy for readers to navigate and understand the content.


7 slides
Business Pricing Table Slides Infographic
Streamline your product offerings with our Business Pricing Infographic, designed to clearly present pricing tiers and package options. This infographic is essential for sales teams, marketing professionals, and business owners to communicate value propositions to potential customers. Our Business Pricing Infographic allows for a clean, comparative view of different pricing plans, showcasing features, benefits, and cost-effectiveness at a glance. It includes customizable sections for various packages, making it easy to distinguish between basic, standard, and premium options. With this tool, you can highlight key differences and unique selling points of each package, aiding customers in making informed purchasing decisions. This SEO-friendly infographic is crafted to attract and educate potential buyers, providing them with transparent pricing information. Adopt this infographic in your marketing materials to facilitate a straightforward shopping experience, helping customers choose the right product that fits their needs and budget.


7 slides
Big Data Tools Infographic
Big Data refers to large volumes of data, both structured and unstructured, that inundate a business or organization on a day-to-day basis. This infographic template is designed to captivate, educate, and empower, providing a bold and clear representation of the sheer magnitude and impact of big data. Compatible with Powerpoint, Keynote, and Google Slides. This template involves processing and analyzing Big Data to extract meaningful insights, patterns, and trends. These insights can be used for business intelligence, decision-making, research, and various other applications across different domains and industries.


21 slides
Mystara Project Status Report Presentation
Keep stakeholders informed with this clean and professional project status report template. Cover key areas such as performance metrics, financial summaries, team productivity, and future priorities. Perfect for tracking progress and making data-driven decisions. Fully customizable for PowerPoint, Keynote, and Google Slides.


5 slides
Risk Detection Techniques Presentation
Spot potential risks before they escalate with this step-by-step risk detection visual. Featuring ascending block elements and a dynamic layout, this template is ideal for illustrating detection stages or evaluation metrics. Fully editable in PowerPoint, Keynote, and Google Slides—perfect for risk management, audit reports, or compliance presentations.


5 slides
Enterprise IT System Design Presentation
Create a professional Enterprise IT System Design presentation with this structured diagram. Ideal for showcasing IT infrastructure, system architecture, data flow, and integration strategies, this fully customizable template is compatible with PowerPoint, Keynote, and Google Slides.


22 slides
Sky Drop Full-Service Agency Project Plan Presentation
Step into the world of strategic creativity with the Sky Drop Agency Project Plan template! Designed for modern agencies looking to impress clients and stakeholders, this template offers a sleek and professional design that highlights your agency's strengths, processes, and successes. With dedicated sections for mission and vision, team introduction, services, and client testimonials, this template provides a comprehensive overview of your agency's capabilities. It's perfect for showcasing case studies, market analysis, and future outlooks, helping you to build trust and establish credibility. Whether you're presenting a new project plan or updating clients on progress, this template ensures your information is communicated clearly and effectively. Fully customizable and compatible with PowerPoint, Keynote, and Google Slides, the Sky Drop template is your go-to for creating presentations that leave a lasting impact. Impress your audience and elevate your agency's brand with this powerful presentation tool!


10 slides
5-Level Circular Diagram Presentation
Visualize complex concepts with this professional 5-Level Circular Diagram template. Perfect for business strategies, project planning, and hierarchical structures, it provides a clear, layered approach. Fully editable and compatible with PowerPoint, Keynote, and Google Slides, this design ensures a polished, impactful presentation with structured, easy-to-understand visuals.


6 slides
Smile Book Rating Infographics
Discover the captivating world of book ratings with Smile! This infographic is your gateway to understanding how to assess and rate books, offering insights into why and how to share your opinions effectively. Delve into the process of rating books with Smile, grasping the importance of thoughtful and honest ratings. Learn how your ratings contribute to helping fellow readers find their next favorite book and provide valuable support to authors. Explore the art of crafting detailed and constructive book reviews. Dive into the elements of a compelling review, covering aspects like plot, characters, and the moments that brought a smile (or provoked other emotions) while reading. Equip yourself with the skills to articulate your thoughts effectively. With this engaging infographic, compatible with PowerPoint, Keynote, and Google Slides, sharing your book ratings and reviews is a breeze. Empower yourself with the knowledge to become an influential book reviewer. Immerse yourself in the world of book ratings with Smile, embarking on a journey of literary exploration and appreciation.


5 slides
Innovation & IT Solutions Presentation
Spark fresh ideas with a slide designed to showcase technology, creativity, and strategic thinking in a clear, modern layout. Use it to break down IT processes, highlight innovative solutions, and communicate complex concepts with ease. Clean icons and thoughtful structure keep everything engaging. Fully compatible with PowerPoint, Keynote, and Google Slides.


11 slides
Sales Dashboards Infographic
A sales dashboard is a visual representation of sales data and key performance indicators (KPIs) that provides a quick and comprehensive view of a company's sales performance and related metrics. Step into the fast-paced world of sales with our sales dashboards infographic template. It's your compass for charting the course to success in the dynamic realm of sales, providing a visual guide that transforms data into actionable insights. This infographic is designed to to track progress towards sales goals, identify trends, and optimize strategies to improve sales performance. Compatible with Powerpoint, Keynote, and Google Slides.


21 slides
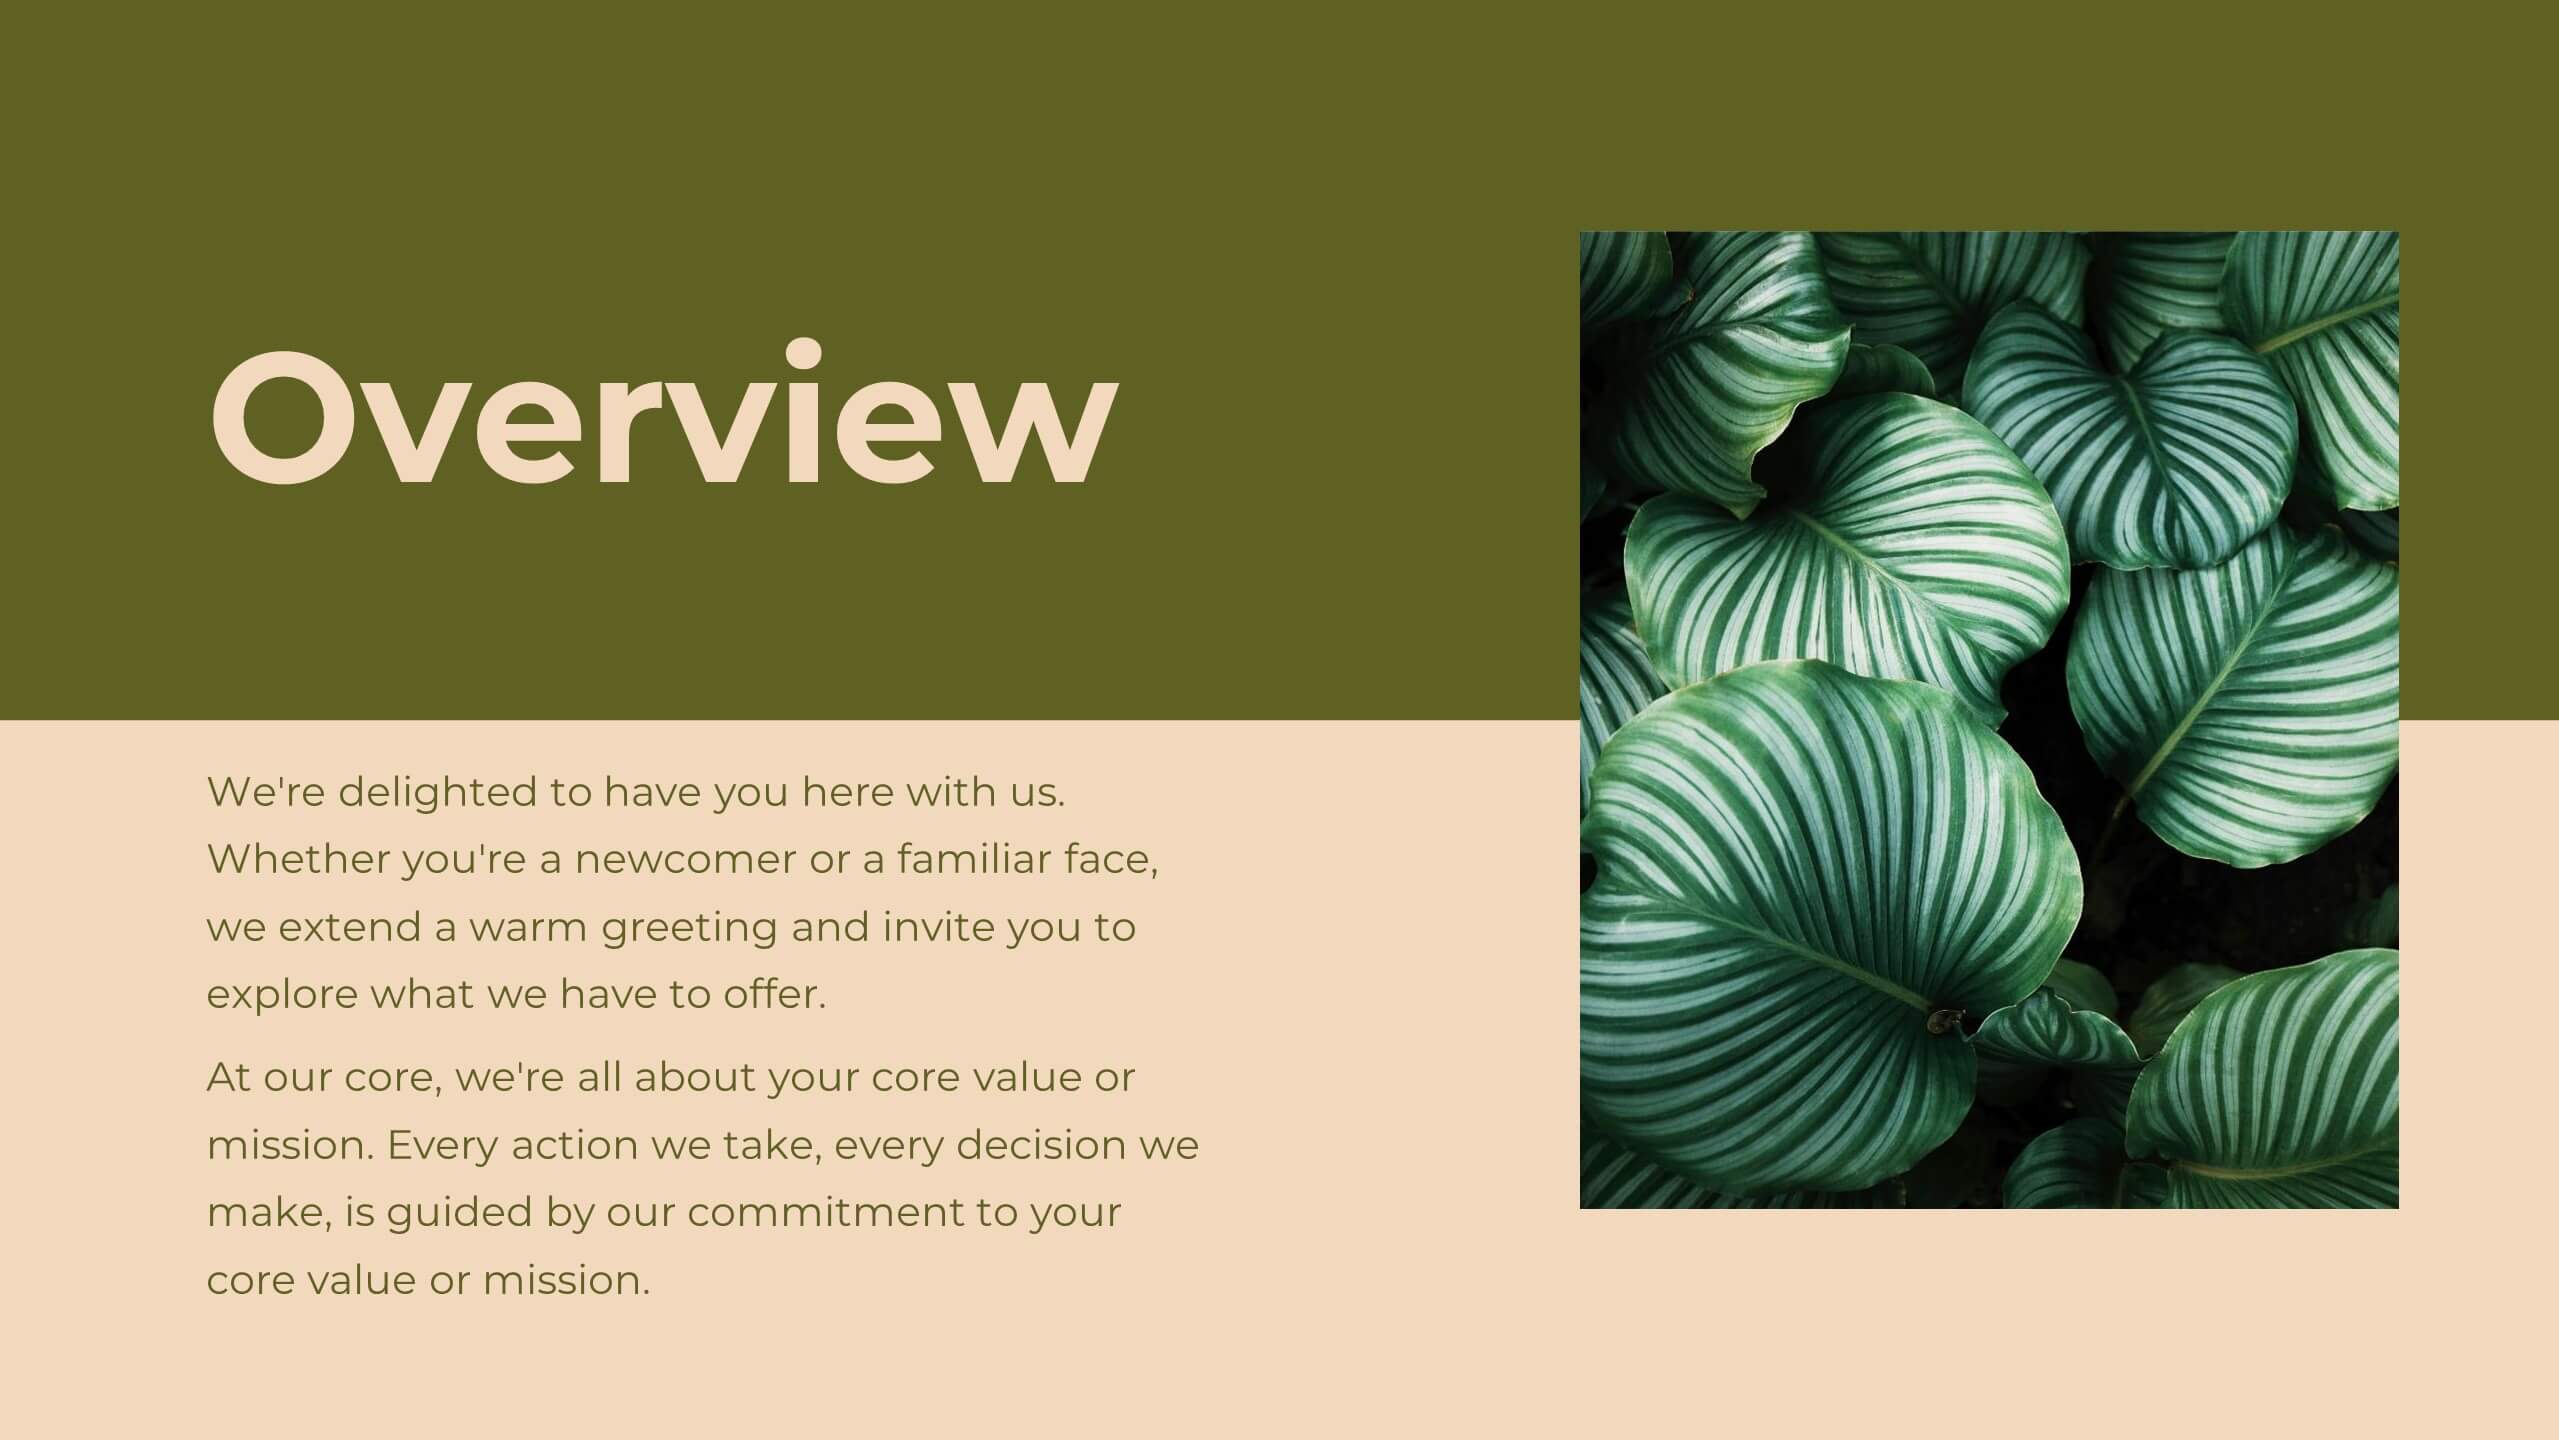
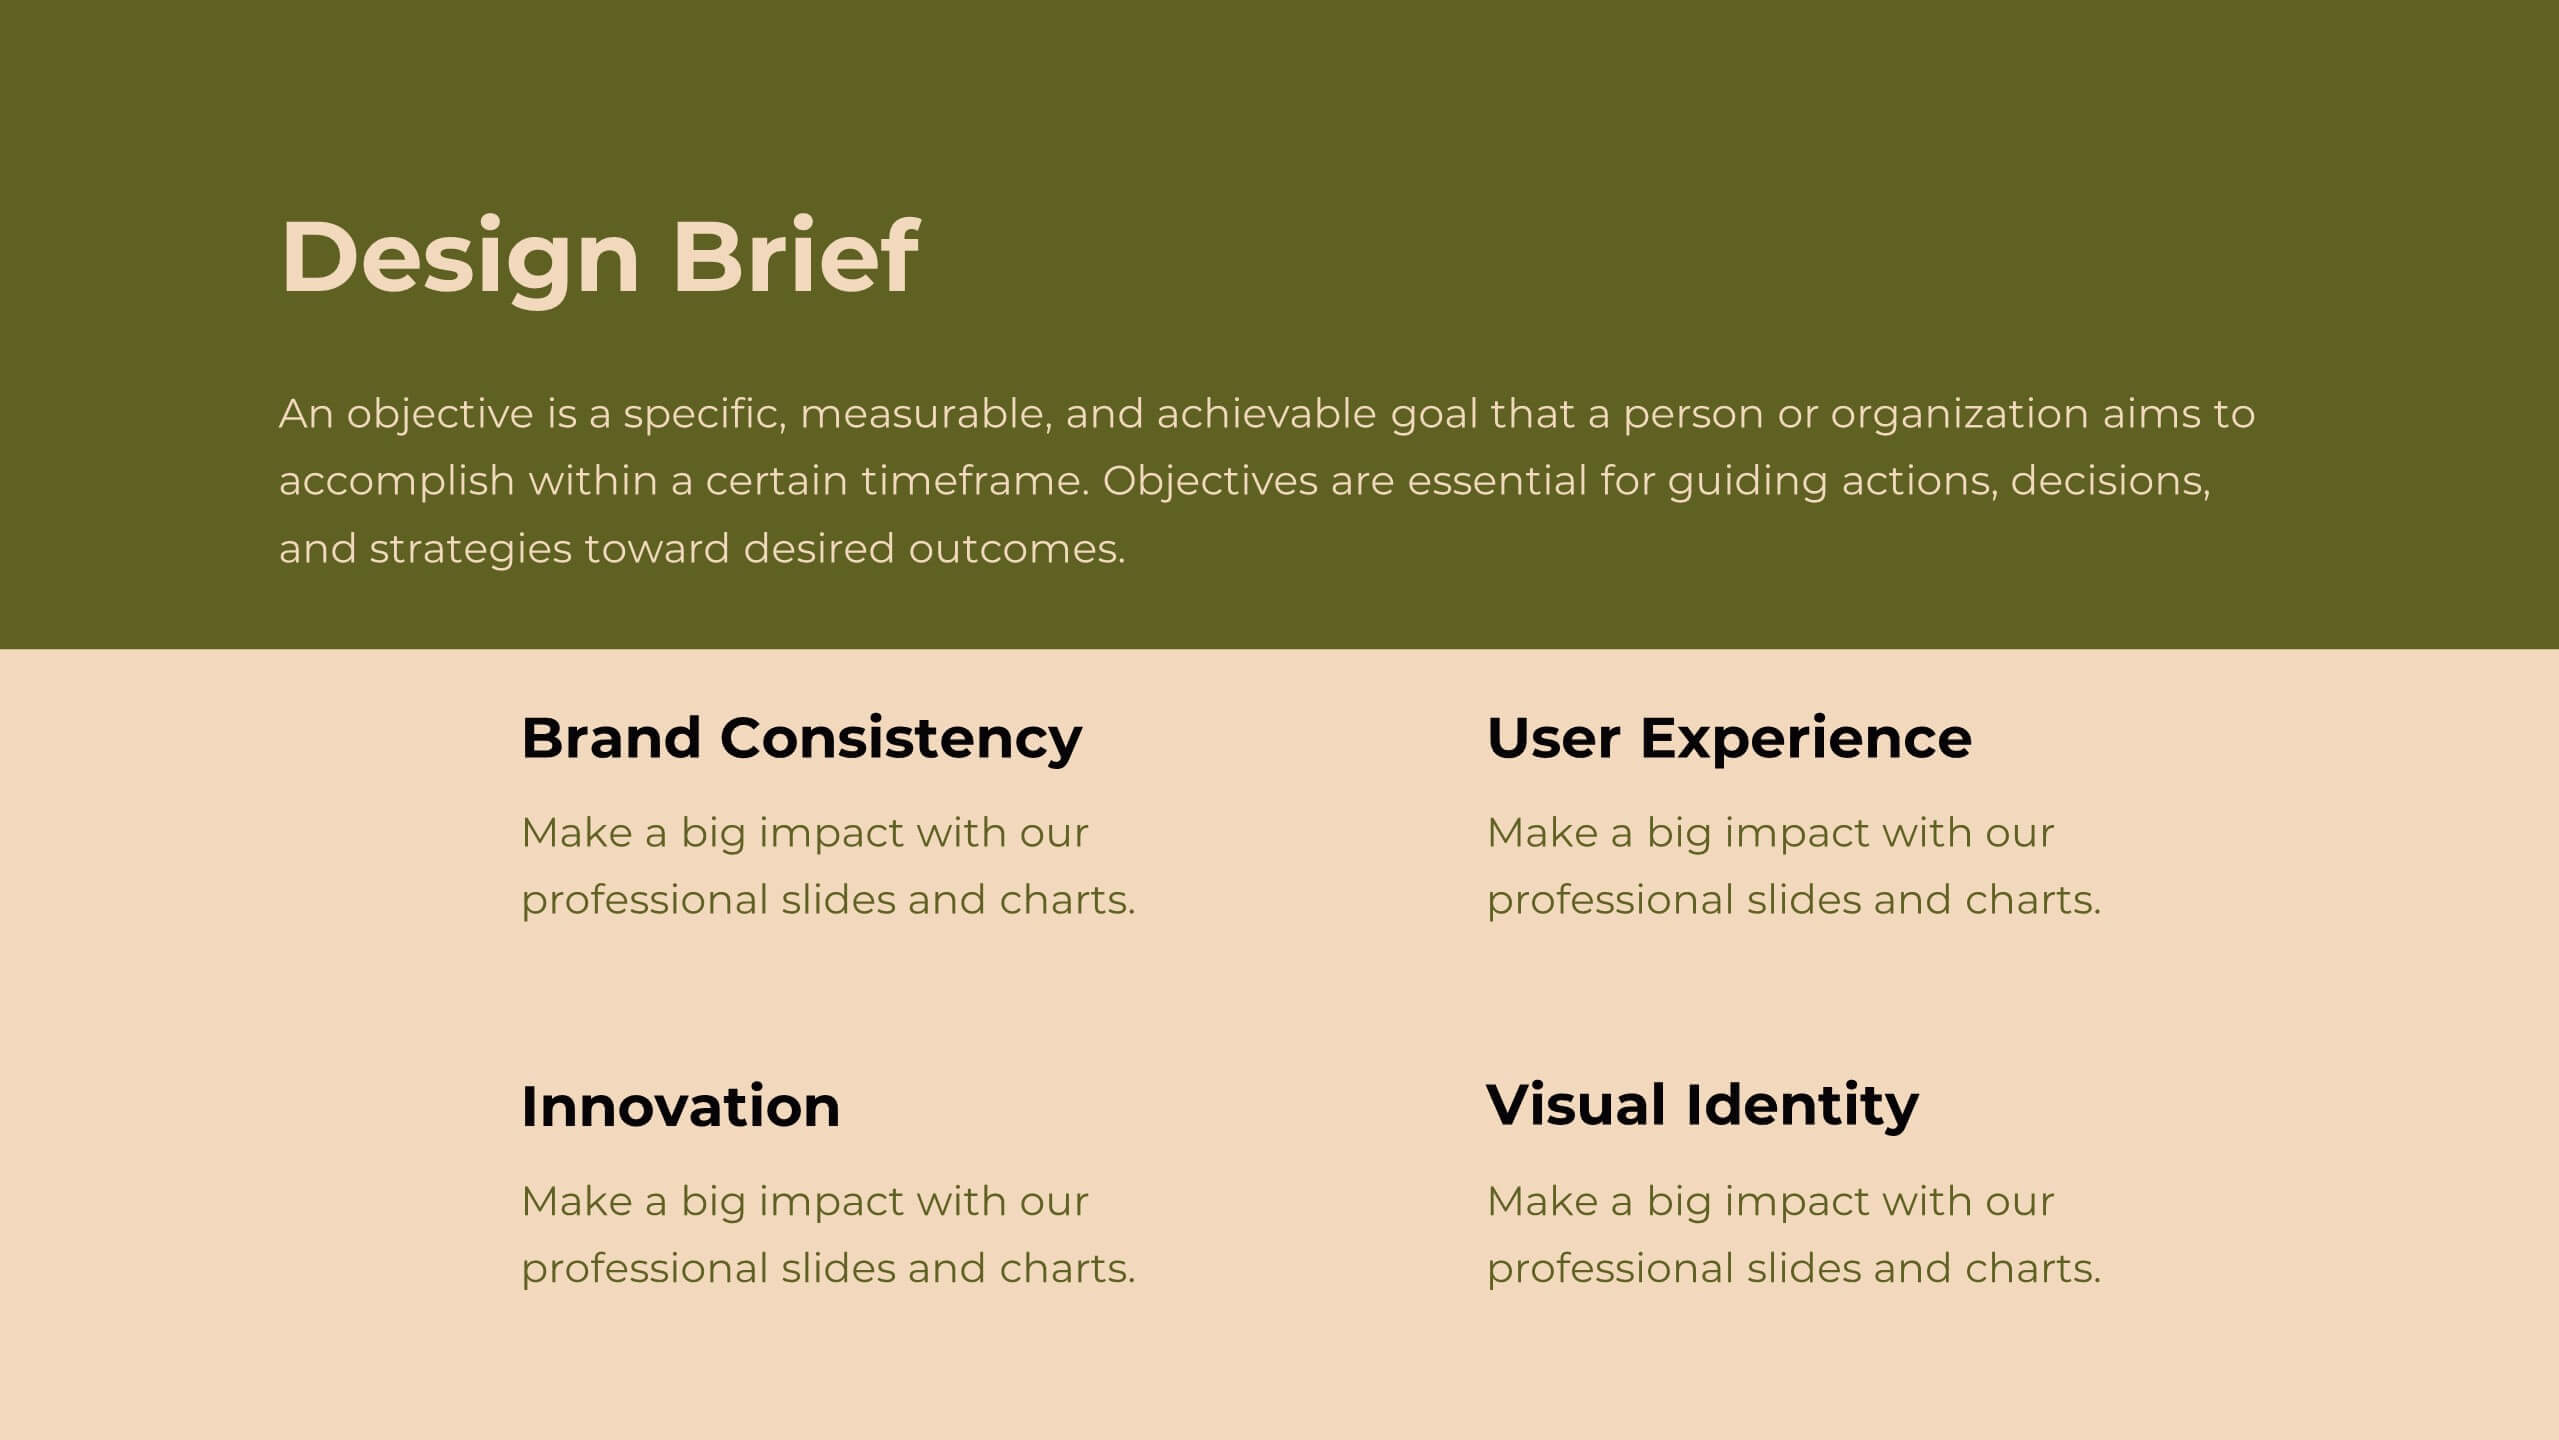
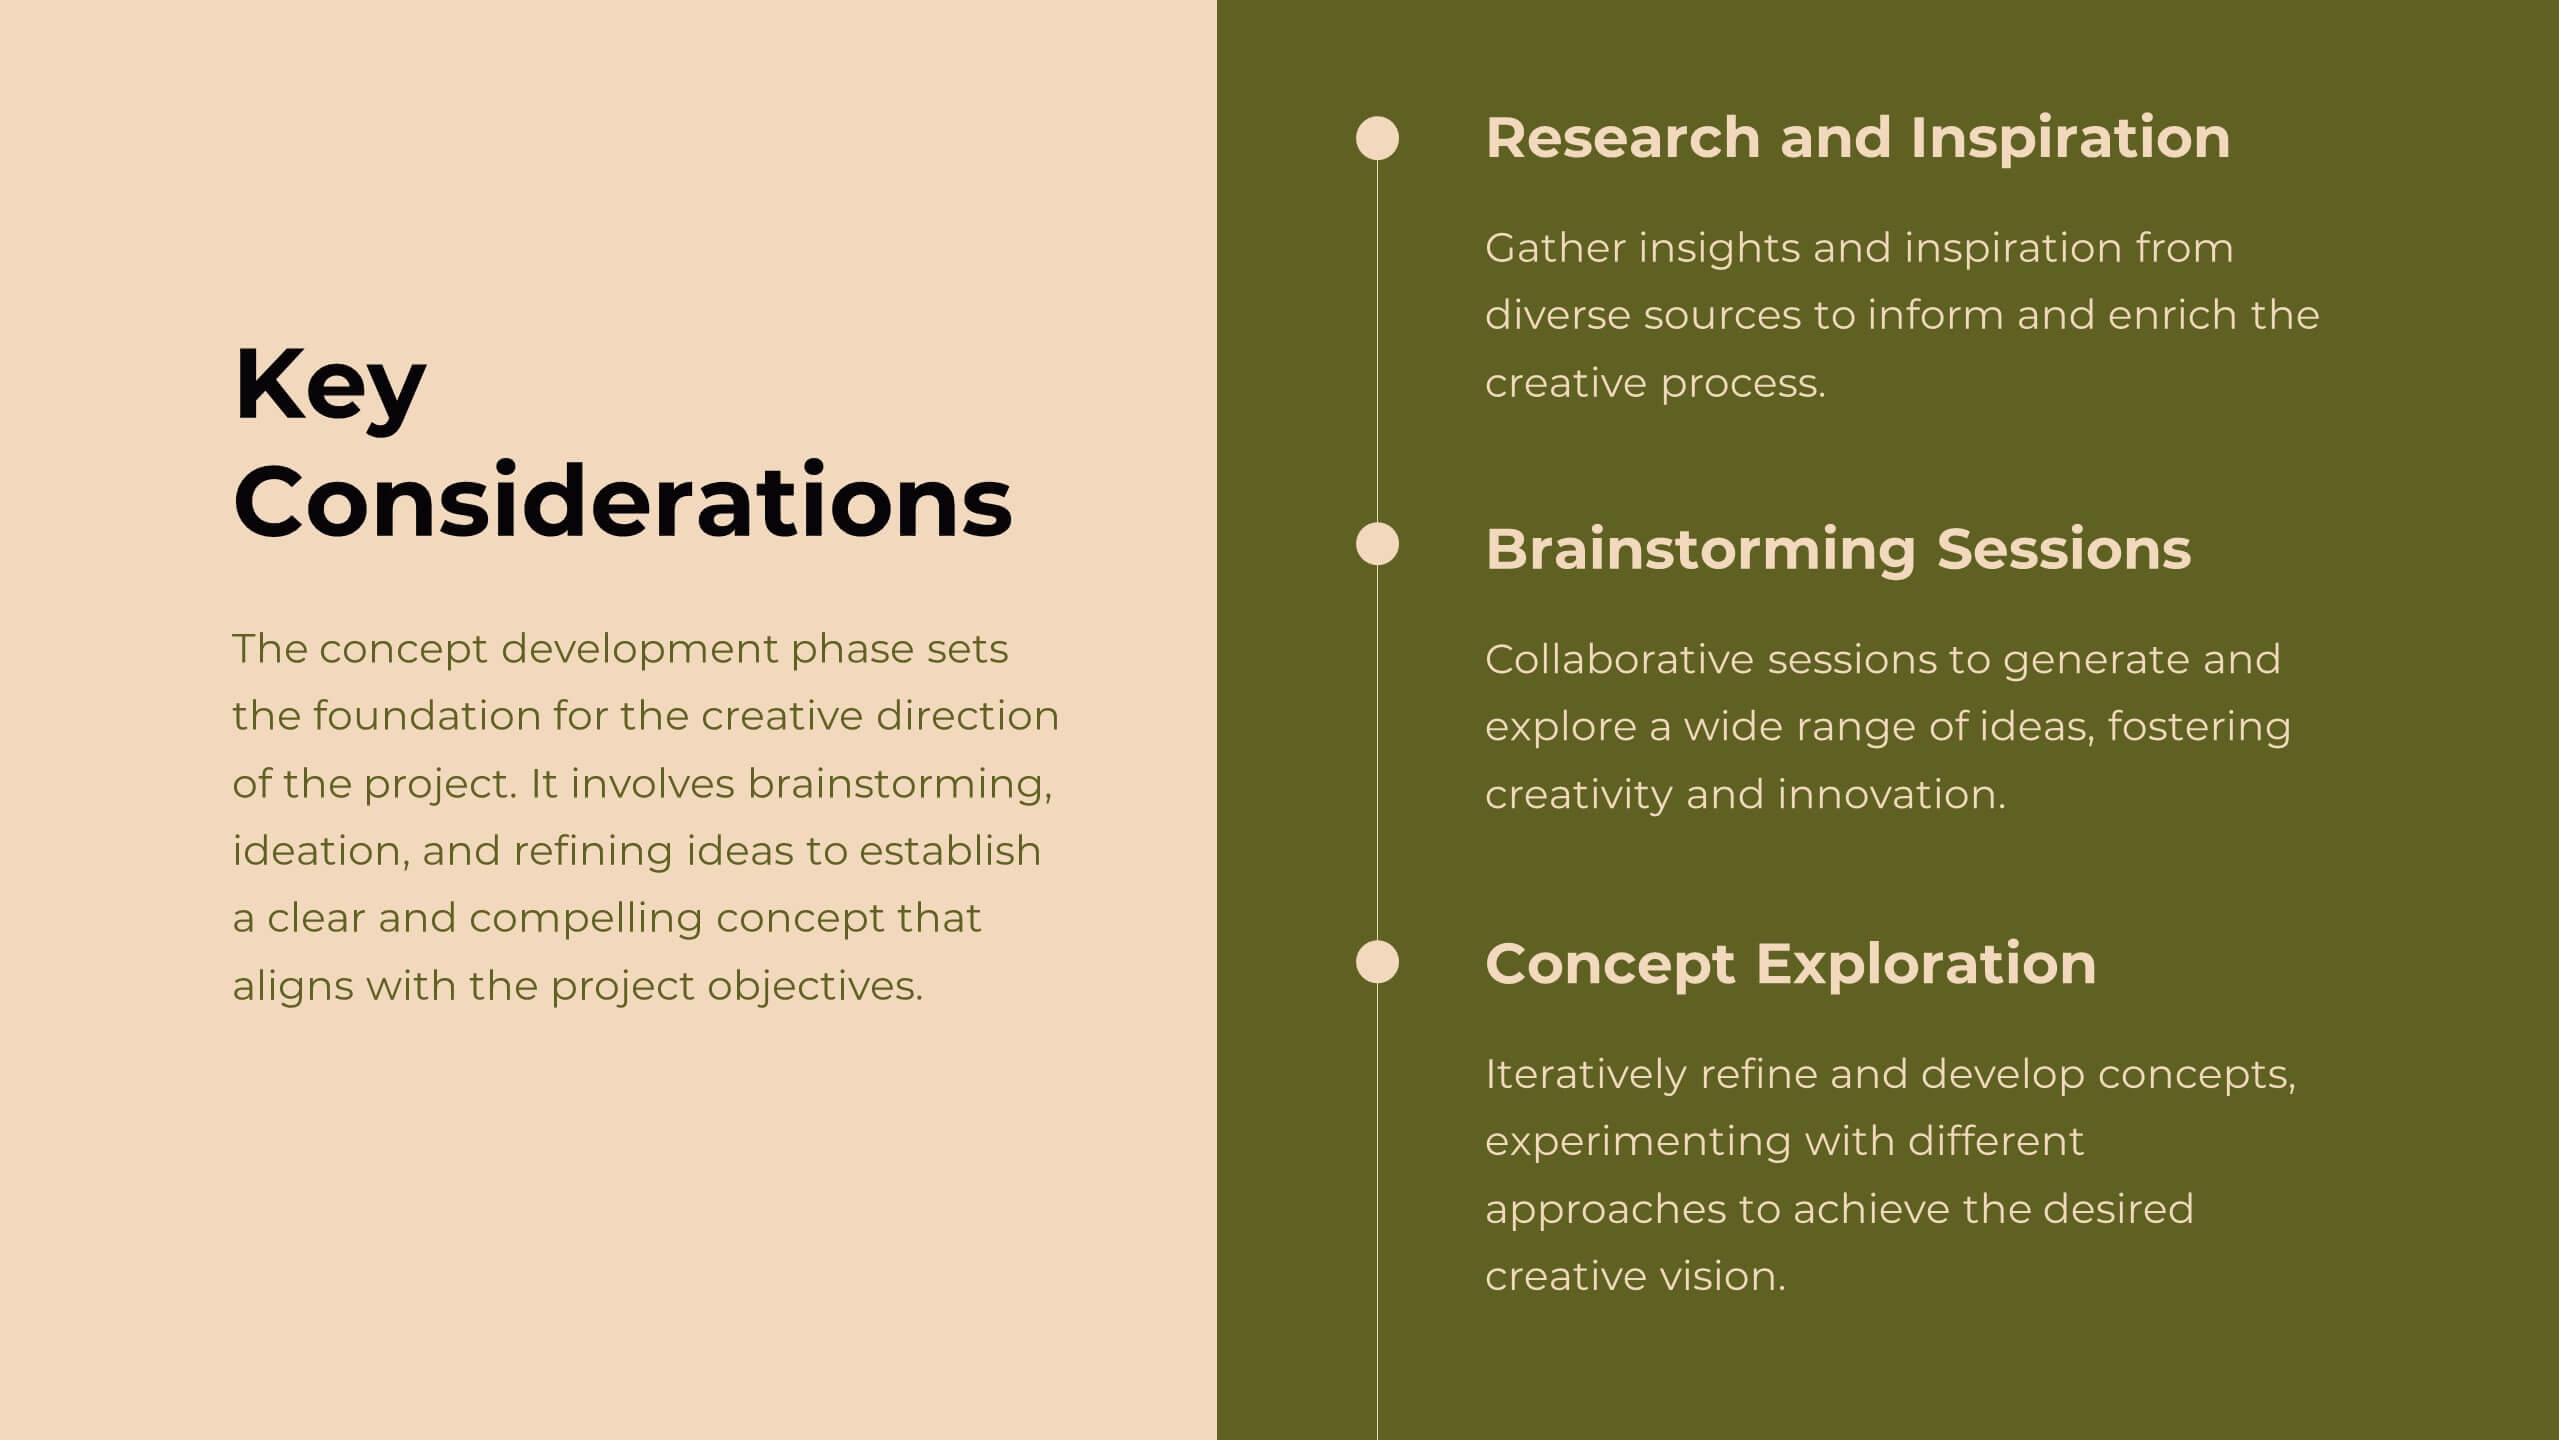
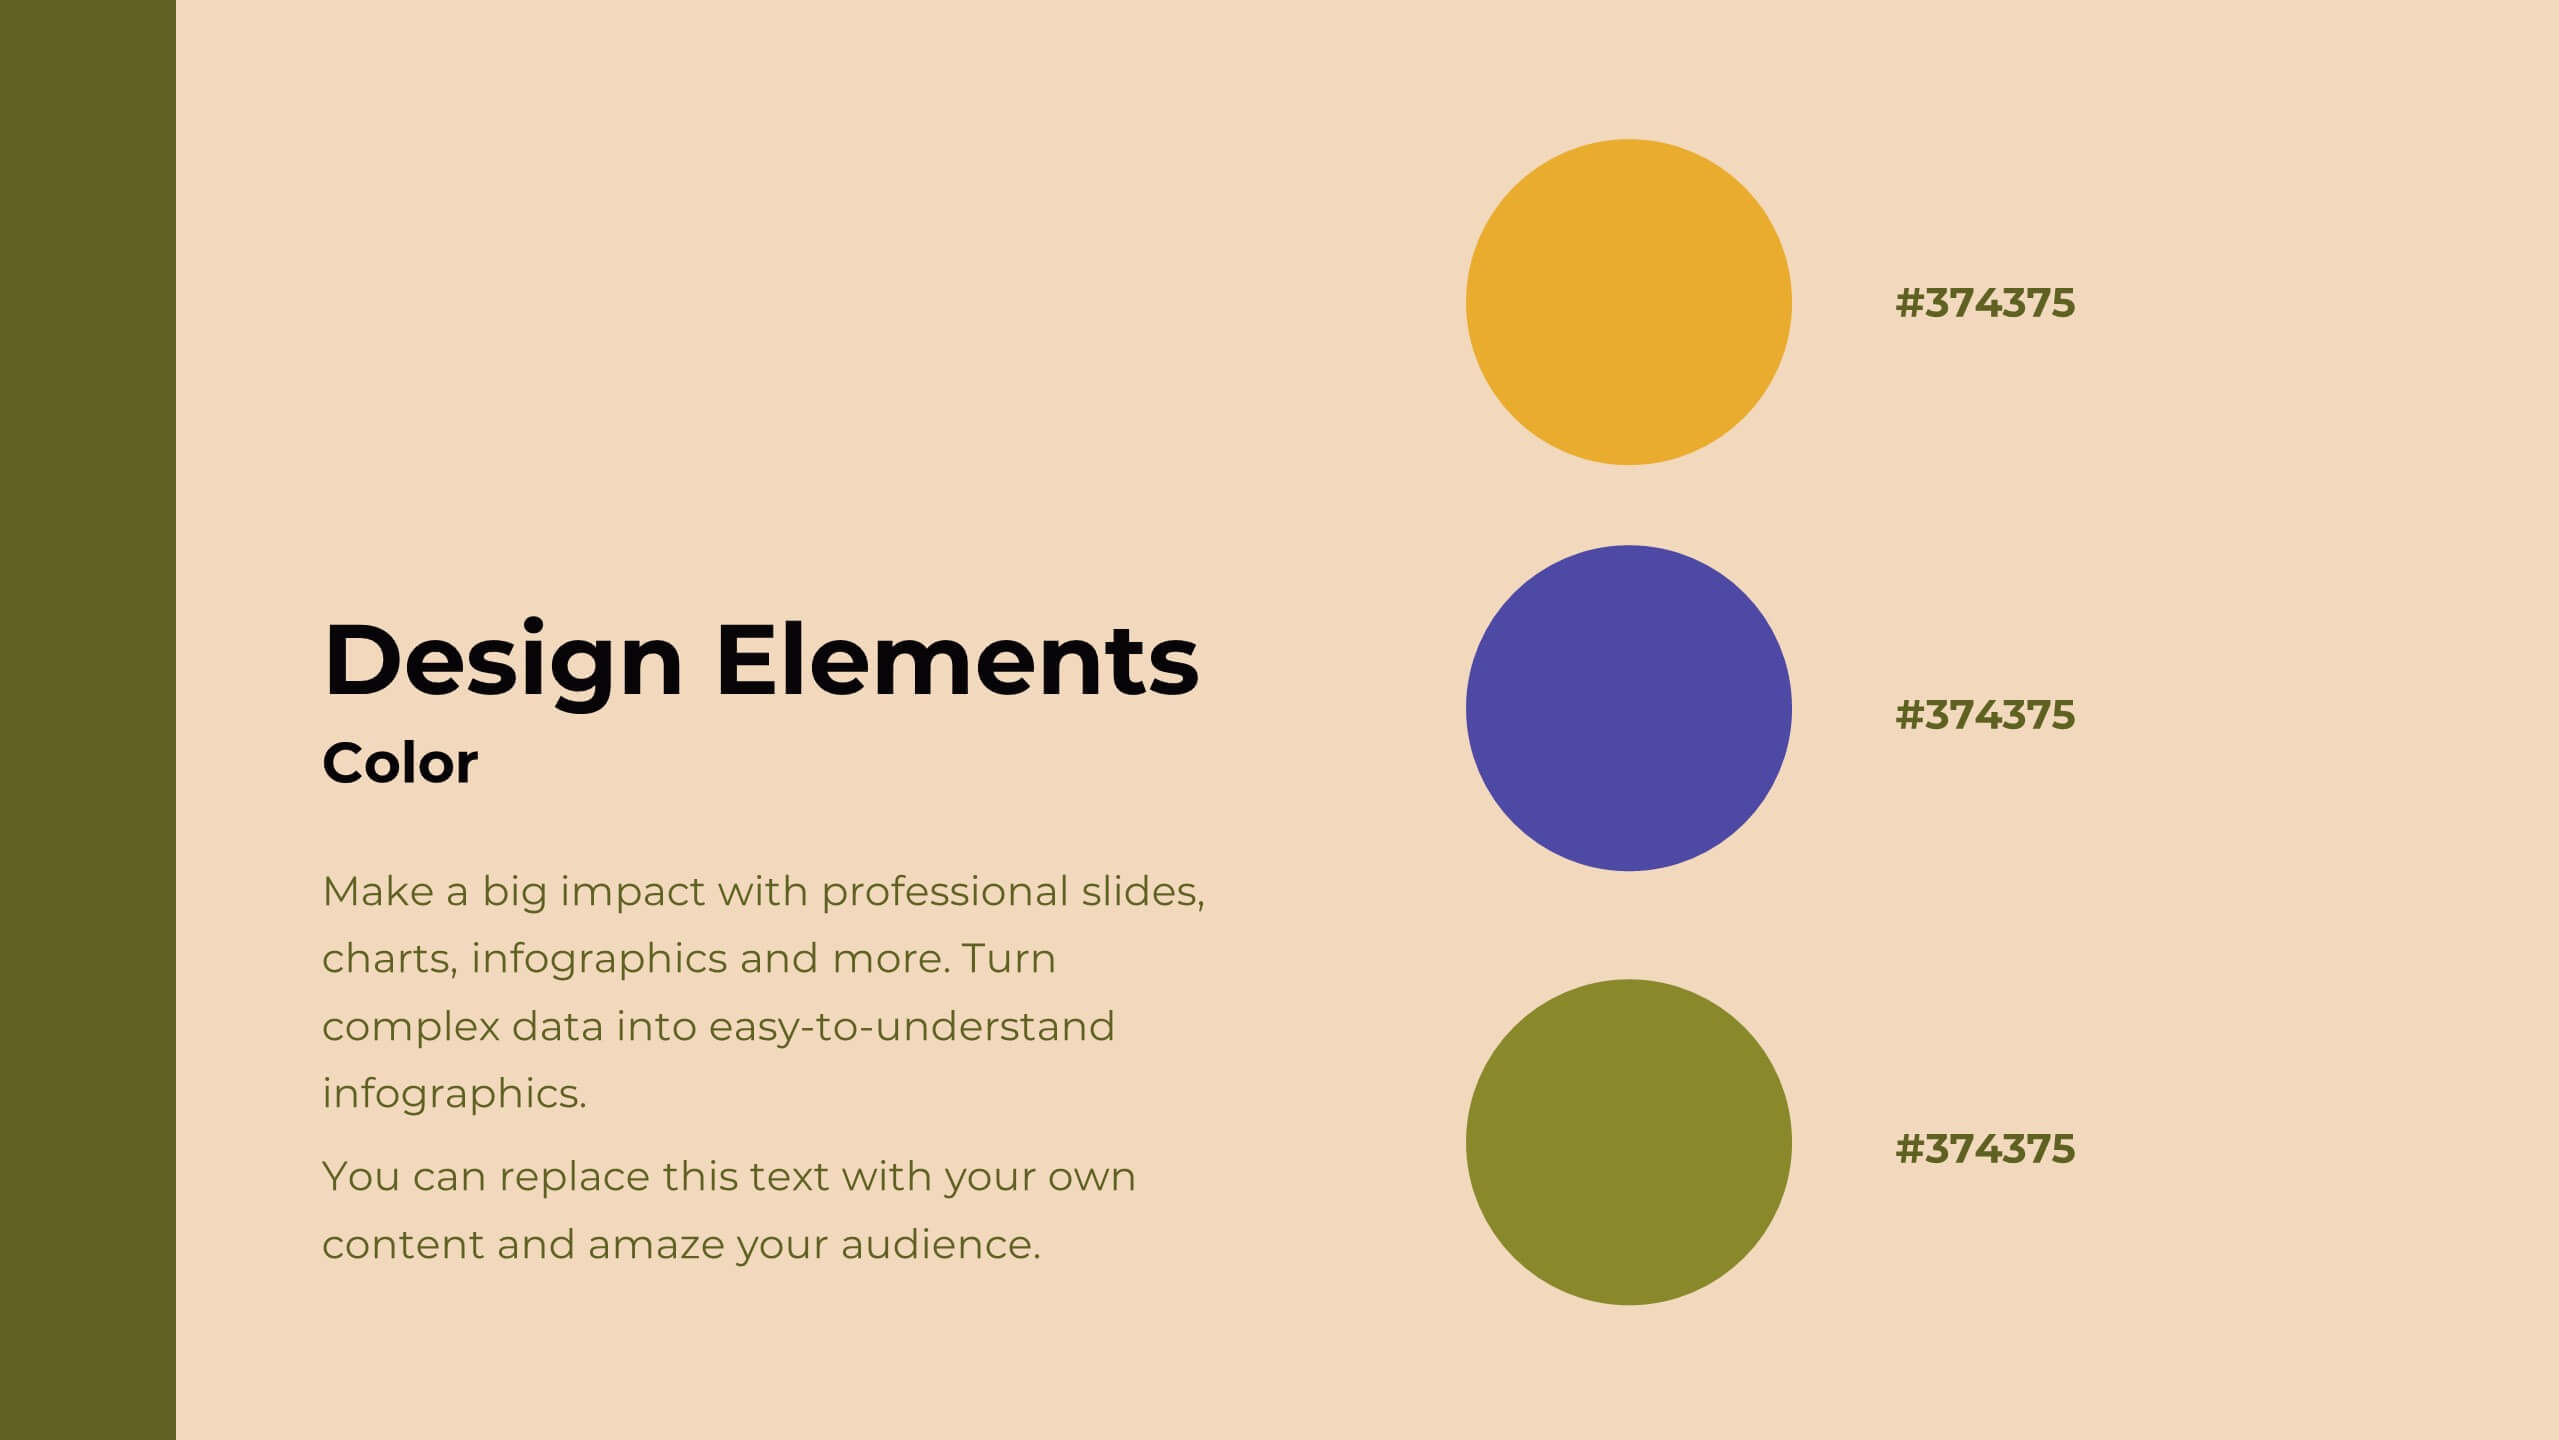
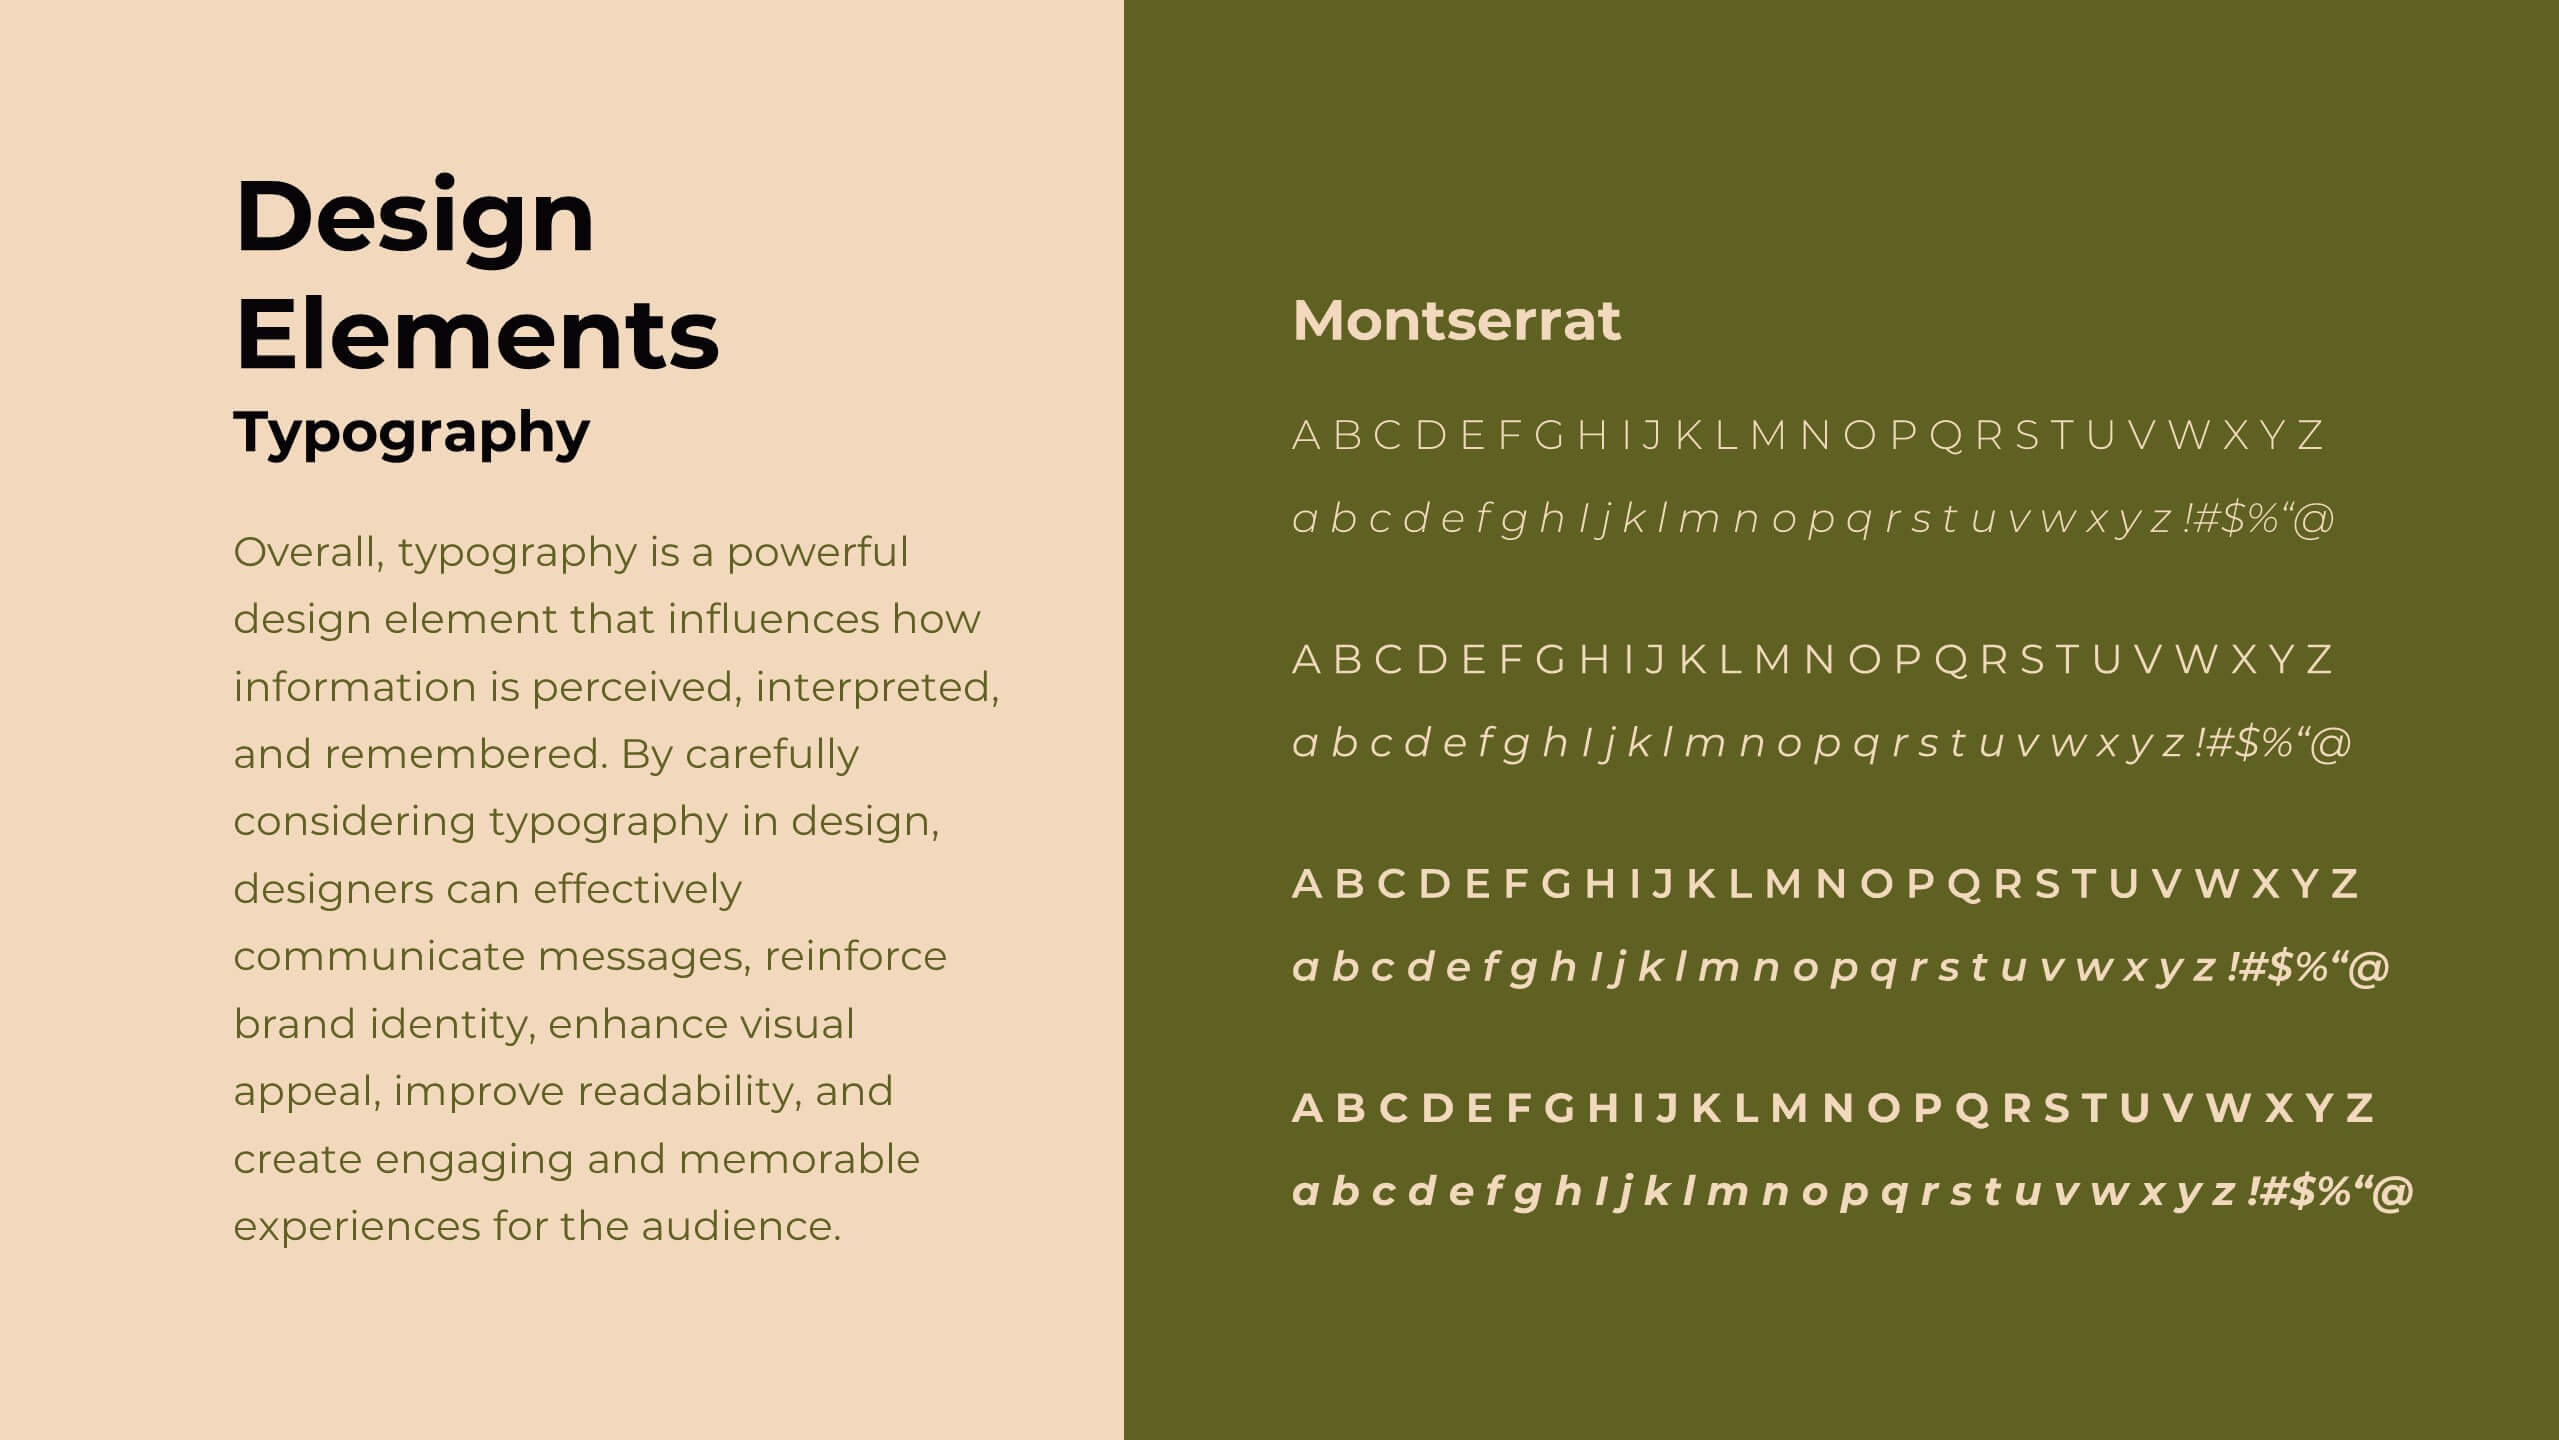
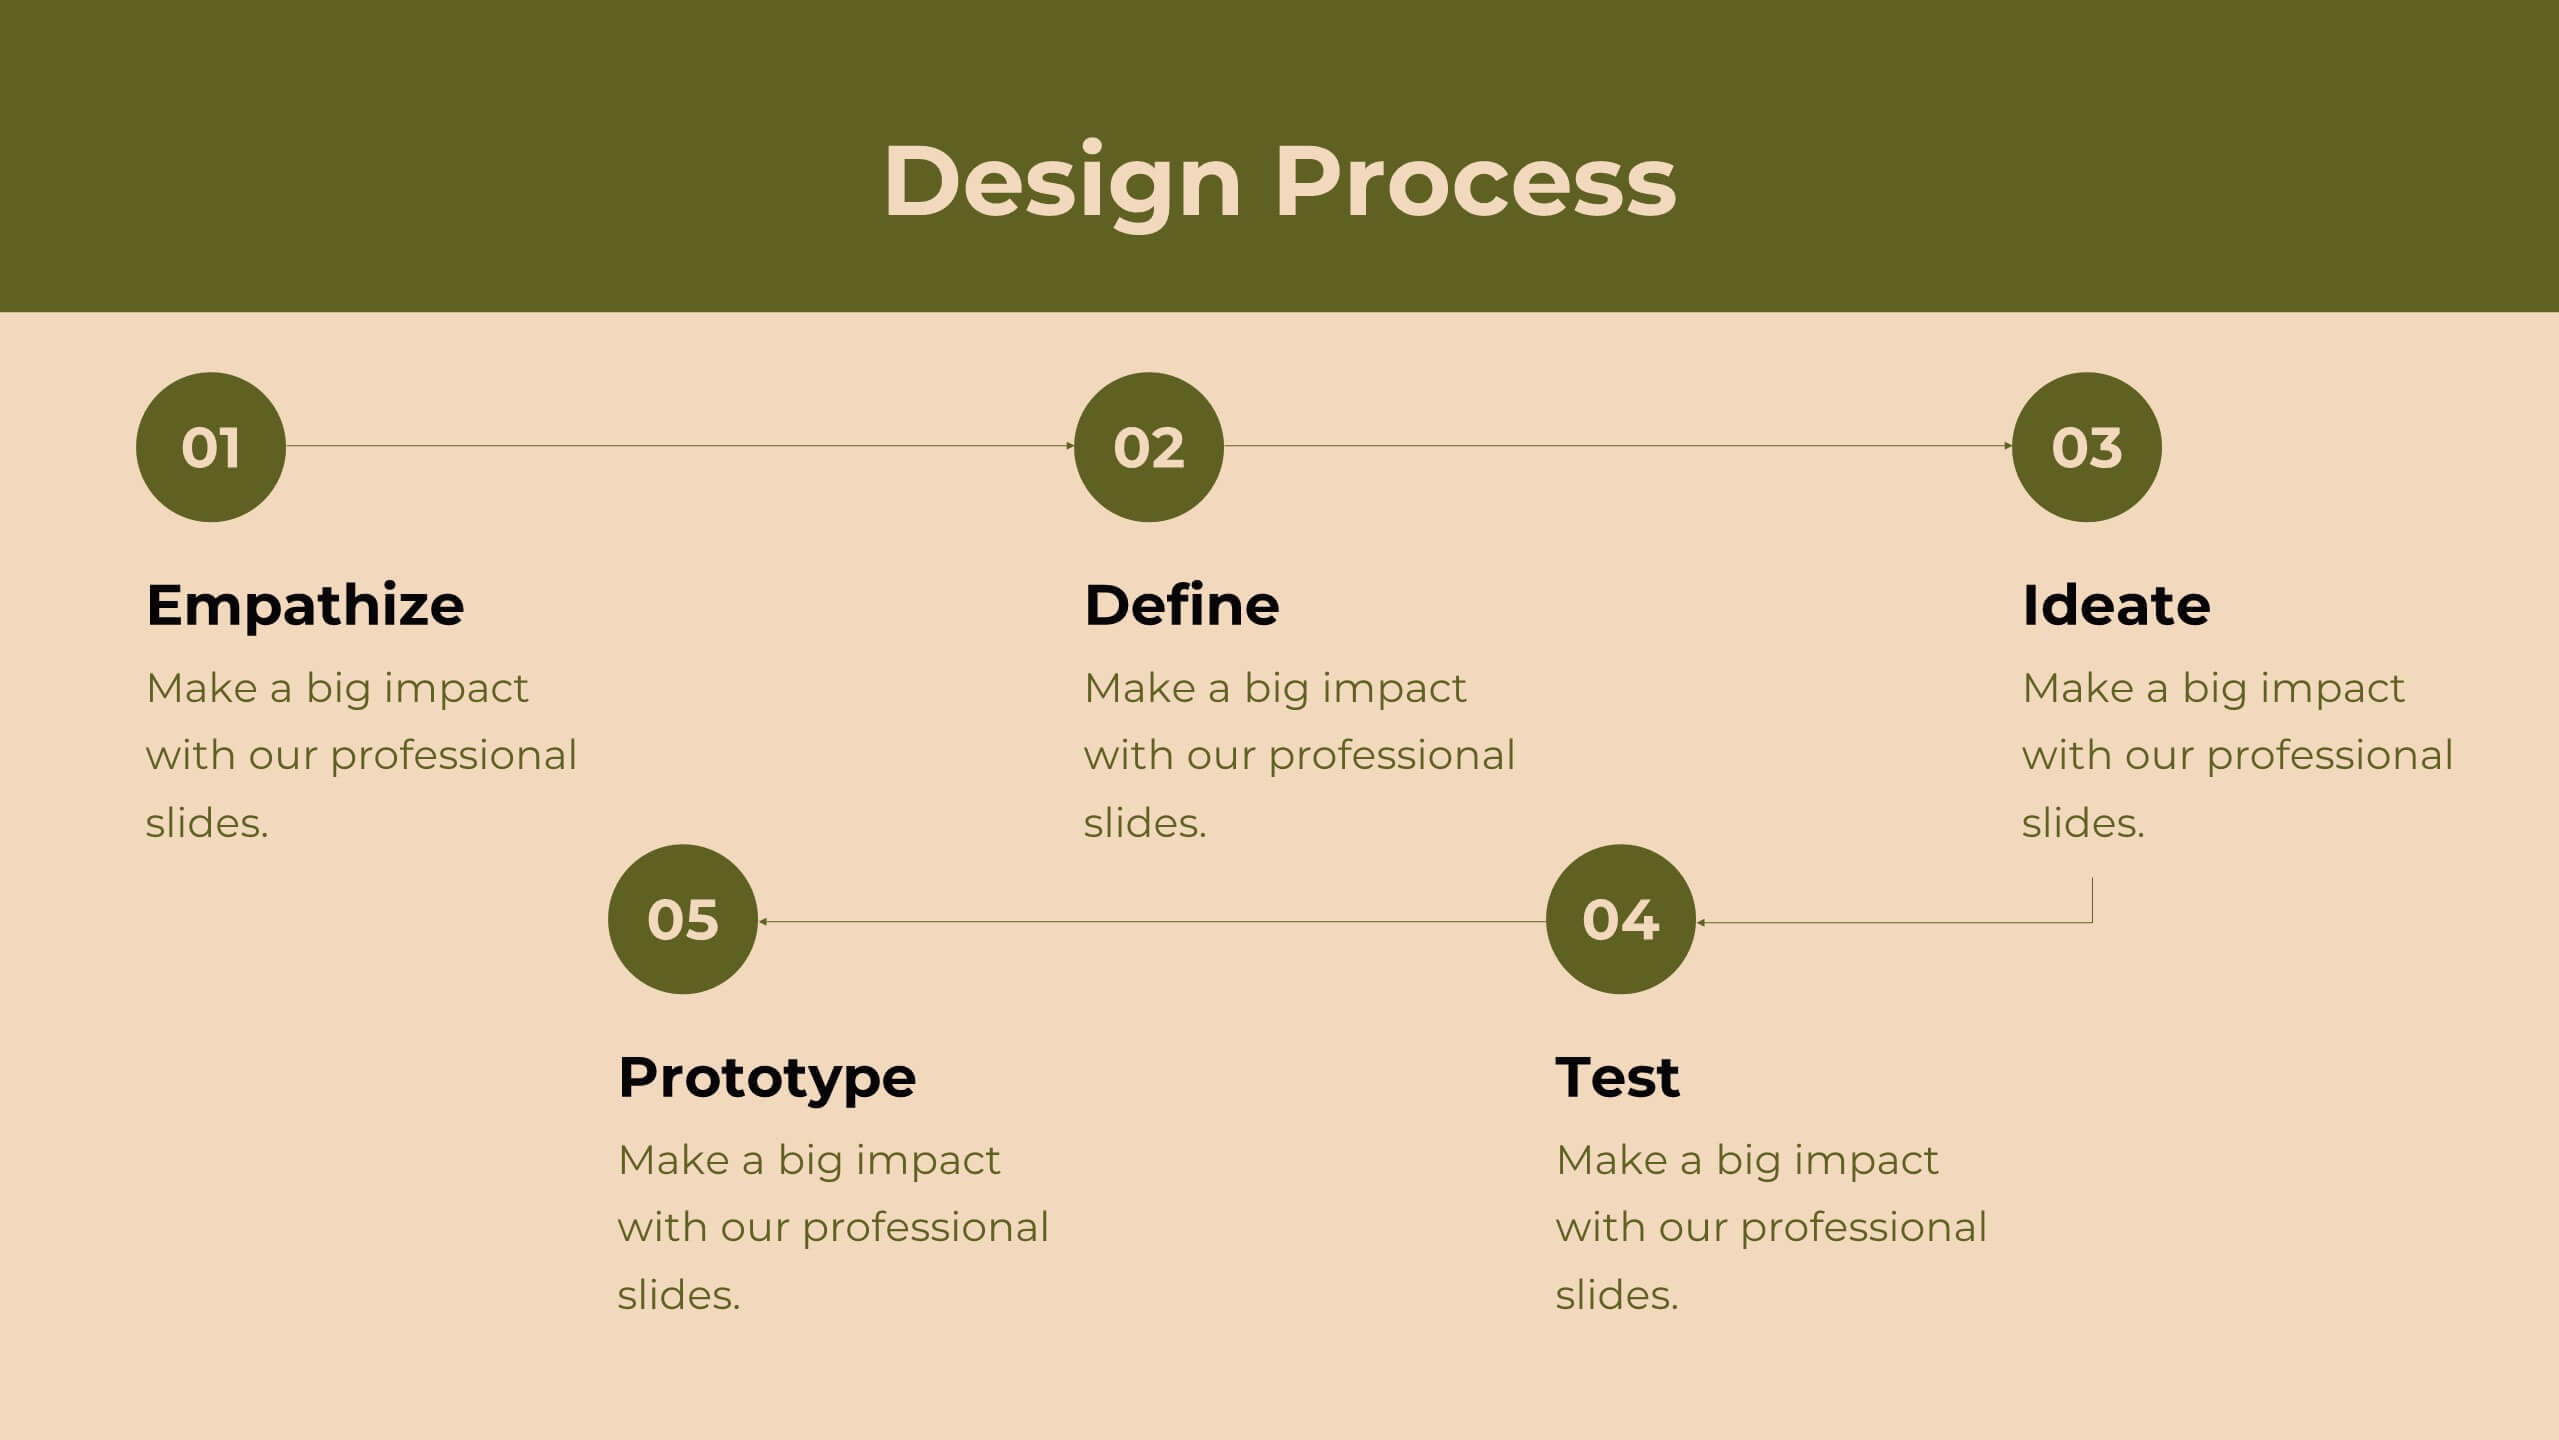
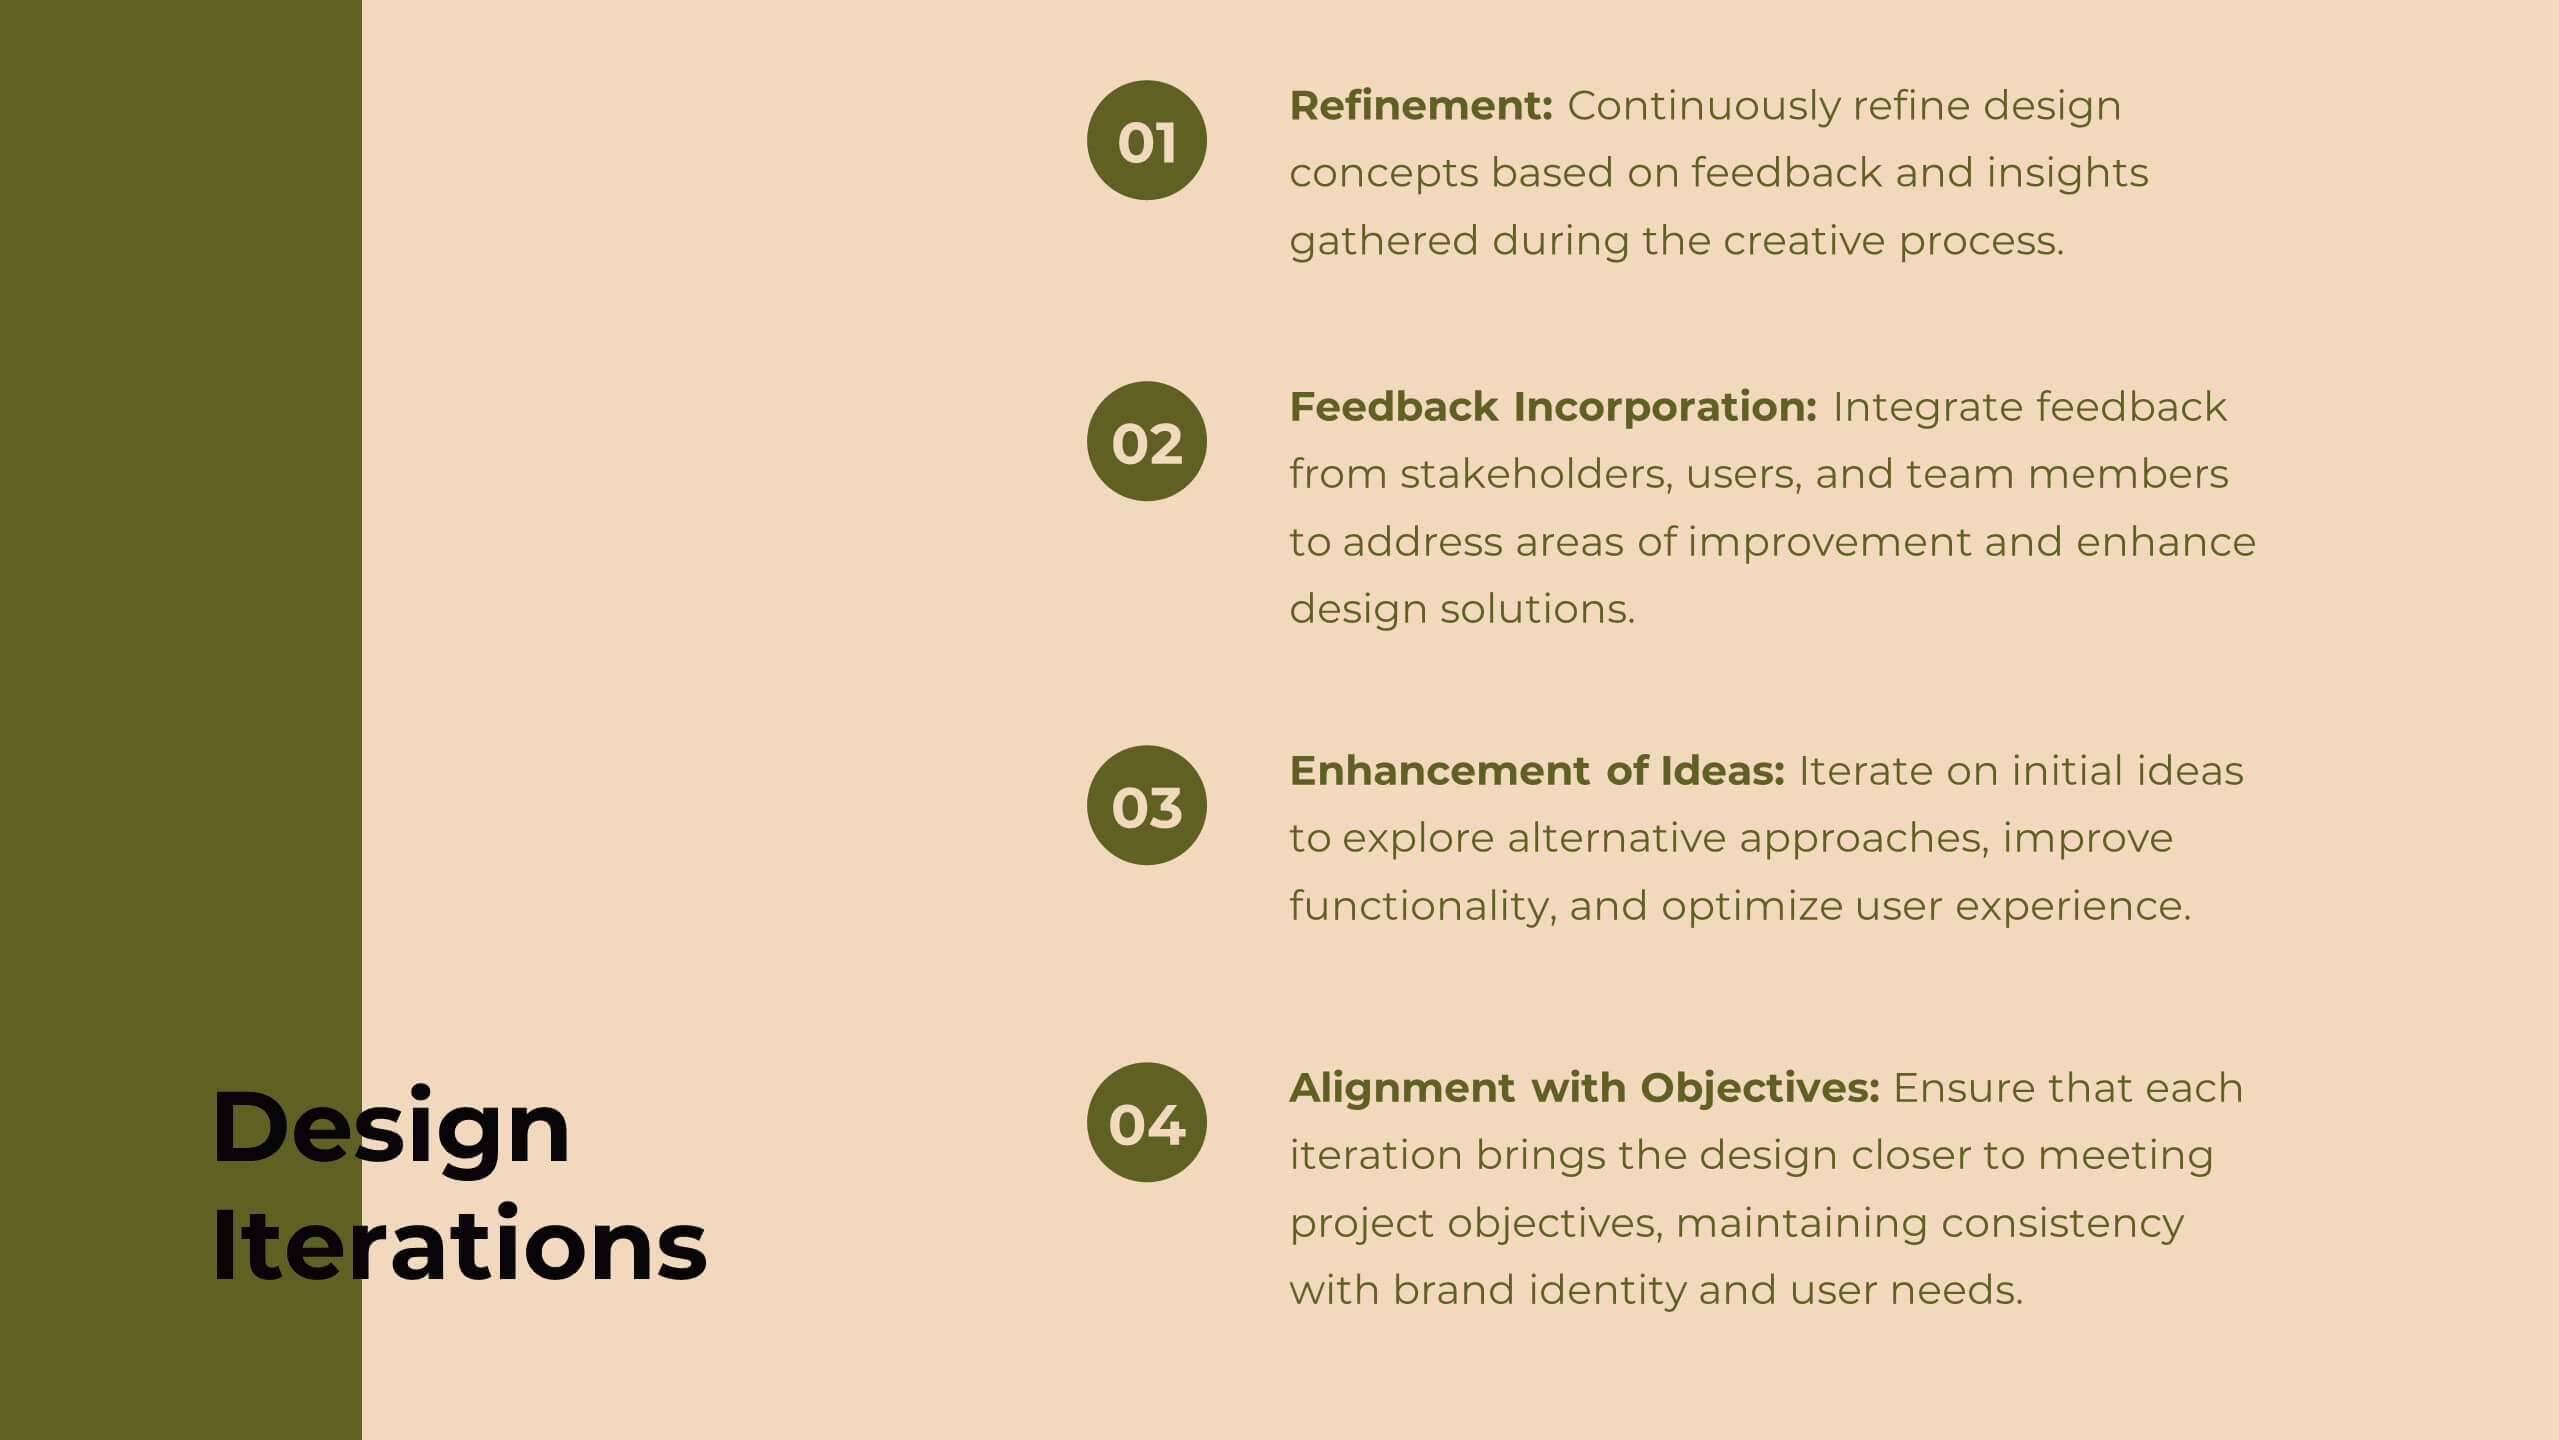
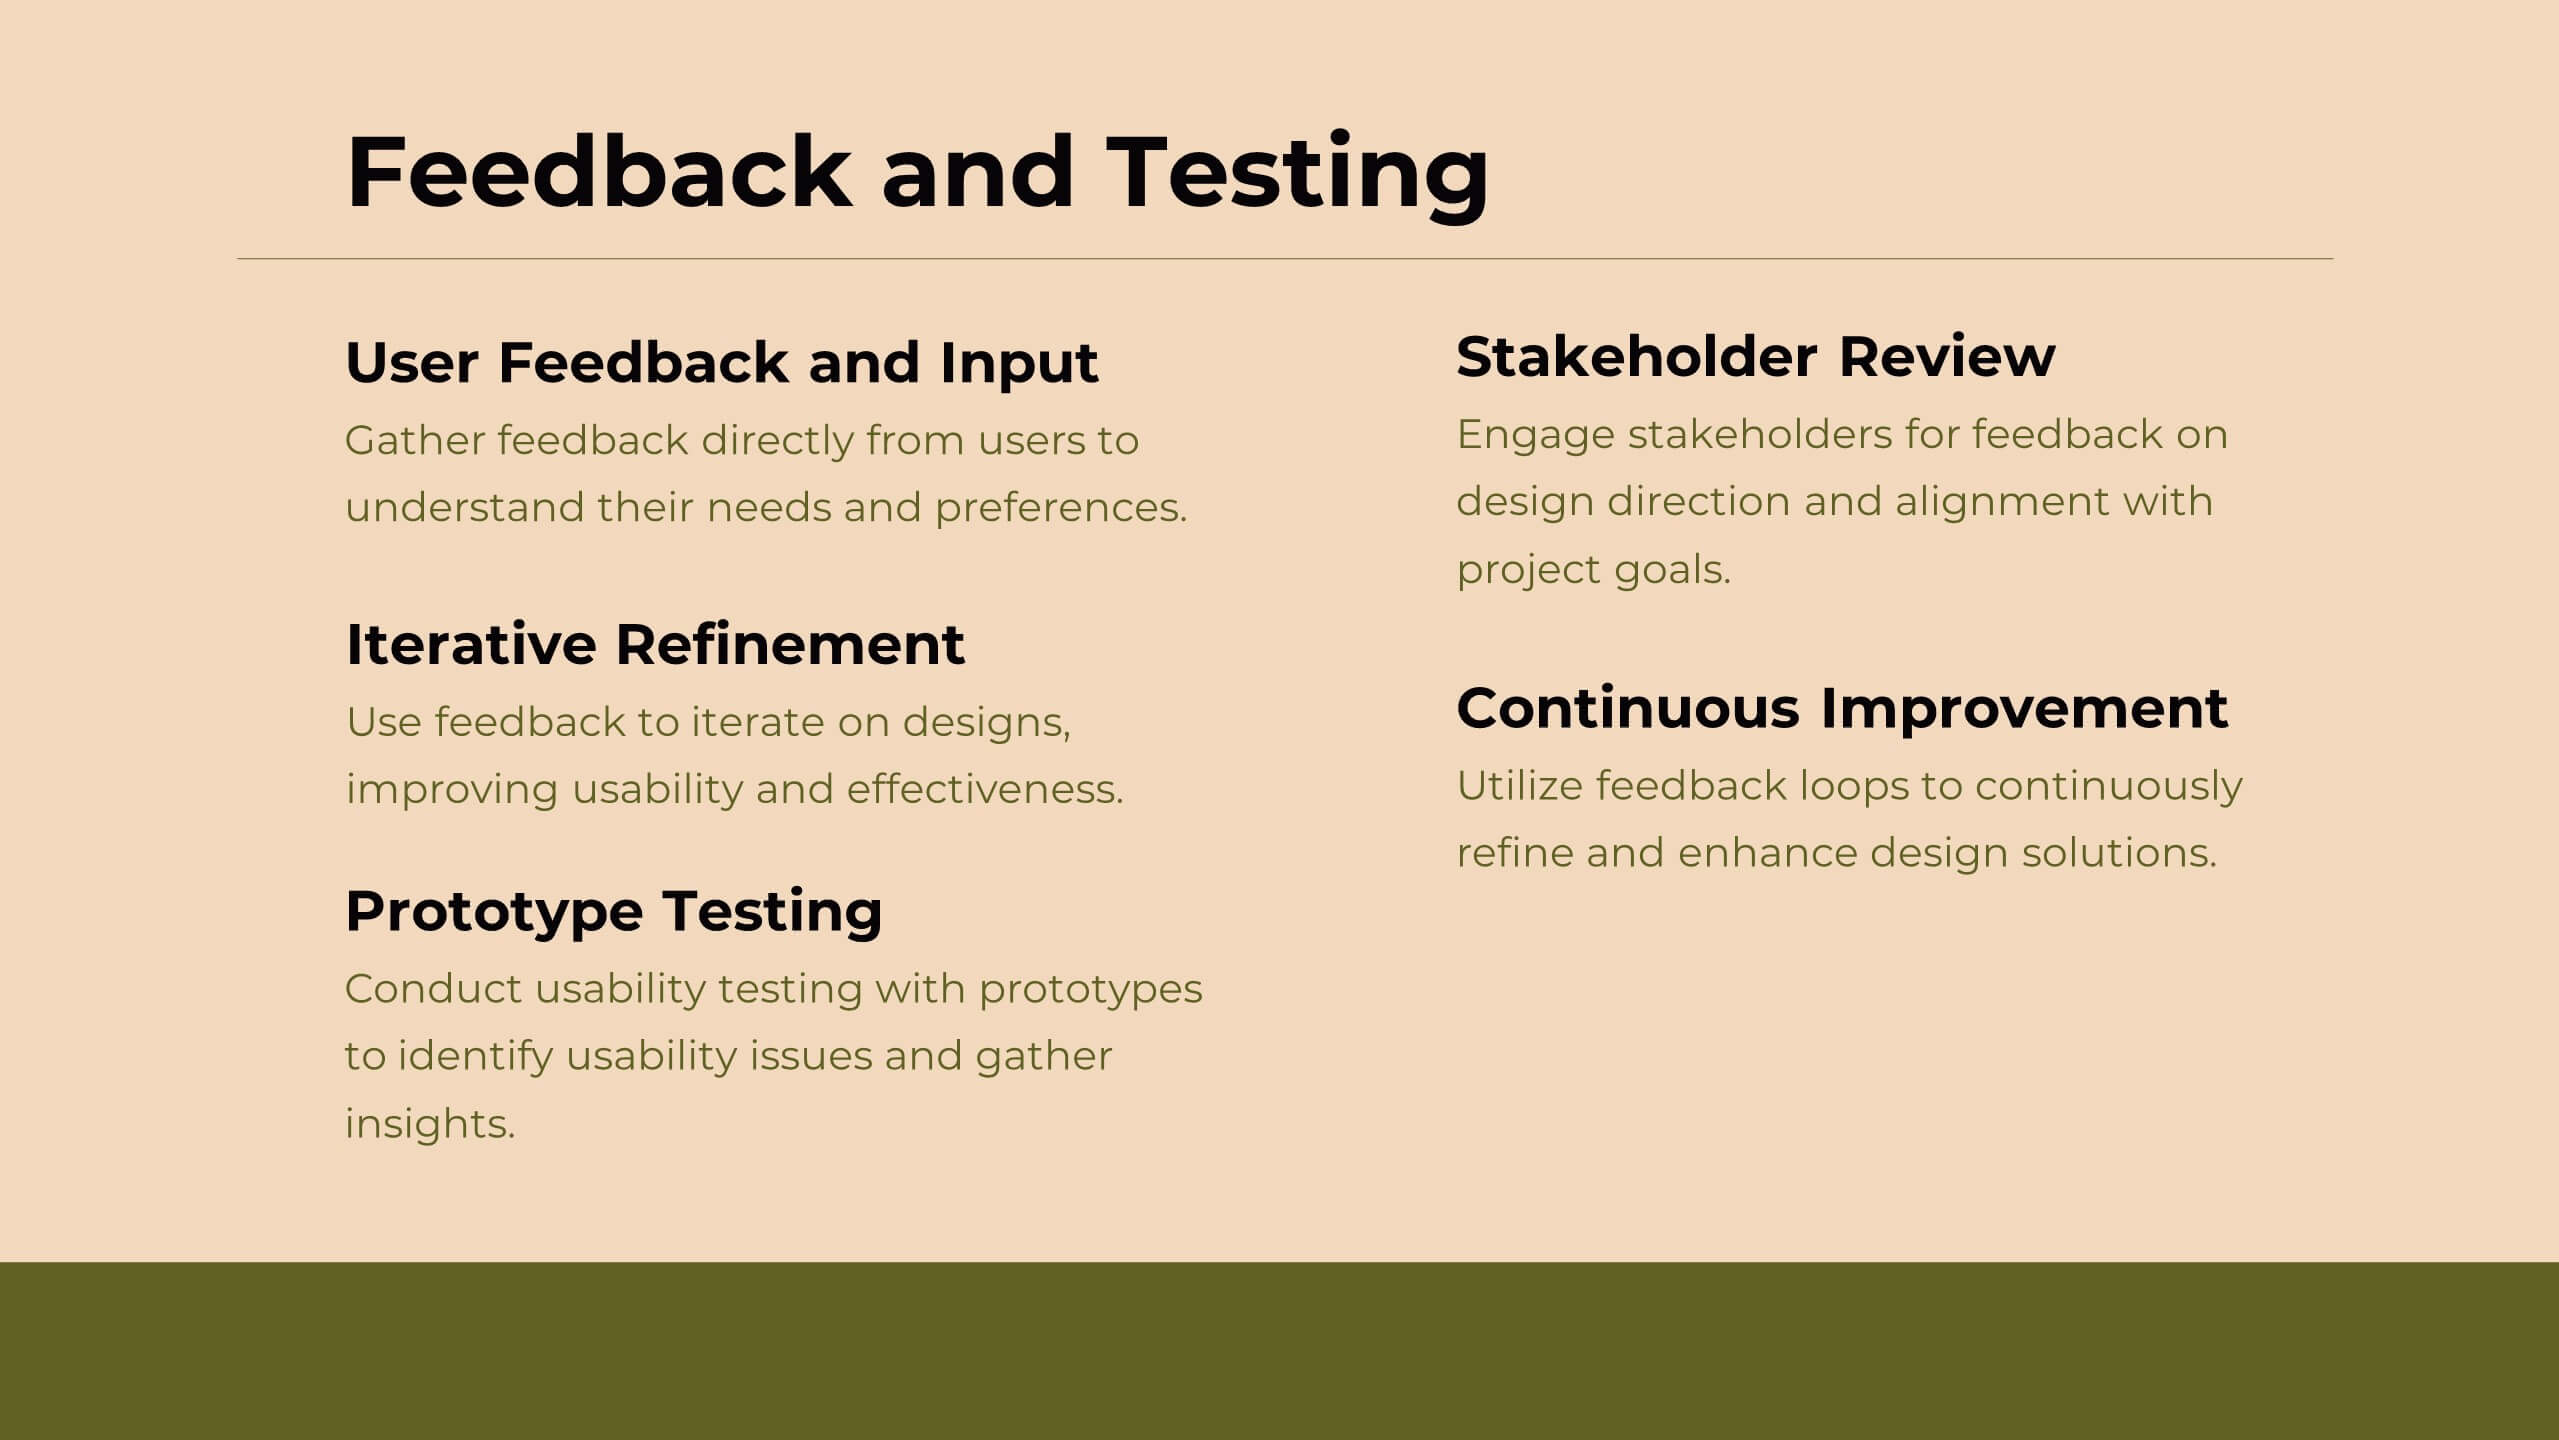
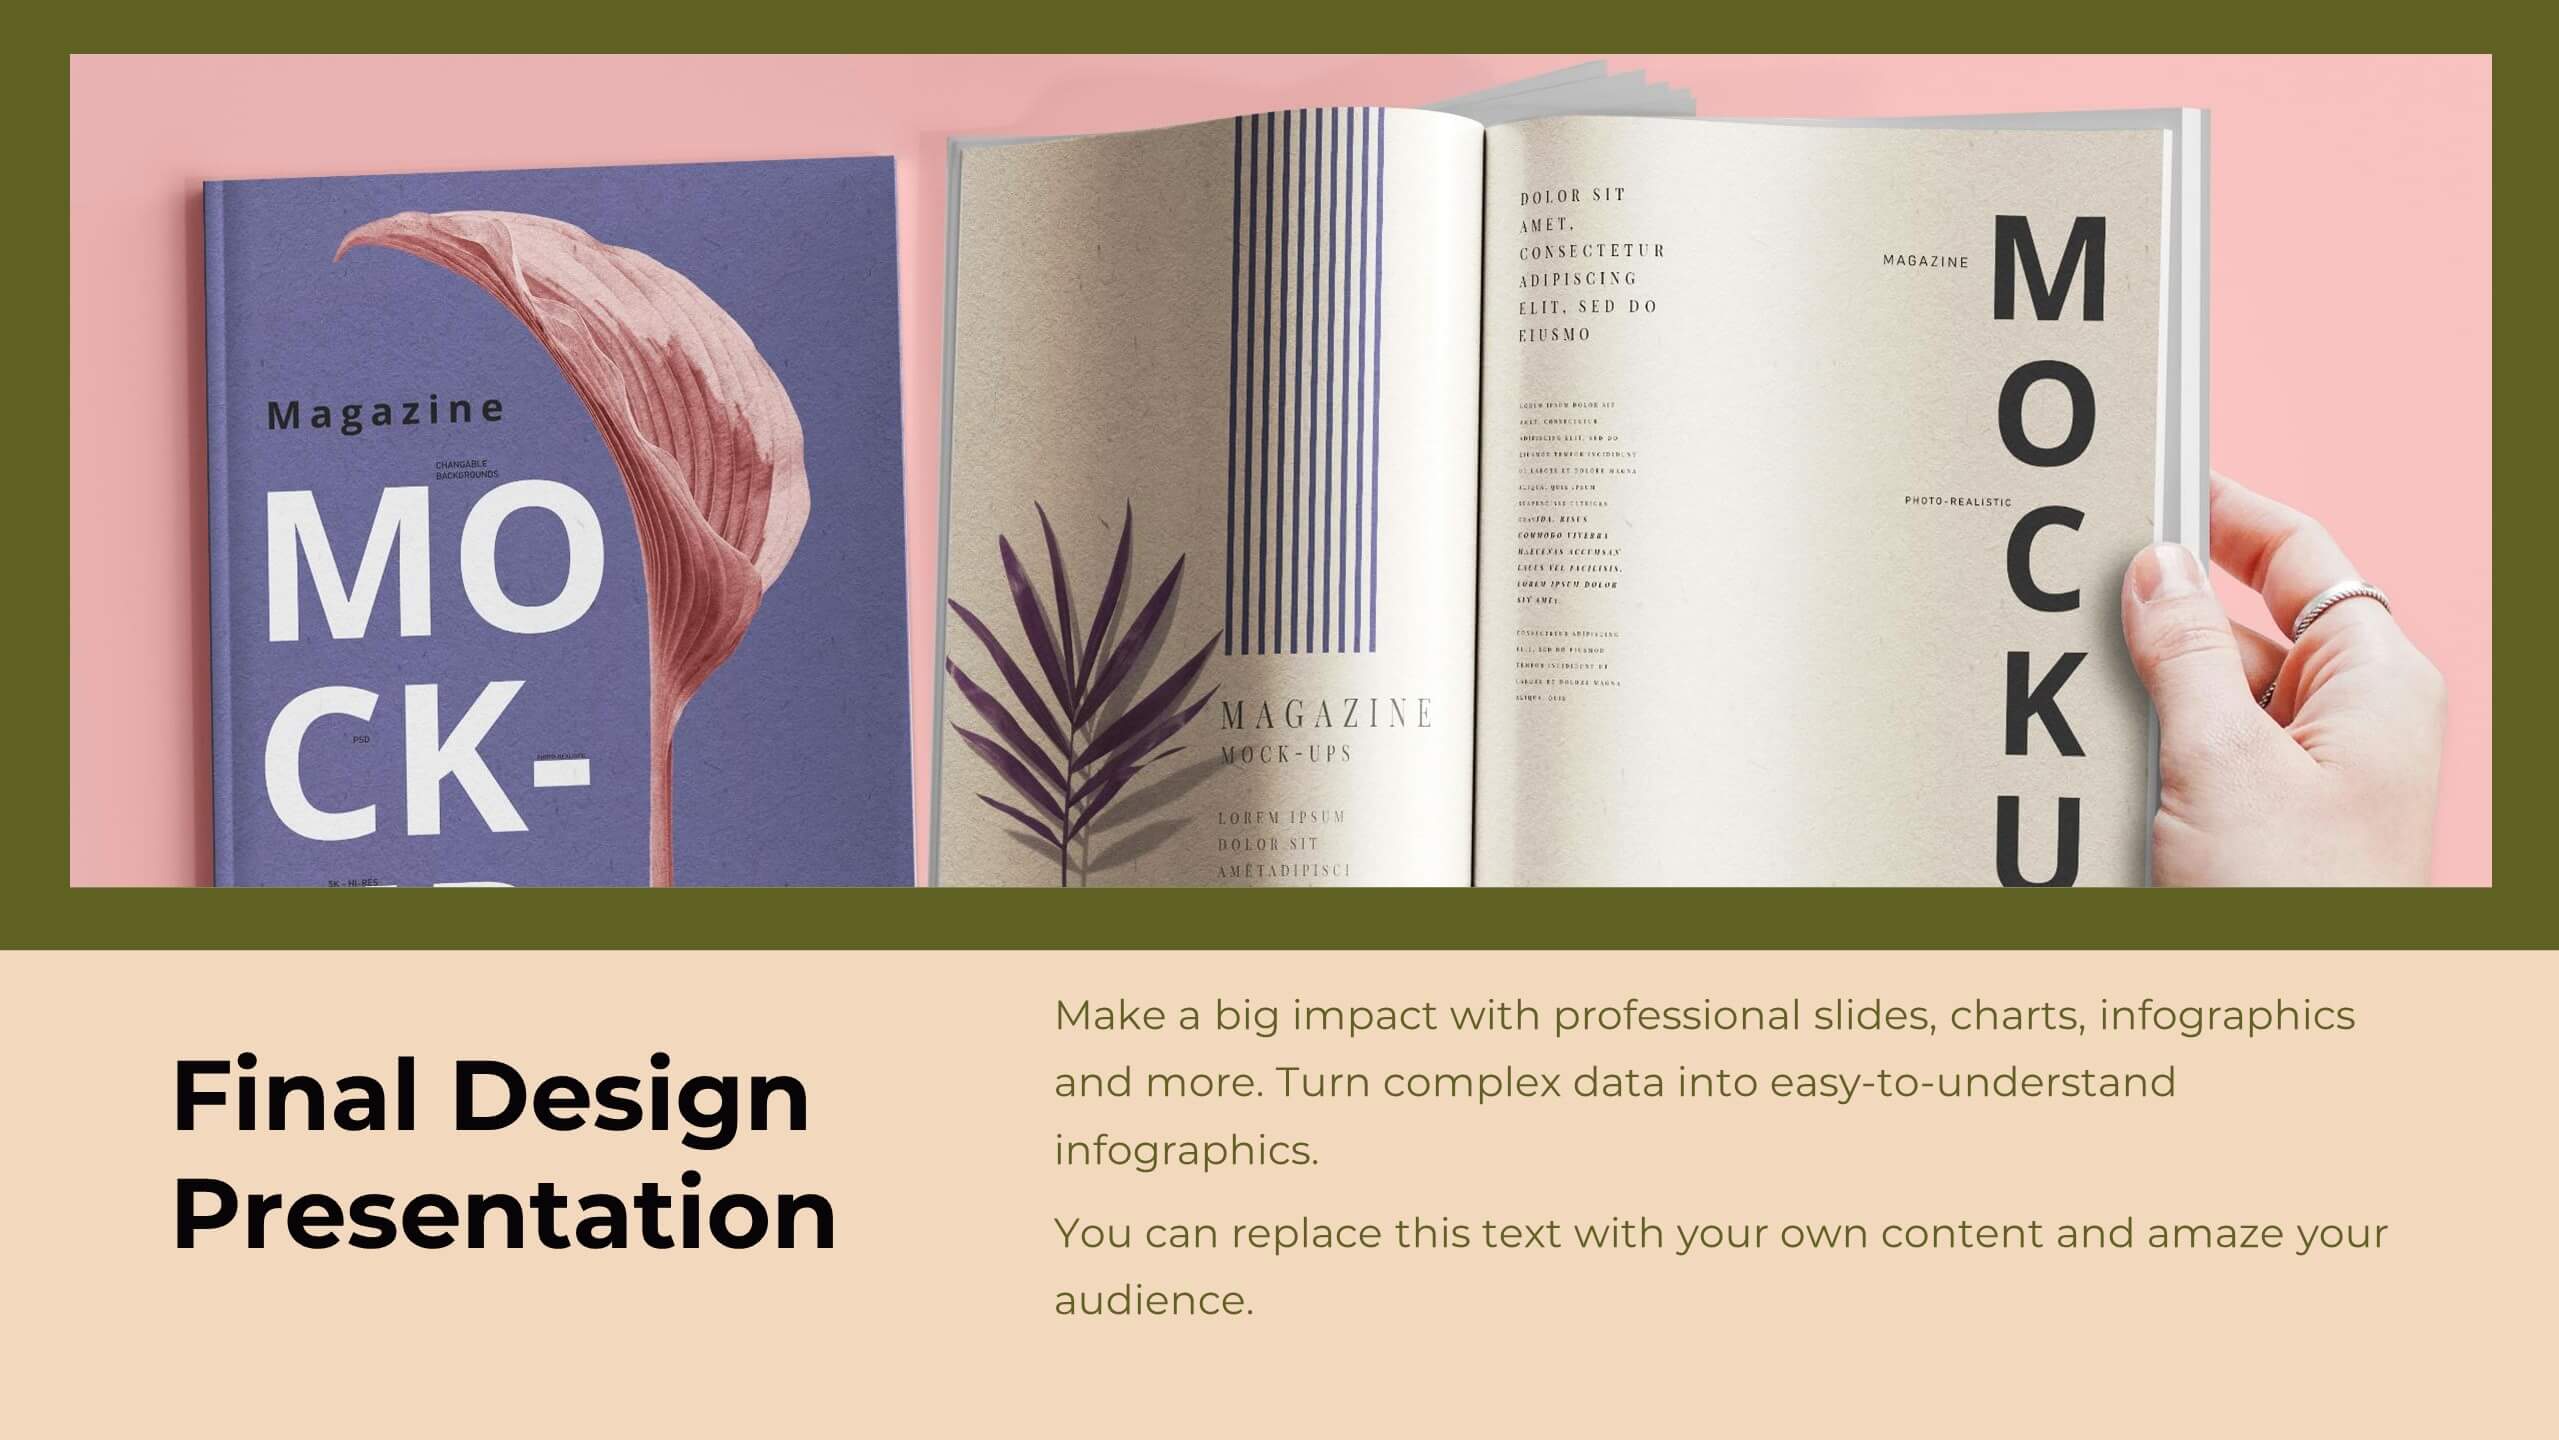
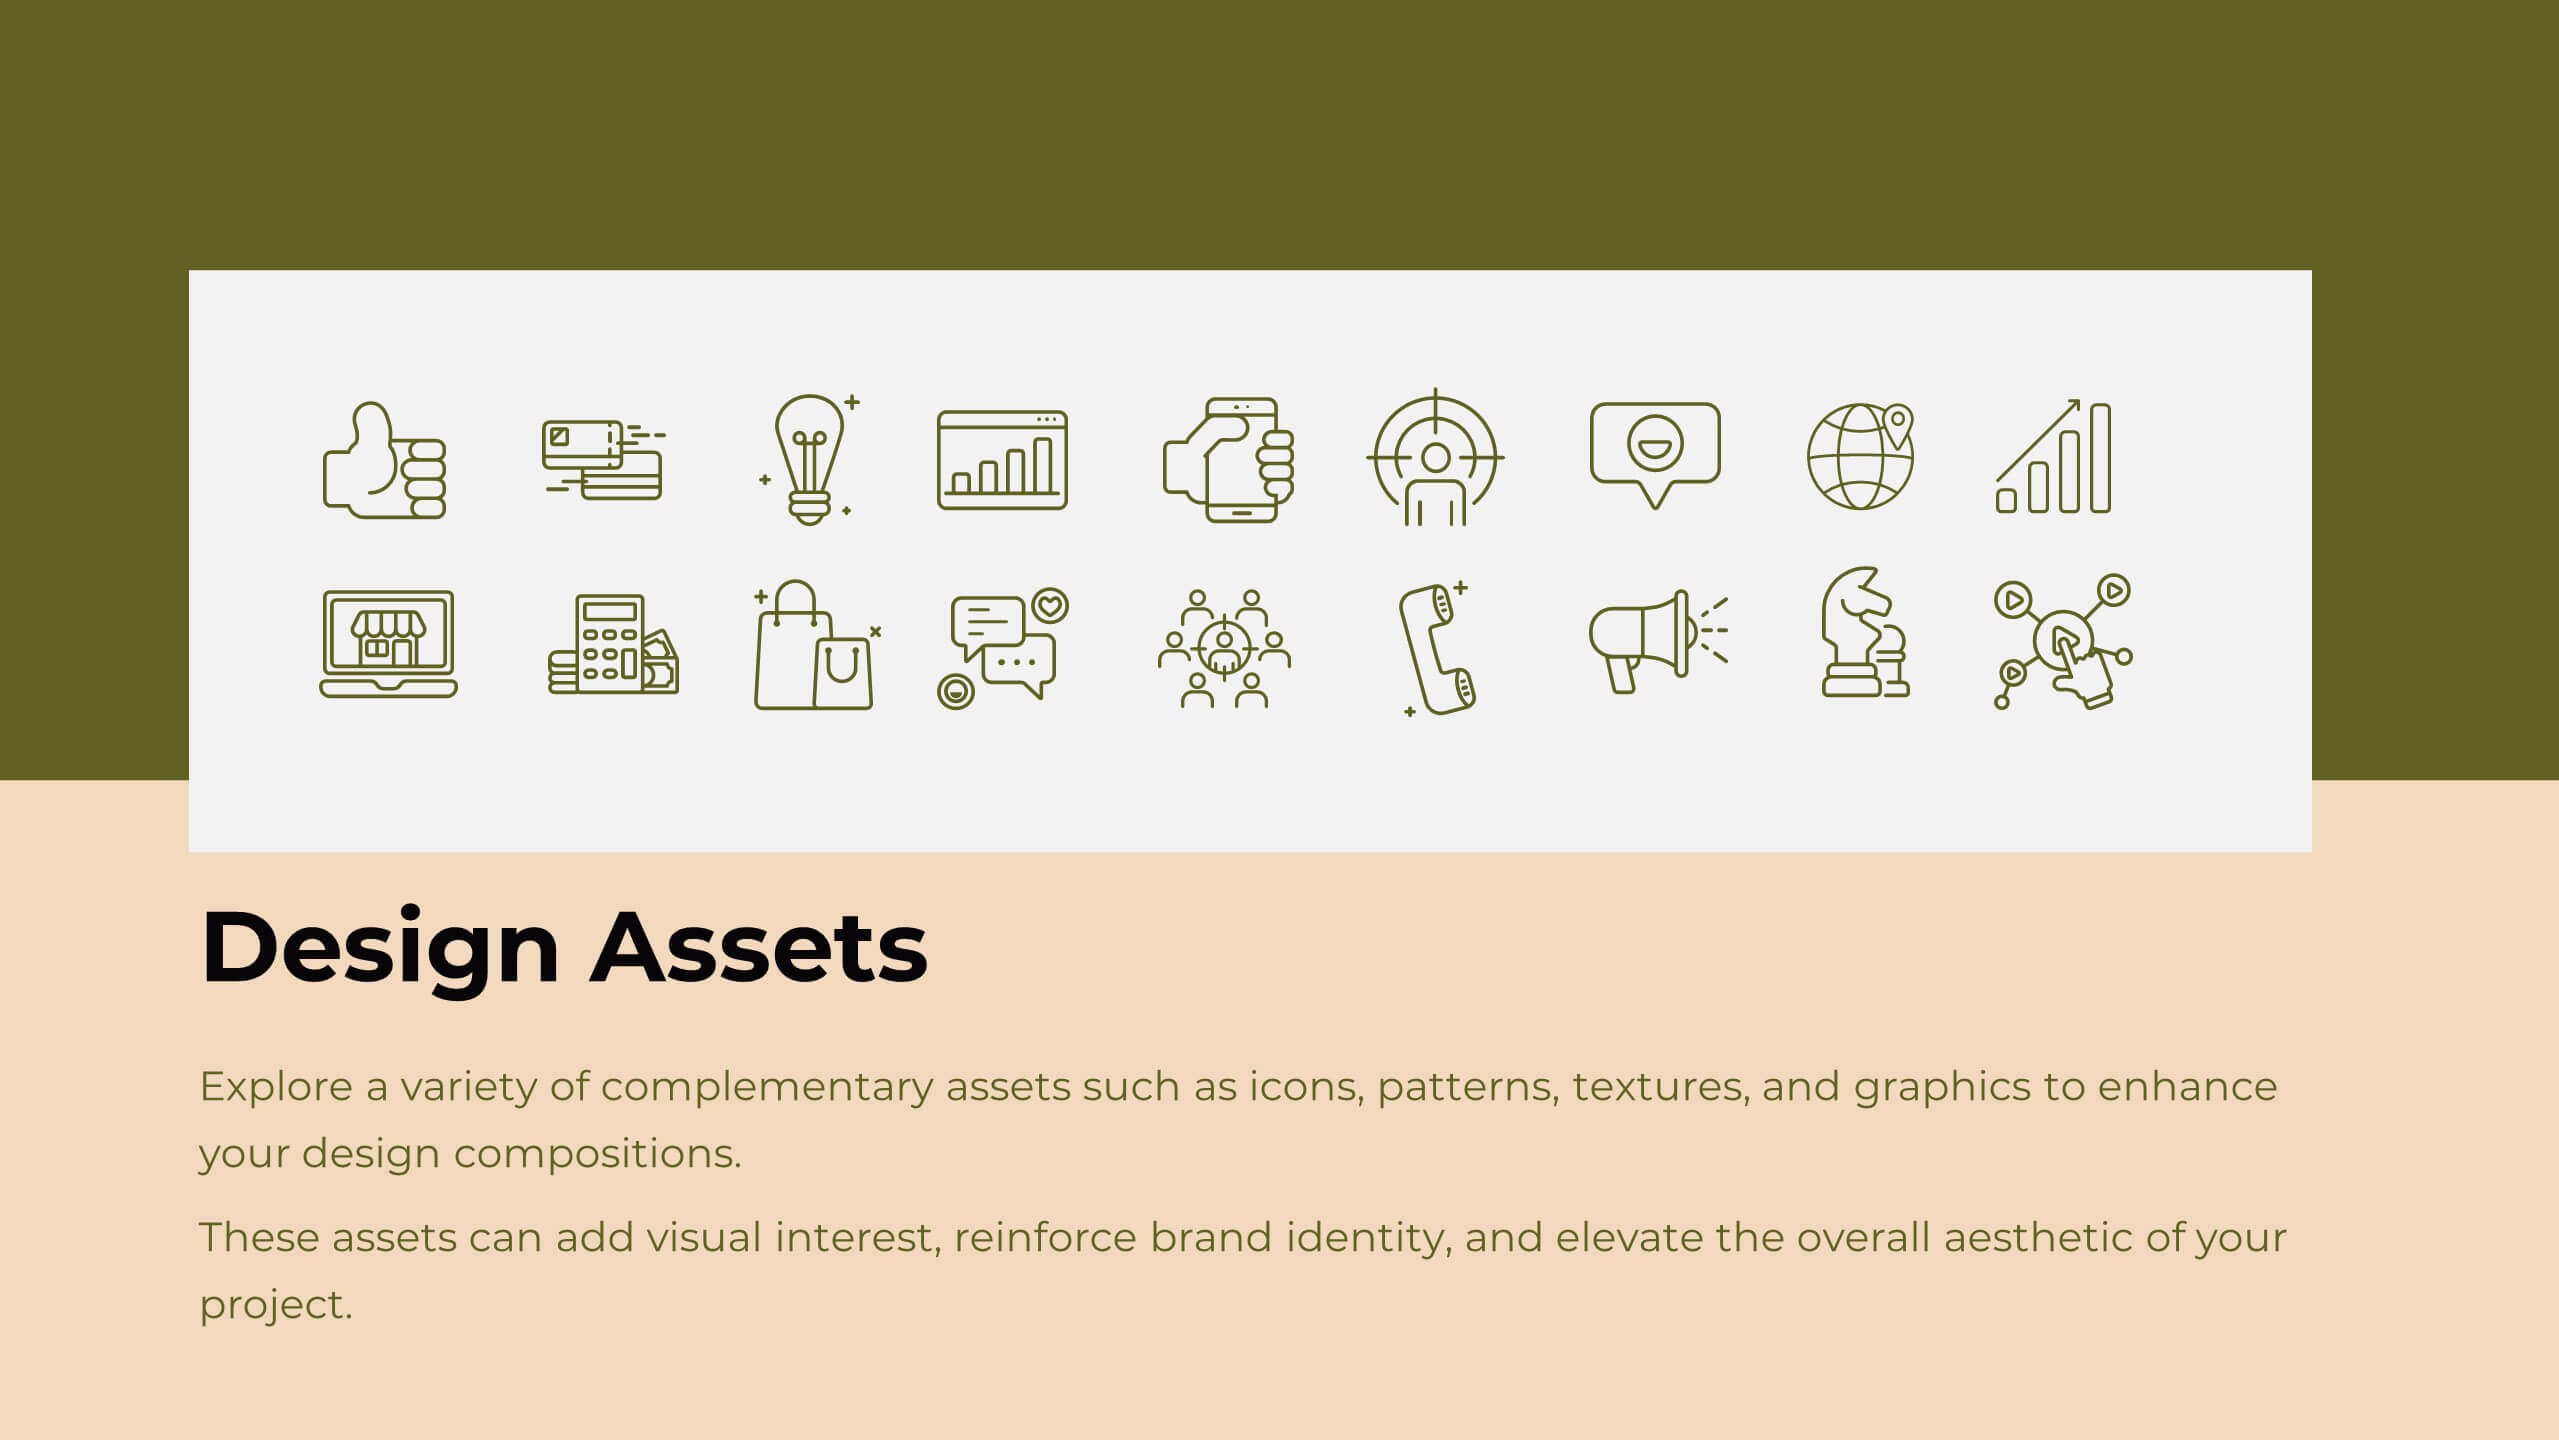
Delta Design Strategy Proposal Presentation
Transform your design strategy with this elegant proposal template! Perfect for presenting design briefs, target audience insights, and concept development. Ideal for designers and creative teams aiming to align vision and execution. Compatible with PowerPoint, Keynote, and Google Slides, this template ensures your design strategy is clear, professional, and compelling. Elevate your projects today!


8 slides
Green Business Sustainability Strategy Presentation
Promote eco-friendly business strategies with the Green Business Sustainability Strategy infographic. Featuring a circular flow diagram, this template highlights key sustainable initiatives, resource management, and environmental impact strategies. Fully editable and compatible with PowerPoint, Keynote, and Google Slides.


4 slides
Regional Business Focus on Asia Presentation
Showcase your company’s strategic footprint with the Regional Business Focus on Asia Presentation. This clean, icon-labeled map layout helps illustrate key markets, logistics routes, or development hubs across Asia. Ideal for business expansion plans, investment updates, or regional performance overviews. Fully editable in PowerPoint, Keynote, Google Slides, and Canva.


5 slides
Sustainable Development Goals Deck Presentation
Present your sustainability roadmap with clarity using the Sustainable Development Goals Deck. Designed for highlighting eco-initiatives, circular strategies, and responsible development objectives. The circular layout supports goal-based narratives and strategic breakdowns. Fully editable in PowerPoint, Keynote, and Google Slides—ideal for ESG reports, environmental pitches, or CSR presentations.


6 slides
Budget and Expense Breakdown Presentation
Kickstart your financial story with a clean, energetic visual that makes every cost and category instantly understandable. This presentation helps you break down spending, compare expenses, and highlight key budget insights using a simple, structured layout. Perfect for reports and planning meetings. Fully compatible with PowerPoint, Keynote, and Google Slides.