


Features
- 5 Unique slides
- Fully editable and easy to edit in Microsoft Powerpoint, Keynote and Google Slides
- 16:9 widescreen layout
- Clean and professional designs
- Export to JPG, PDF or send by email


Do you have any questions?
Recommend
22 slides
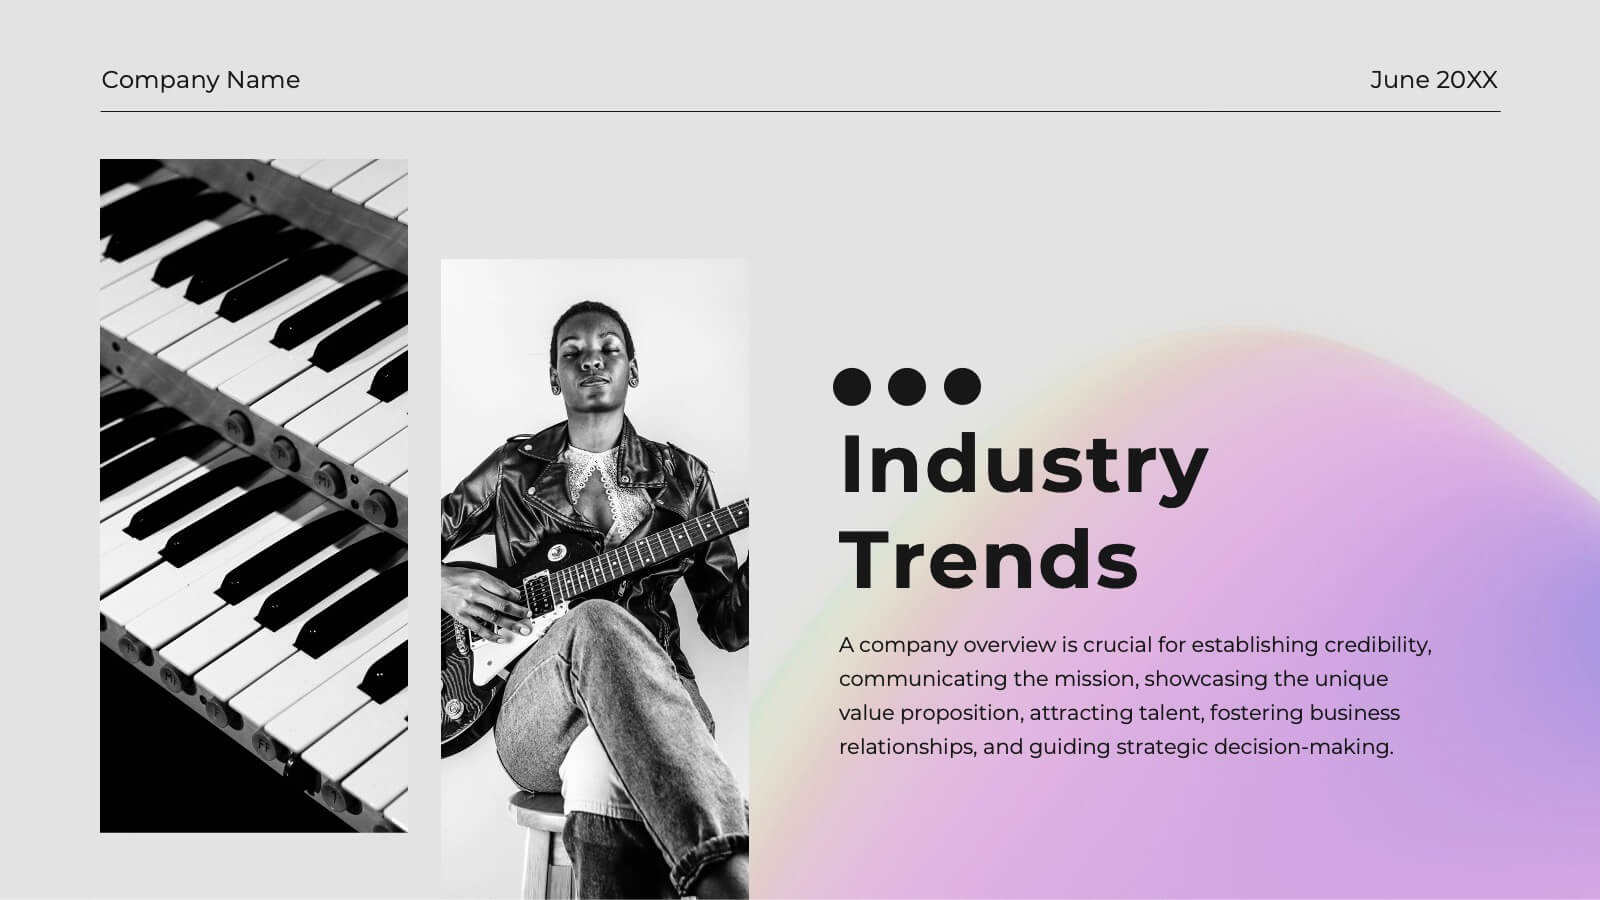
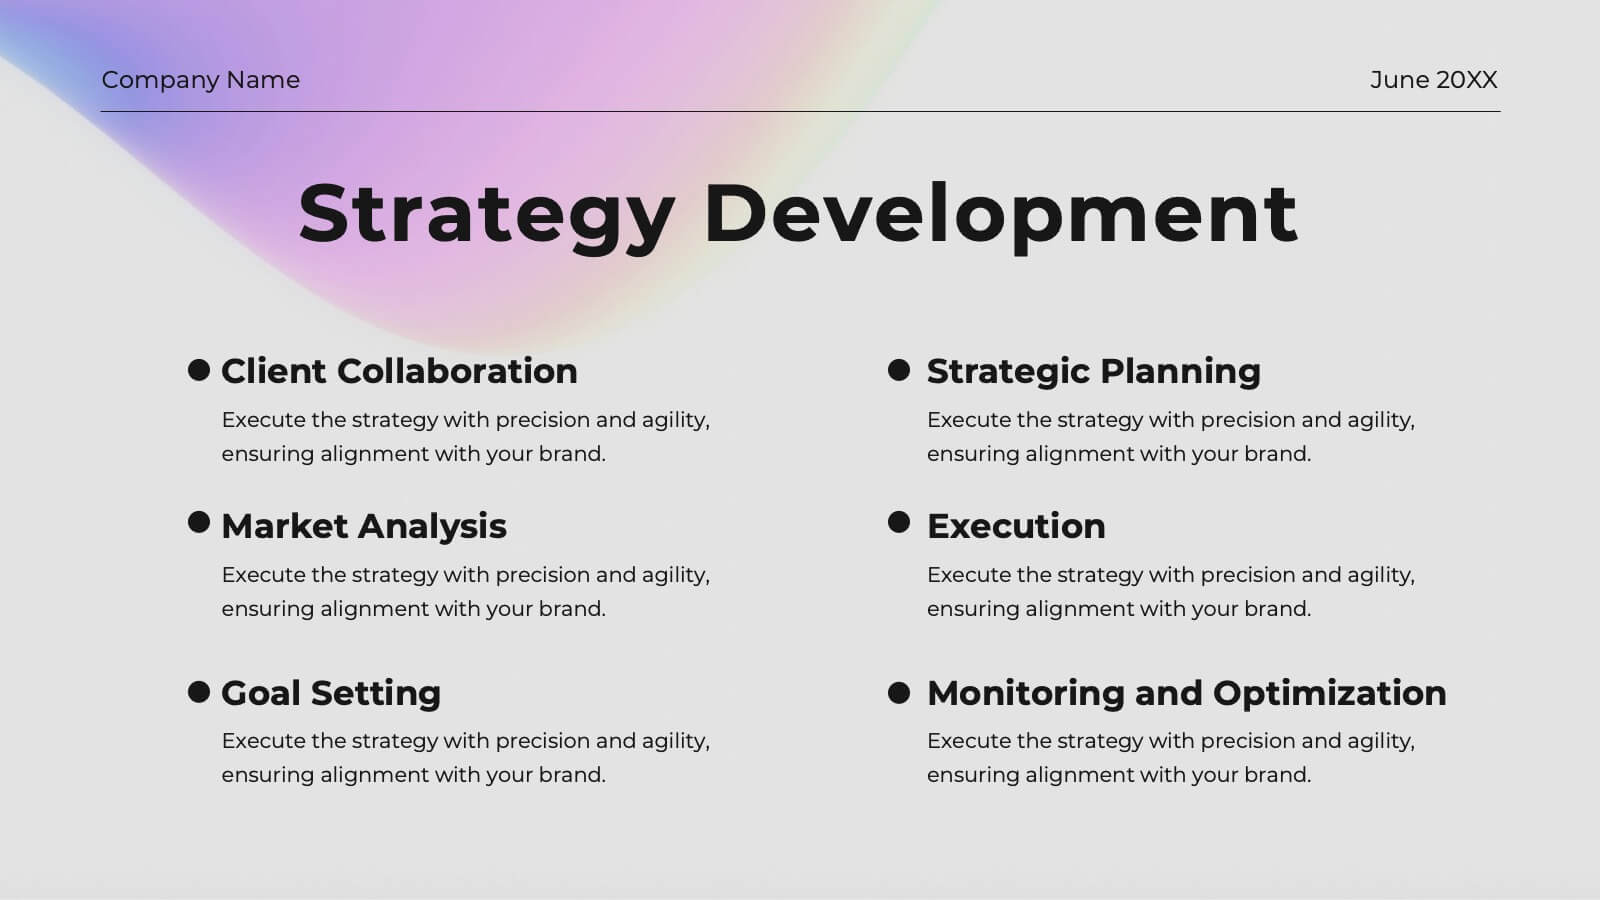
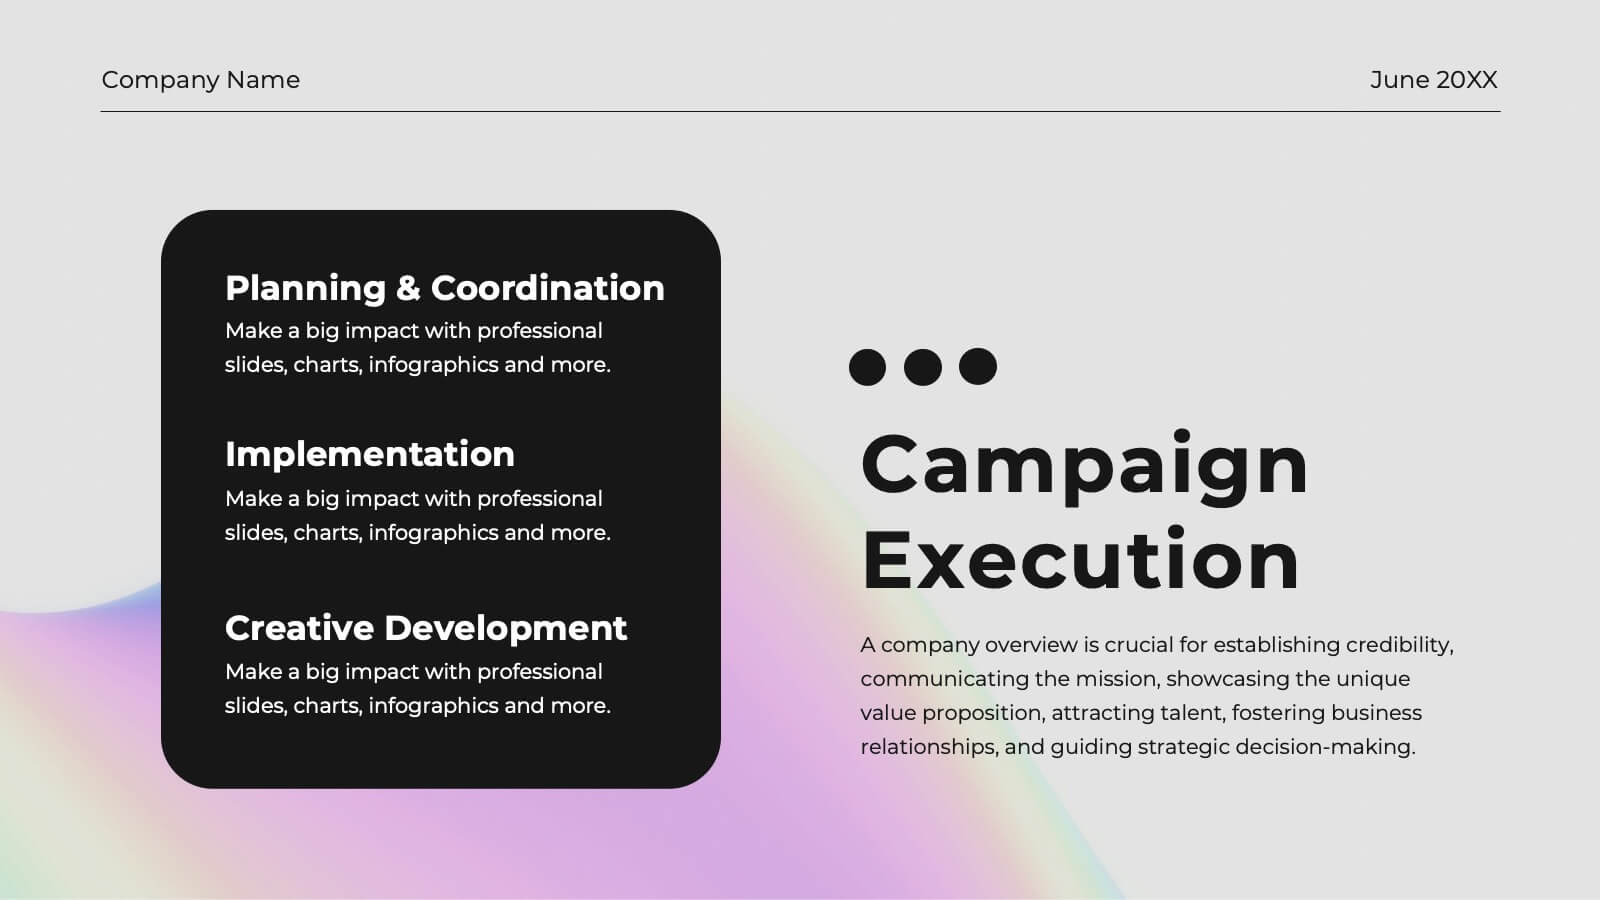
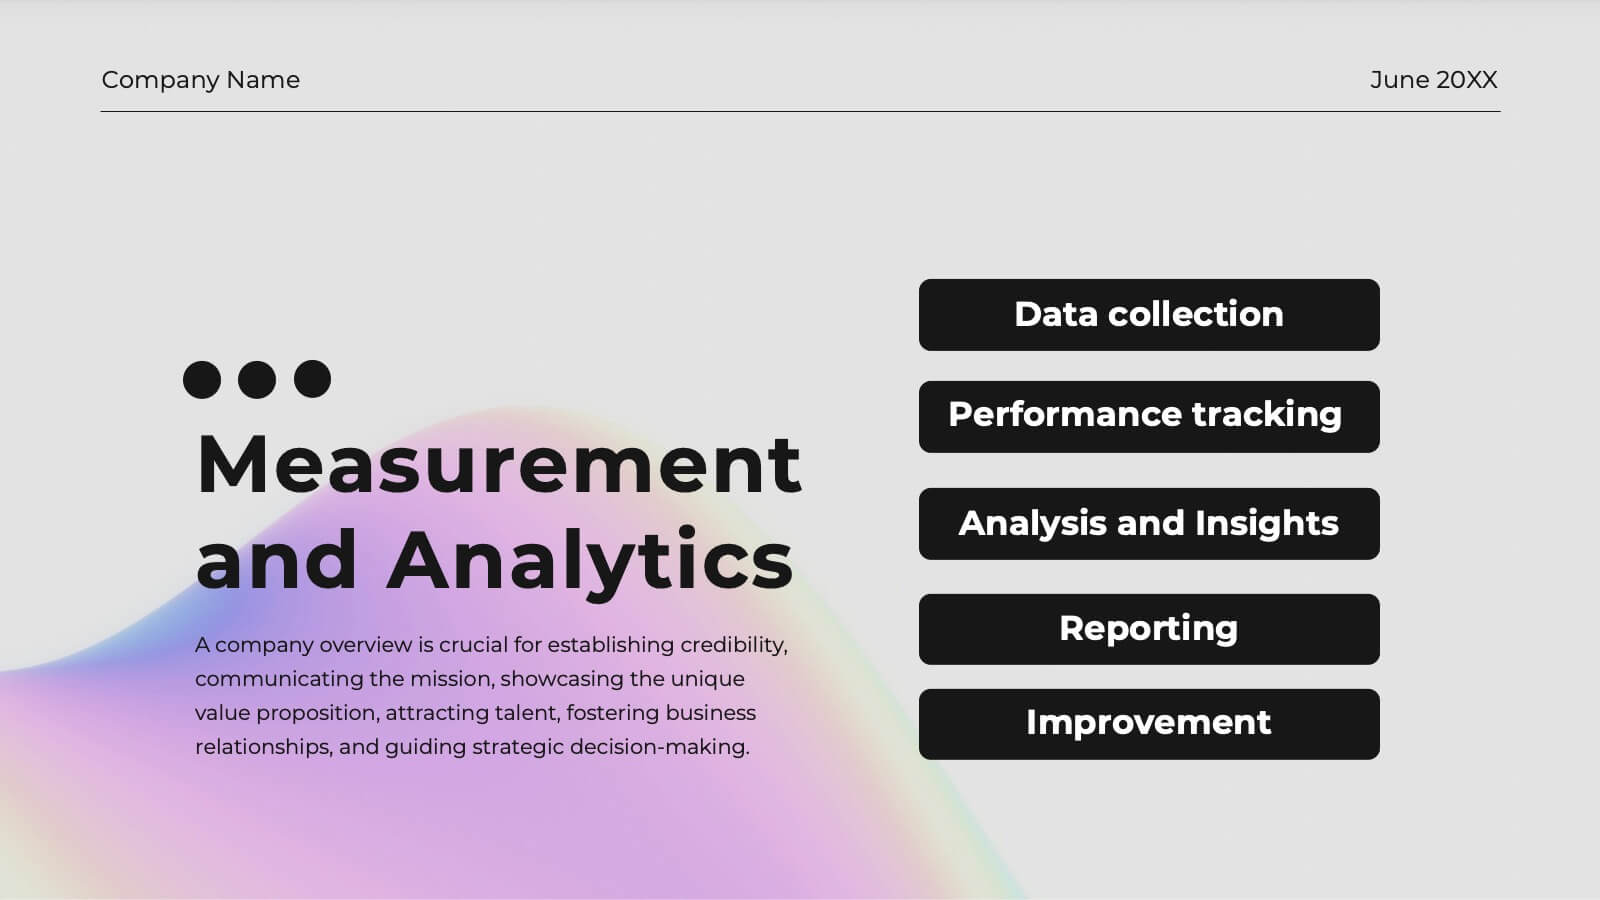
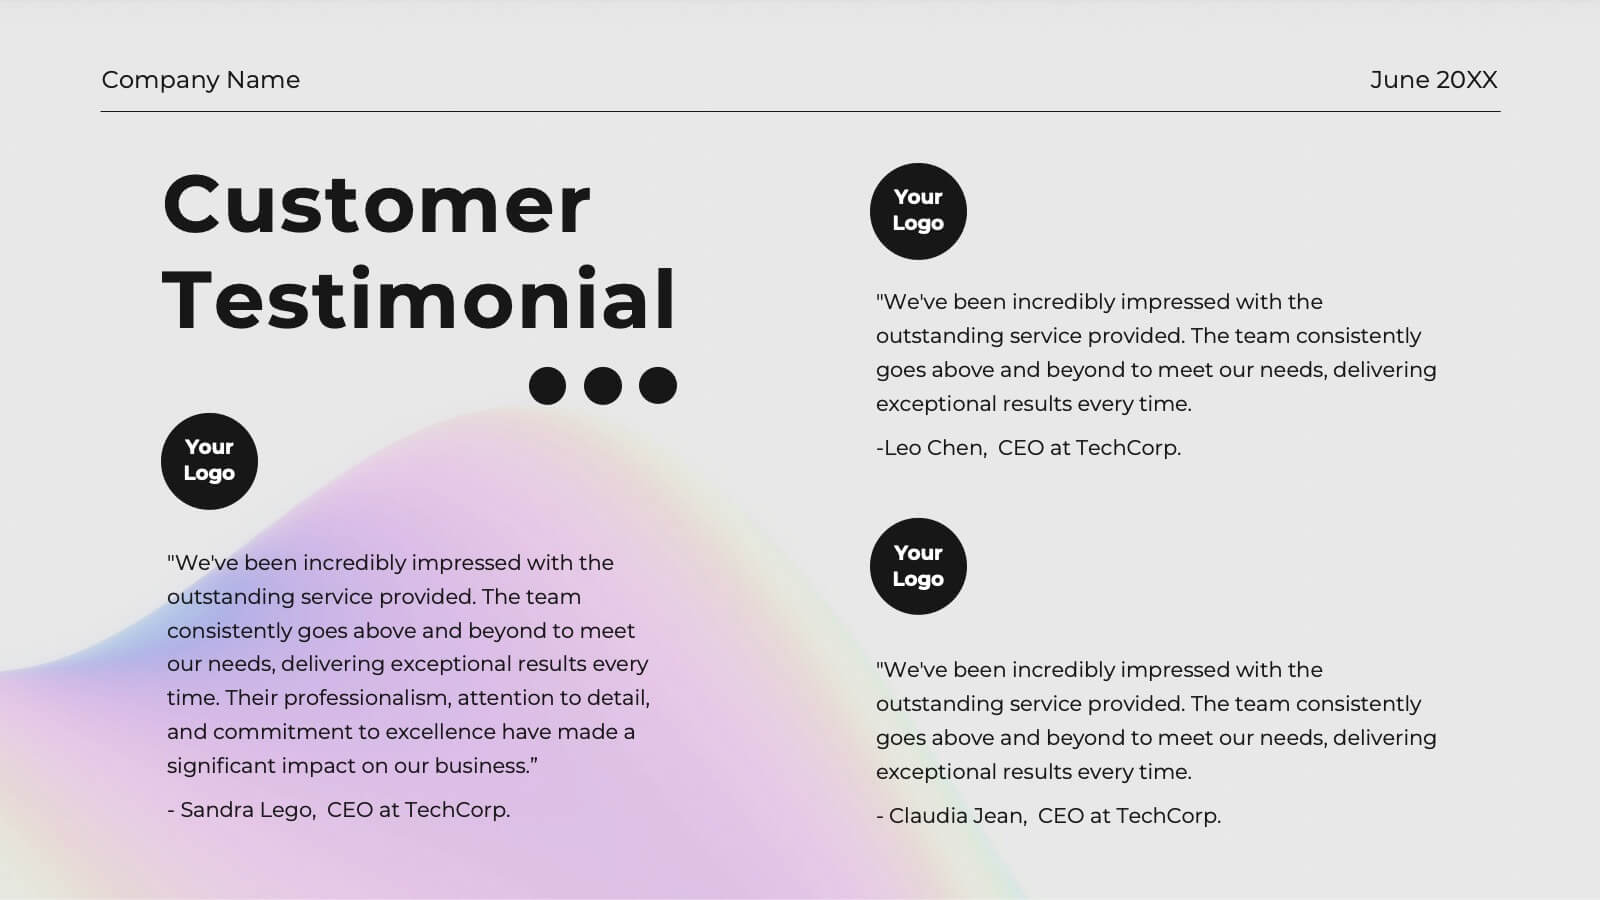
Frost Advertising Agency Proposal Presentation
Dazzle your clients with this radiant agency proposal template! Perfect for presenting your mission, services, and market analysis, it includes slides for case studies, strategy development, and campaign execution. Impress stakeholders with vibrant visuals and detailed content. Compatible with PowerPoint, Keynote, and Google Slides for seamless presentations on any platform.


21 slides
Oslo Design Strategy Proposal Presentation
This design strategy proposal template is tailored to present your creative process with bold colors and clean layouts. It includes sections like overview, design brief, concept development, design process, mood board, and project timeline, giving you a comprehensive structure for showcasing your approach. Compatible with PowerPoint, Keynote, and Google Slides, it ensures seamless presentations.


7 slides
Europe Map Infographic Presentation Template
Europe is a continent located in the northern part of the globe and surrounded by water on three sides. It is bordered by the Atlantic Ocean to the west, the Arctic Ocean to the north, and the Mediterranean Sea to the south. Europe is divided into roughly forty four countries and dependent territories, each one with its own unique identity, cuisine and culture. This European map template is a vector map of an outline of Europe, with color-coded and labeled countries and a legend. This map template can be used for presentations, reports and blogs about tourism it's a simple and clean style map.


6 slides
Wellness Program and Health Strategy Presentation
Bring your strategy to life with this clean and creative visual! This presentation template uses a six-part flower design to help you showcase your wellness goals, health strategies, or program pillars with clarity and balance. It’s fully editable and works perfectly in PowerPoint, Keynote, and Google Slides for flexible customization.


6 slides
Ideal Buyer Persona Customer Profile Presentation
Define your perfect customer with the Ideal Buyer Persona Customer Profile Presentation. This clear and visually structured layout helps you map out key traits, behaviors, and needs of your target audience. Easy to edit in Canva, PowerPoint, or Google Slides—ideal for marketing teams, strategists, and business development presentations.


4 slides
User Base by Demographic Factors
Understand your audience at a glance with the User Base by Demographic Factors Presentation. This visual template displays gender-based or group-based demographic insights alongside bar chart statistics and percentages, making it ideal for marketing reports, pitch decks, or user research presentations. Fully customizable in PowerPoint, Keynote, and Google Slides.


6 slides
Multiple Choice Options Slide Presentation
Make your ideas stand out with a bold, interactive design that organizes multiple options clearly and visually. Ideal for showcasing comparisons, scenarios, or decision pathways, this presentation keeps audiences engaged and informed. Fully compatible with PowerPoint, Keynote, and Google Slides for seamless customization and professional results.


26 slides
Building Community Networks Presentation
Strengthen connections and foster collaboration with this engaging presentation on building community networks. Covering key topics like social engagement, resource sharing, grassroots initiatives, and digital networking, this template helps highlight strategies for creating meaningful relationships. Fully customizable and compatible with PowerPoint, Keynote, and Google Slides for a seamless and impactful presentation experience.


6 slides
Customer Perceived Value Analysis
Visualize what matters most to your audience using this customer-centric diagram. Perfect for marketers, brand strategists, and CX professionals looking to present value drivers, motivations, or user insights. Easily editable in PowerPoint, Keynote, and Google Slides—customize colors, icons, and text to align with your brand.


5 slides
Scrum Methodology for Product Development Presentation
Visualize each phase of your product development lifecycle using this Scrum methodology diagram. Highlight team roles, sprint cycles, and delivery steps with clear, color-coded sections. Ideal for Agile coaches, product managers, and tech teams. Fully editable in PowerPoint, Keynote, and Google Slides to align with your project planning needs.


6 slides
Business Ethics and Governance Presentation
Navigate the complexities of ethical decision-making with our Business Ethics and Governance Presentation template. This visually engaging tool highlights key aspects of corporate ethics and governance, ideal for workshops and training sessions. Compatible with PowerPoint, Keynote, and Google Slides, it's designed to facilitate clear and effective discussions.


7 slides
Self-sufficient Environmental Infographic
In an era where sustainability is paramount, understanding self-sufficiency in environmental contexts has never been more crucial. Our refreshing infographic, adorned in crisp whites, lush greens, with subtle black nuances, delves deep into this pivotal subject. Crafted to be both educational and engaging, this infographic sheds light on the essentials of eco-friendly independence. It's a must-have tool for educators, environmental enthusiasts, policy-makers, and individuals aiming for a green footprint. Seamlessly integrated with PowerPoint, Keynote, and Google Slides, our infographic invites you to explore, educate, and empower for a more sustainable tomorrow.


7 slides
TAM SAM SOM Model Infographic
Strategically target market opportunities with our TAM SAM SOM Model Infographic, a crucial tool for entrepreneurs, marketers, and business strategists. This infographic simplifies the understanding of market sizing and potential for new products or services. Our infographic visually breaks down the Total Addressable Market (TAM), Serviceable Available Market (SAM), and Serviceable Obtainable Market (SOM), helping you to quantify the market demand and focus your business strategies effectively. With this tool, you can illustrate the layers of market segmentation, from the broadest perspective to the target segment you aim to capture. This SEO-friendly infographic is designed to guide teams in prioritizing product development, marketing efforts, and sales strategies. Utilize our TAM SAM SOM Model Infographic in your business plans and investor presentations to convey a clear market analysis and establish a strong foundation for your go-to-market strategy.


2 slides
Long-Term Vision Strategy Presentation
Spark forward momentum with a clean, modern slide that turns long-range planning into a story your audience can instantly follow. This presentation helps teams outline future goals, strategic priorities, and the actions needed to stay aligned over time. Fully compatible with PowerPoint, Keynote, and Google Slides.


8 slides
Impressive Business Metrics by Numbers
Highlight your company’s key wins with the Impressive Business Metrics by Numbers Presentation. This data-driven slide layout emphasizes three core metrics using bold numbering, modern icons, and clear titles—perfect for showcasing KPIs, milestones, or achievements. Ideal for reports, pitches, and performance reviews. Fully editable in PowerPoint, Keynote, and Google Slides.


10 slides
Quality Control with Six Sigma Framework Presentation
Enhance quality management with this Six Sigma Framework template. Highlight each phase—Define, Measure, Analyze, Improve, Control—in a clean, modern layout for effective presentations. Ideal for quality assurance teams, process analysts, and Six Sigma professionals. Fully editable in PowerPoint, Keynote, and Google Slides to match your brand and insights.


5 slides
5 Whys Analysis Slide Presentation
Unlock problem-solving clarity with a vibrant, puzzle-style layout that helps teams dig deeper and uncover the true reason behind any challenge. This presentation guides viewers through each “why” step in a simple, structured flow, making root-cause insights easy to communicate. Fully compatible with PowerPoint, Keynote, and Google Slides.