


Features
- 6 Unique slides
- Fully editable and easy to edit in Microsoft Powerpoint, Keynote and Google Slides
- 16:9 widescreen layout
- Clean and professional designs
- Export to JPG, PDF or send by email


Do you have any questions?
Recommend


7 slides
Business People Management Infographic
Business people refer to individuals involved in the world of commerce and trade, encompassing various roles within the business landscape. This Infographic is an illuminating and dynamic template designed to guide you through the art and science of managing human capital within the business sphere. Explore the key aspects of effective people management and elevate your organizational success by harnessing the power of your workforce. Compatible with Powerpoint, Keynote, and Google Slides. Discover the art of leading and engaging your team, and witness the transformation as your organization excels and grows, driven by the power of effective people management!


6 slides
Harvey Ball Analysis Infographic
The Harvey Ball Analysis, often referred to as the Harvey Ball Method or simply the Harvey Ball, is a visual representation technique used for comparative assessment. This infographic template visually represents data using Harvey Balls, which are simple circular icons that can be filled or unfilled to represent different levels of a specific attribute. The infographic involves using a series of circles, typically colored, to represent and compare different items or variables. This template is perfect for businesses and decision-making to visually communicate the relative performance or significance of various options, elements, or categories.


20 slides
Mythion Business Idea Pitch Deck Presentation
Communicate your business vision with clarity and impact using this comprehensive pitch deck presentation template. Perfect for entrepreneurs, startups, and innovators, this template is designed to help you effectively present your idea to investors, stakeholders, or partners. Cover every essential aspect of your business journey with slides dedicated to the problem statement, solutions, market overview, and target audience. Showcase your business model, revenue projections, and unique selling proposition with visually appealing layouts. Highlight your marketing strategy, growth projections, and funding requirements to build a strong, persuasive case. Fully customizable and compatible with PowerPoint, Google Slides, and Keynote, this template allows you to tailor each slide to suit your business identity and goals. Whether you're pitching a new idea or seeking investment, this template ensures you present with professionalism and confidence.


24 slides
Kepler Investor Pitch Presentation
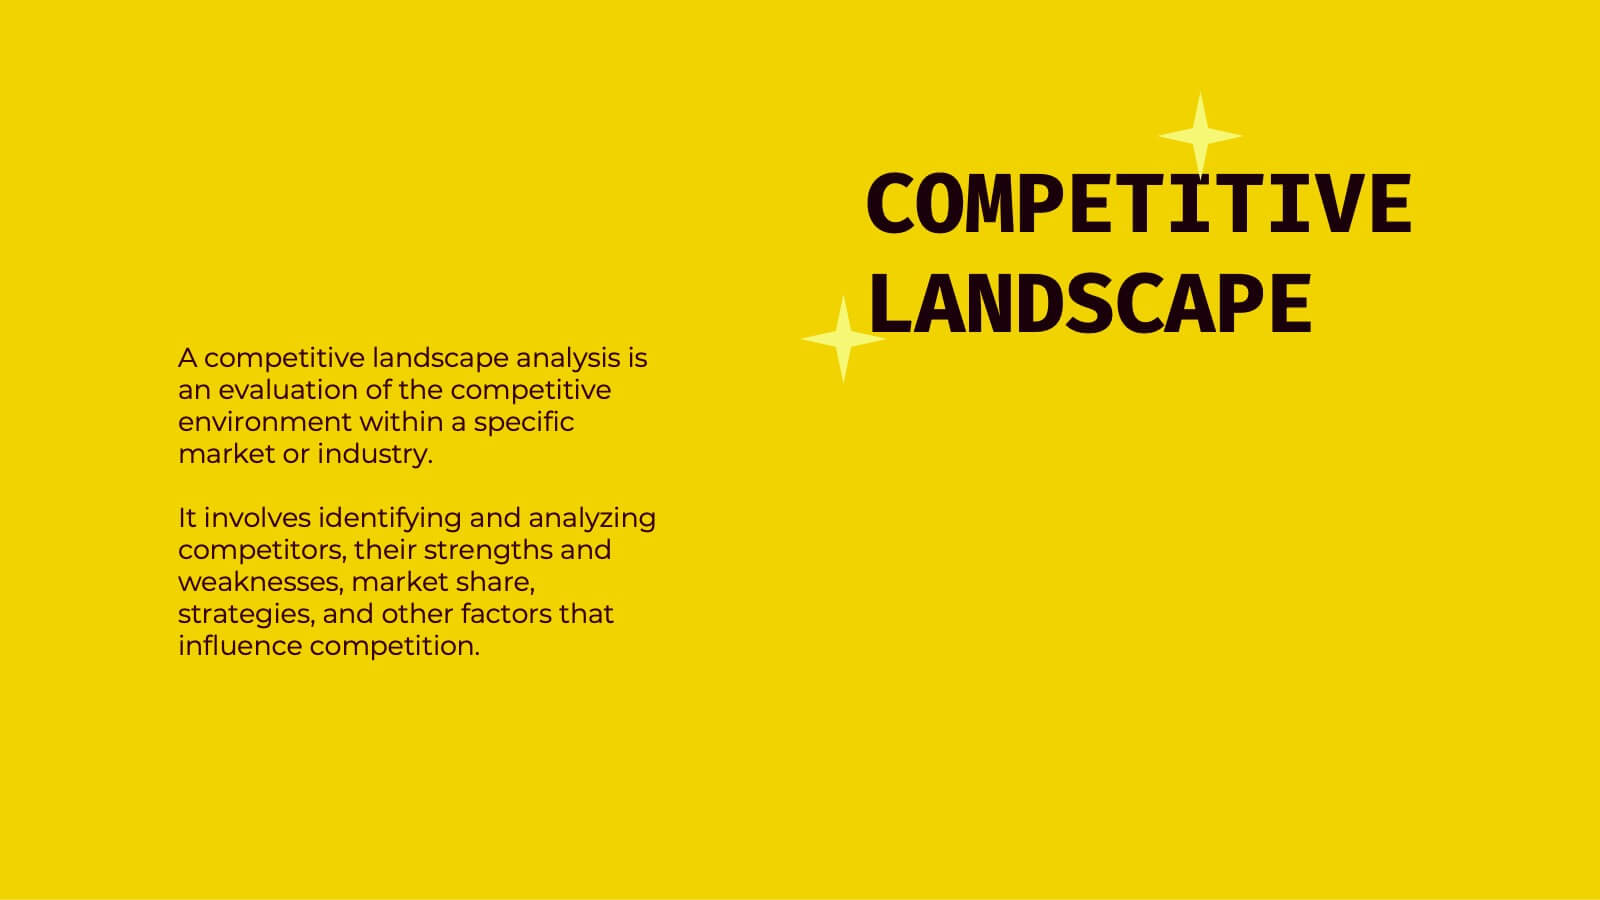
Impress potential investors with this thoughtfully crafted investor pitch presentation template. Its sleek design is tailored to captivate attention while delivering a clear and concise narrative about your business. Highlight key sections, including your company overview, problem statement, and innovative solutions, all designed to set you apart from the competition. Dive deep into your market opportunities, target audience, and revenue model, using visually engaging layouts and infographics. Showcase growth projections, financial overviews, and funding requirements with clarity and professionalism. Additionally, present your unique selling proposition, milestones, and risk analysis effectively. With dedicated slides for team introductions and a compelling close, this template is perfect for startups and established businesses alike. Fully customizable and compatible with PowerPoint, Google Slides, and Keynote, it ensures seamless branding and adaptability for any presentation. Engage your audience and secure the investment you need!


7 slides
Security Framework Infographic
A security framework, also known as a cybersecurity framework, is a structured set of guidelines, best practices, standards, and processes that help organizations design, implement, monitor, and manage robust security measures to protect their information systems and resources. This infographic template is a fortress of knowledge, guiding you through the pillars of a robust security infrastructure that safeguards your digital realm. Compatible with Powerpoint, Keynote, and Google Sides. Every element in this infographic embodies a facet of a comprehensive security framework.


5 slides
Country Breakdown South America Map Presentation
Turn complex regional data into clear visual insights with this modern map layout designed for South America. Perfect for showcasing country statistics, market segmentation, or performance comparisons, this slide keeps information clean and engaging. Fully compatible with PowerPoint, Keynote, and Google Slides for easy editing and professional presentations.


5 slides
Creative Alphabet Display Template
Make your message memorable with the Creative Alphabet Display Template Presentation. This slide uses bold, interlocking letter shapes to showcase four key ideas in a linear, eye-catching format—perfect for step-by-step processes, value breakdowns, or themed concepts. Fully editable in PowerPoint, Keynote, and Google Slides.


22 slides
Thistlewisp Advertising Agency Proposal Presentation
Win clients and showcase your agency’s capabilities with this sleek and comprehensive proposal presentation! It highlights essential sections like mission and vision, client success stories, case studies, market trends, and creative processes to create a compelling pitch. Ideal for client presentations, this template is fully compatible with PowerPoint, Keynote, and Google Slides.


7 slides
Project Management Tools Infographic
Project management is the discipline of planning, organizing, securing, and managing resources to achieve specific goals within a defined time frame and budget. This visually appealing and informative template allows you to represent project lifecycles, key milestones, team roles, and more, making complex project data easily digestible. Fully customizable and compatible with Powerpoint, Keynote, and Google Slides. Illustrate the project lifecycle from initiation to completion for a comprehensive understanding. Utilize this template to effectively show project progress and objectives, ensuring your audience is informed throughout the project's lifecycle.

20 slides
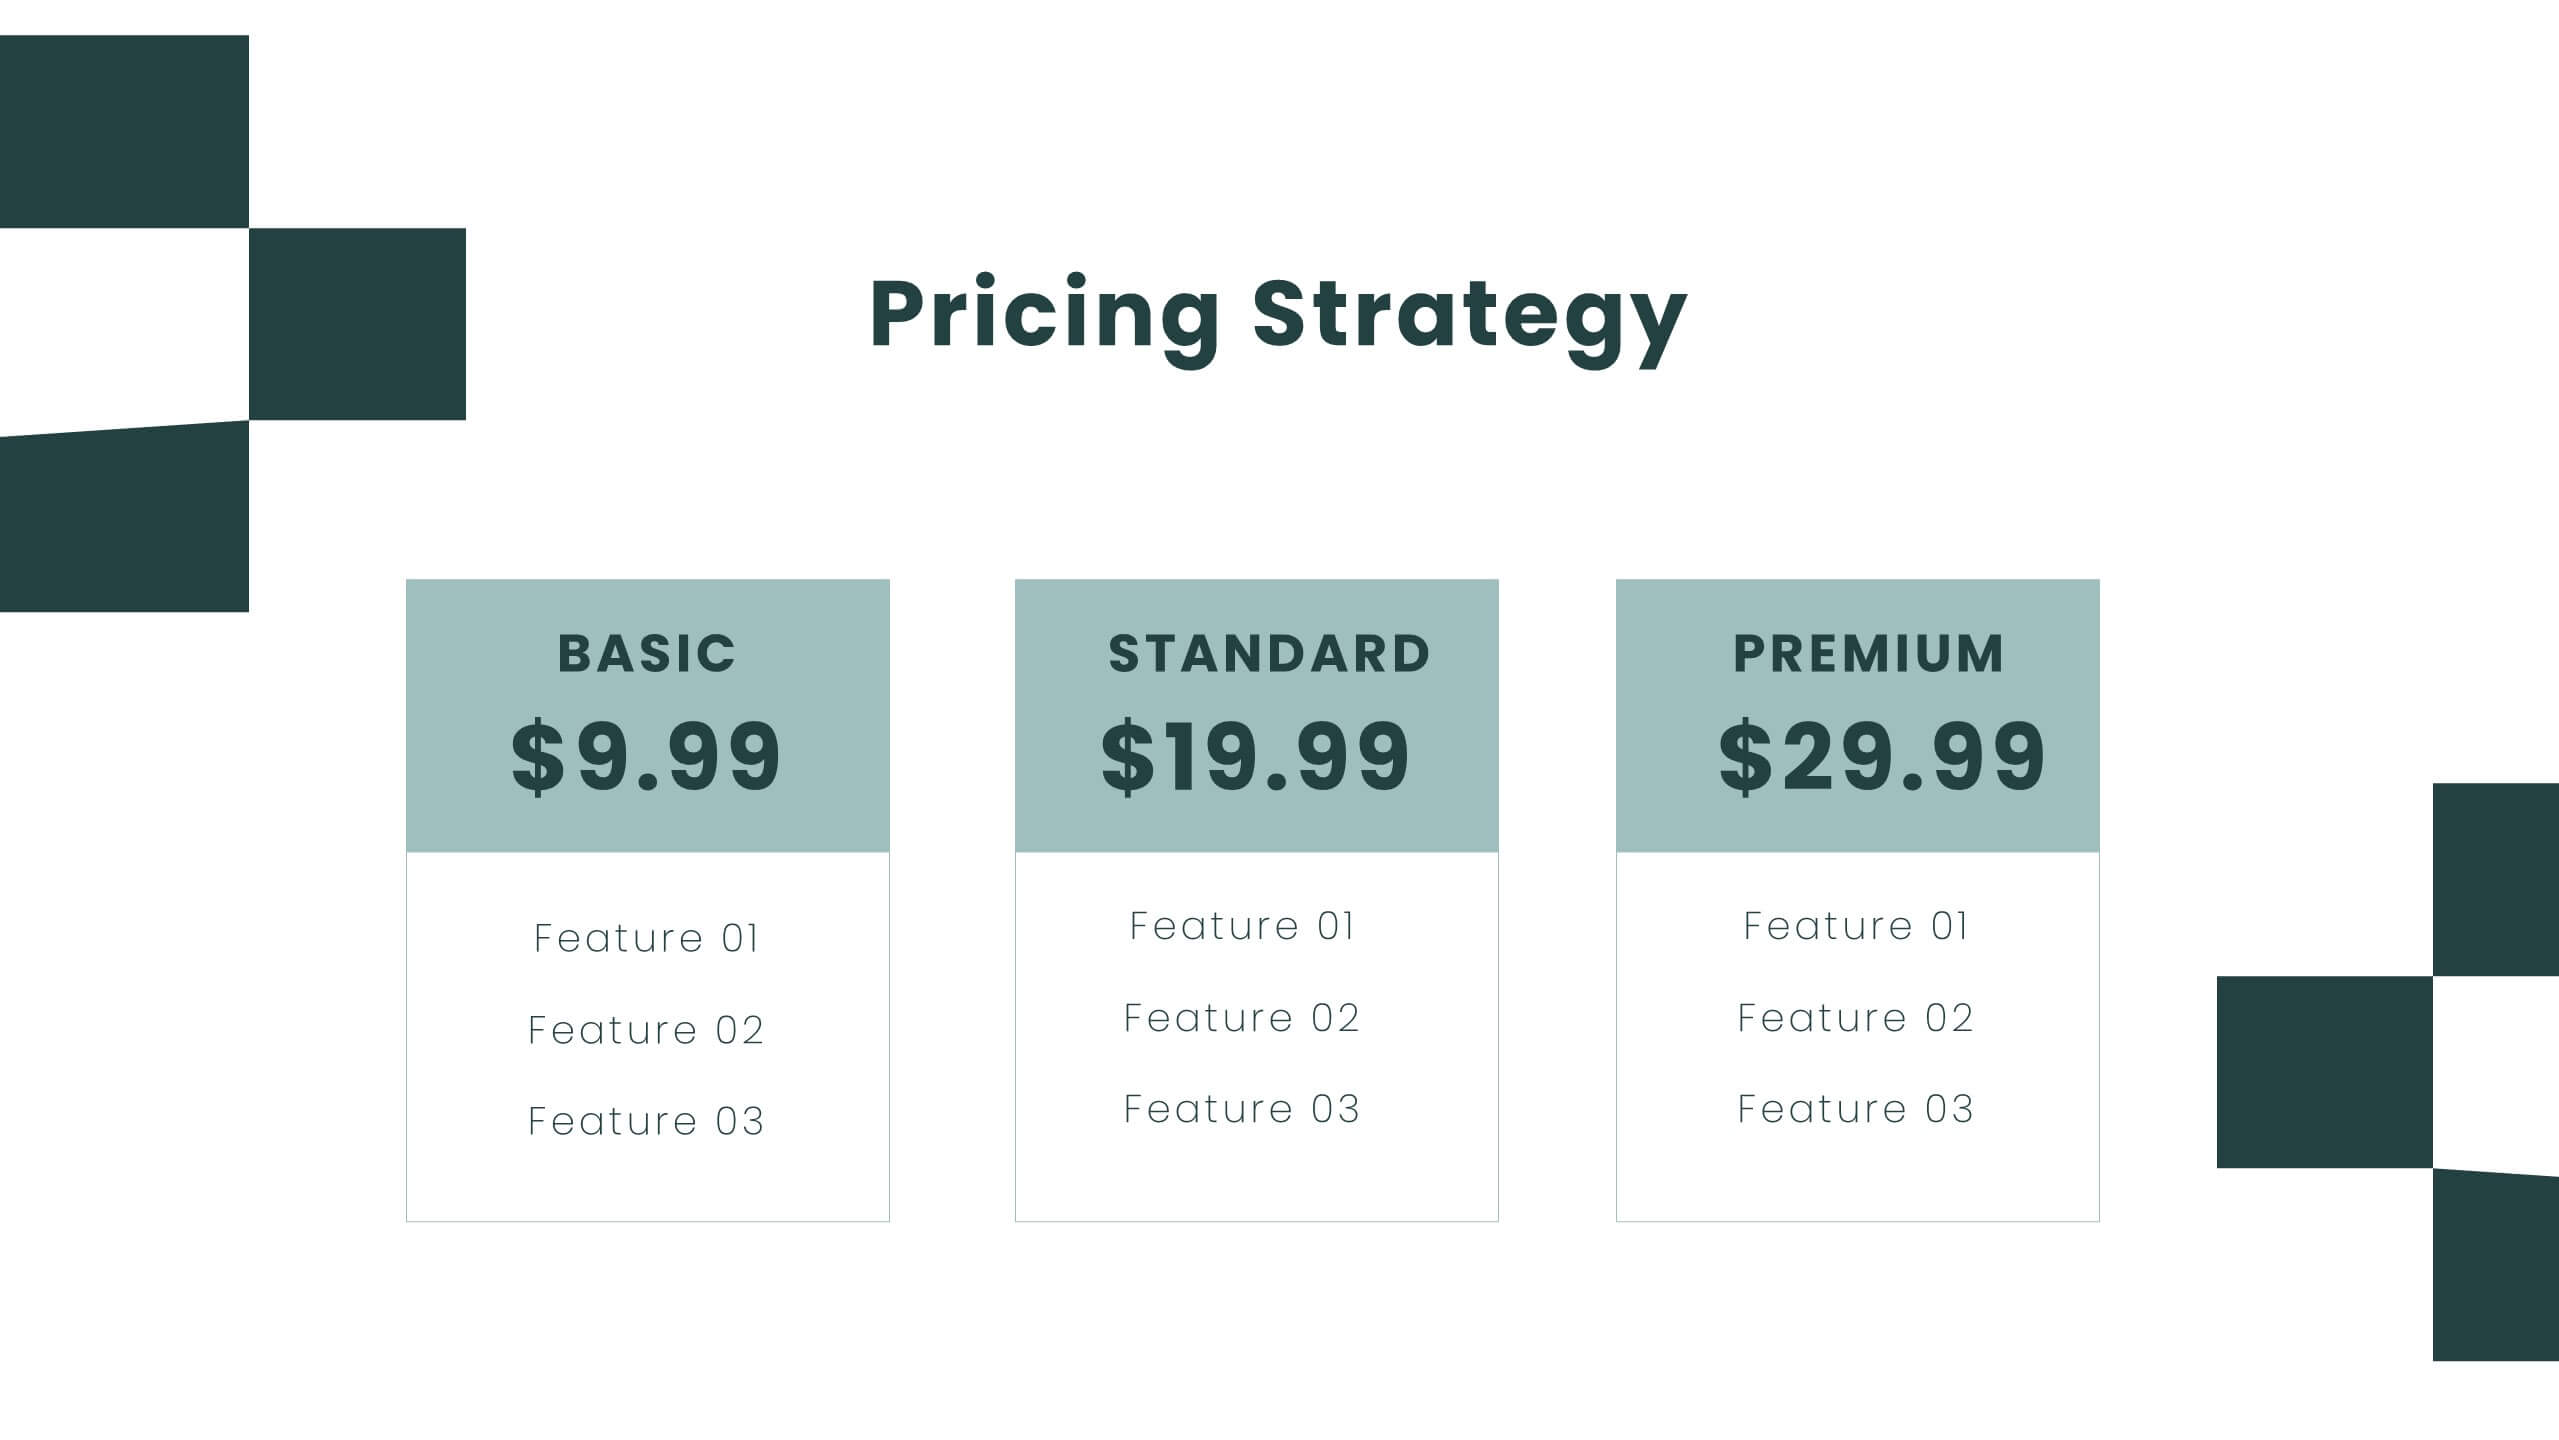
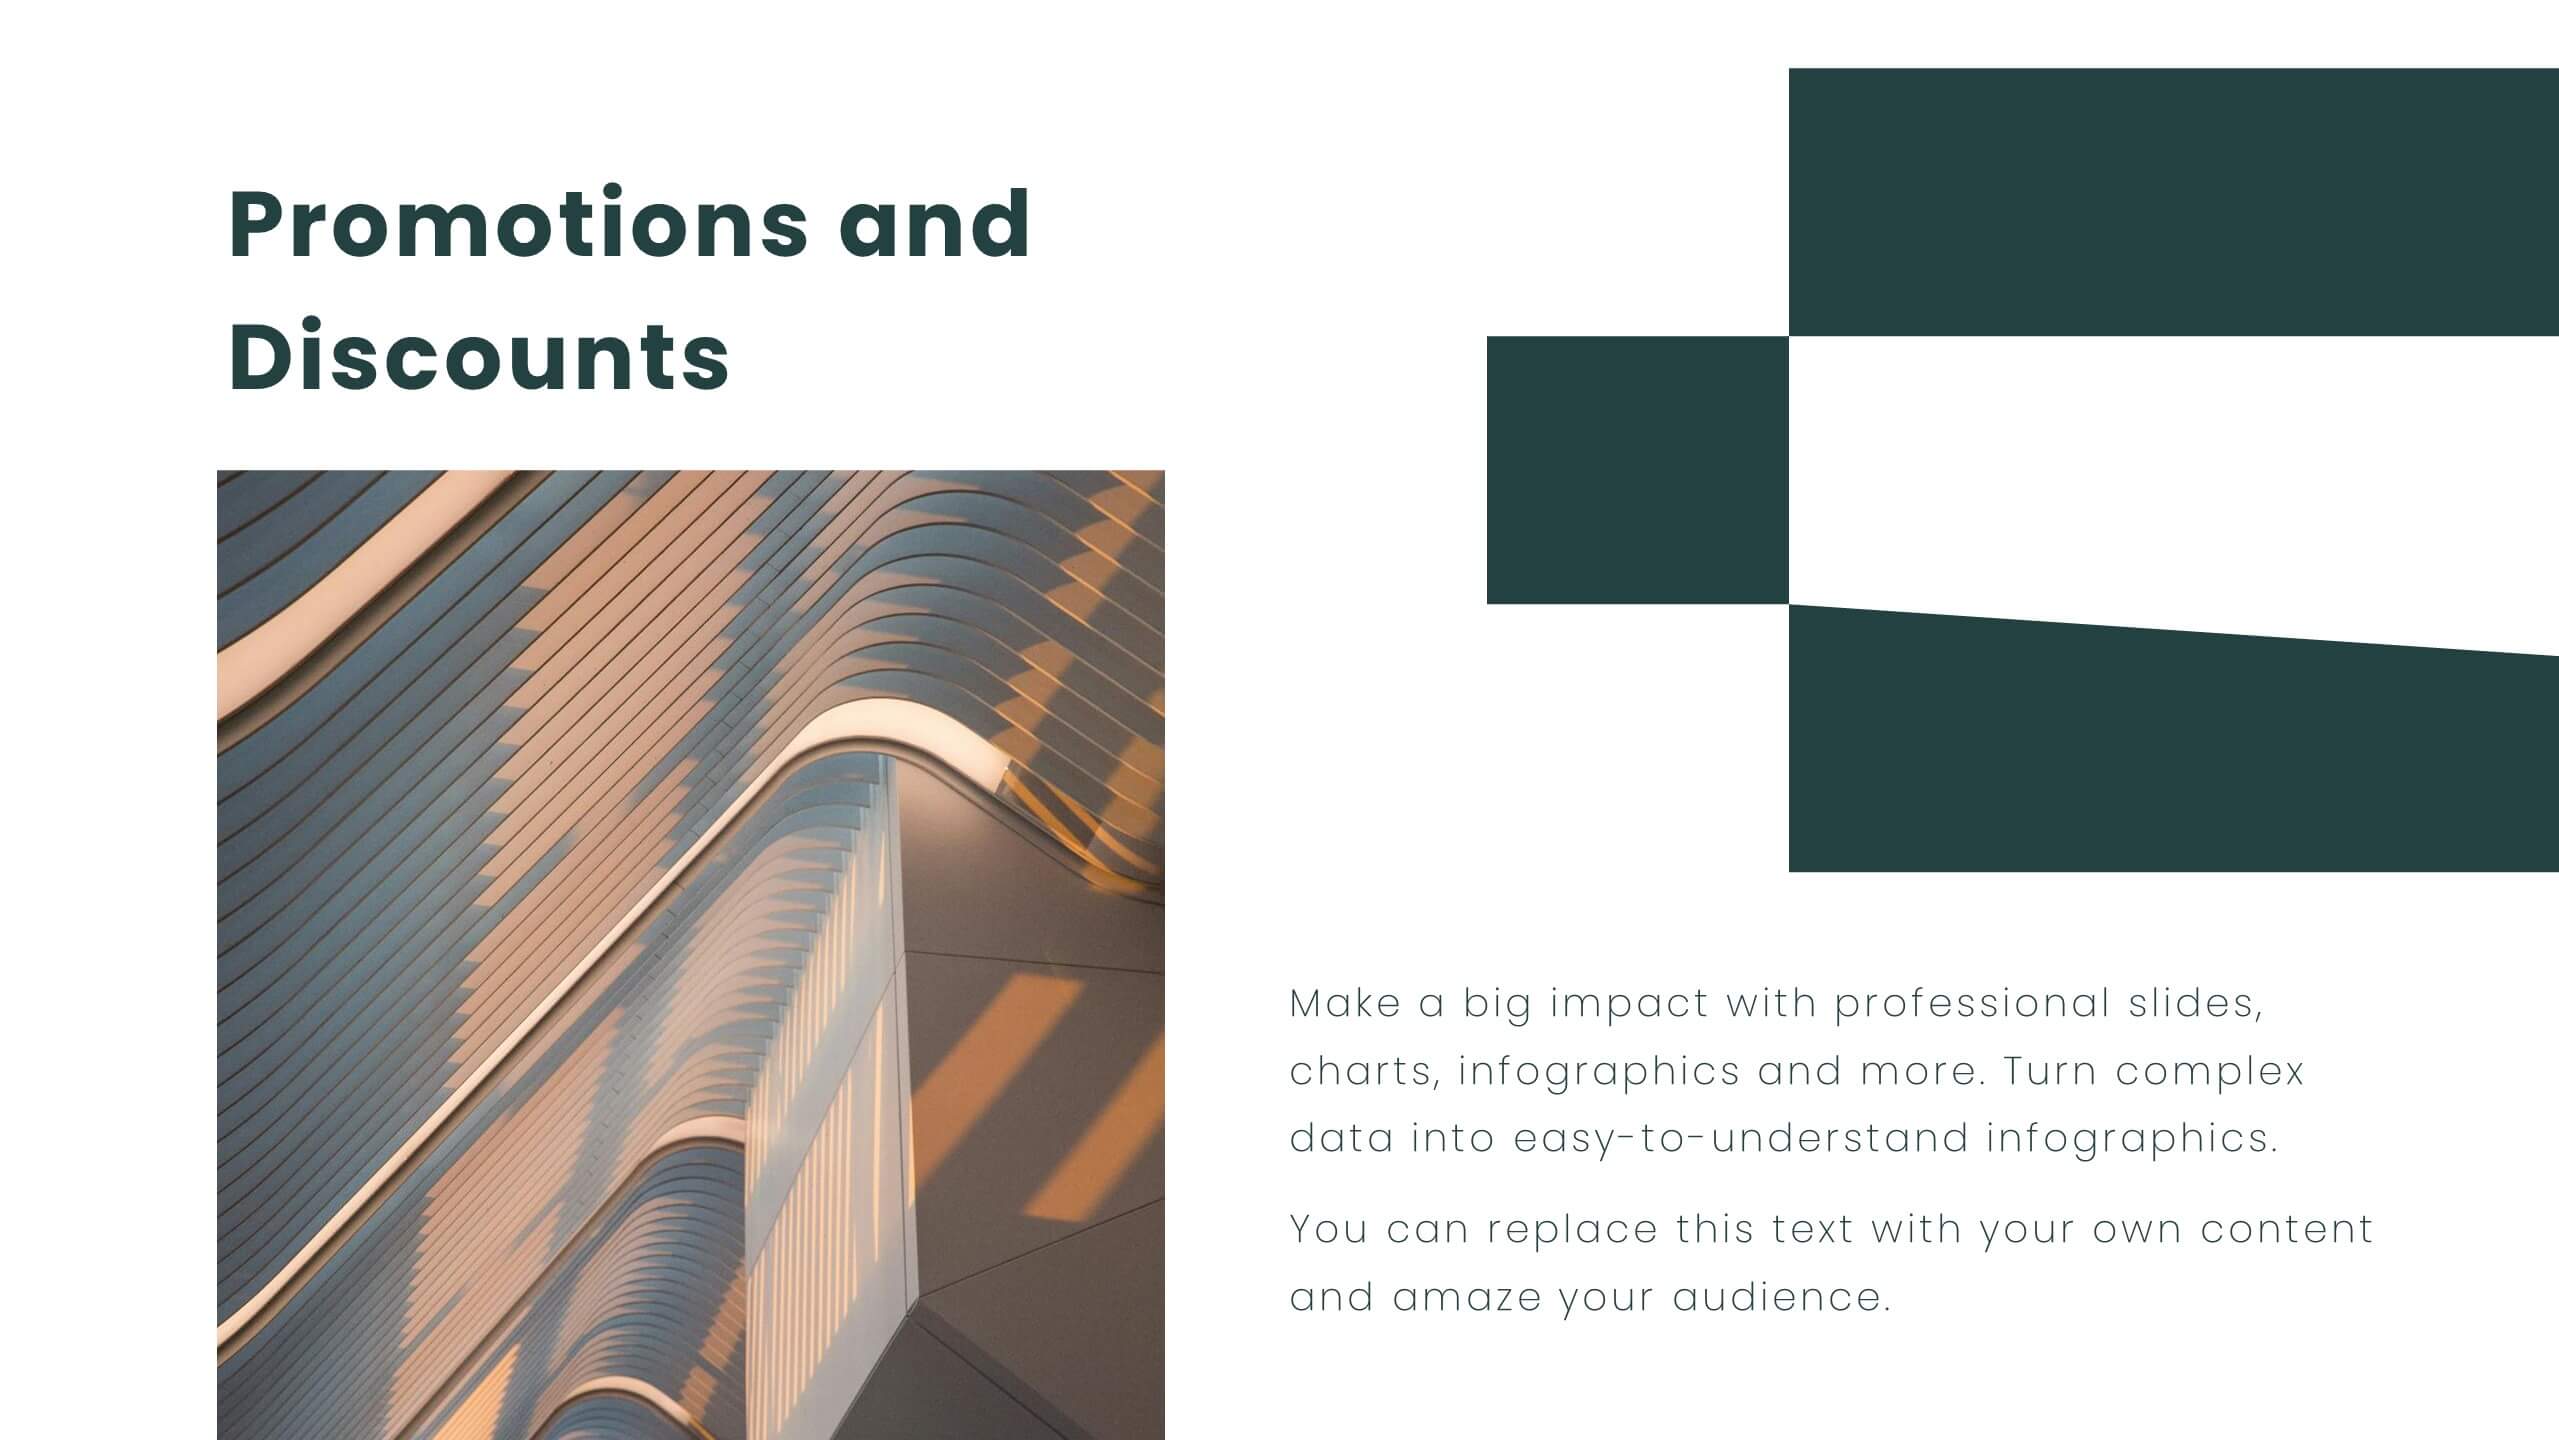
Radiant Sales Proposal Presentation
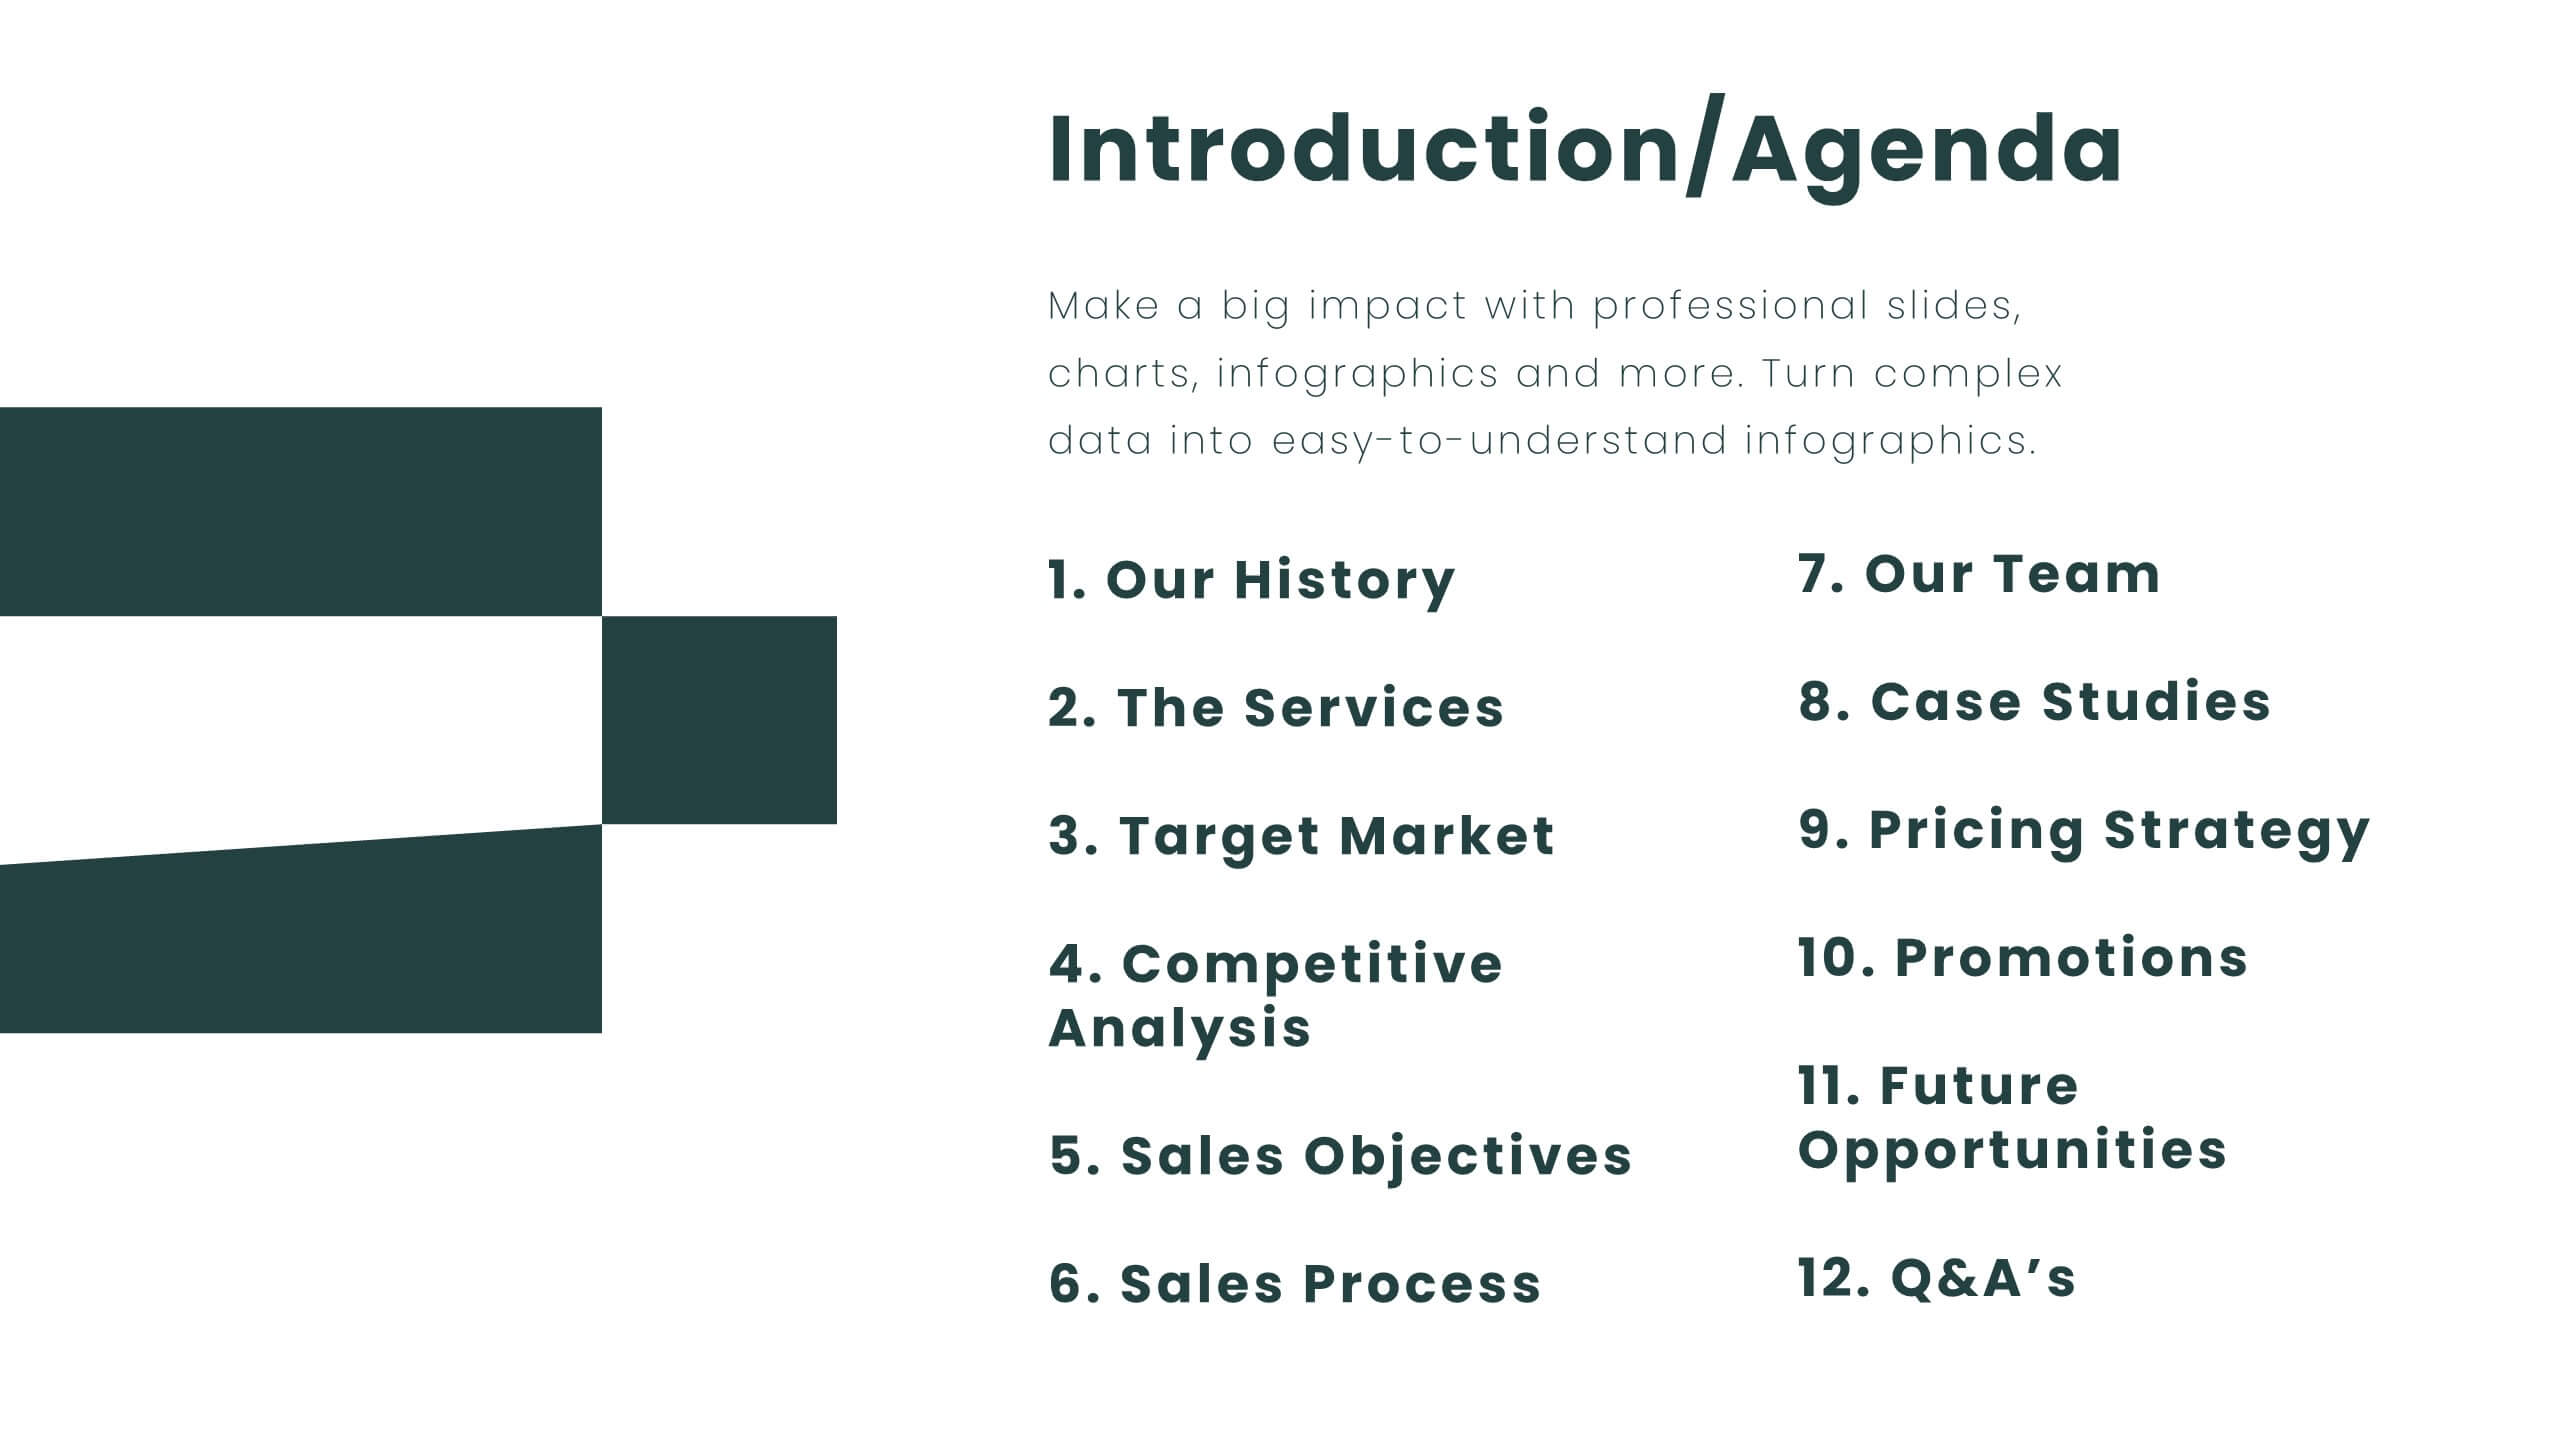
Elevate your pitch with this polished sales proposal template! Perfect for presenting company overviews, product/service details, and pricing strategies, it includes slides for competitive analysis and customer testimonials. Impress your audience with clear visuals and structured content. Compatible with PowerPoint, Keynote, and Google Slides for seamless presentations on any platform.


6 slides
Stakeholder Management Analysis Infographics
Efficiently manage stakeholders with our Stakeholder Management Analysis infographic template. This template is fully compatible with popular presentation software like PowerPoint, Keynote, and Google Slides, allowing you to easily customize it to analyze and communicate your stakeholder management strategies. The Stakeholder Management Analysis infographic template offers a visually engaging platform to assess, categorize, and prioritize stakeholders based on their influence and interest in your projects or initiatives. Whether you're a project manager, business leader, or involved in stakeholder engagement, this template provides a user-friendly canvas to create informative presentations and reports on stakeholder management. Optimize your stakeholder relationships with this SEO-optimized Stakeholder Management Analysis infographic template, thoughtfully designed for clarity and ease of use. Customize it to showcase stakeholder mapping, engagement strategies, and communication plans, helping you ensure that your stakeholders' needs and expectations are met effectively. Start crafting your personalized infographic today to excel in stakeholder management.


5 slides
Infrastructure and Construction Industry
Showcase progress and performance metrics in the construction sector using this crane-themed, vertical bar chart design. Perfect for engineers, project managers, and developers, this slide uses color-coded scaffolding to illustrate percentages, growth, or completion rates. Fully editable in PowerPoint, Keynote, and Google Slides.


5 slides
AIDA Marketing Funnel Presentation
The "AIDA Marketing Funnel Presentation" template is expertly designed to streamline the visualization of the AIDA model, which stands for Attention, Interest, Desire, and Action. This template aids marketers in presenting and analyzing the effectiveness of marketing strategies to capture the consumer's journey from awareness to the final action of purchasing. Each stage of the funnel is clearly defined and color-coded, making it simple to insert specific strategies or results that relate to each step of the consumer engagement process. Ideal for marketing presentations, this template helps in explaining complex concepts in a digestible format, ensuring that the audience can easily follow along and understand key marketing tactics and outcomes.


7 slides
Innovation Infographics Presentation Template
Our innovation Infographic template is a trendy and professional way to present innovation to your audience in a way that keeps them engaged. This design features simple yet striking elements which will deliver your message, while the font and color scheme gives you that flexibility to personalize this template to your brand’s identity. We have designed this presentation template to help you create and deliver engaging content for your audience. It is a powerful tool that helps you build interest, generate leads and position yourself as an authority on the subject of innovation.


21 slides
Echochime Project Timeline Presentation
Outline your project’s milestones and deliverables with this comprehensive timeline-focused presentation template. Ideal for project managers and teams, this layout streamlines the process of showcasing objectives, schedules, and key milestones with clarity and precision. The template includes dedicated slides for problem statements, resource allocation, budget planning, stakeholder communication, risk management, and quality assurance. Its visually engaging timeline design ensures a clear and professional overview of your project's progress. Designed for seamless customization, this template is fully compatible with PowerPoint, Google Slides, and Keynote, allowing you to tailor colors, fonts, and layouts to align with your project branding. Present your strategy and progress with confidence, ensuring stakeholders and team members stay informed and aligned.


5 slides
SEO and Funnel Tactics in Marketing Presentation
Showcase your digital strategy step-by-step with the SEO and Funnel Tactics in Marketing Presentation. Designed with a layered visual layout, this template helps you highlight up to five key stages of your marketing funnel—from awareness to conversion. Fully customizable in PowerPoint, Canva, Keynote, and Google Slides.


6 slides
Break Even Analysis Rate Infographics
Analyze your business's break-even point effectively with our Break-Even Analysis Rate infographic template. This template is fully compatible with popular presentation software like PowerPoint, Keynote, and Google Slides, allowing you to easily customize it to illustrate and communicate critical break-even analysis concepts. The Break-Even Analysis Rate infographic template offers a visually engaging platform to calculate and display the point at which your business covers all its costs and begins to generate a profit. Whether you're an entrepreneur, financial analyst, or business owner, this template provides a user-friendly canvas to create informative presentations and reports on your break-even analysis. Optimize your financial decision-making with this SEO-optimized Break-Even Analysis Rate infographic template, thoughtfully designed for clarity and ease of use. Customize it to showcase your break-even calculations, assumptions, and scenarios, helping you make informed decisions about pricing, costs, and profitability. Start crafting your personalized infographic today to enhance your break-even analysis skills and strategies.