


Features
- 6 Unique slides
- Fully editable and easy to edit in Microsoft Powerpoint, Keynote and Google Slides
- 16:9 widescreen layout
- Clean and professional designs
- Export to JPG, PDF or send by email


Do you have any questions?
Recommend

20 slides
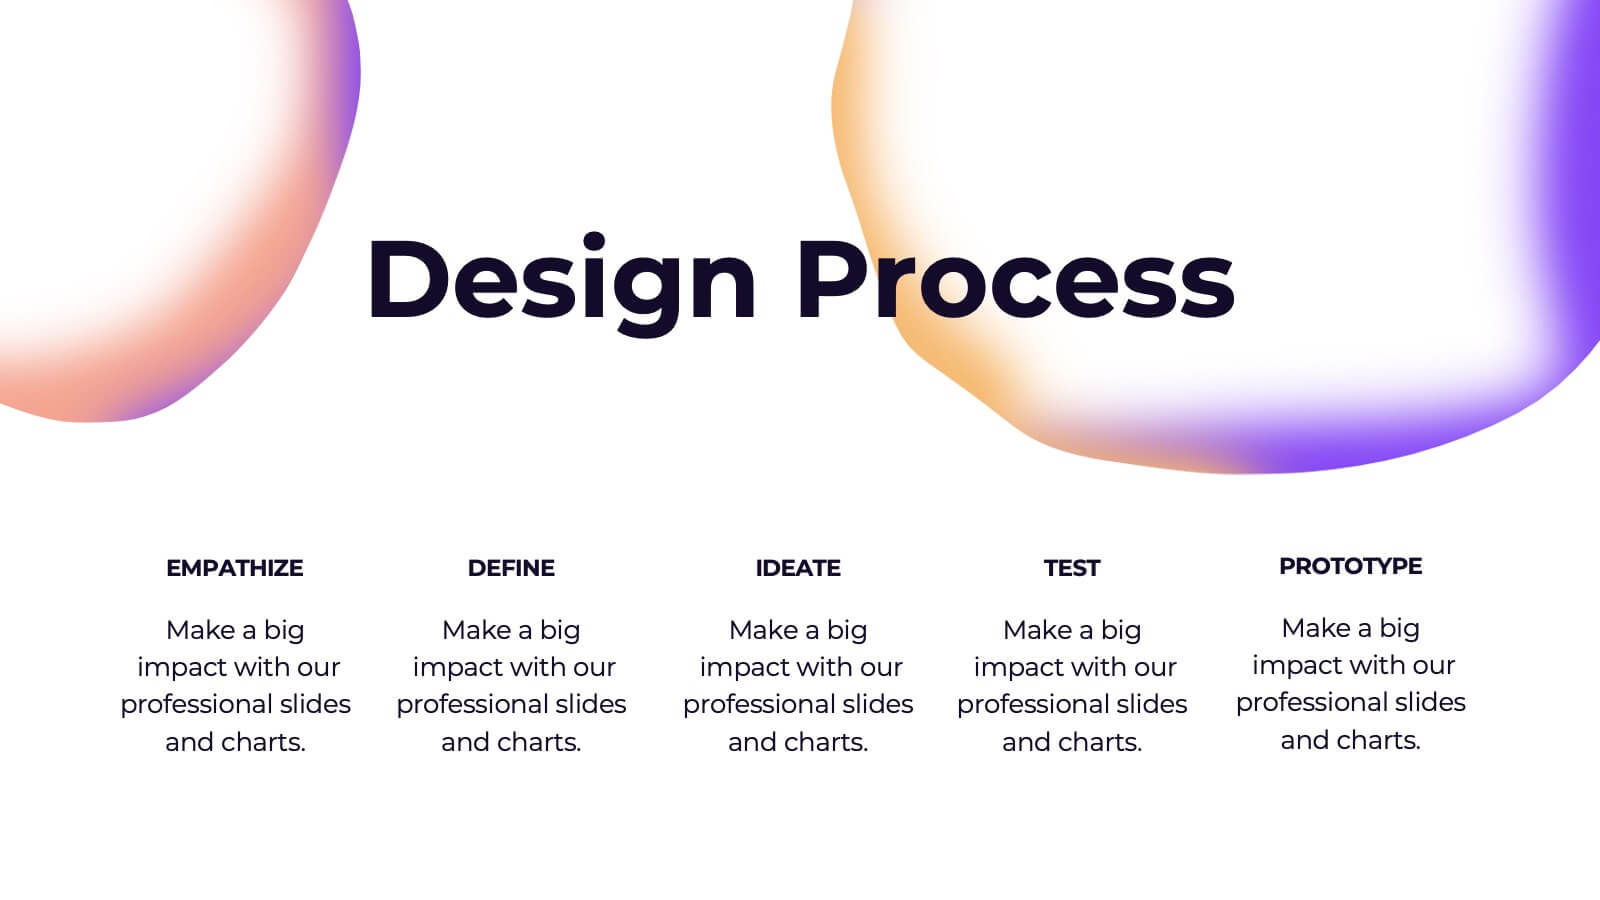
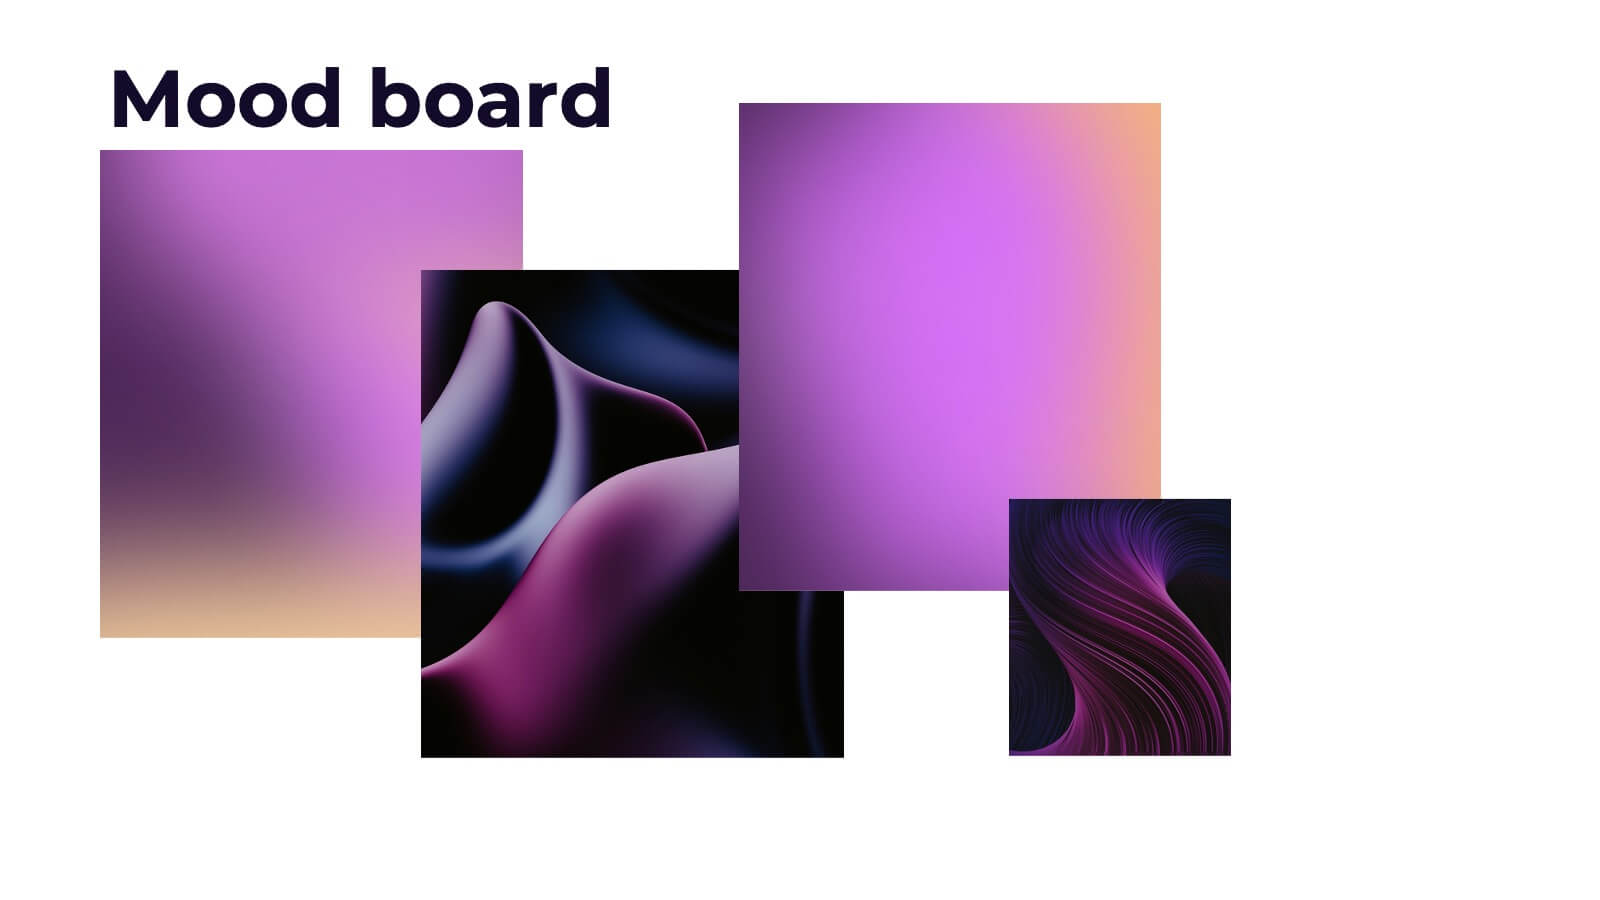
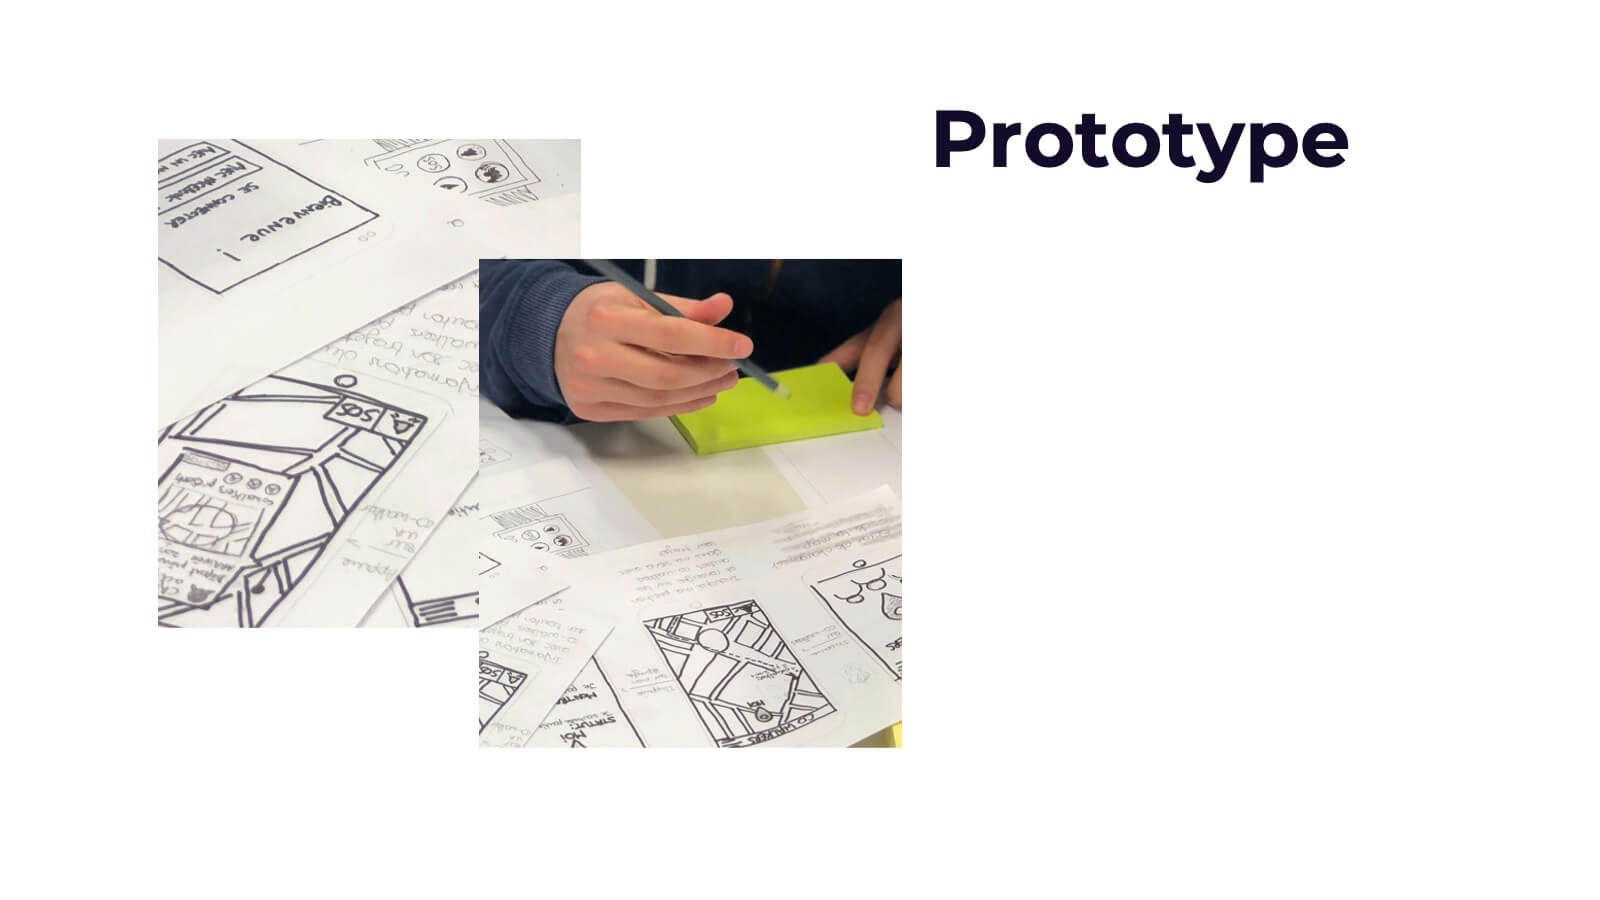
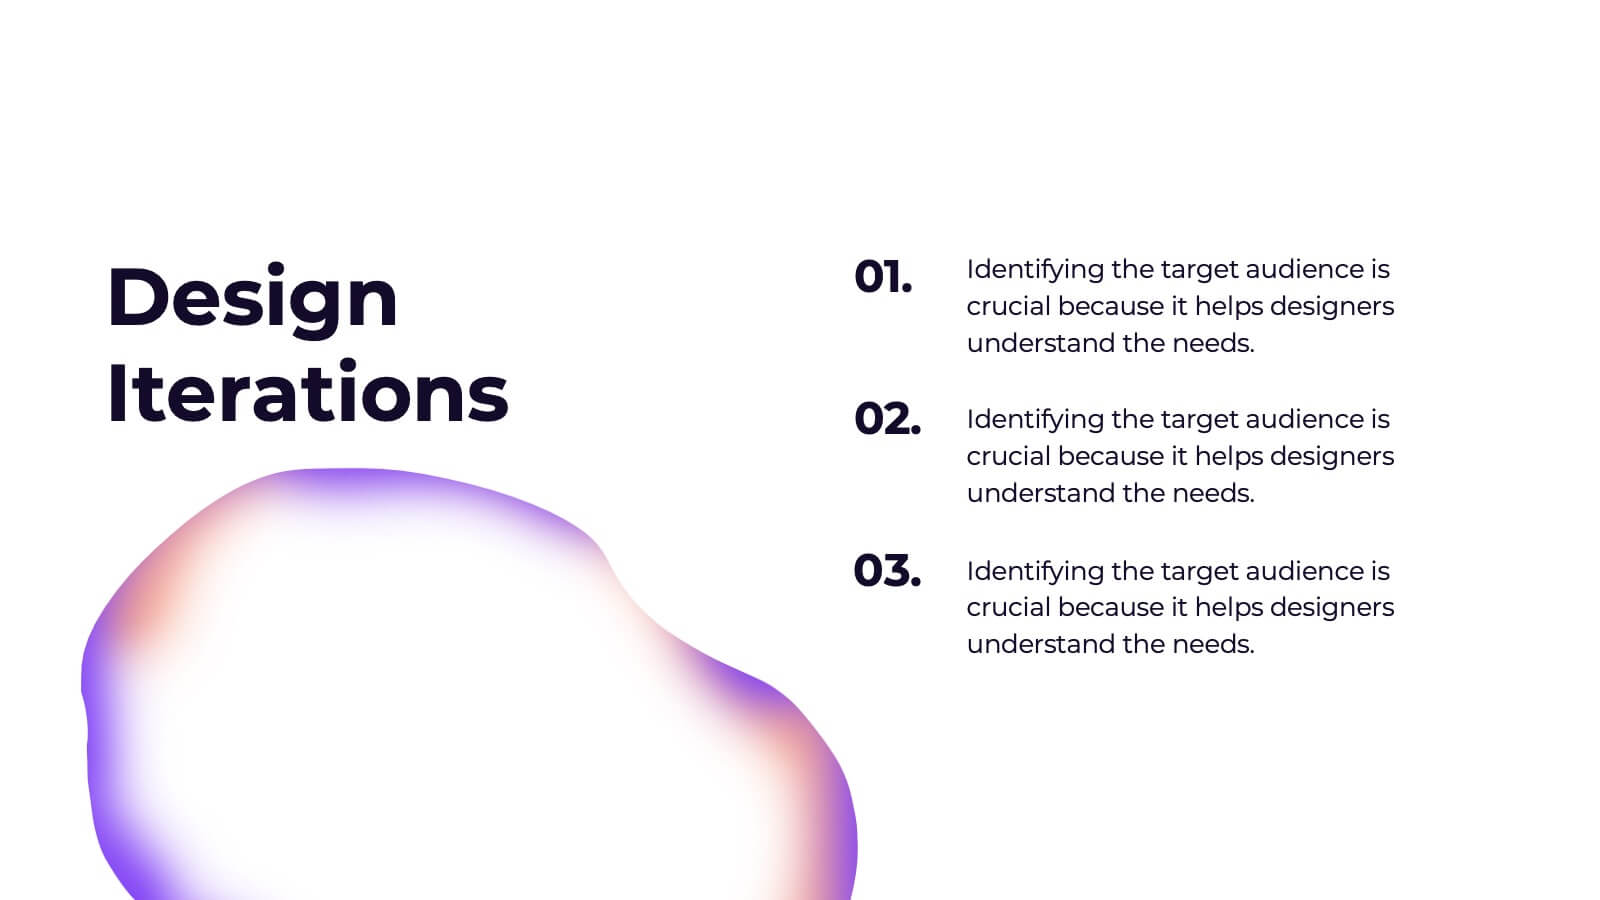
Valkyrie Design Strategy Proposal Presentation
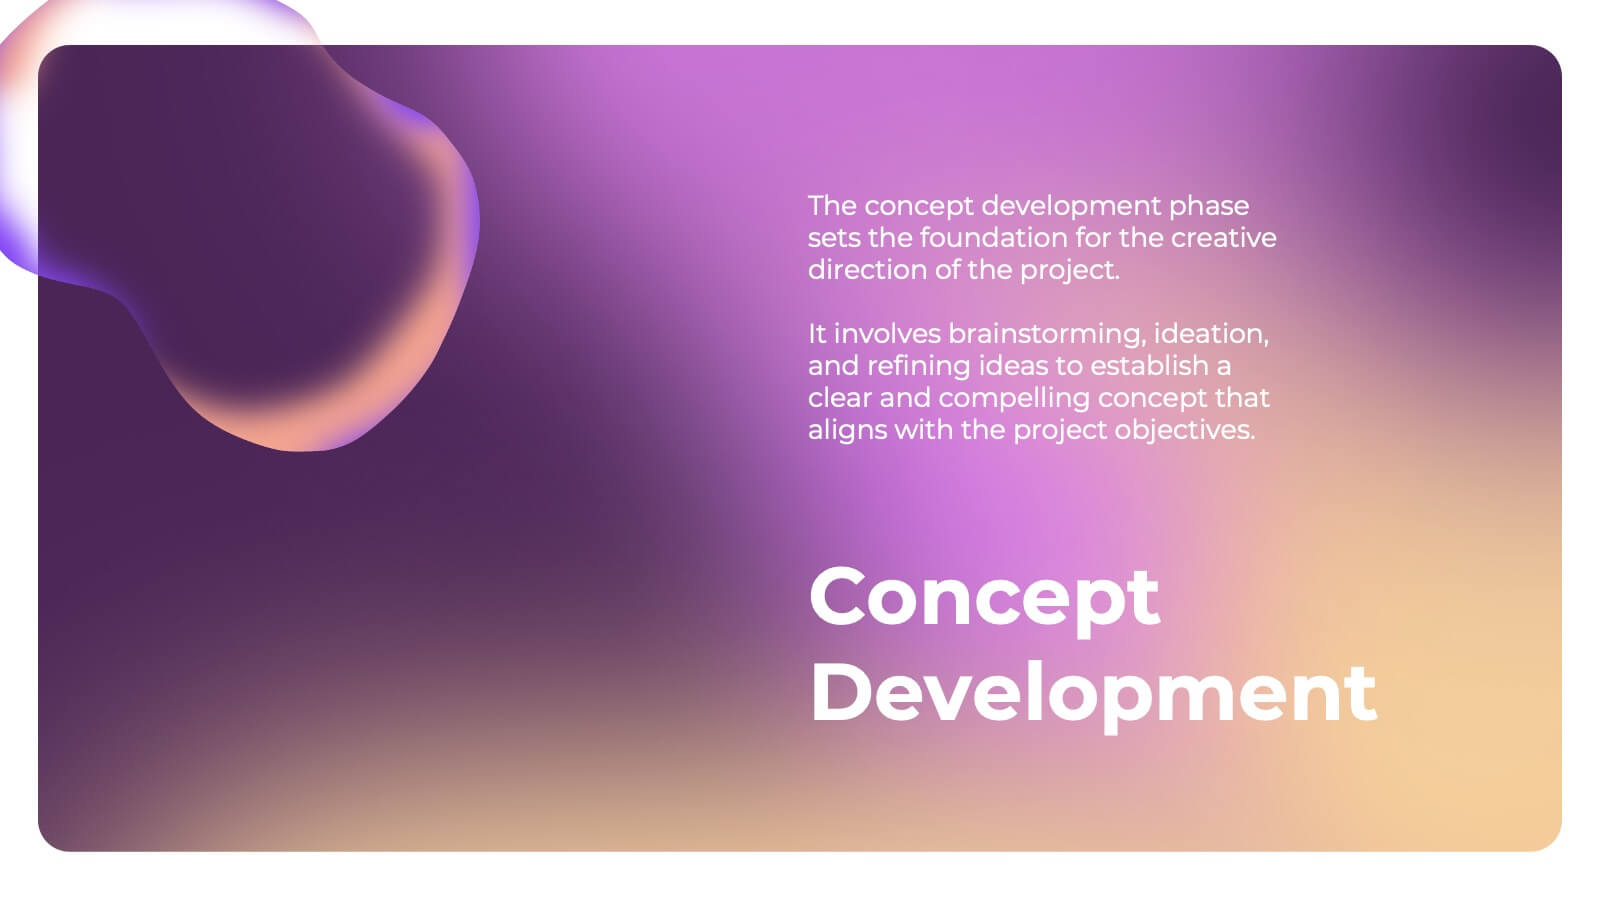
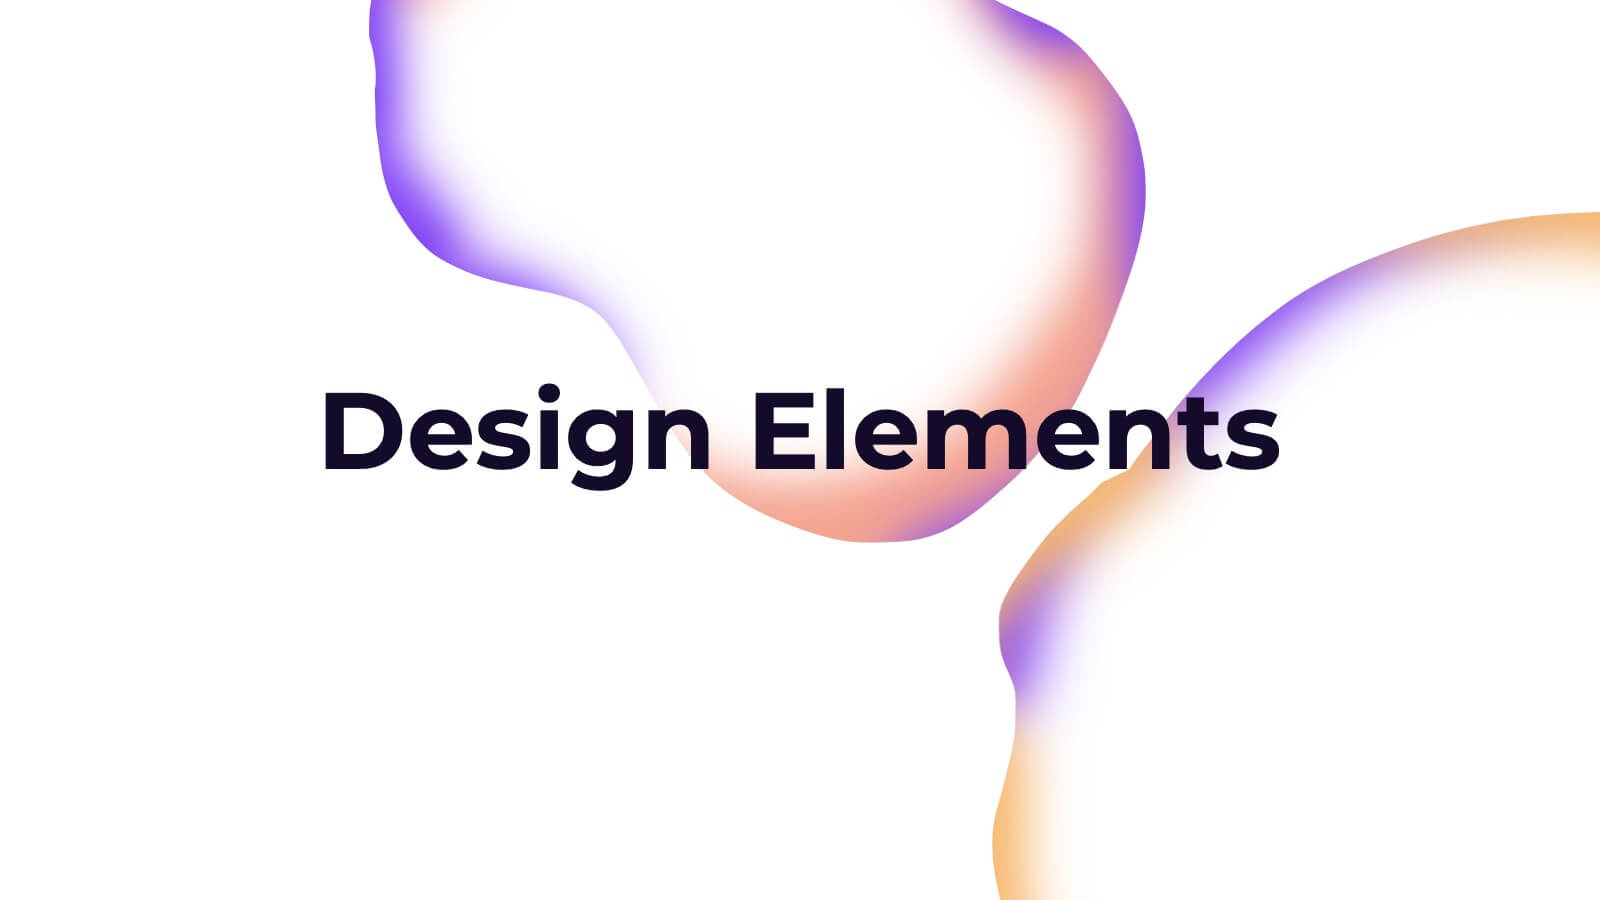
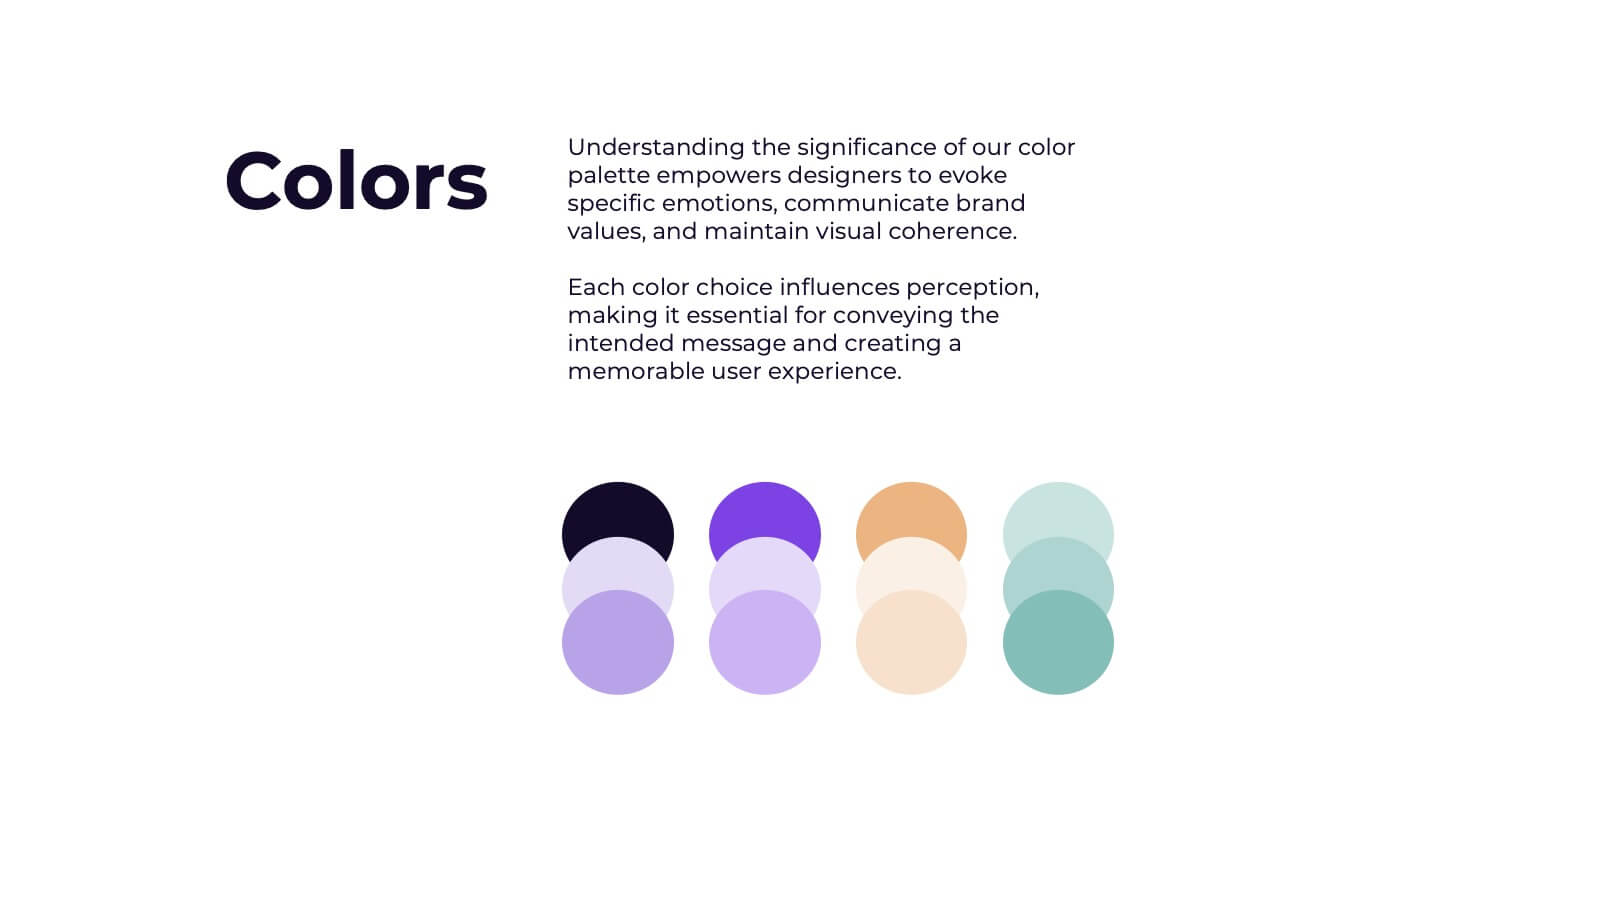
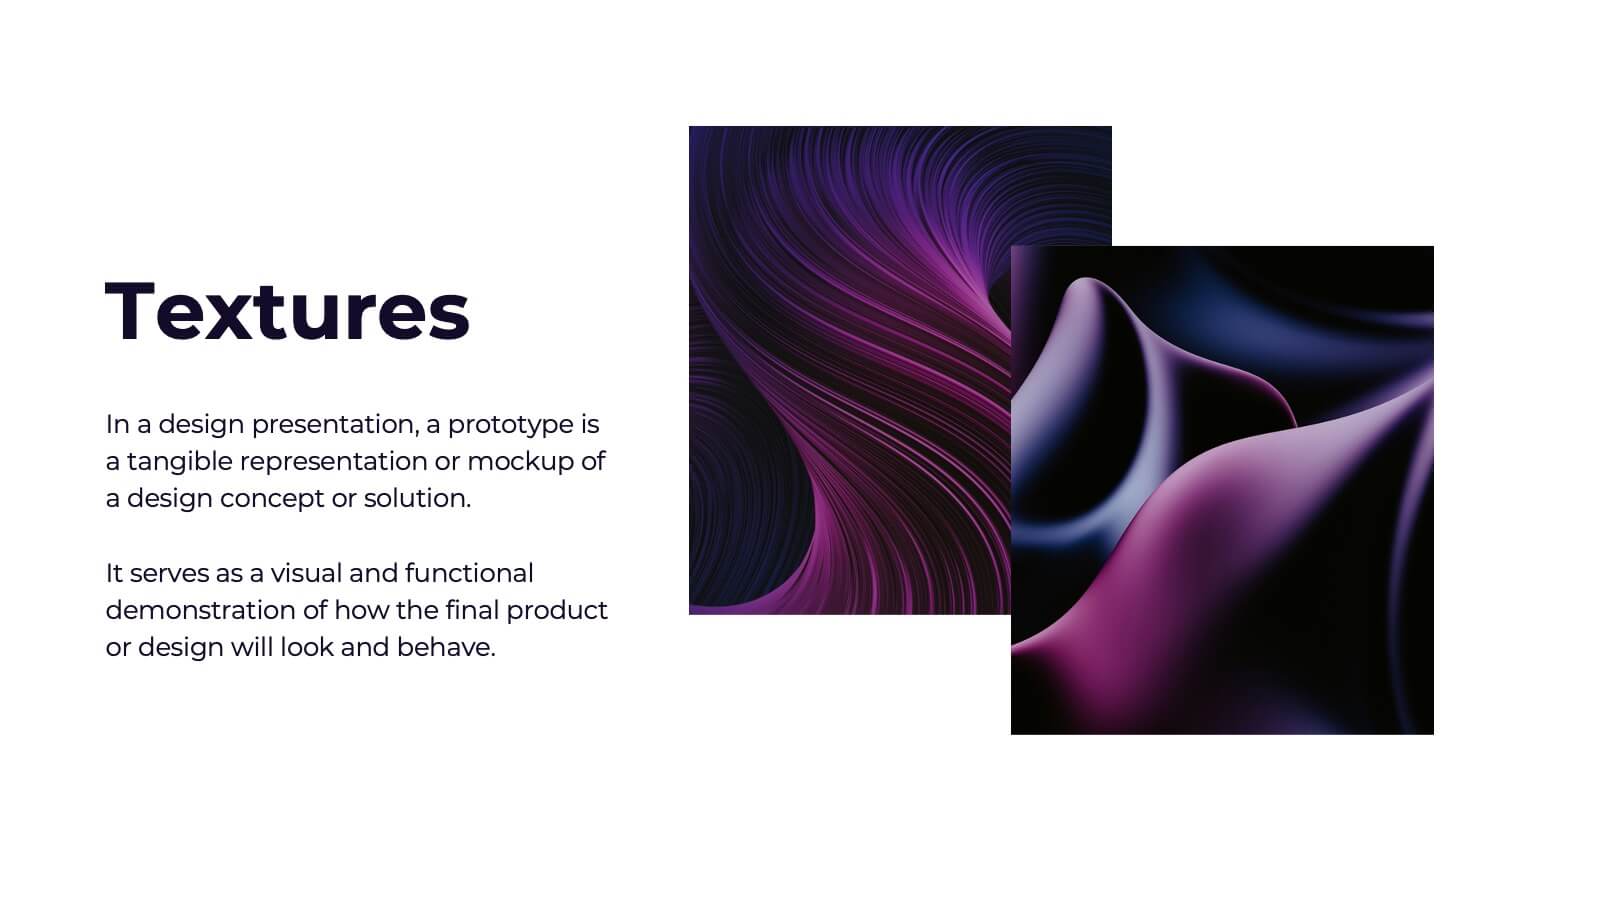
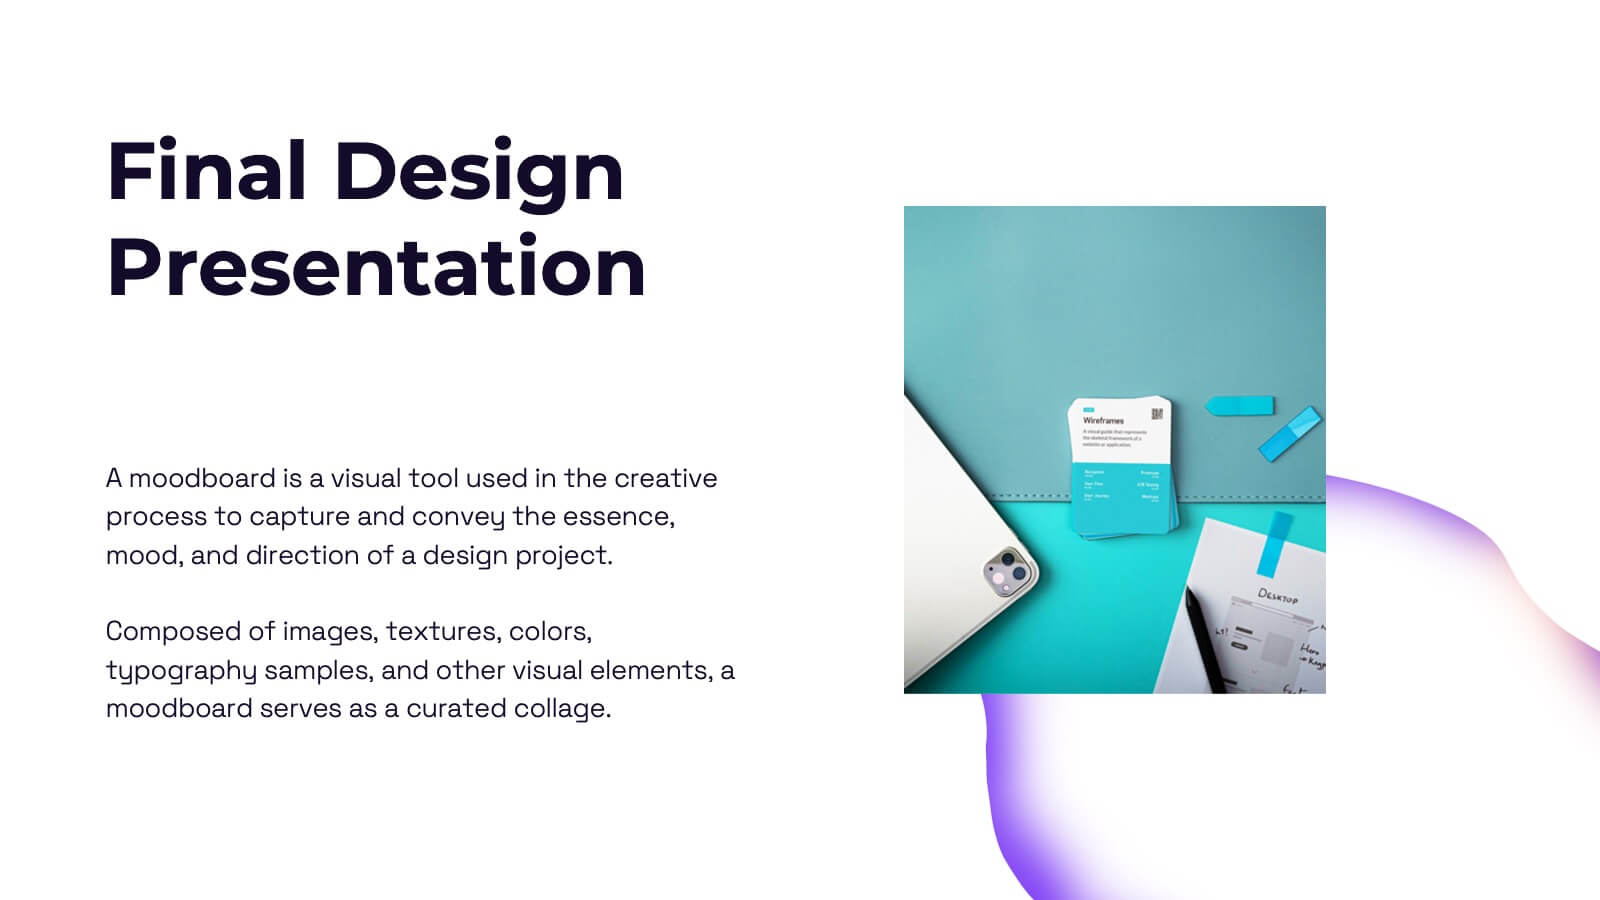
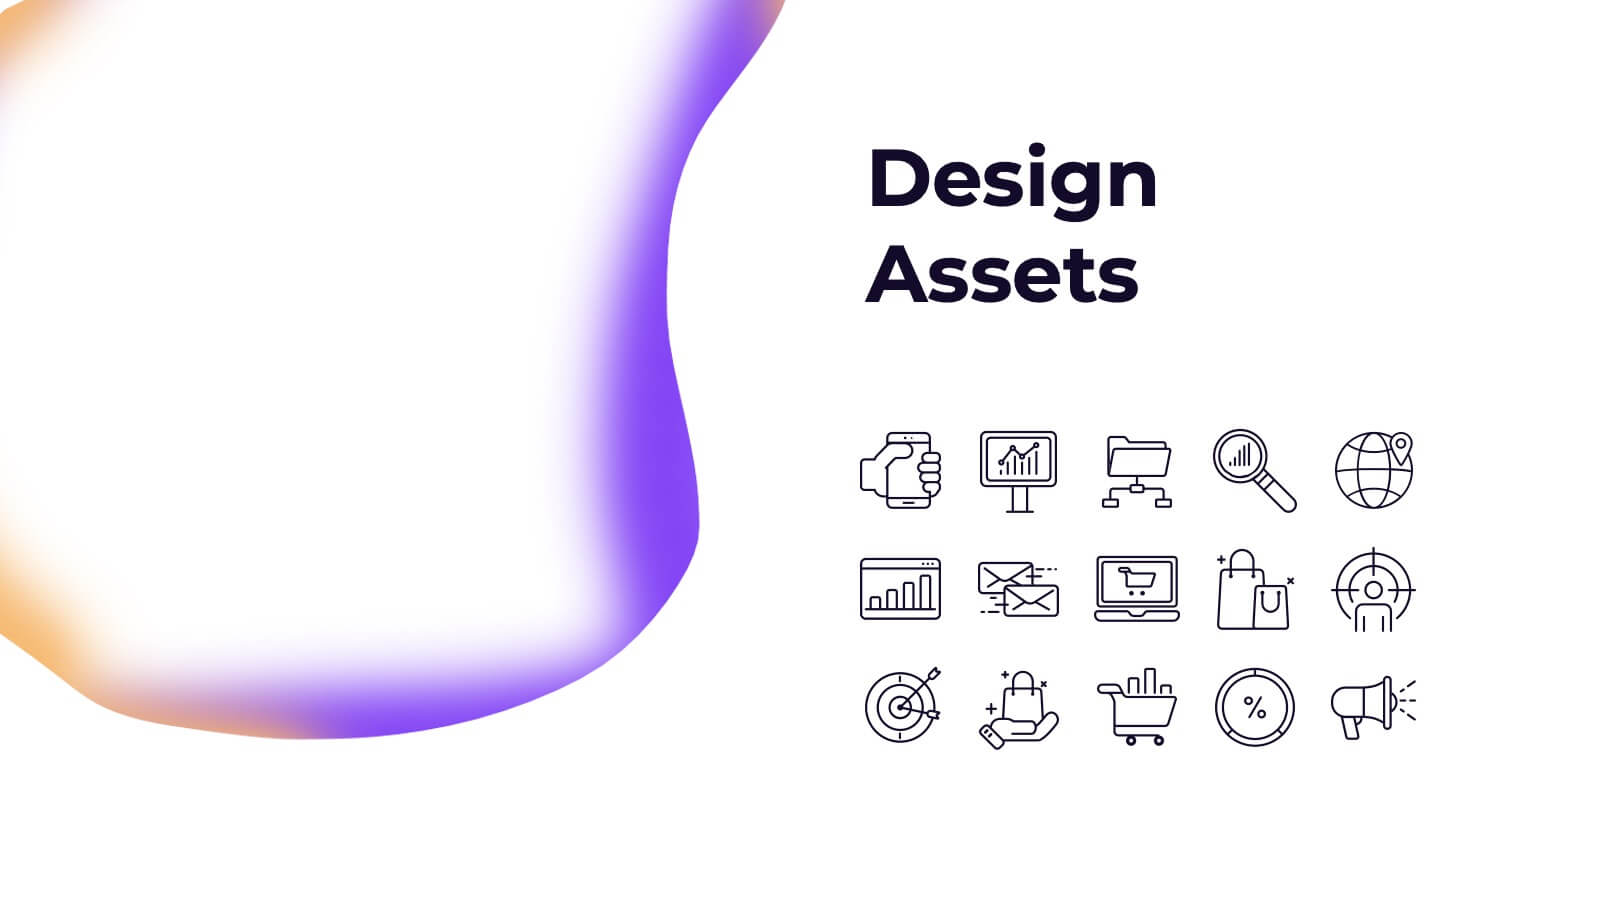
Elevate your design strategy presentations with this visually captivating and modern template! It covers every step of the design process, from concept development and mood boards to prototype iterations and feedback. Ideal for showcasing design elements, textures, and assets, this template is perfect for creative professionals. Compatible with PowerPoint, Keynote, and Google Slides for easy, polished presentations.


7 slides
Business People Management Infographic
Business people refer to individuals involved in the world of commerce and trade, encompassing various roles within the business landscape. This Infographic is an illuminating and dynamic template designed to guide you through the art and science of managing human capital within the business sphere. Explore the key aspects of effective people management and elevate your organizational success by harnessing the power of your workforce. Compatible with Powerpoint, Keynote, and Google Slides. Discover the art of leading and engaging your team, and witness the transformation as your organization excels and grows, driven by the power of effective people management!


7 slides
College Statistics Infographic Presentation
A College Statistics Infographic is a visual representation of key data and statistics related to a college. This template can provide a quick and easy-to-understand overview of various aspects of the institution, such as enrollment figures, graduation rates, student demographics, and academic performance metrics. Featured are icons, illustrations, diagrams, and other design elements to enhance the visual appeal of this infographic and make it more engaging for your viewers. This template can be a useful tool for students, teachers, and others interested in learning more about a college.


21 slides
Aetherial UX Research Report Presentation
A professional and modern template for UX research presentations. Highlight key elements such as user personas, journey mapping, wireframes, and testing processes. Includes slides for accessibility considerations, design systems, and feedback iteration. Fully customizable and compatible with PowerPoint, Keynote, and Google Slides to deliver impactful insights and research findings.


20 slides
Waterfall Project Proposal Presentation
Get ready to impress with the Waterfall Project Proposal template! This visually striking and highly organized template is designed to help you communicate your project plan with clarity and impact. Start with an engaging introduction and company overview, then seamlessly guide your audience through the project summary, problem statement, and your proposed solutions. This template covers all essential aspects, including objectives, goals, scope of work, methodology, and a detailed timeline of milestones. With dedicated sections for pricing structure, team expertise, and client testimonials, you can showcase the strengths and reliability of your proposal. The template also includes slides for risk management, terms and conditions, and a clear next steps action plan. Perfect for any professional setting, this template is fully customizable and compatible with PowerPoint, Keynote, and Google Slides, ensuring that your proposal looks polished and professional every time.


5 slides
5-Step Process Flow
Visualize any workflow or sequential plan with this dynamic 5-step process template. Designed with a flowing arrow layout, it’s ideal for illustrating strategies, timelines, or key project phases in a clear, modern style. Fully editable for PowerPoint, Keynote, and Google Slides users.


4 slides
Preventative Healthcare Strategies Presentation
Present medical insights with clarity using this syringe-themed slide layout designed for preventative healthcare strategies. Ideal for showcasing public health plans, vaccination drives, or early intervention tactics. Fully editable in PowerPoint, Keynote, and Google Slides, this modern visual aids healthcare professionals in delivering data-driven, concise messages with professional impact.


4 slides
Property Listing and Comparison Presentation
A sleek, modern way to spotlight property details comes to life in this clean presentation design, making comparisons feel effortless and engaging. It clearly organizes features, differences, and key selling points so audiences can make informed decisions fast. Fully editable and easy to use, this presentation works seamlessly in PowerPoint, Keynote, and Google Slides.


4 slides
Strategic Gap Planning Template Presentation
Visually map the journey from current state to strategic goals with this puzzle-themed gap analysis template. Ideal for identifying key disconnects, setting priorities, and aligning teams. Fully editable and designed for clarity, this presentation works in PowerPoint, Keynote, and Google Slides—perfect for planning sessions, roadmaps, and executive briefings.


8 slides
Digital Payment and Credit Solutions Deck Presentation
Present your financial strategies with clarity using this Digital Payment and Credit Solutions Deck Presentation. Designed to highlight key service features and fintech insights, this layout visually compares digital cards, credit options, or payment tiers. Perfect for banks, startups, and financial analysts. Fully editable in PowerPoint, Keynote, and Google Slides.


6 slides
Objective Research Infographics
Enhance your presentation on "Objective Research" with our professionally designed infographic template. This template, compatible with PowerPoint, Keynote, and Google Slides, is the perfect tool for presenting complex research data in a clear and engaging manner. Our template boasts a clean, modern design with a neutral color scheme, making it ideal for both corporate and academic settings. The layout is expertly crafted to showcase your research objectives, methodologies, and findings in a visually appealing way. It includes elements like graphs, charts, and bullet points, ensuring your data is not only accessible but also impactful. Easy to customize and user-friendly, this template empowers you to convey your research objectives with clarity and professionalism. Whether you're presenting to colleagues, students, or stakeholders, this infographic template will elevate your presentation and make your data stand out.


6 slides
Concept Web with Spider Diagram Layout Presentation
Map out complex ideas with clarity using the Concept Web with Spider Diagram Layout Presentation. This dynamic radial format is perfect for showing interrelated components, skills analysis, or performance metrics at a glance. Ideal for brainstorming, strategy, or education—fully editable in Canva, PowerPoint, Keynote, and Google Slides.


4 slides
Professional Business Meeting Agenda Presentation
Efficiently structure your next corporate gathering with the "Professional Business Meeting Agenda" presentation template. Its geometrically appealing layout organizes discussion points in a visually captivating manner, encouraging effective communication and engagement. Perfect for strategizing sessions, this template ensures that every item on your agenda is highlighted with clarity. Compatible across PowerPoint, Keynote, and Google Slides, it’s designed to make every meeting more productive.


5 slides
Data Density Visualization via Heat Mapping Presentation
Turn complex datasets into clear insights with the Data Density Visualization via Heat Mapping Presentation. This layered area chart template is perfect for showcasing data intensity over time—ideal for monthly trends, usage spikes, or multi-variable performance analysis. Fully customizable in Canva, PowerPoint, Keynote, and Google Slides.


5 slides
Team Roles and Responsibilities Matrix Presentation
Define accountability with this Team Roles and Responsibilities Matrix. Clearly map tasks to team members using RACI codes (Responsible, Accountable, Consulted, Informed). Ideal for project planning, cross-functional alignment, and team coordination. Fully editable and compatible with PowerPoint, Keynote, and Google Slides to suit any workflow or team structure.


6 slides
Business Decision Venn Diagram Presentation
Make complex decision-making simple and visually impactful with this Business Decision Venn Diagram Presentation. Featuring a bold triangular layout with six segmented areas, this slide is ideal for presenting overlapping factors, interconnected strategies, or priority zones. Perfect for business planning, competitive analysis, or project evaluation. Fully editable in PowerPoint, Keynote, and Google Slides for seamless integration into your presentations.


5 slides
Mission and Values Alignment
Align your purpose with progress using this clean, directional layout that maps your mission, core values, and strategic focus in a unified flow. Perfect for internal briefings or culture decks, this slide visually connects each value to your organizational journey. Fully compatible with PowerPoint, Keynote, and Google Slides.