


Features
- 22 Unique Slides
- Fully editable and easy to edit in Microsoft Powerpoint, Keynote and Google Slides
- 16:9 widescreen layout
- Clean and professional designs
- Export to JPG, PDF or send by email


Do you have any questions?
Recommend


26 slides
Maki Presentation Template
Japanese cuisine is known all around the world, there is so much to try including all the different types of sushi. Maki is a 26 slide template made to help you market your services and products. The clean, simplistic design makes it easy for you to display your content in any modernized way. Maki is designed to showcase your packages, pricing and more. Help your customers feel comfortable purchasing your service or product using this template. Present your message clearly and effectively with this presentation. You can customize the design, photos, background and fonts to make it your own.


6 slides
PESTEL Analysis Business Presentation
The "PESTEL Analysis Business Presentation" template effectively facilitates a comprehensive review of the political, economic, social, technological, environmental, and legal factors that impact strategic business decisions. This template is designed to help strategists, analysts, and managers evaluate and present external factors that could affect their business operations and market environment. Each segment of the analysis is visually represented through connected circles, making complex data easily understandable. This layout encourages a structured discussion on each PESTEL aspect, ensuring that all critical elements are covered, making it an essential tool for businesses looking to align their strategies with external conditions.


6 slides
Hierarchical Thought Flow Mind Map Presentation
Present your ideas with clarity using this Hierarchical Thought Flow Mind Map presentation. Designed for structured thinking, this layout displays six key concepts radiating from a central theme, making it ideal for workflows, strategies, or team roles. Fully editable in Canva, PowerPoint, and Google Slides for total customization.


4 slides
Business Communication Strategy
Visualize communication channels with this walkie-talkie themed strategy layout. Each section represents a key step in your communication plan—ideal for internal operations, team workflows, or stakeholder messaging. Easily editable in PowerPoint, Keynote, and Google Slides.


23 slides
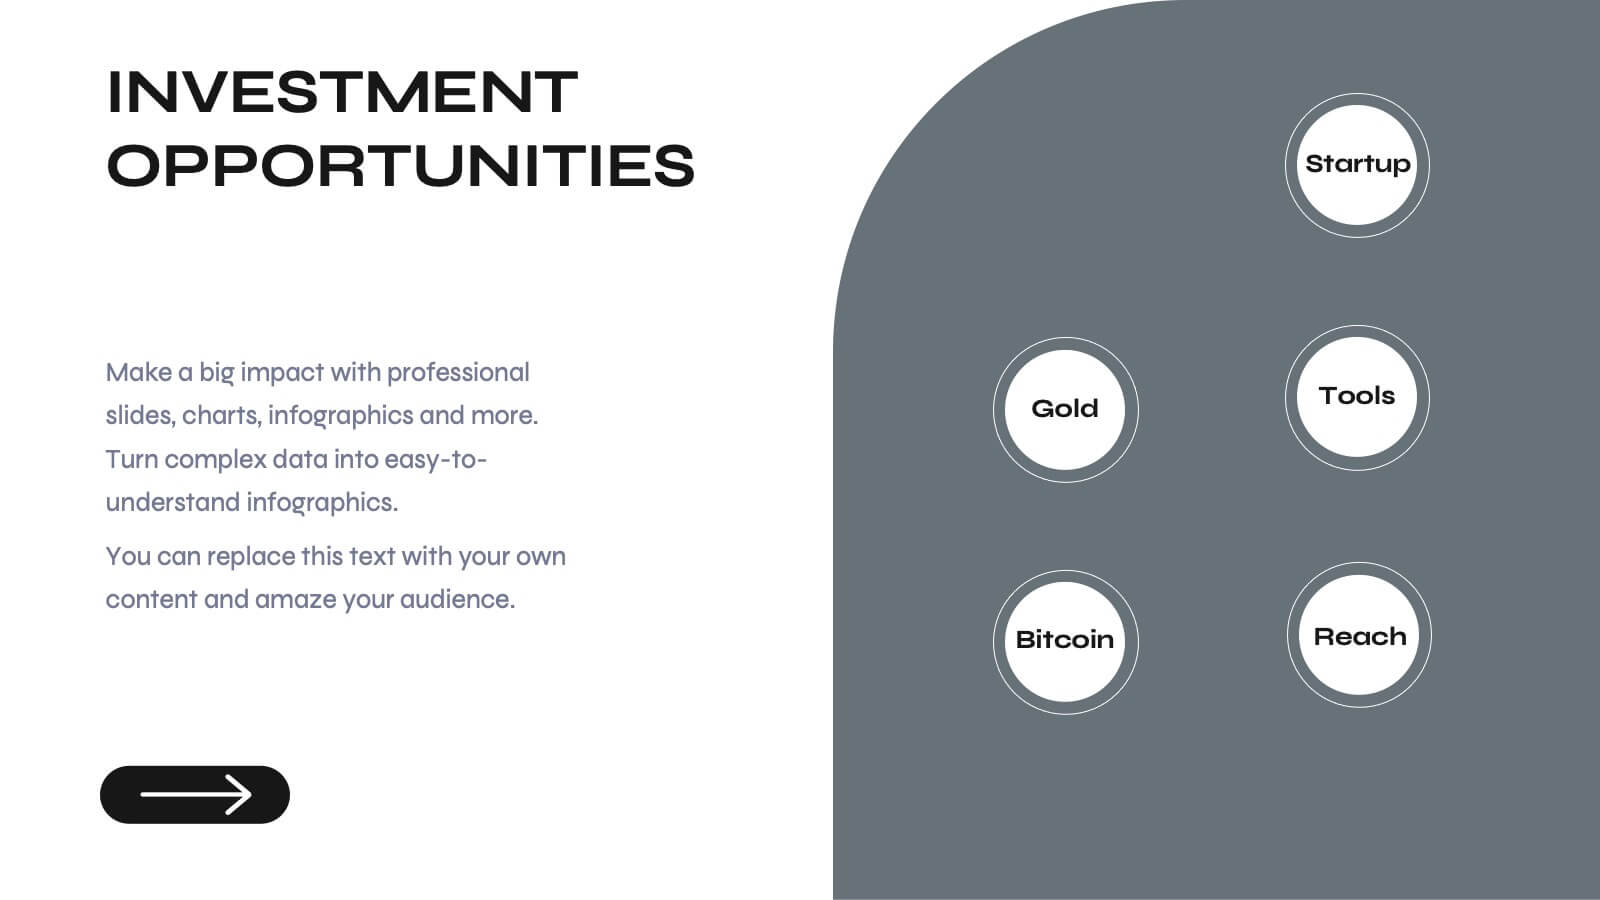
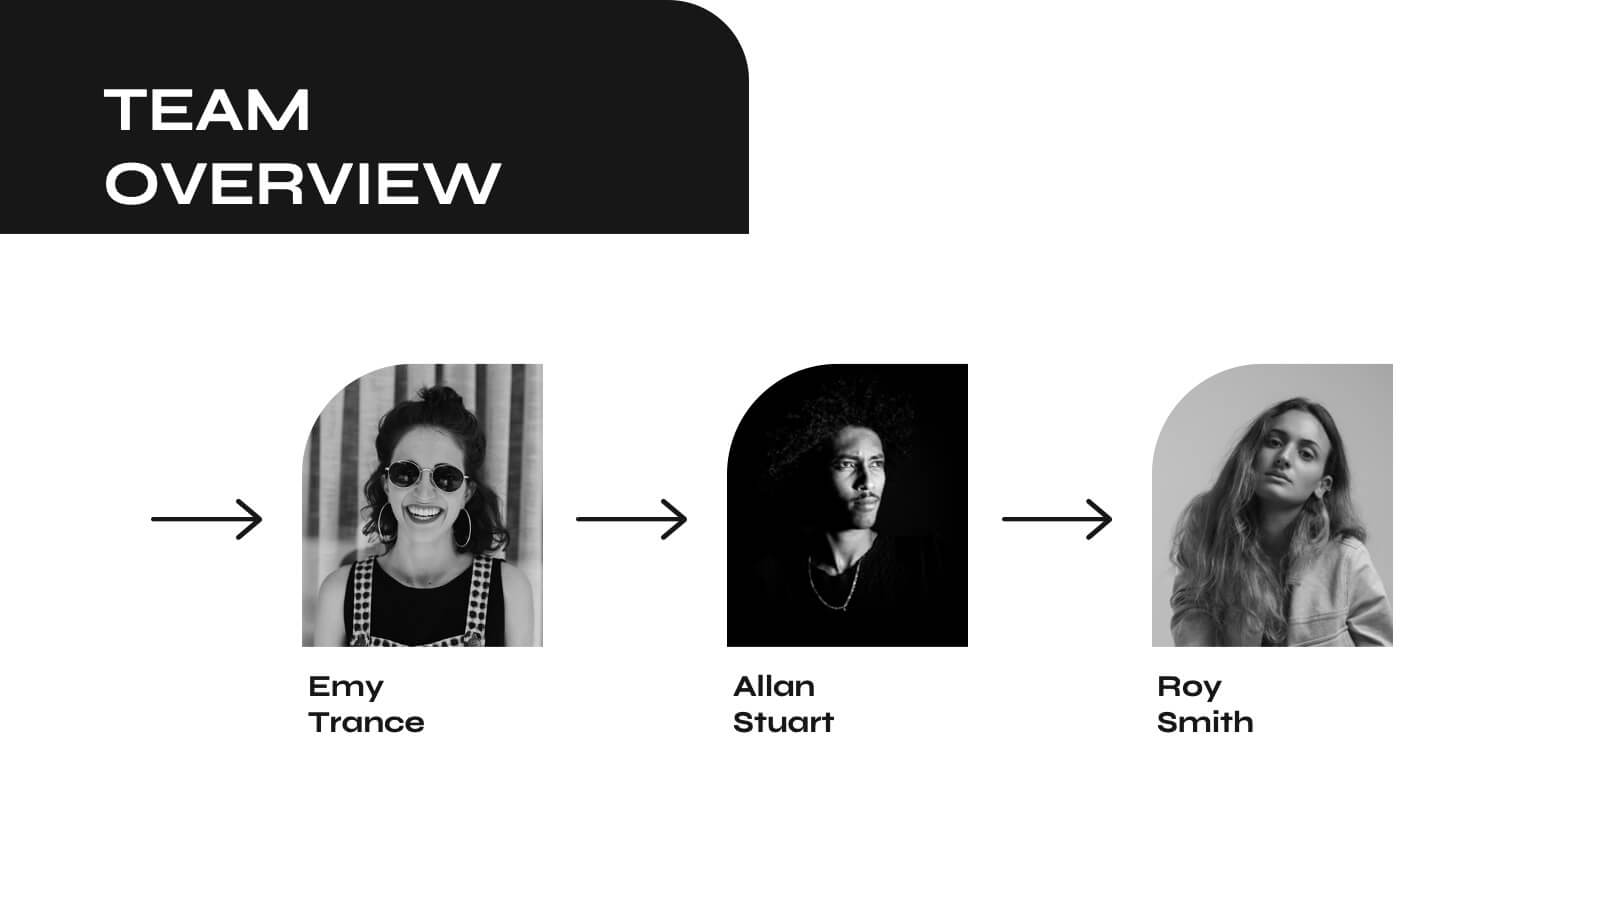
Odyssey Small Business Pitch Deck Presentation
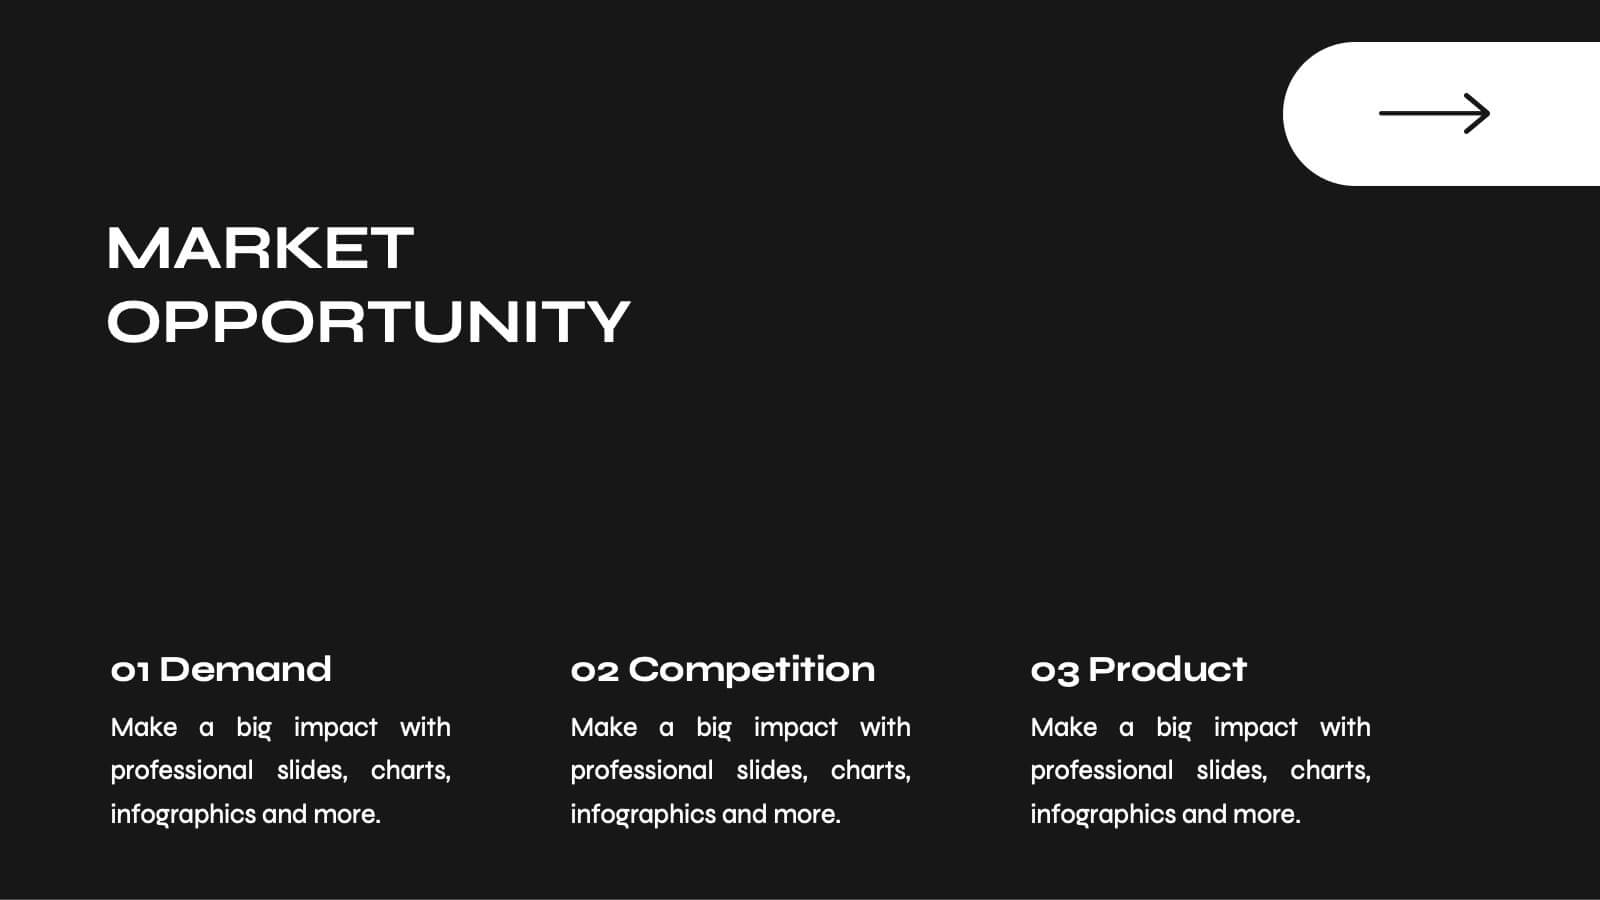
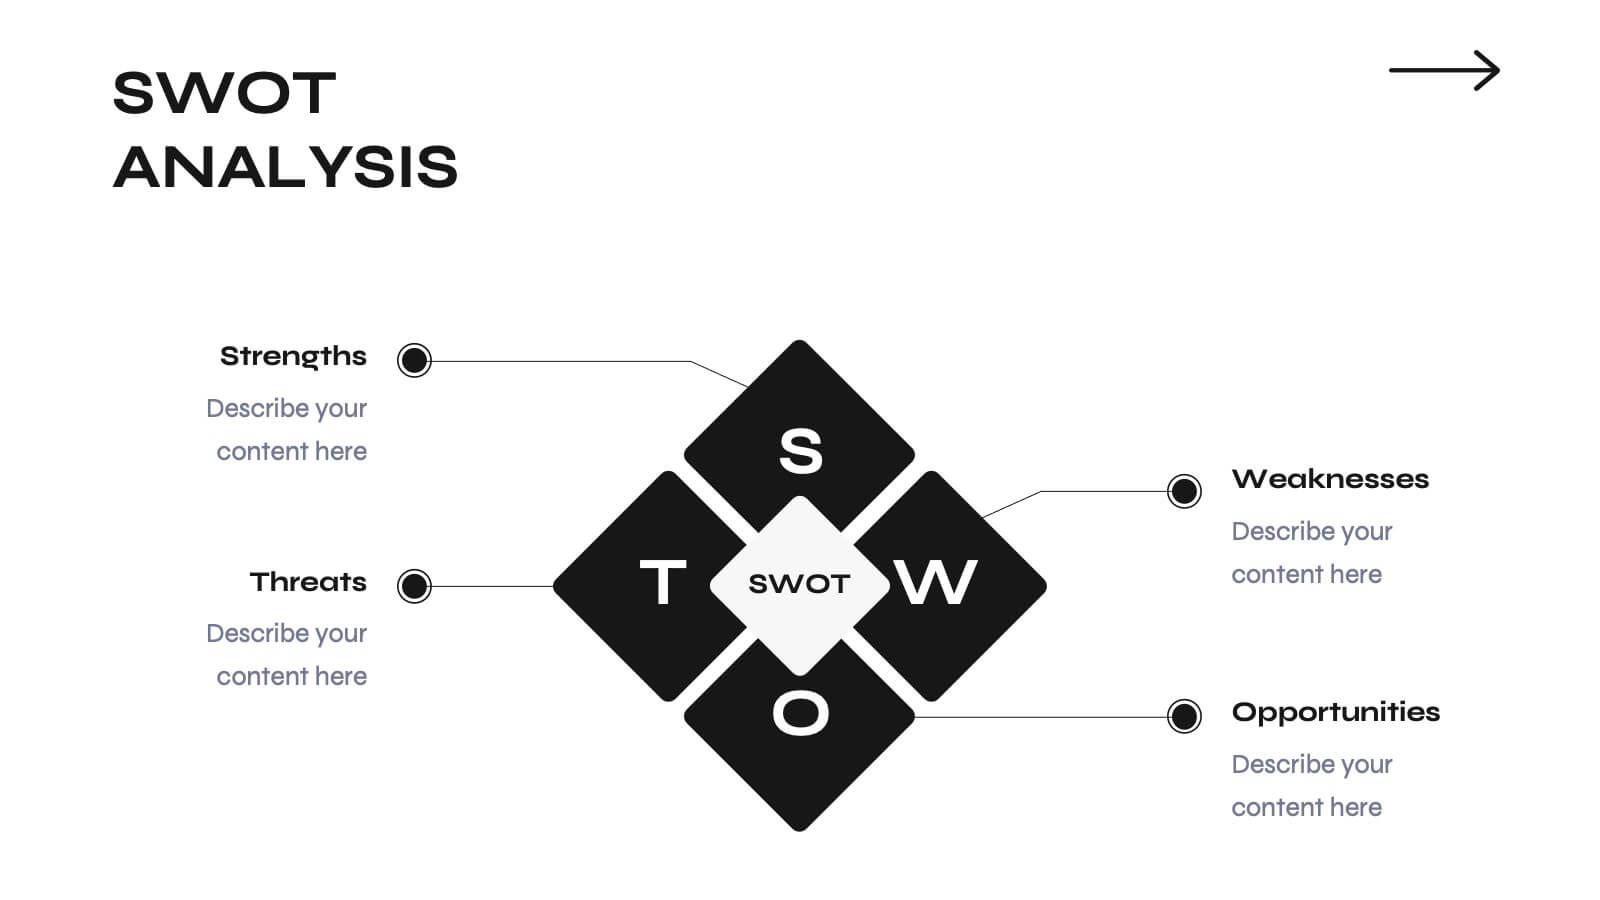
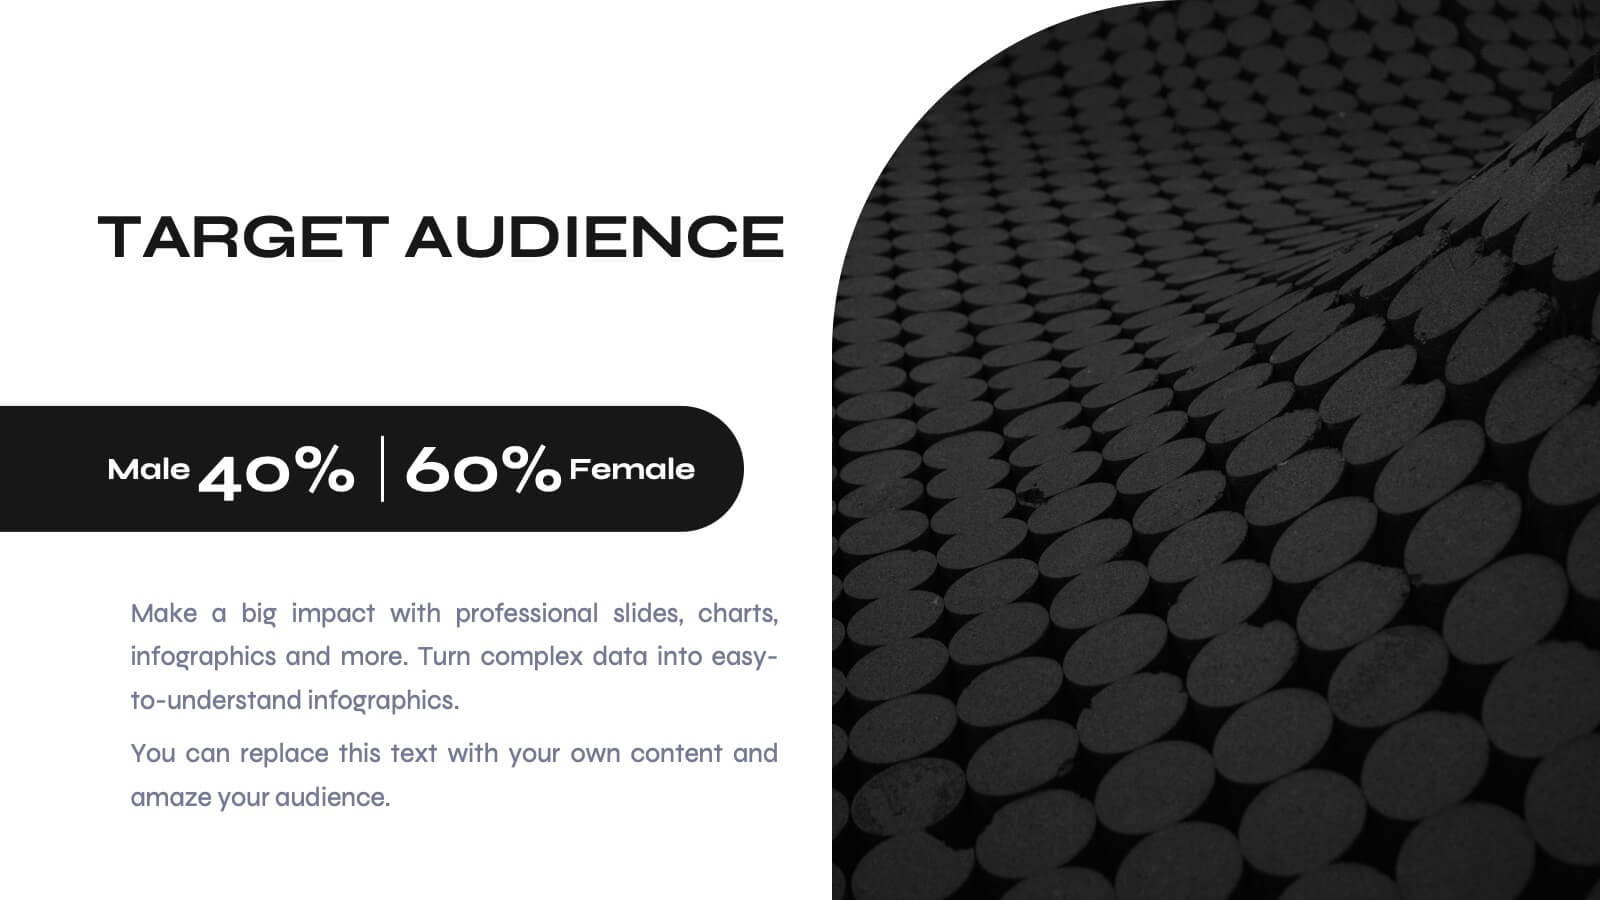
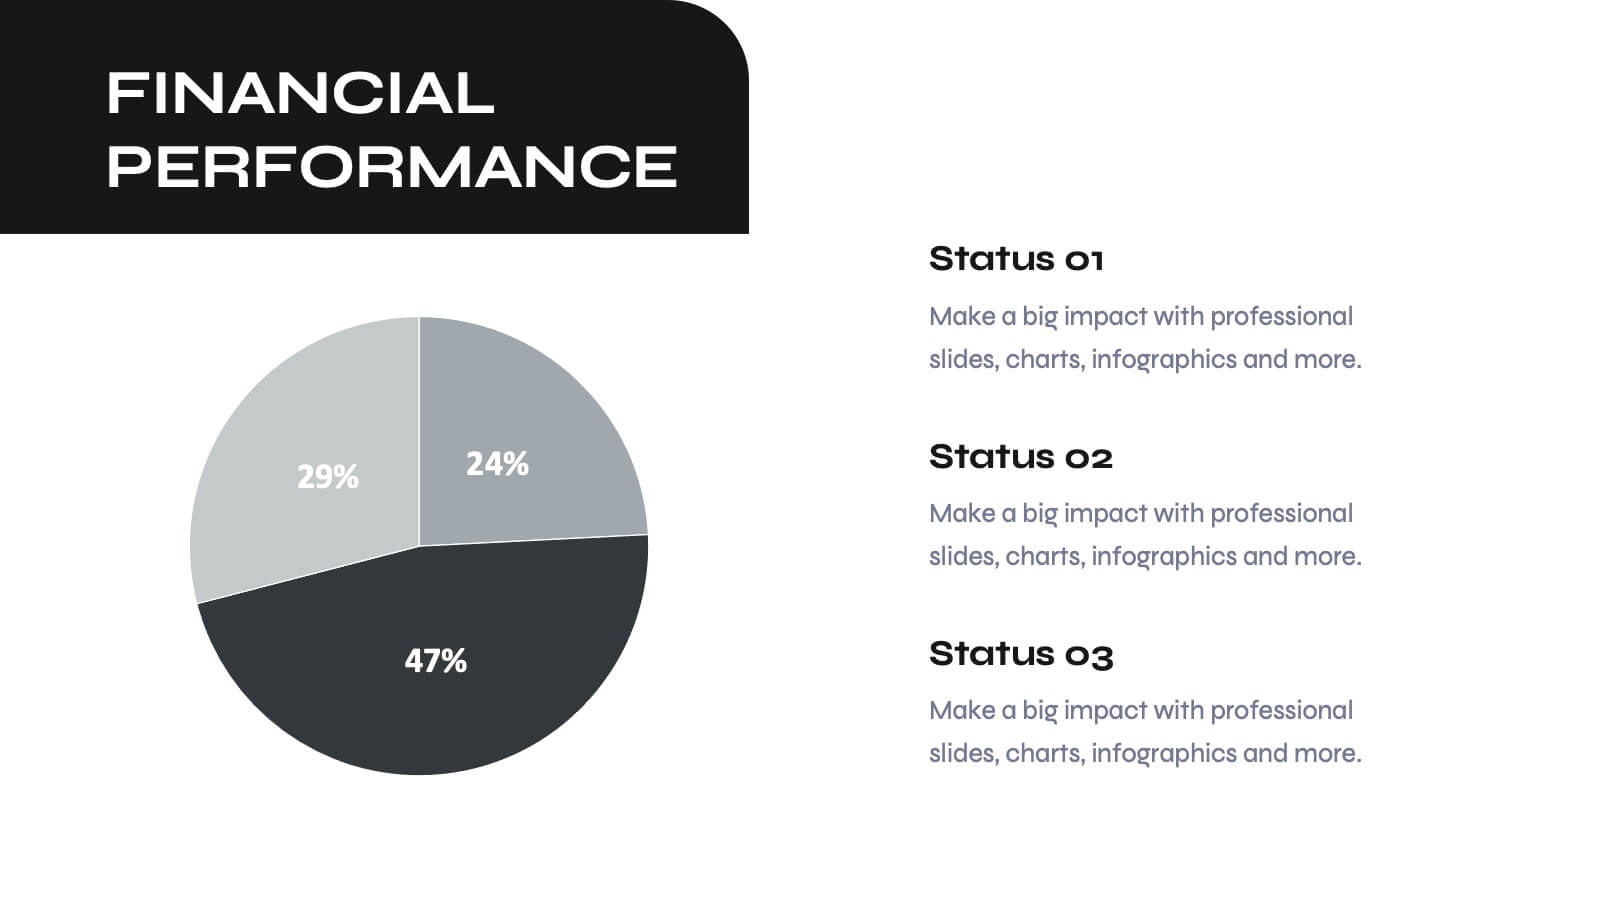
Elevate your business pitch with this sleek, monochrome presentation template. Perfect for presenting company backgrounds, market opportunities, and financial performance, it features a minimalist design that enhances clarity and impact. Highlight your value proposition and strategic plans to captivate investors. Compatible with PowerPoint, Keynote, and Google Slides, it ensures seamless presentations on any platform.


20 slides
Trend Report Presentation
Navigate the latest market developments with this Trend Report presentation template. Perfect for displaying current marketing trends, consumer behavior, and future predictions, this vibrant template includes slides for social media strategies, influencer marketing, and more. Fully compatible with PowerPoint, Keynote, and Google Slides, it’s ideal for professionals looking to stay ahead in dynamic industries.


5 slides
Business Annual Report Summary Presentation
Clear, Concise, and Impactful! The Business Annual Report Summary Presentation template helps you present key performance indicators, financial metrics, and company growth in a professional and visually engaging way. Fully customizable and compatible with PowerPoint, Keynote, and Google Slides, it’s ideal for executives and analysts aiming for a compelling data-driven presentation.


12 slides
Customer Satisfaction Smile Rating Presentation
Measure customer happiness with this engaging customer satisfaction smile rating template! Featuring a visual scale from dissatisfaction to delight, this design helps businesses track feedback and identify improvement areas. Ideal for reports, surveys, and performance reviews. Fully customizable and compatible with PowerPoint, Keynote, and Google Slides.

1 slide
Success Roadmap and Personal Achievement Presentation
Visualize your path to success with the Success Roadmap and Personal Achievement Presentation. This stepwise layout guides your audience through key milestones, making it perfect for showcasing personal growth, career progression, or business achievements. Each step features a distinct icon and space for focused insights. Fully editable in Canva, PowerPoint, Keynote, and Google Slides.


8 slides
30-60-90 Day Business Plan Presentation
Set clear goals and track progress effortlessly with this 30-60-90 day business plan template! Designed for professionals, managers, and entrepreneurs, this structured layout helps outline priorities, set milestones, and ensure a smooth transition from planning to execution. Fully customizable and compatible with PowerPoint, Keynote, and Google Slides for seamless presentations.


4 slides
Team Relationship Structure Presentation
Show your organization’s hierarchy with clarity and style using this modern visual layout. Ideal for illustrating team dynamics, reporting lines, or company roles, it helps simplify complex structures into easy-to-follow visuals. Fully customizable and compatible with PowerPoint, Keynote, and Google Slides for seamless editing and professional presentation design.


4 slides
Organic Farming Overview Presentation
Present your sustainable agriculture strategies with this organic farming overview template, featuring vibrant icons and clean layouts. Perfect for eco-friendly initiatives, farm project plans, and environmental reports. Fully editable in Canva, PowerPoint, and Google Slides, allowing you to adjust colors, icons, and text to align with your branding and goals.


21 slides
Sable Design Portfolio Presentation
Elevate your creative portfolio with the Sable Design Portfolio Presentation template! This stylish and professional template is perfect for showcasing your design projects, whether you’re a graphic designer, UI/UX expert, or creative professional. Start with a captivating introduction, and lead your audience through a journey of your design process, from concept development to final execution. Highlight your unique approach with dedicated slides for your color palette, typography choices, and moodboards. The template also includes sections for prototyping, feedback, and iterations, ensuring your design evolution is clearly communicated. The clean and modern layout not only keeps your presentation visually appealing but also makes your work the star of the show. Customizable and easy to use, this template is compatible with PowerPoint, Keynote, and Google Slides, allowing you to impress your clients, employers, or peers with a polished and cohesive presentation of your best work.


6 slides
Successful Loyalty Program Ideas Presentation
Turn creative reward concepts into visually engaging stories that inspire customer retention and brand loyalty. This modern layout is ideal for presenting program ideas, reward systems, and engagement strategies with clarity and style. Fully customizable and compatible with PowerPoint, Keynote, and Google Slides for seamless presentation design.


5 slides
Core to Outer Ring Concentric Planning Presentation
Present your strategy from the inside out with the Core to Outer Ring Concentric Planning Presentation. This layered, radial design guides viewers through a central concept outward into supporting elements—ideal for planning, process modeling, or decision frameworks. Fully customizable in PowerPoint, Keynote, and Google Slides.


4 slides
Introductory Message with Mission and Vision Presentation
Present your company’s mission and vision with clarity and impact. This professional slide layout includes space for a personalized message and two key highlights. Ideal for strategy decks, company overviews, or leadership presentations—fully editable in Canva, PowerPoint, or Google Slides to match your branding and communication goals.


5 slides
Educational Planning & Class Activities Presentation
Organize your lessons with this creative education-themed layout. Featuring a playful stack of books and apple illustration, this slide is ideal for outlining academic plans, class objectives, or weekly activities. Fully editable in PowerPoint, Keynote, and Google Slides—perfect for teachers, homeschoolers, and education professionals seeking clarity and visual appeal.