


Features
- 6 Unique Slides
- Fully editable and easy to edit in Microsoft Powerpoint, Keynote and Google Slides
- 16:9 widescreen layout
- Clean and professional designs
- Export to JPG, PDF or send by email


Do you have any questions?
Recommend


6 slides
Vision Statement Infographic
Define and share your organization's aspirations with our Vision Statement Infographic Template. Designed for impact and clarity, this template offers a modern, sleek way to communicate your company's vision to team members, stakeholders, and the public. With its clean lines and focused layout, it provides the perfect backdrop to highlight your strategic intentions. This template features a series of customizable slides, each structured to help you articulate different elements of your vision statement. Utilize engaging icons, bold color blocks, and concise text to make your message resonate. It’s ideal for integrating into annual reports, company presentations, or onboarding materials, ensuring that your vision is not only shared but also inspires. Tailor each slide to suit your corporate identity, adjusting colors and fonts for consistency with your brand aesthetics. This tool is essential for leaders looking to instill a sense of purpose and direction throughout their organization.


4 slides
Business Partnership Development Presentation
Showcase key elements of collaboration with the Business Partnership Development Presentation. This quadrant-style layout is perfect for outlining strategies, stakeholders, or phases of a partnership. Ideal for business proposals, joint ventures, and strategic planning decks. Fully editable in PowerPoint, Keynote, and Google Slides.


5 slides
Project Scope Management Structure Presentation
Zoom in on every critical stage with the Project Scope Management Structure Presentation. This visual template uses magnifying glass graphics to represent five key project phases, helping you highlight detailed scope elements clearly. Fully editable in PowerPoint, Keynote, and Google Slides, it's perfect for structured planning and reporting presentations.


7 slides
Big Data Management Infographic
Step into the dynamic realm of big data with our big data management infographic. Set against a palette of green, blue, and white, this template illuminates the intricacies of managing vast amounts of information in today's digital age. Tailored for data scientists, IT professionals, business analysts, and educators, this infographic offers a clear visual breakdown of complex data processes. Its informative style ensures comprehension and engagement, making it a must-have for those aiming to demystify big data. Compatible with PowerPoint, Keynote, or Google Slides, it promises versatility in presentations.


4 slides
Customer Buyer Persona Profile Presentation
Bring your audience into the mind of your ideal customer with a clean, story-driven layout that highlights demographics, motivations, and everyday habits. This presentation helps you communicate who you’re targeting and why it matters, creating clarity for marketing and product teams. Fully compatible with PowerPoint, Keynote, and Google Slides.


6 slides
Training Center Infographic
A training center is a facility or institution dedicated to providing education, skills development, and training to individuals or groups in various fields. This infographic provides a visual overview of the training programs, courses, and facilities offered by a training center. This template highlights the key information that potential learners or clients need to know. This infographic is fully customizable and compatible with Powerpoint, Keynote, and Google Slides. Allowing you to ensure that the colors, fonts, and graphics used align with your training center's branding.
7 slides
Arrow Process Flow Presentation
Illustrate step-by-step processes with the Arrow Process Flow Presentation. This dynamic template visually maps out sequential steps, making it ideal for workflow diagrams, business strategies, and project planning. Customize colors, text, and icons to align with your brand. Compatible with PowerPoint, Keynote, and Google Slides for effortless editing.


7 slides
Annual Credit Report Infographic Presentation
An Annual Report Infographic is a visual representation of the key information contained in a company's annual report. This template can be used to provide detailed financial information, performance metrics, and other important data that shareholders and stakeholders need to assess a company's health and growth prospects. This infographic is a popular way to present your information in a more easily digestible and visually appealing format. Included in this template are graphs, charts, tables, icons, and other visual elements that help convey complex data in a clear and concise manner.


21 slides
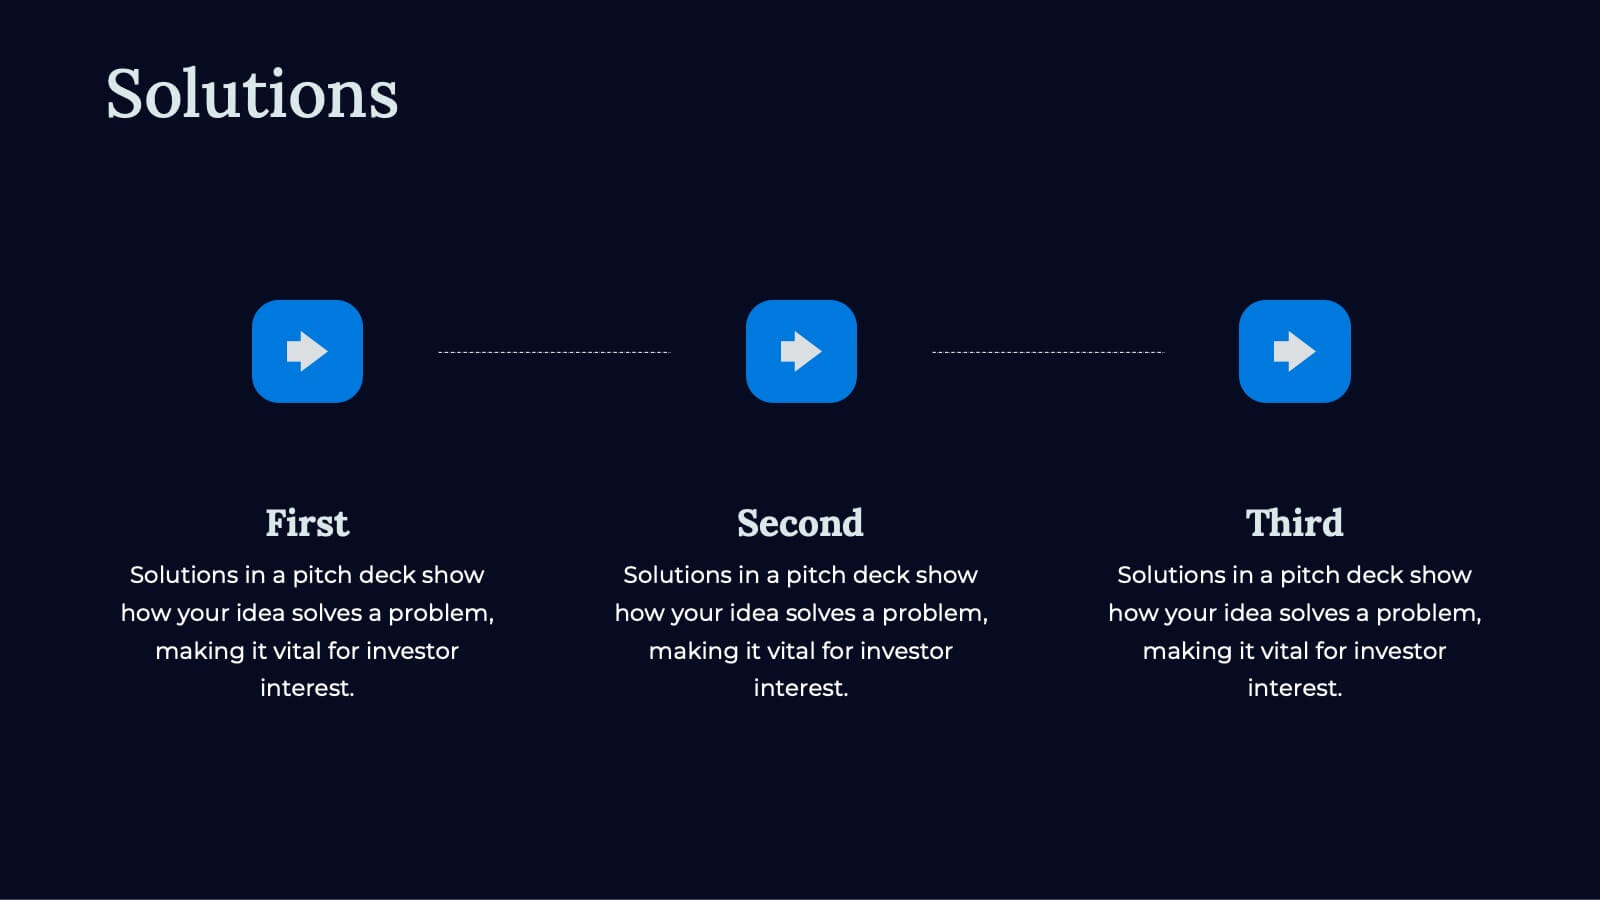
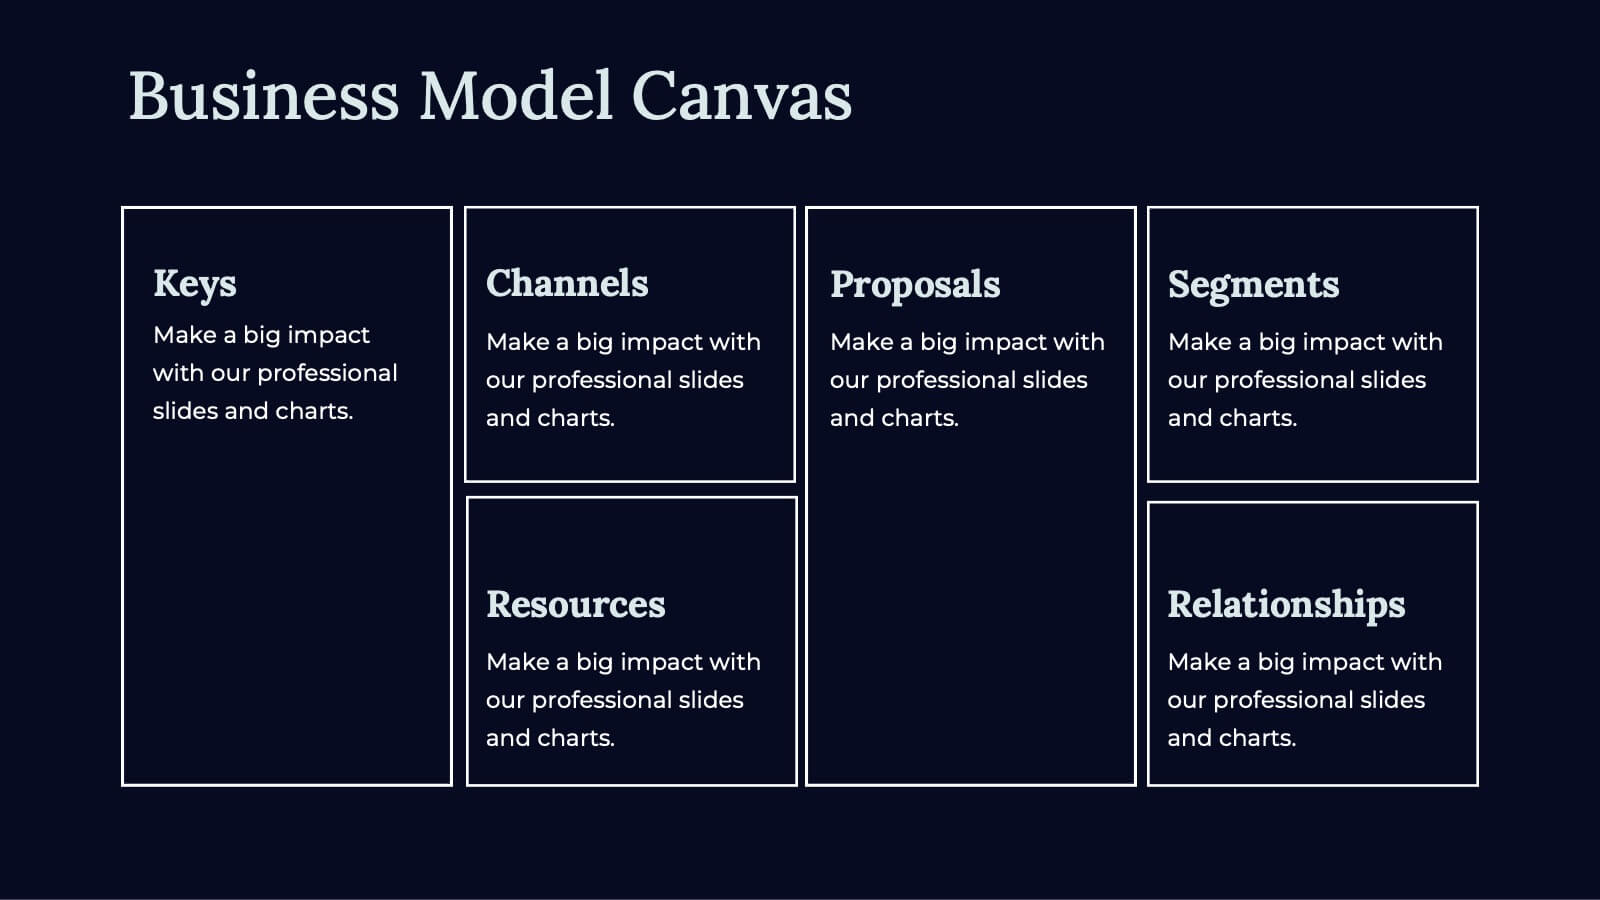
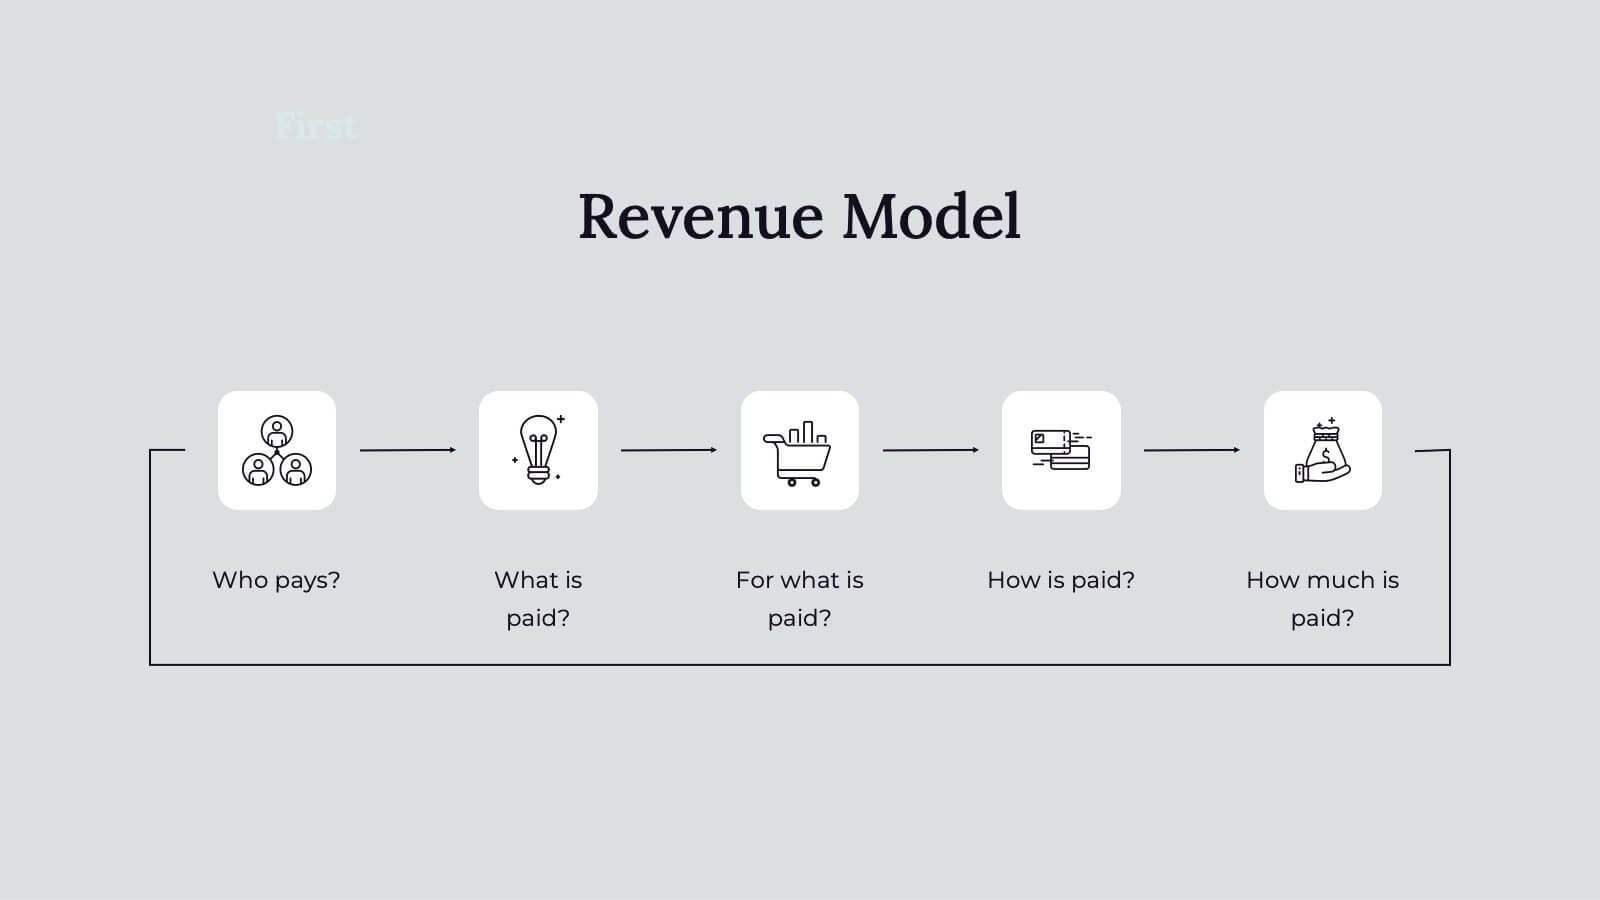
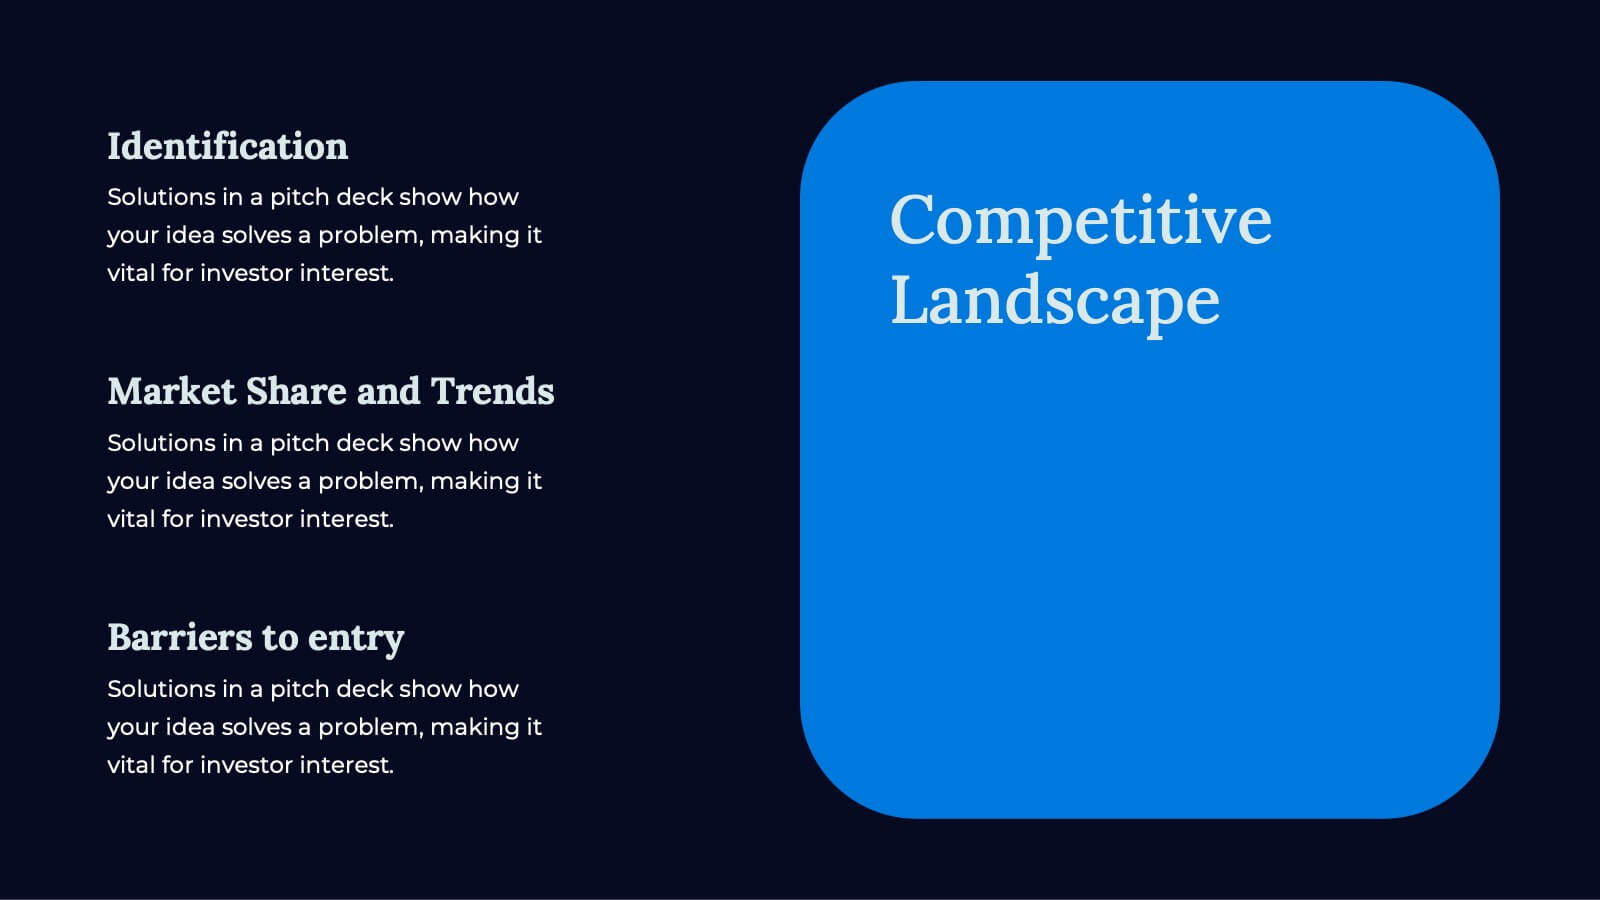
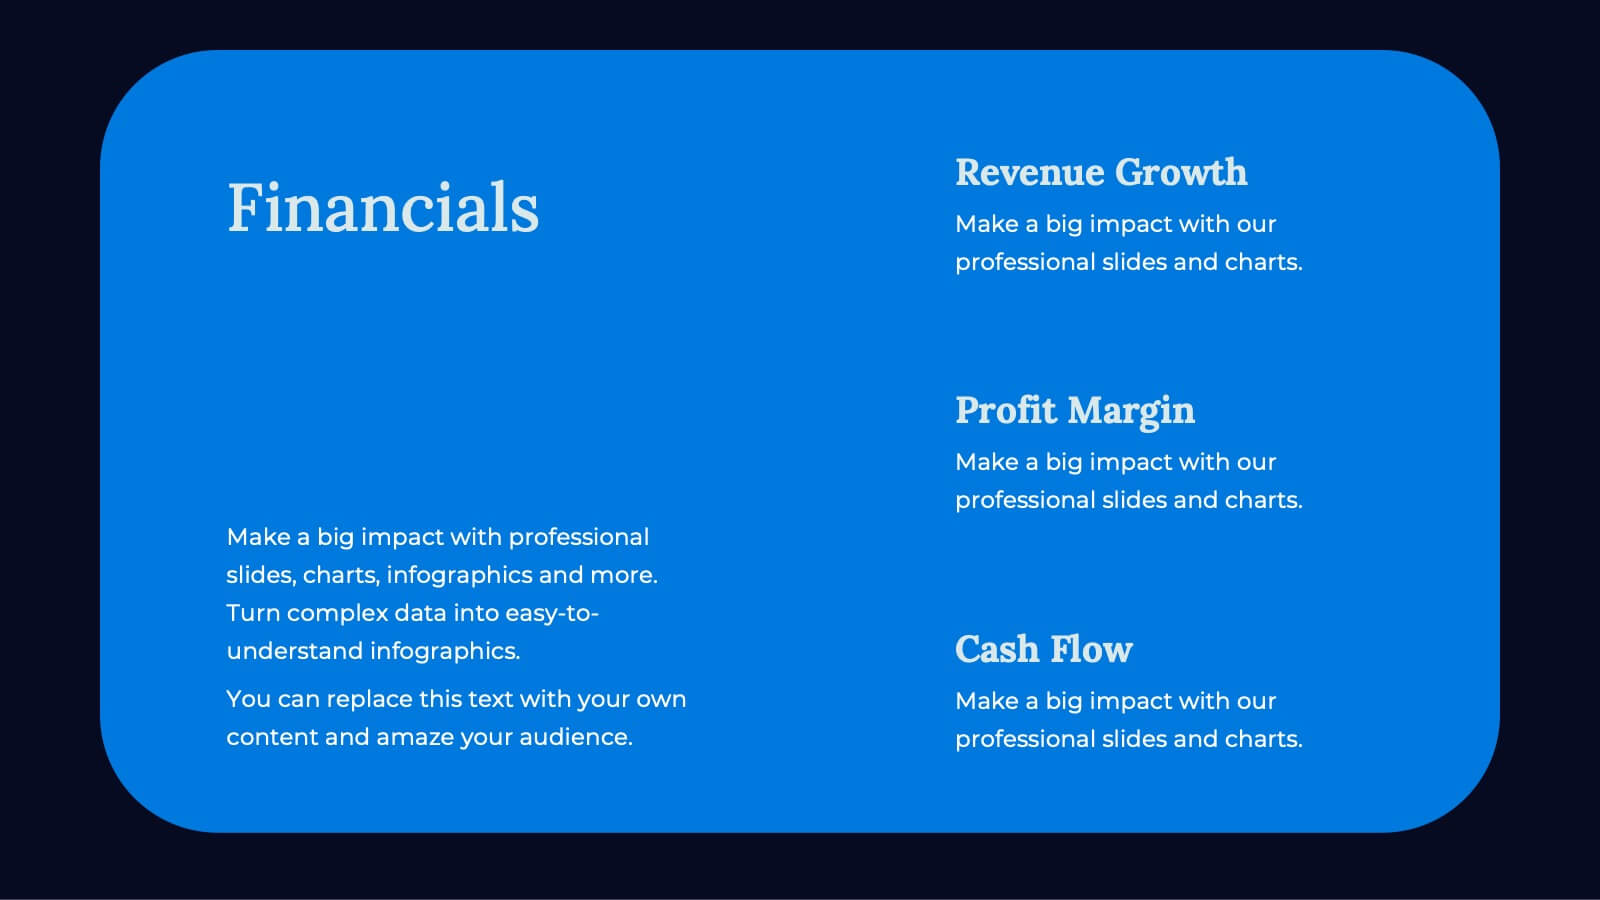
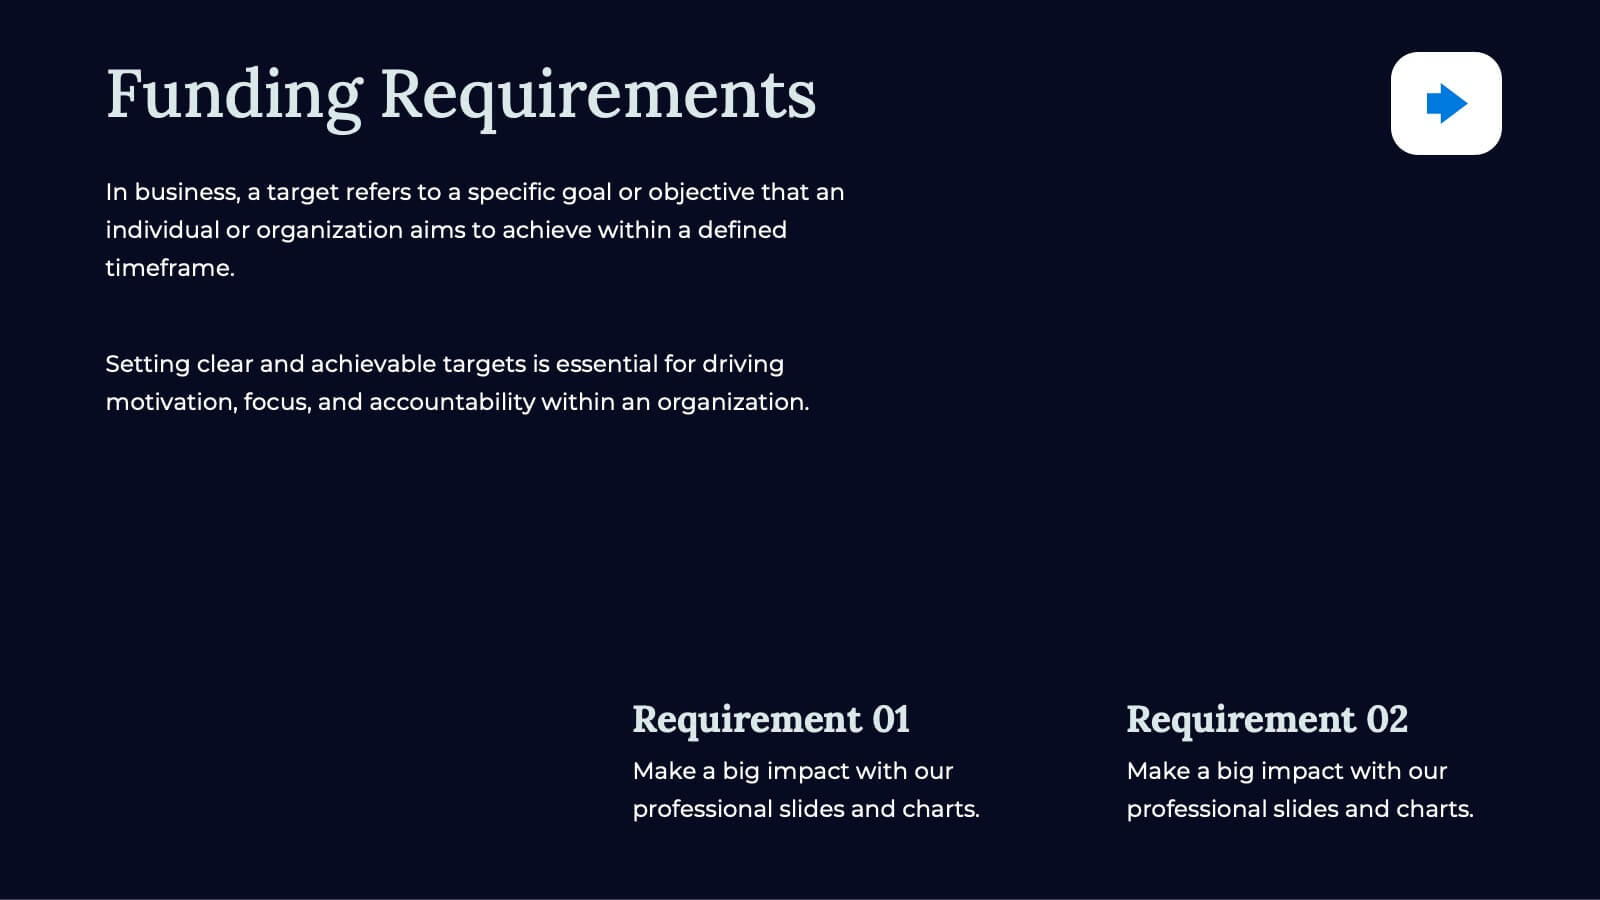
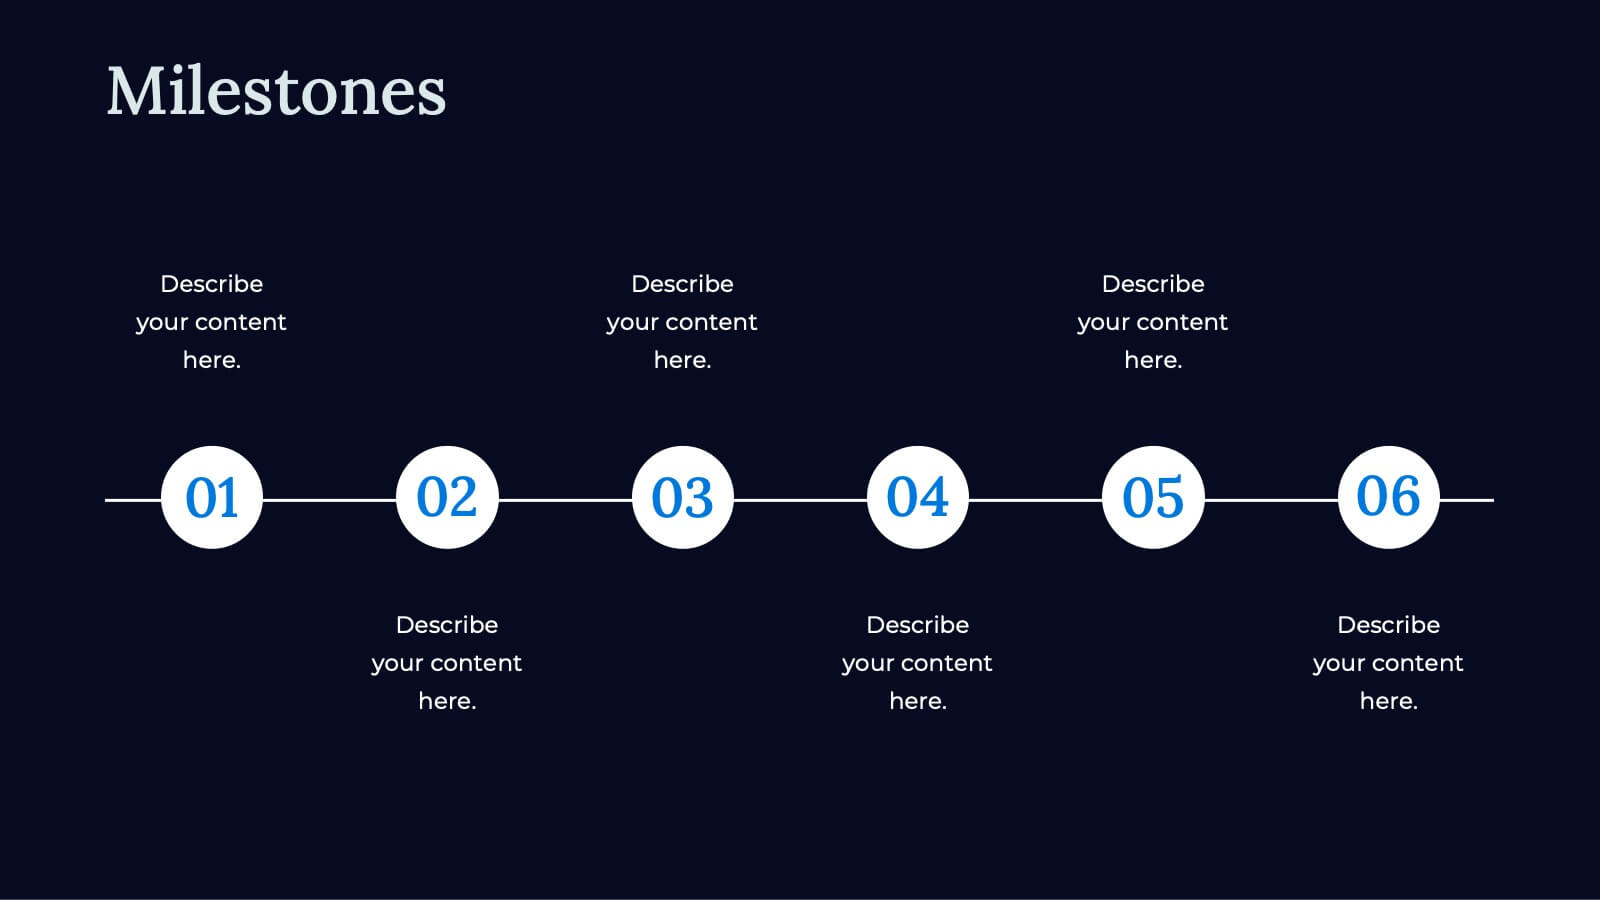
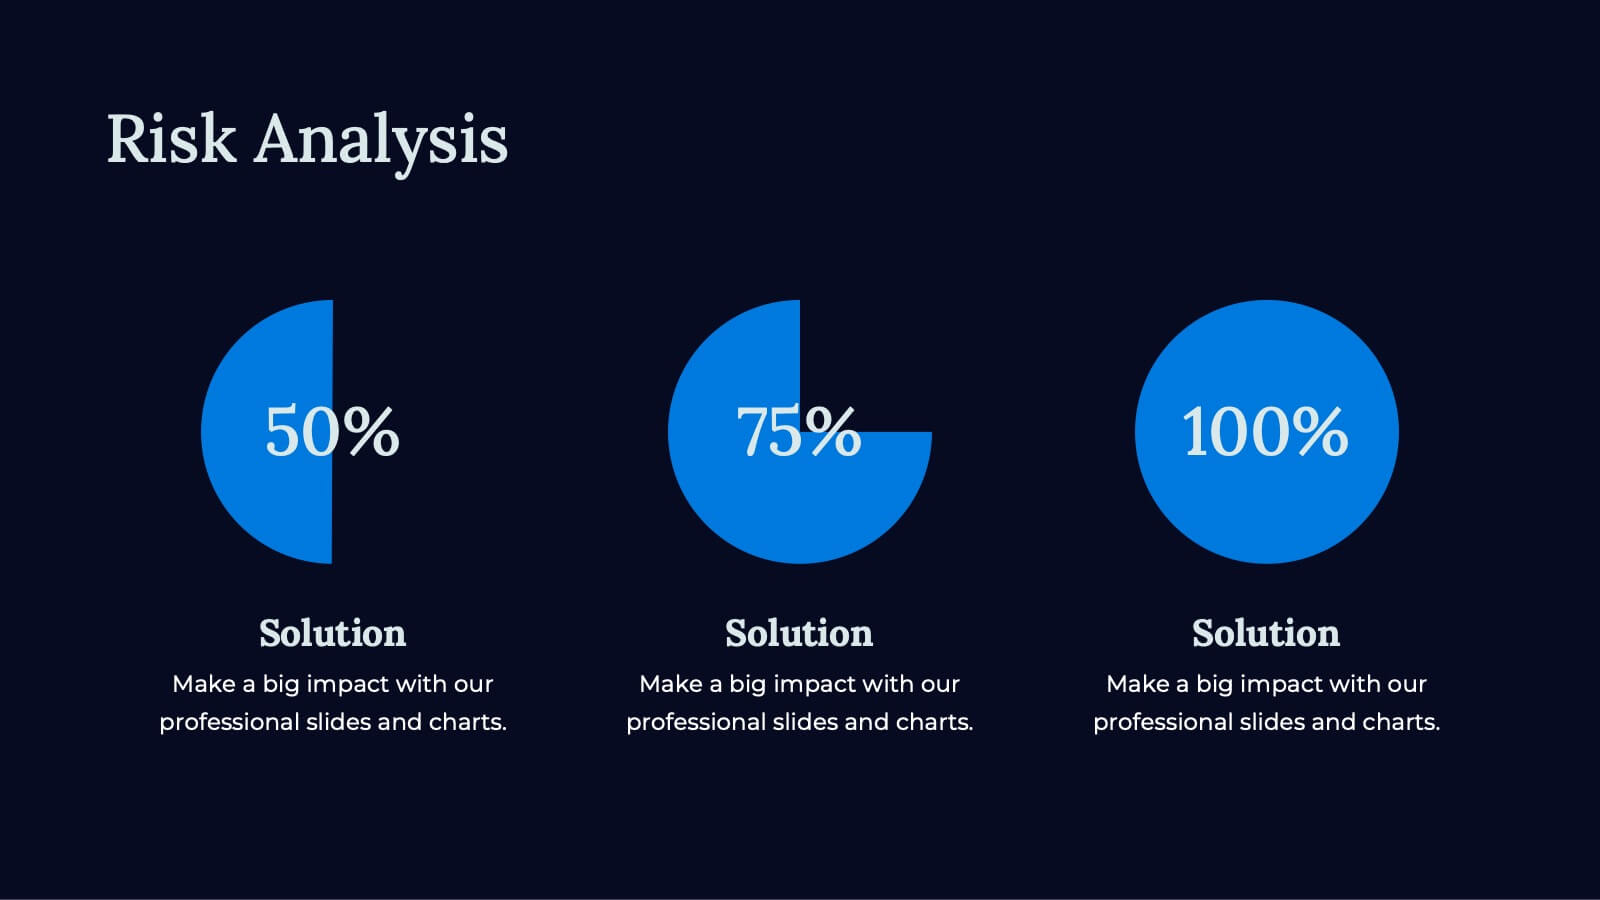
Apex Business Idea Pitch Deck Presentation
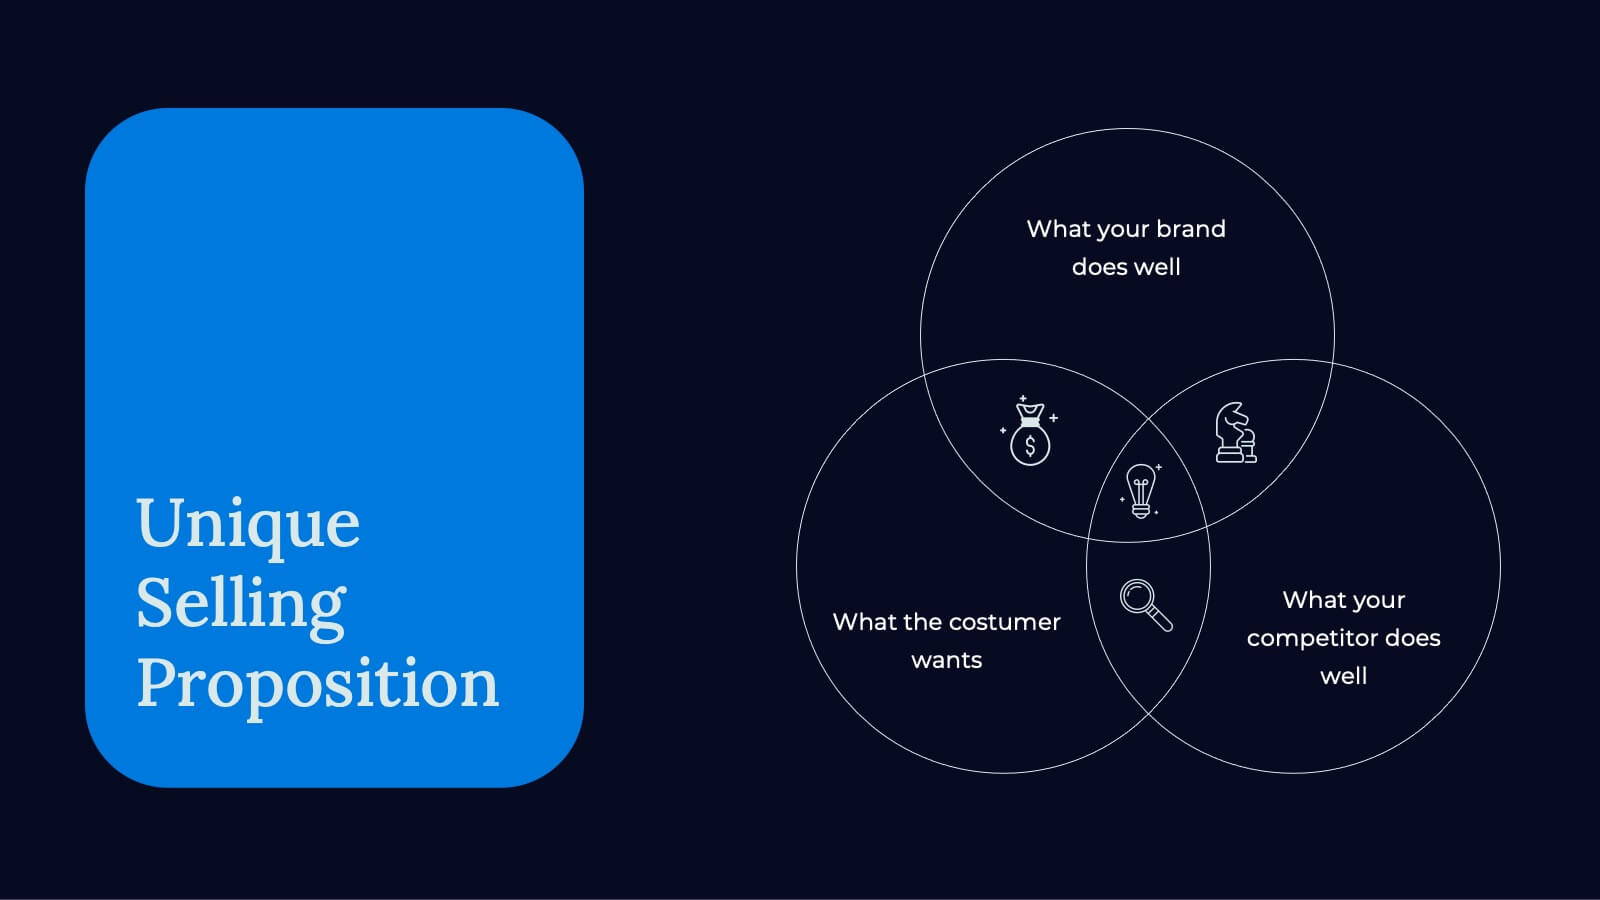
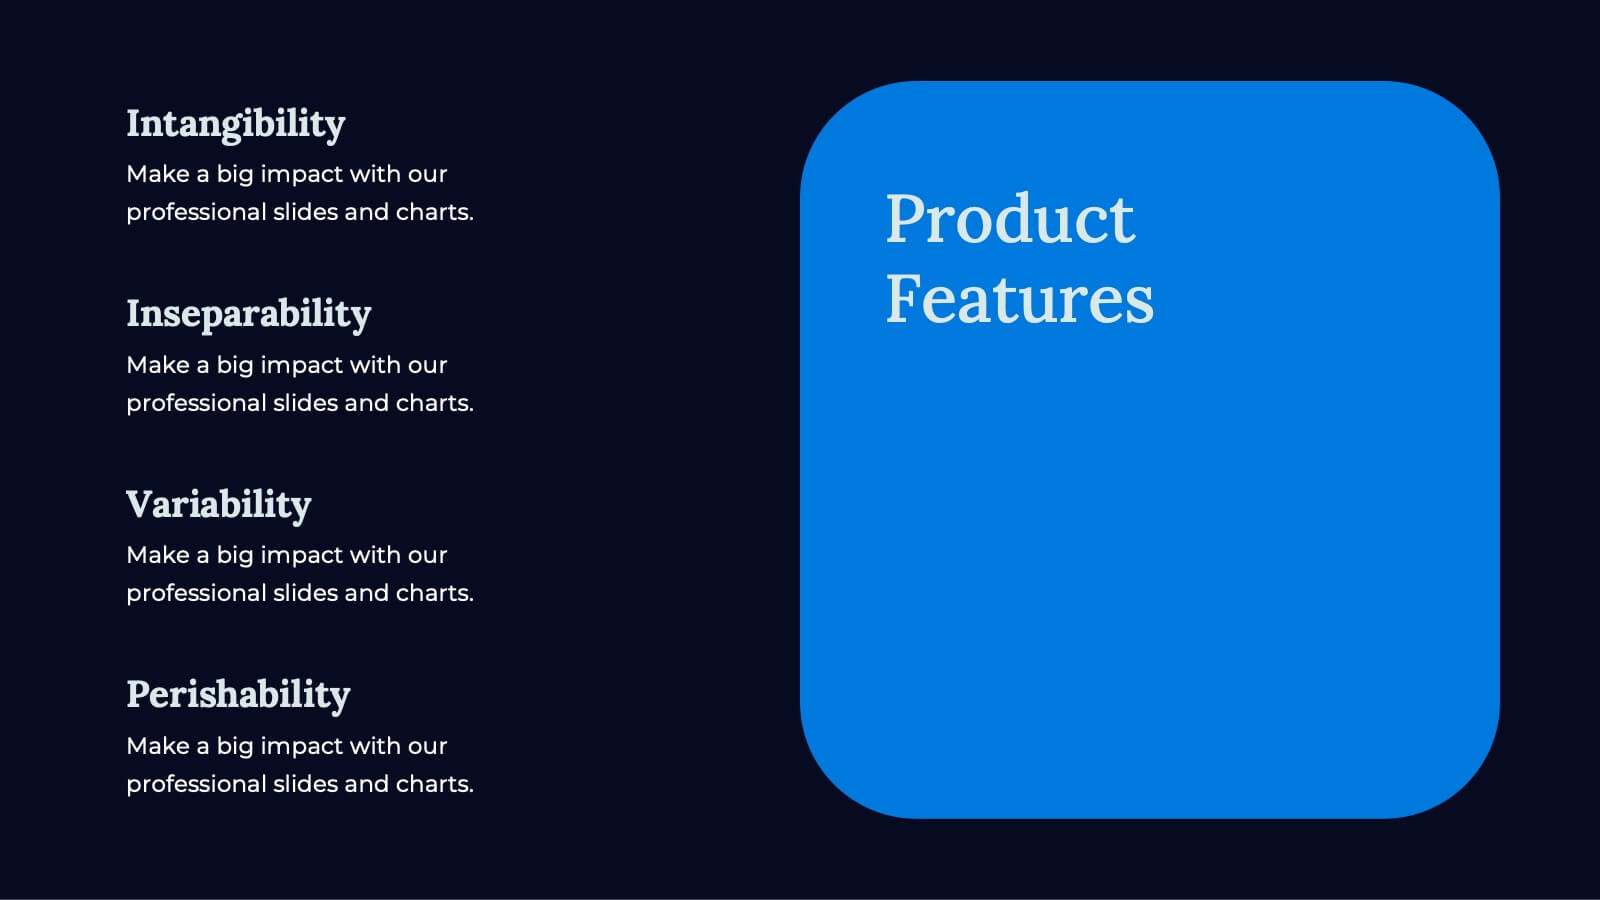
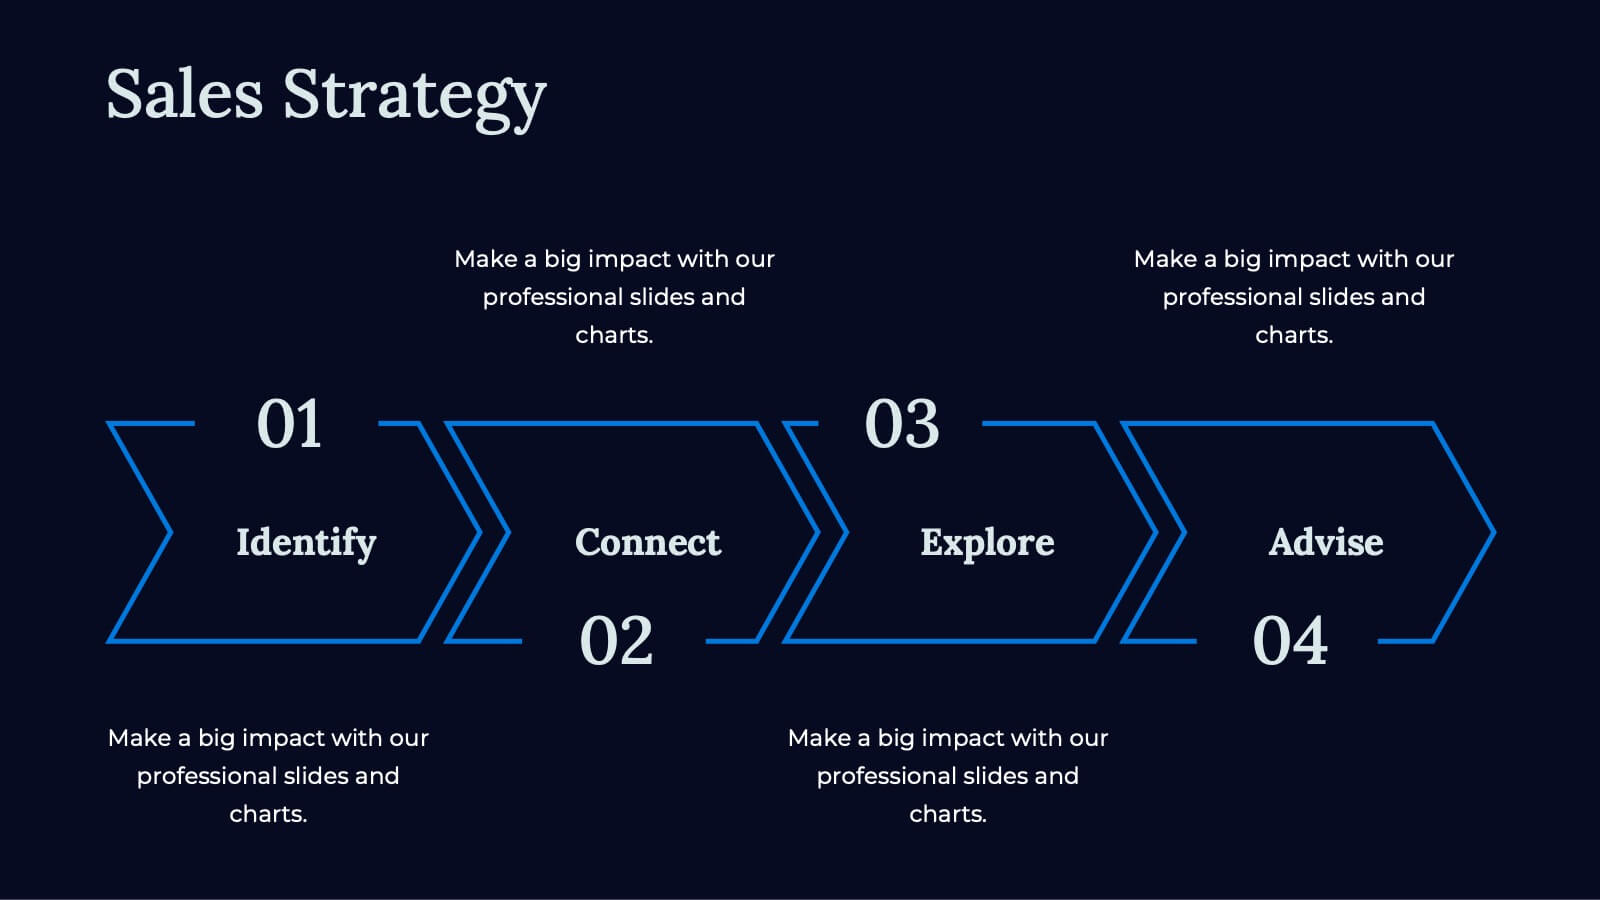
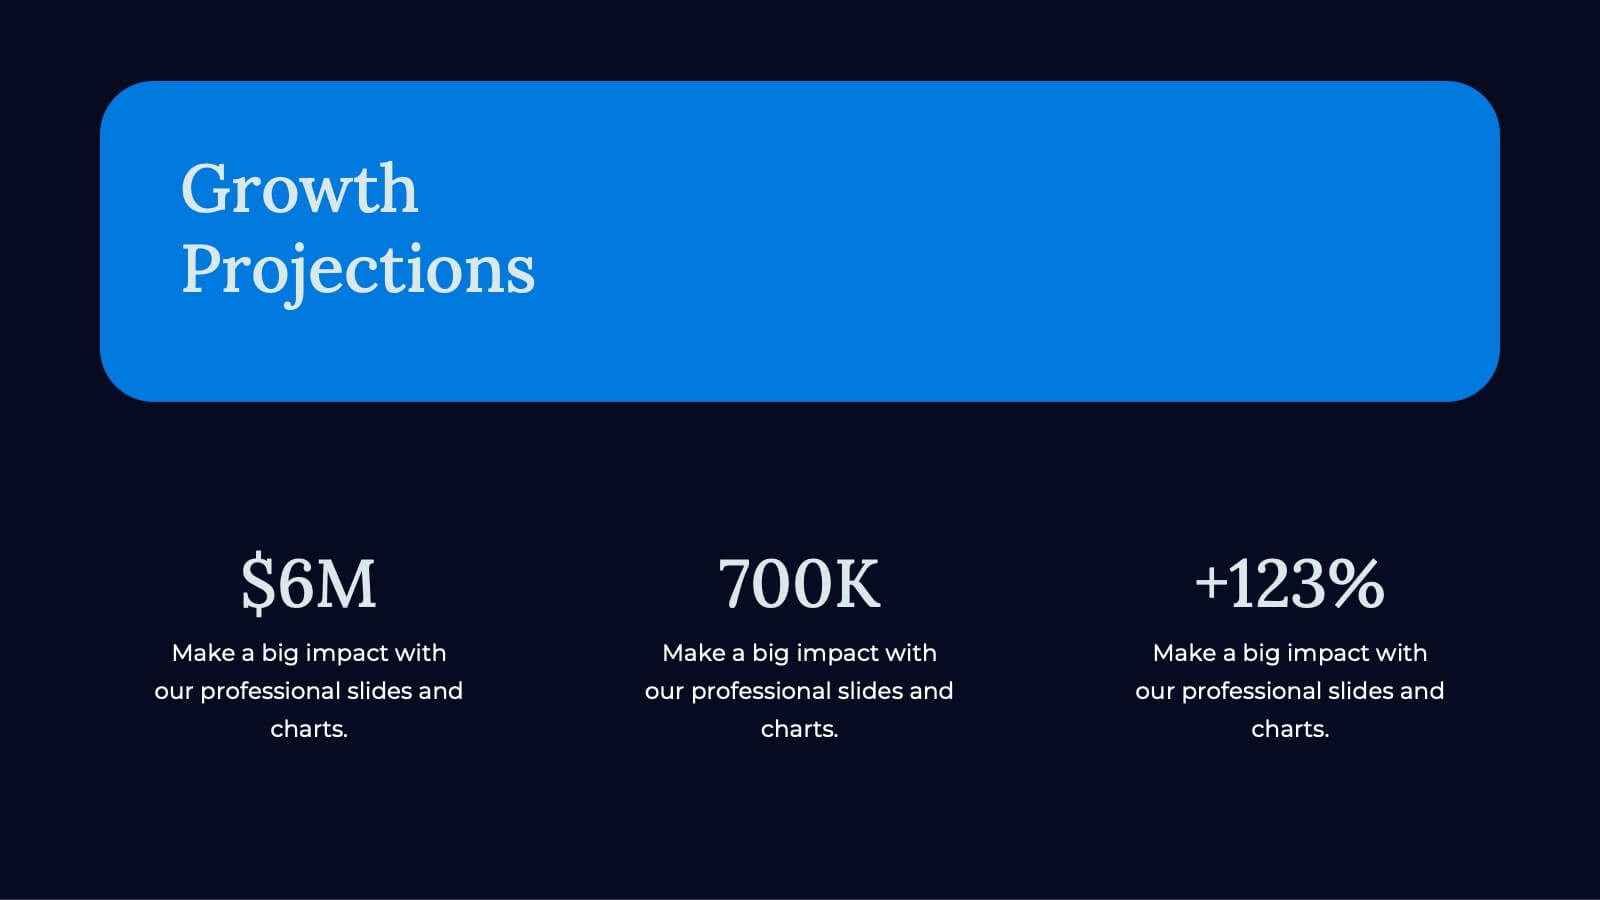
Craft powerful business pitch decks with this sleek template. Present your company overview, problem statement, solutions, and market opportunity. Showcase your business model, revenue model, competitive landscape, and unique selling proposition. Perfect for highlighting financials, growth projections, and funding requirements. Compatible with PowerPoint, Keynote, and Google Slides. Impress investors and stakeholders with clear, concise, and visually appealing presentations.


21 slides
Graphium Market Analysis Report Presentation
Deliver actionable insights with this sleek market analysis report presentation template. Highlight key areas such as performance metrics, market trends, competitor insights, and strategic initiatives to inform stakeholders and drive decisions. Perfect for analysts and business teams, this template is fully compatible with PowerPoint, Keynote, and Google Slides.


5 slides
Organ Structure Breakdown Slide Presentation
Bring your anatomy data to life with this clear and engaging organ breakdown slide. Designed to visually map out key organ functions or statistics, this layout makes complex info feel simple. Whether you're teaching biology or sharing medical research, it's editable and works with PowerPoint, Keynote, and Google Slides.


4 slides
Team Relationship Structure Presentation
Show your organization’s hierarchy with clarity and style using this modern visual layout. Ideal for illustrating team dynamics, reporting lines, or company roles, it helps simplify complex structures into easy-to-follow visuals. Fully customizable and compatible with PowerPoint, Keynote, and Google Slides for seamless editing and professional presentation design.


21 slides
Sungrove Startup Strategy Presentation
Define and present your startup strategy with this sleek and dynamic template, tailored for showcasing innovative plans and competitive positioning. Dive into key slides like customer needs and market insights, business model breakdown, and unique value proposition to clearly outline your vision. Highlight target market analysis, financial forecasts, and growth projections to ensure stakeholders grasp the potential of your business. The template also includes sections for team introductions, infrastructure planning, and competitor landscape analysis to give a holistic overview of your strategy. Designed for customization and compatibility with PowerPoint, Google Slides, and Keynote, this template is perfect for entrepreneurs or startups aiming to deliver a compelling presentation.


21 slides
Frost Design Proposal Presentation
Present your design proposal with sophistication and clarity using this elegant template! Perfect for outlining your project summary, objectives, and proposed solutions, this template covers everything from scope of work and budget breakdowns to deliverables and team expertise. Fully compatible with PowerPoint, Keynote, and Google Slides, it's designed for seamless, professional presentations.


4 slides
Social Media Content Strategy Presentation
Engage your audience with this Social Media Content Strategy Presentation. Featuring side-by-side thumbs-up icons, this template visually contrasts two key focus areas—ideal for comparing campaign goals, content pillars, or platform strategies. Each section includes editable text blocks to outline insights clearly. Fully customizable and compatible with PowerPoint, Keynote, and Google Slides.


6 slides
Demographic Data Analysis
Visualize key population insights with this Demographic Data Analysis slide, designed as a segmented pie chart with icon-based representation. Perfect for showcasing audience breakdowns, customer profiles, or survey results across five demographic categories. Fully editable in PowerPoint, Keynote, and Google Slides.


6 slides
TAM SAM SOM Market Analysis
Take your market insights to the next level with a visual that simplifies complex data in seconds. This layered template helps you clearly communicate TAM, SAM, and SOM breakdowns—perfect for startups, product pitches, or strategic planning. Easily editable in PowerPoint, Keynote, and Google Slides for fast, polished presentations.