


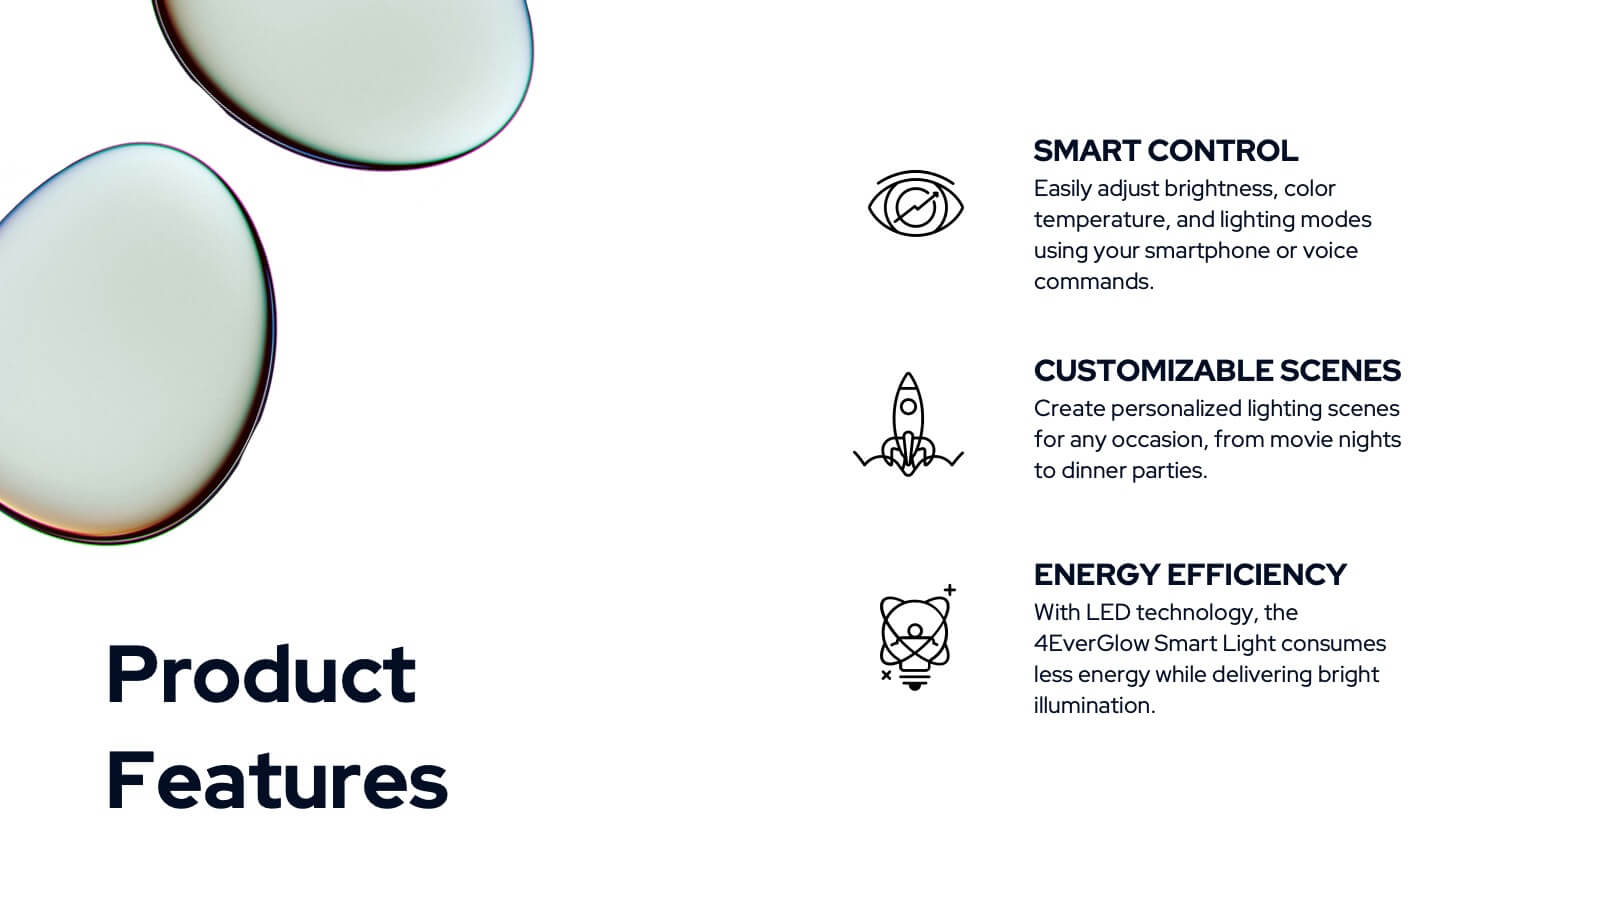
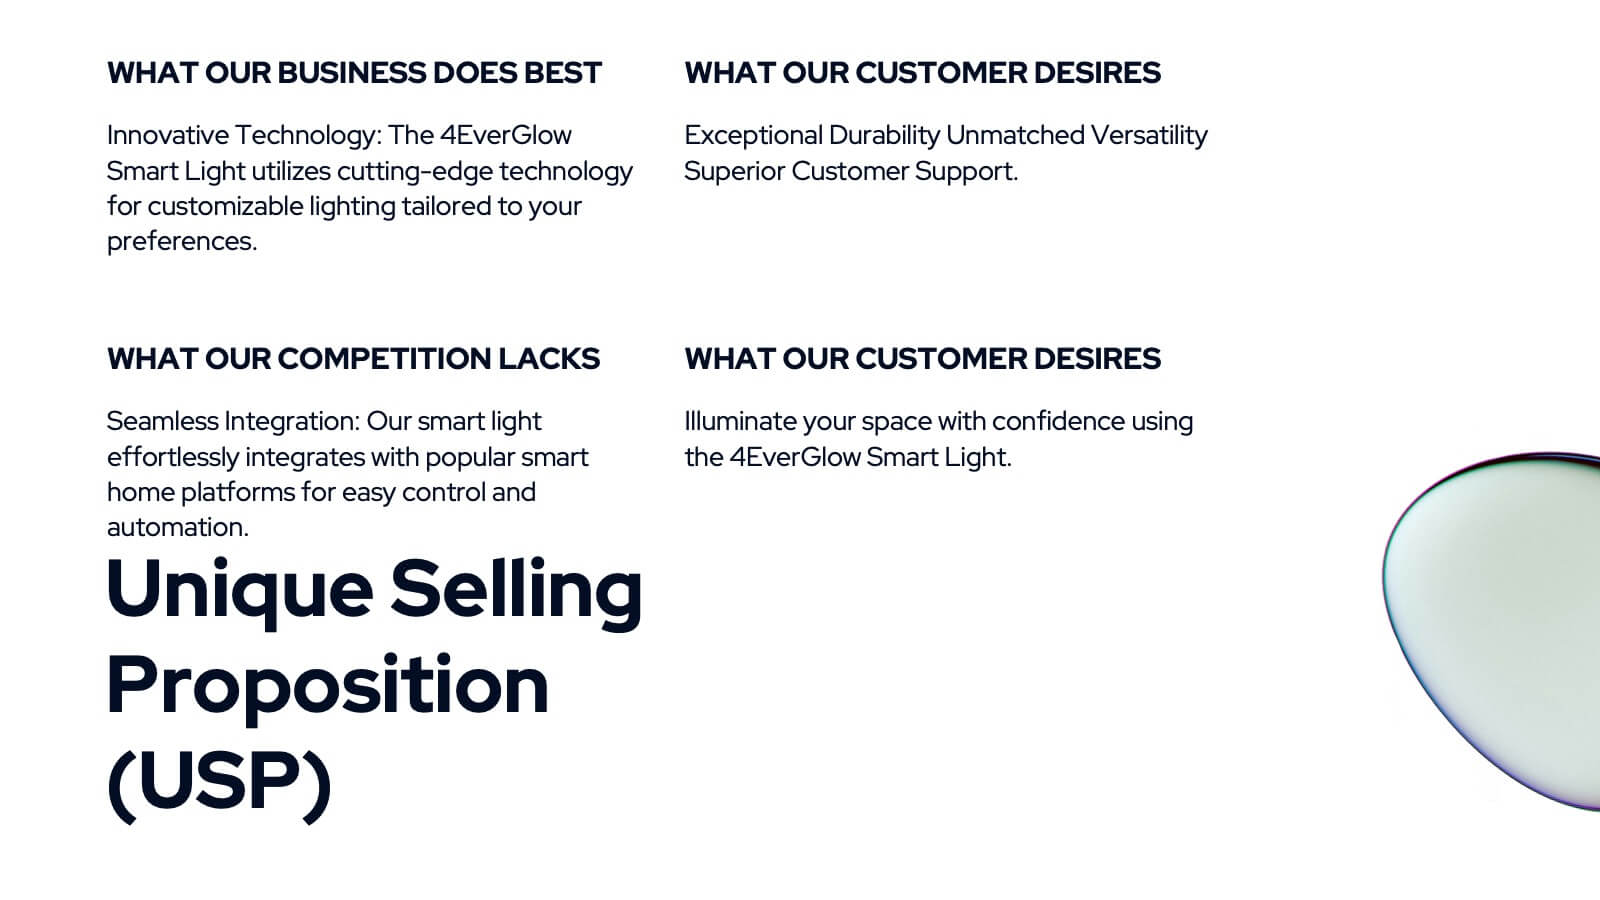
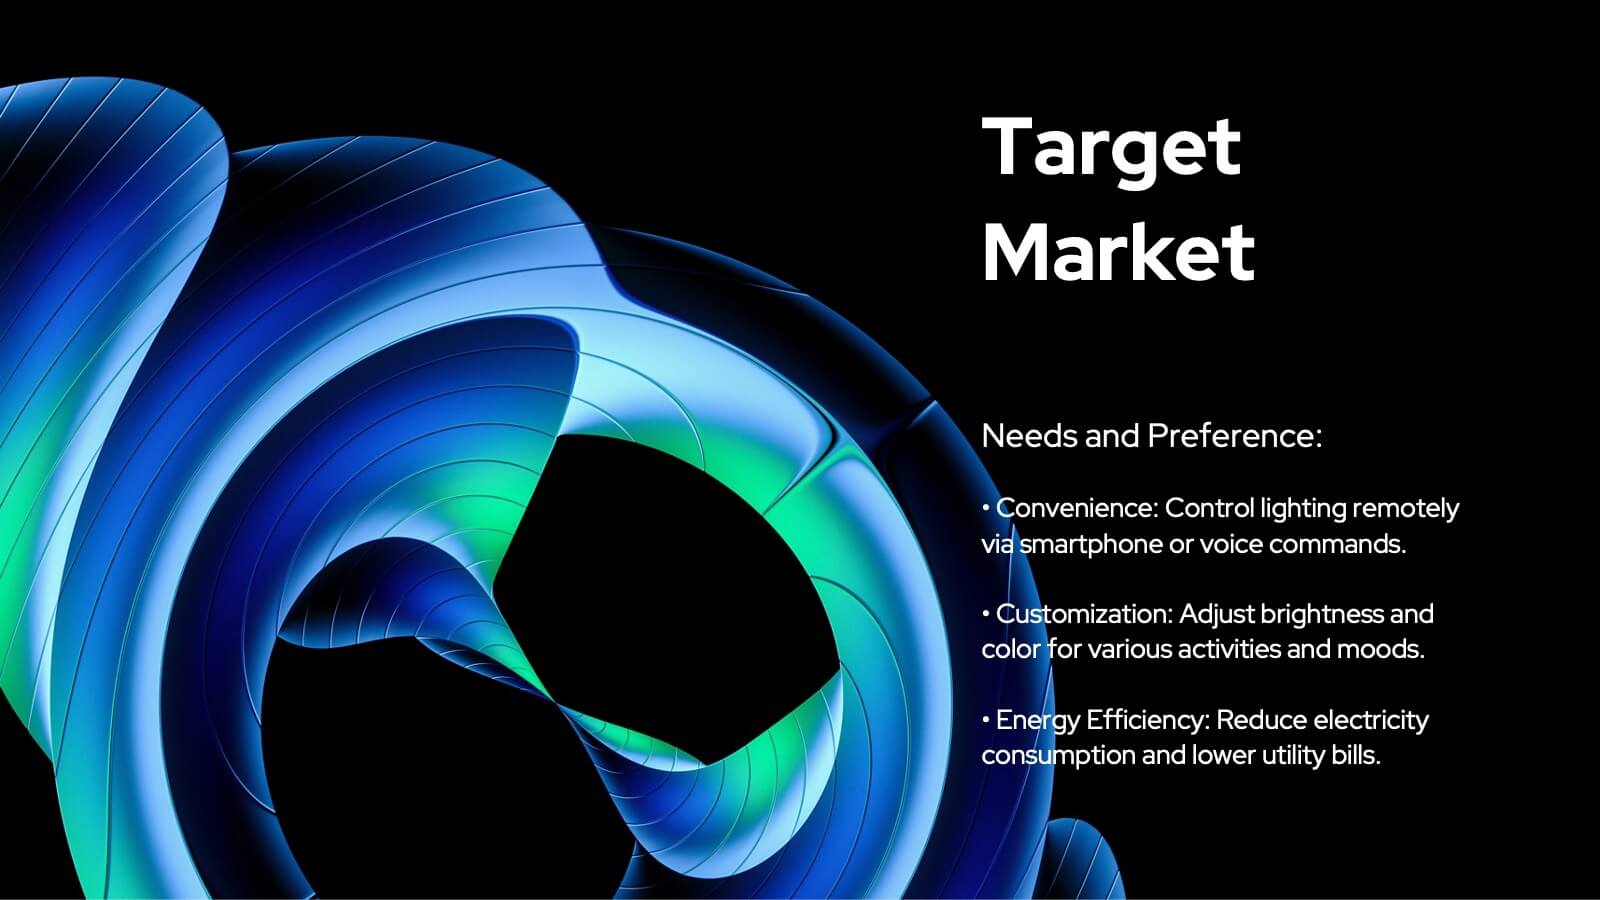
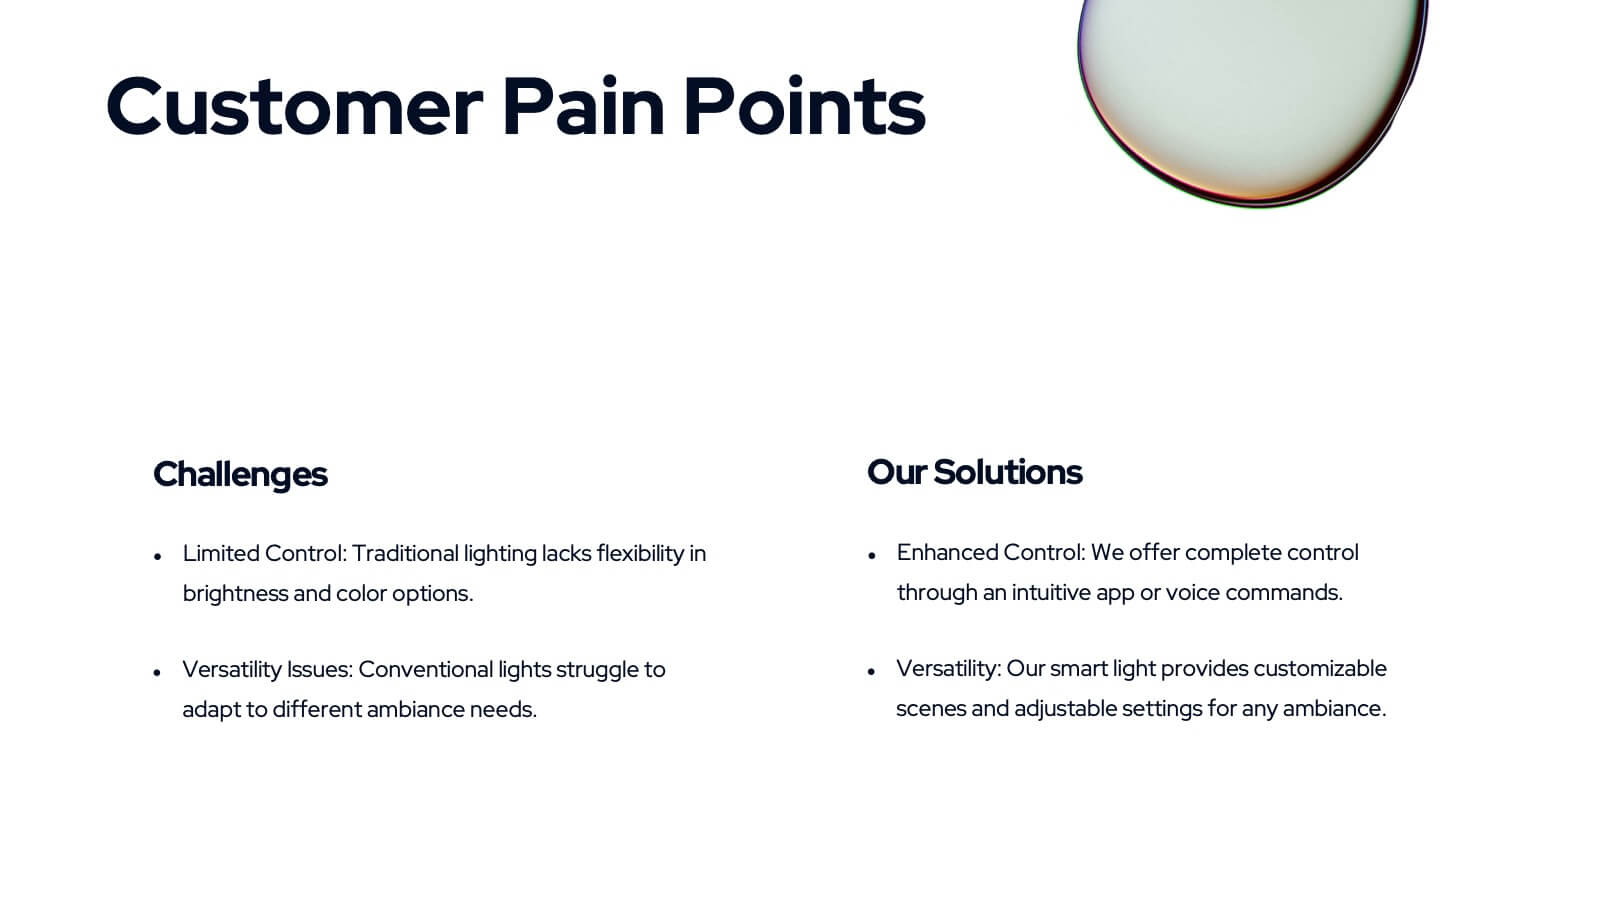
Features
- 6 Unique slides
- Fully editable and easy to edit in Microsoft Powerpoint, Keynote and Google Slides
- 16:9 widescreen layout
- Clean and professional designs
- Export to JPG, PDF or send by email


Do you have any questions?
Recommend


6 slides
Multiple Business Solutions Options Slide Presentation
Explore diverse strategies with the Multiple Business Solutions Options Slide Presentation. Featuring a vertical stack of labeled briefcases (A–F), this slide is designed to compare and communicate multiple business ideas, solutions, or pathways in a clear, structured layout. Ideal for pitching product variations, workflow choices, or market entry tactics. Each option is paired with customizable text fields for added clarity. Compatible with PowerPoint, Keynote, and Google Slides for easy editing and integration into your existing decks.


7 slides
Business Credit Card Infographic
Navigating business credit cards can seem overwhelming, but with our vibrant infographic, it becomes effortless. Drenched in playful pinks and dynamic colors, this tool is more than just eye-catching—it's a roadmap to the intricate realm of corporate credit. Tailored for everyone from financial educators to seasoned business owners, this infographic offers a clear, concise breakdown of business card essentials, benefits, and best practices. Whether you're presenting, learning, or simply seeking clarity, this resource promises invaluable insights with a dash of flair. Dive in and demystify the world of business credit cards with us!


26 slides
Creative Programming Presentation
The process of Developing Software involves the development of everything from a simple application or web page to complex enterprise systems. Software development is a collaborative effort between developers, designers, and other stakeholders. This Creative Template is perfect for delivering presentations about the latest projects, apps and ideas. The simple layout allows you to focus on what matters most, your idea. Make your most important presentation spectacular with this template. With high-powered visual content and a smooth flow, you’ll keep your audience engaged from beginning to end!


5 slides
Phone and Laptop Mockup Slides Presentation
Bring your content to life with a sleek, modern slide that showcases your product or message beside a clean laptop-and-phone mockup. This presentation focuses on illustrating comparisons, app designs, or digital concepts in a polished, professional way. Ideal for tech pitches or product overviews, and fully compatible with PowerPoint, Keynote, and Google Slides.


6 slides
Go-to-Market Launch Plan Presentation
Launch with confidence using this Go-to-Market Launch Plan Presentation. This clean, step-by-step visual framework highlights each phase of your GTM strategy—from market research to execution metrics. Ideal for startups, product managers, and marketing teams. Fully customizable in PowerPoint, Keynote, and Google Slides.


12 slides
Editable Chart Presentation
Present your data with impact using the Editable Chart Presentation. This versatile slide set includes colorful bar and line charts designed for performance metrics, sales growth, or budget comparisons. Easily swap out values and labels to match your story. Fully editable in PowerPoint, Keynote, Google Slides, and Canva.


5 slides
Wedding Ceremony Program Infographics
Wedding Ceremony infographics are visual representations that provide essential information and details about a wedding ceremony. These vertical infographics feature eye catching designs that will help you present a unique and memorable wedding ceremony program. This template is perfect for couples, wedding planners, or event organizers looking to present the order of events and important details in a visually engaging way. These infographics are designed using elegant and romantic elements, such as delicate illustrations, floral motifs, and soft color palettes, creating a charming and visually cohesive look.


21 slides
Selkie New Product Proposal Presentation
Dive into your next big idea with this sleek, Selkie-inspired presentation template, designed for presenting a new product proposal! Highlight key features, market opportunities, and potential growth in a visually captivating format that flows effortlessly. Engage your audience and make an impact. Compatible with PowerPoint, Keynote, and Google Slides for easy customization.


6 slides
Strategic Task and To-Do List Slide Presentation
Keep your team aligned and on track with the Strategic Task and To-Do List Slide Presentation. This layout is ideal for showcasing action items, project priorities, and status updates using a visual notepad style. Color-coded sections and checkmark indicators make it easy to communicate task progress. Fully customizable in PowerPoint, Keynote, and Google Slides.

20 slides
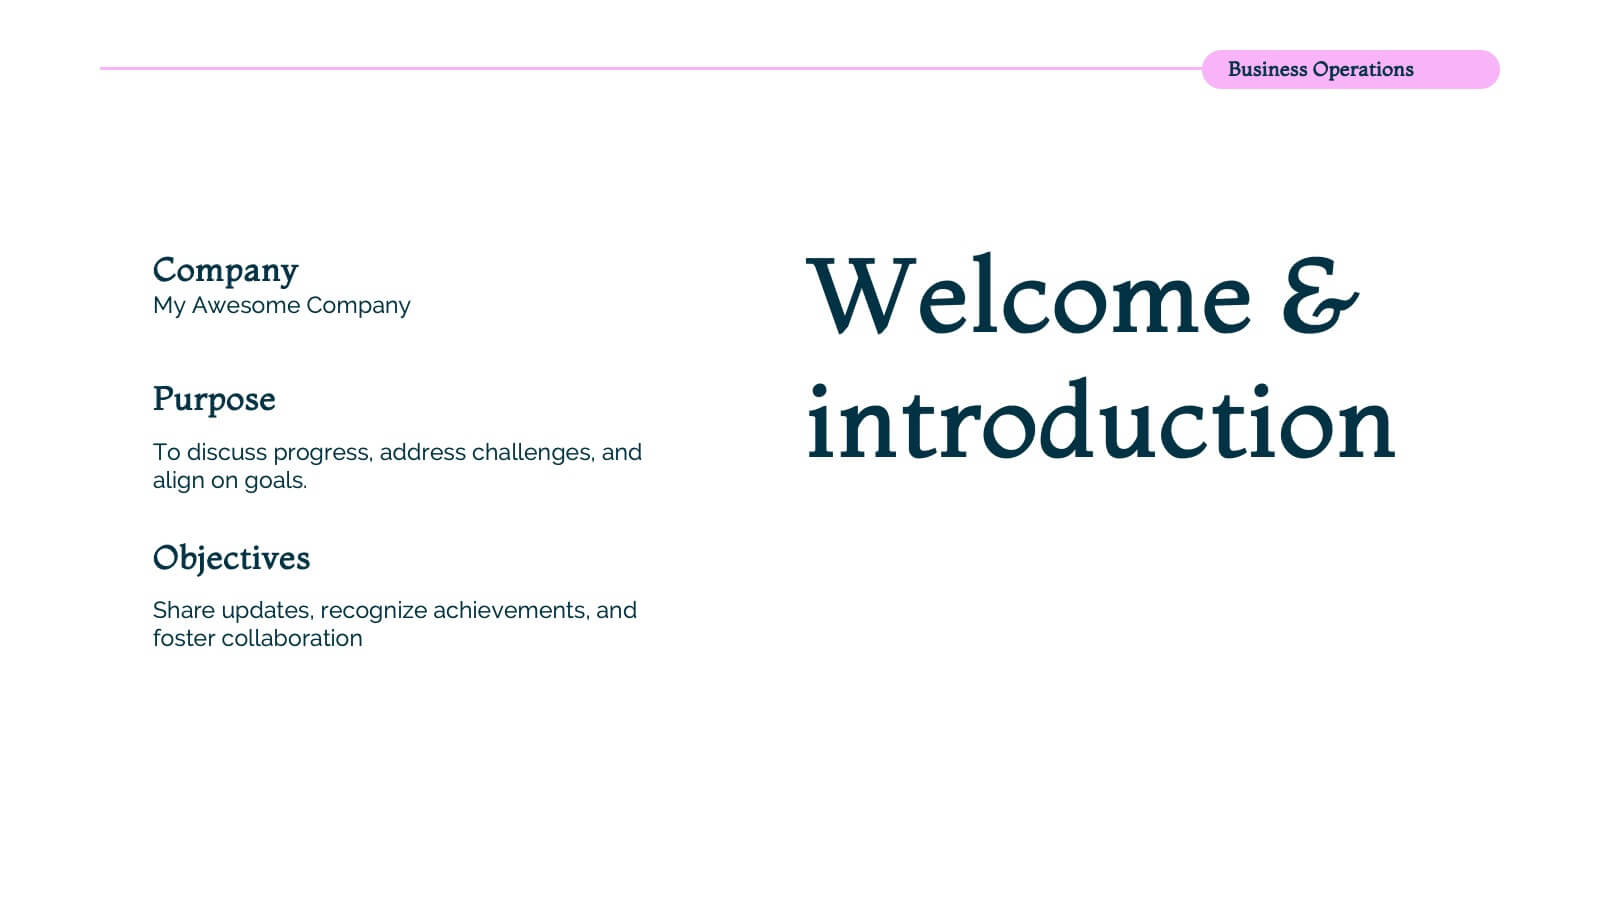
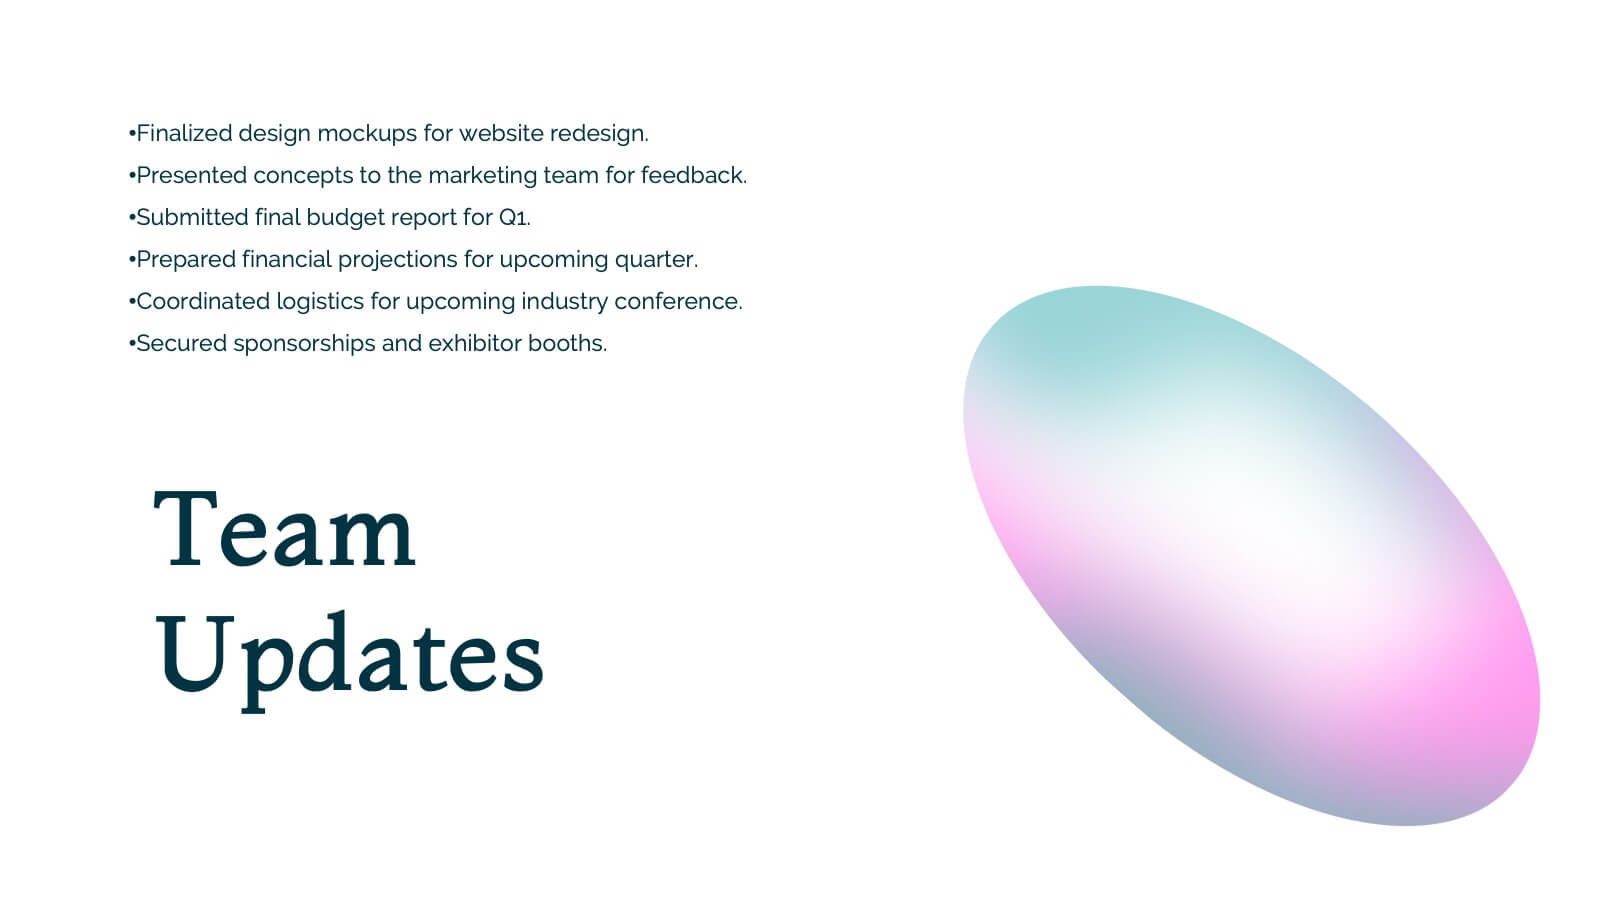
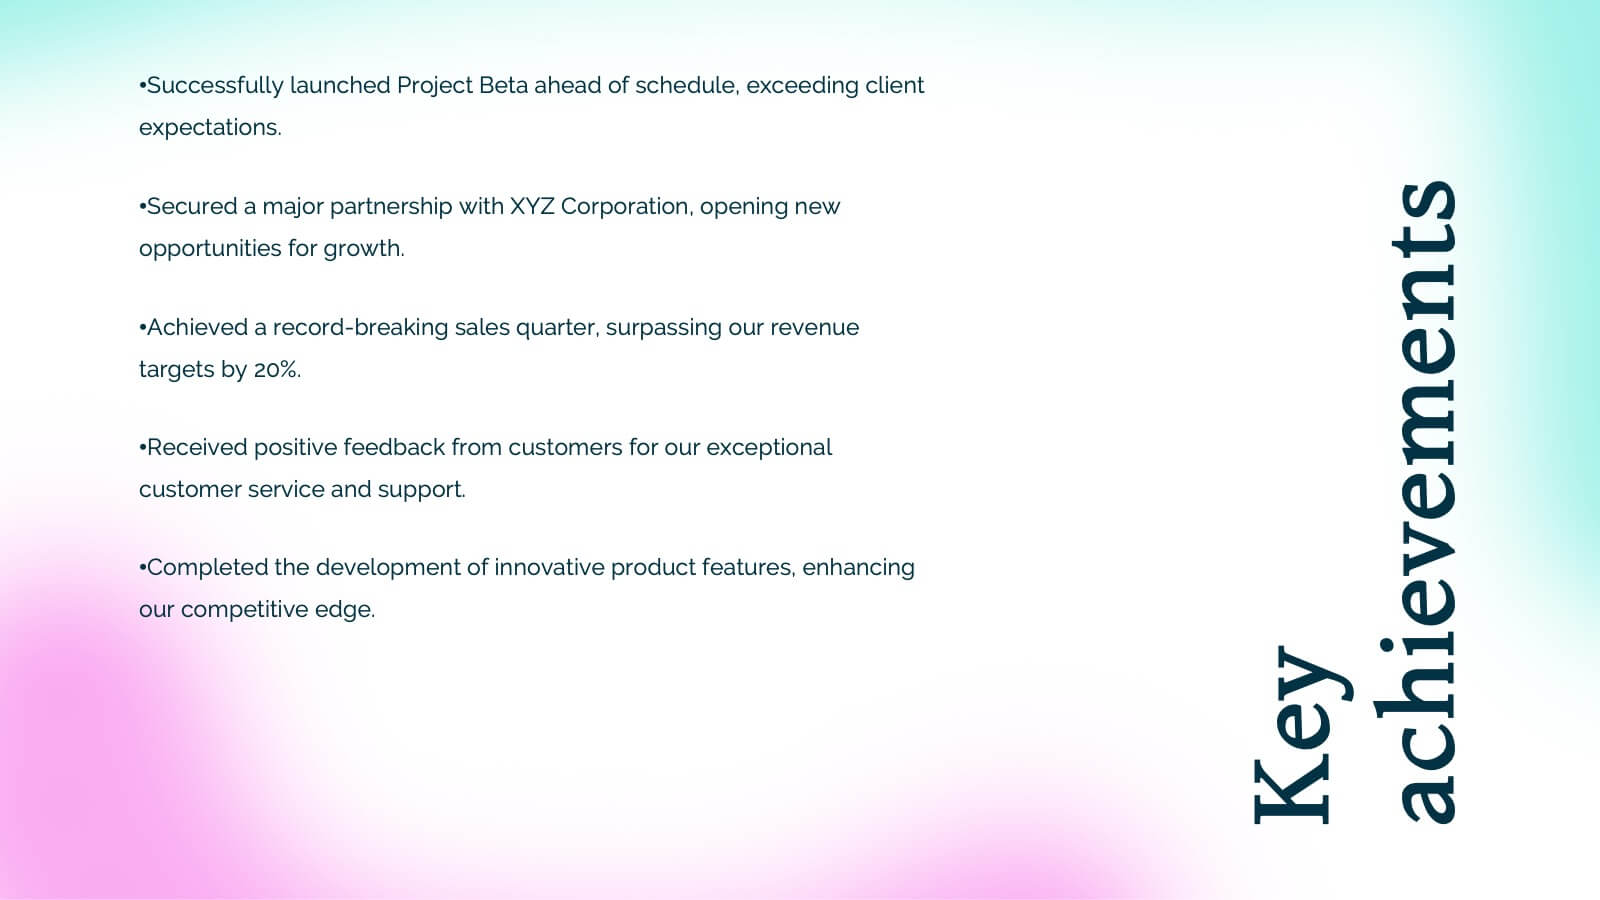
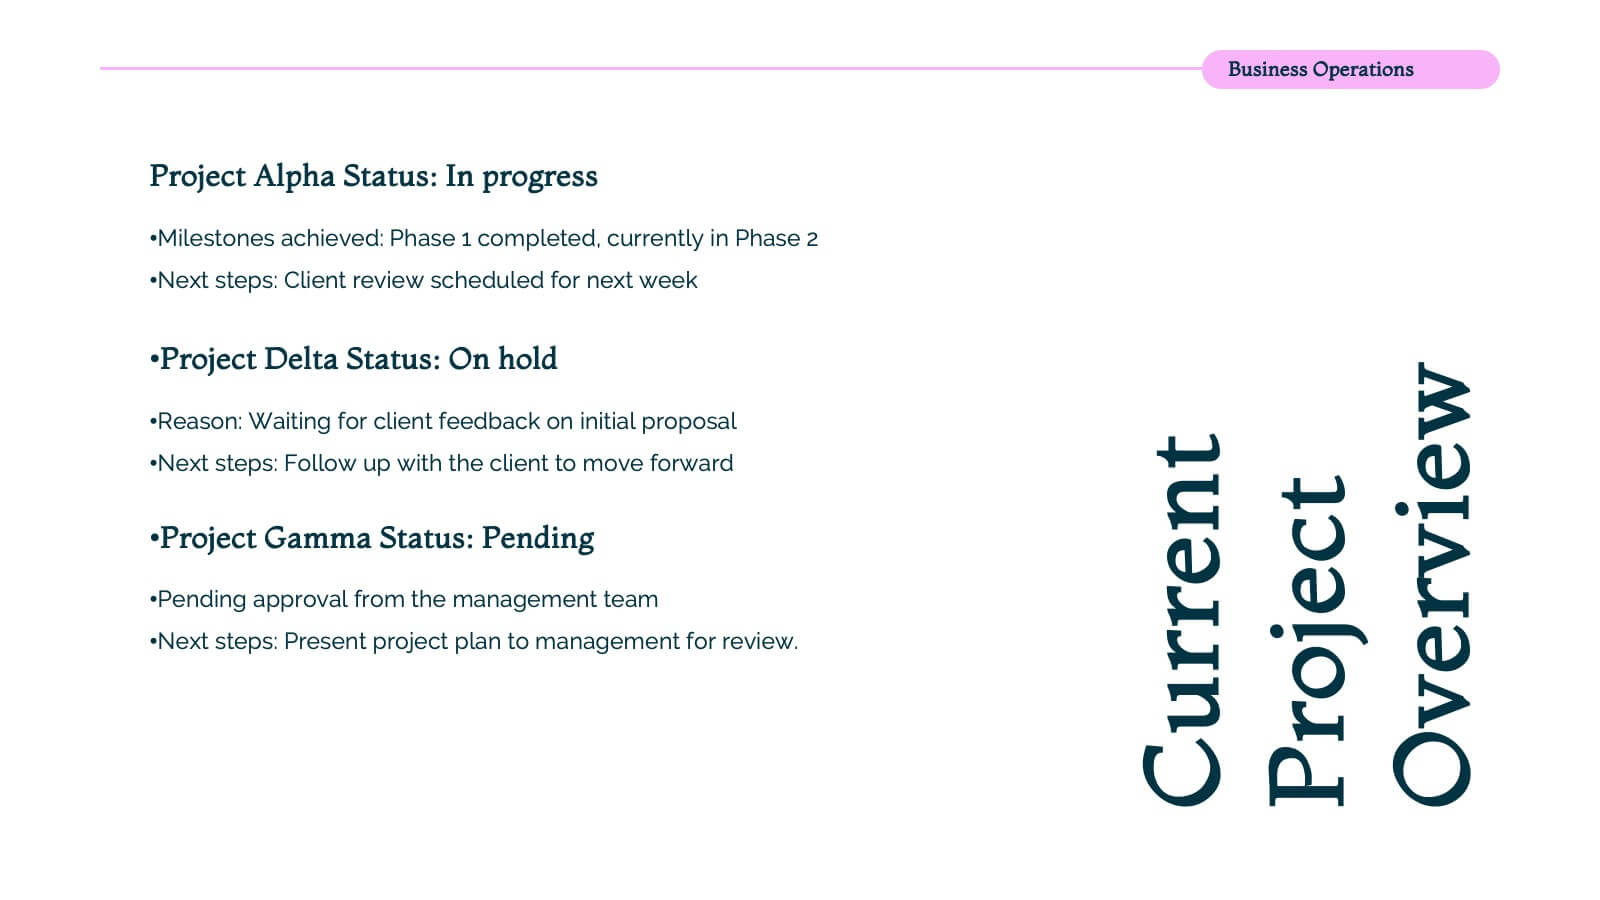
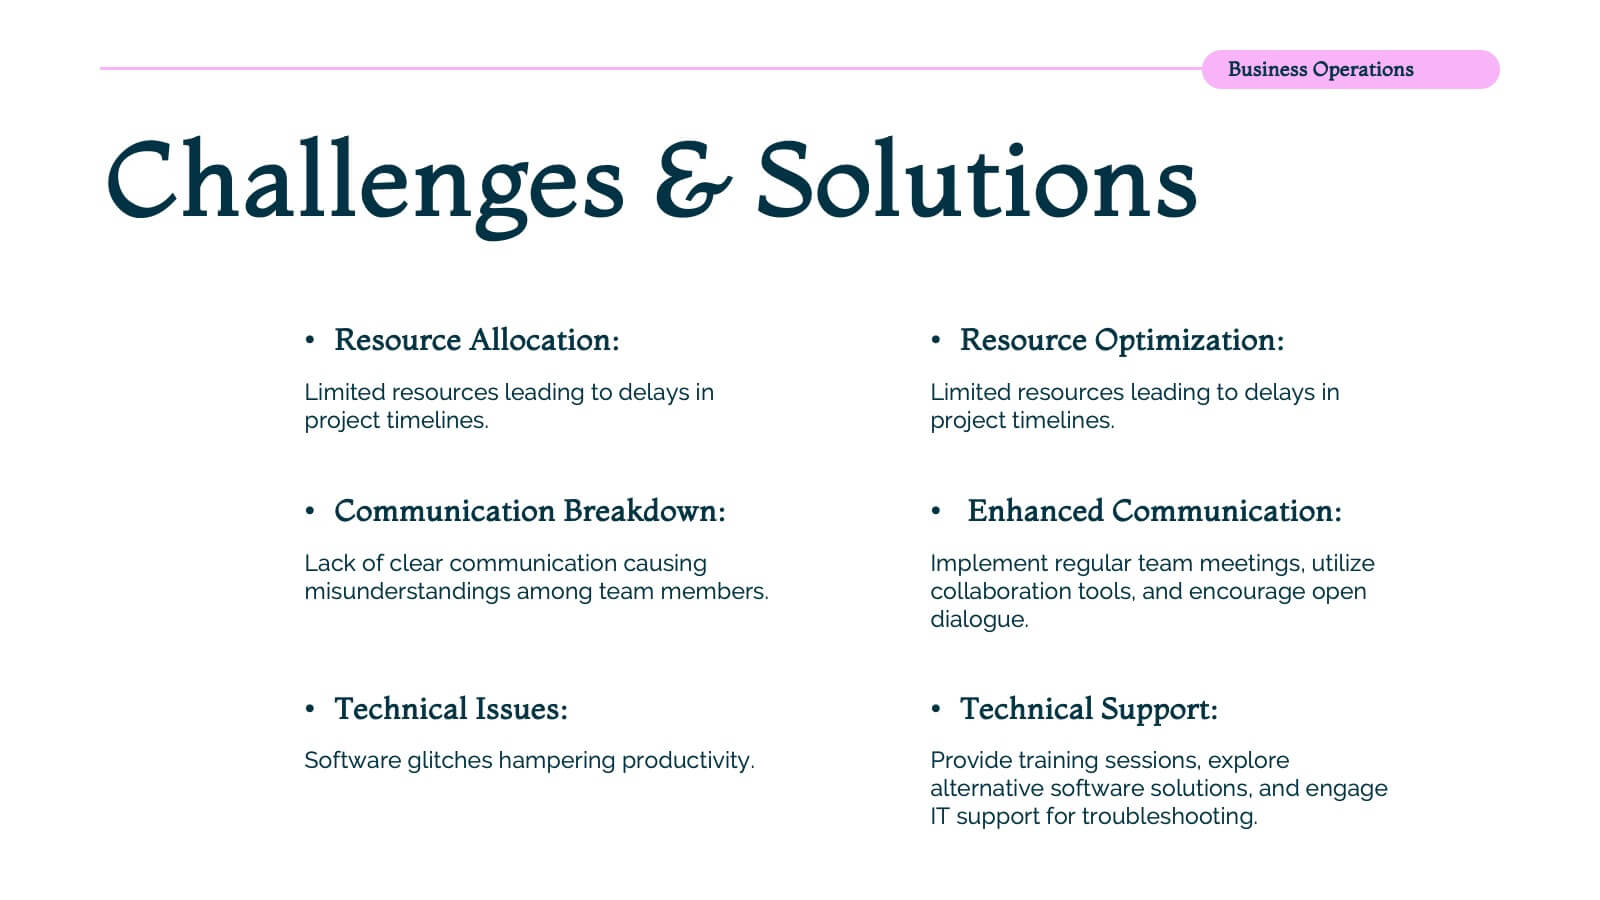
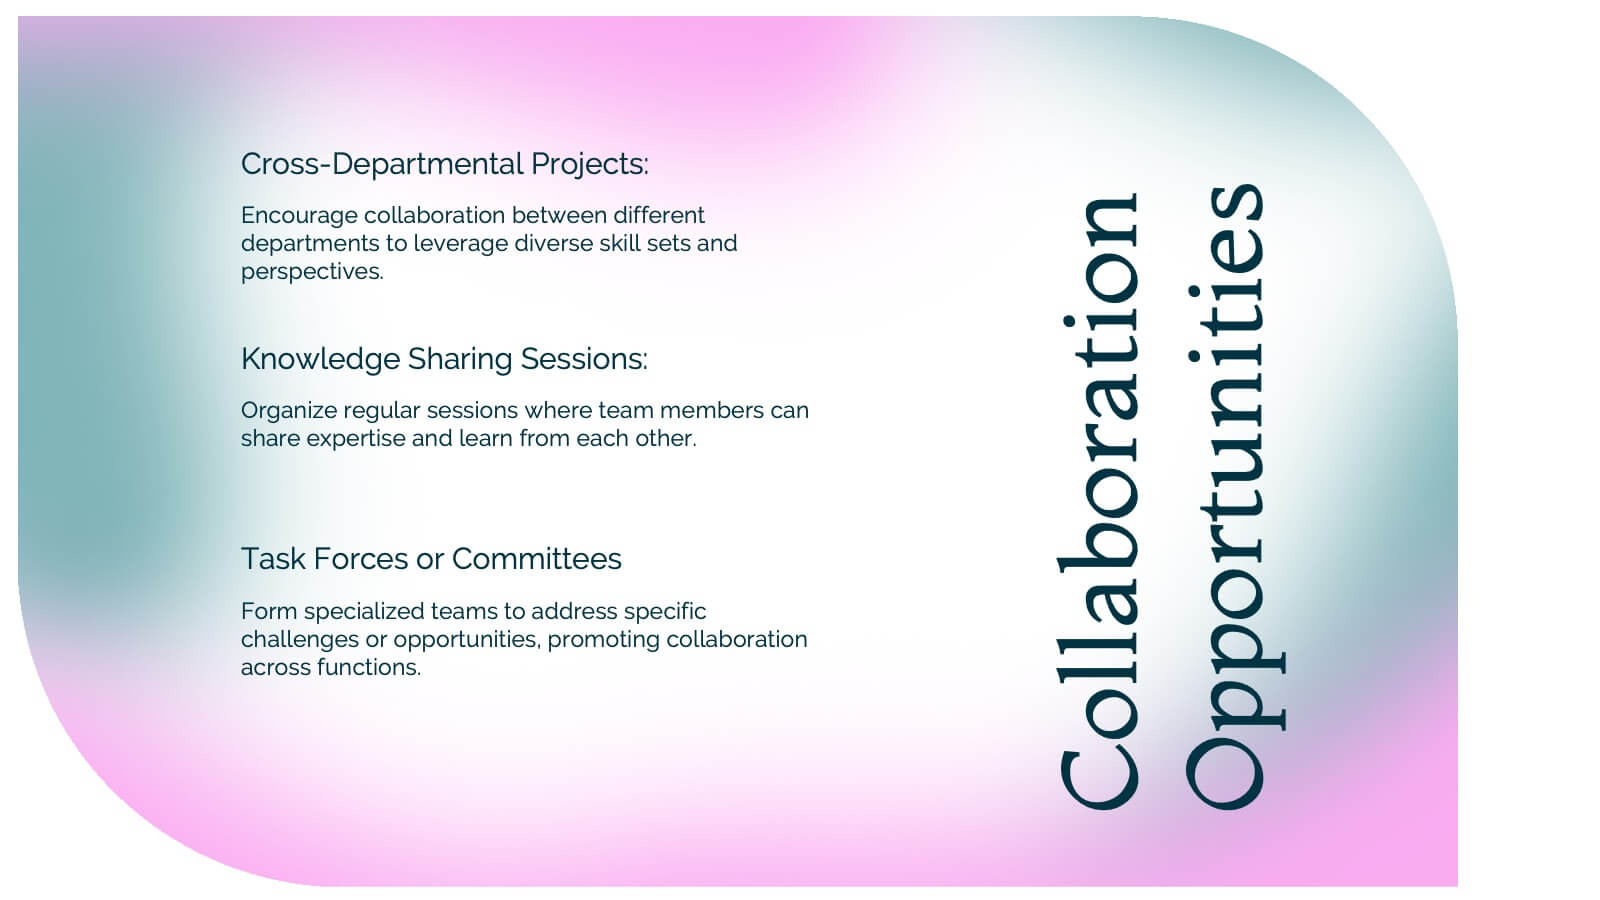
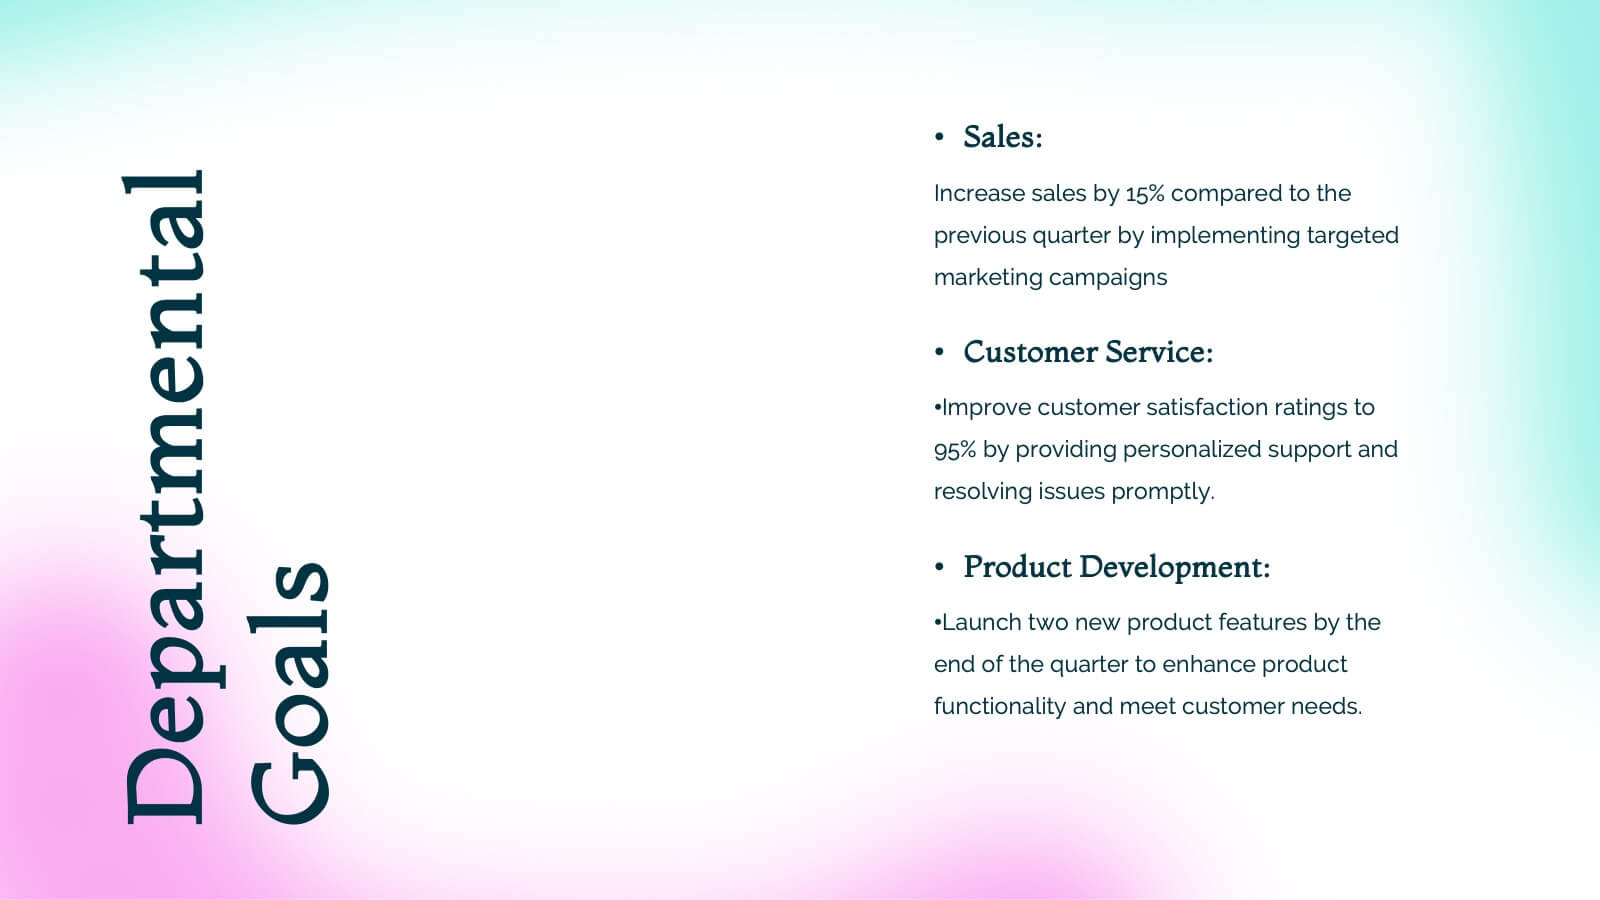
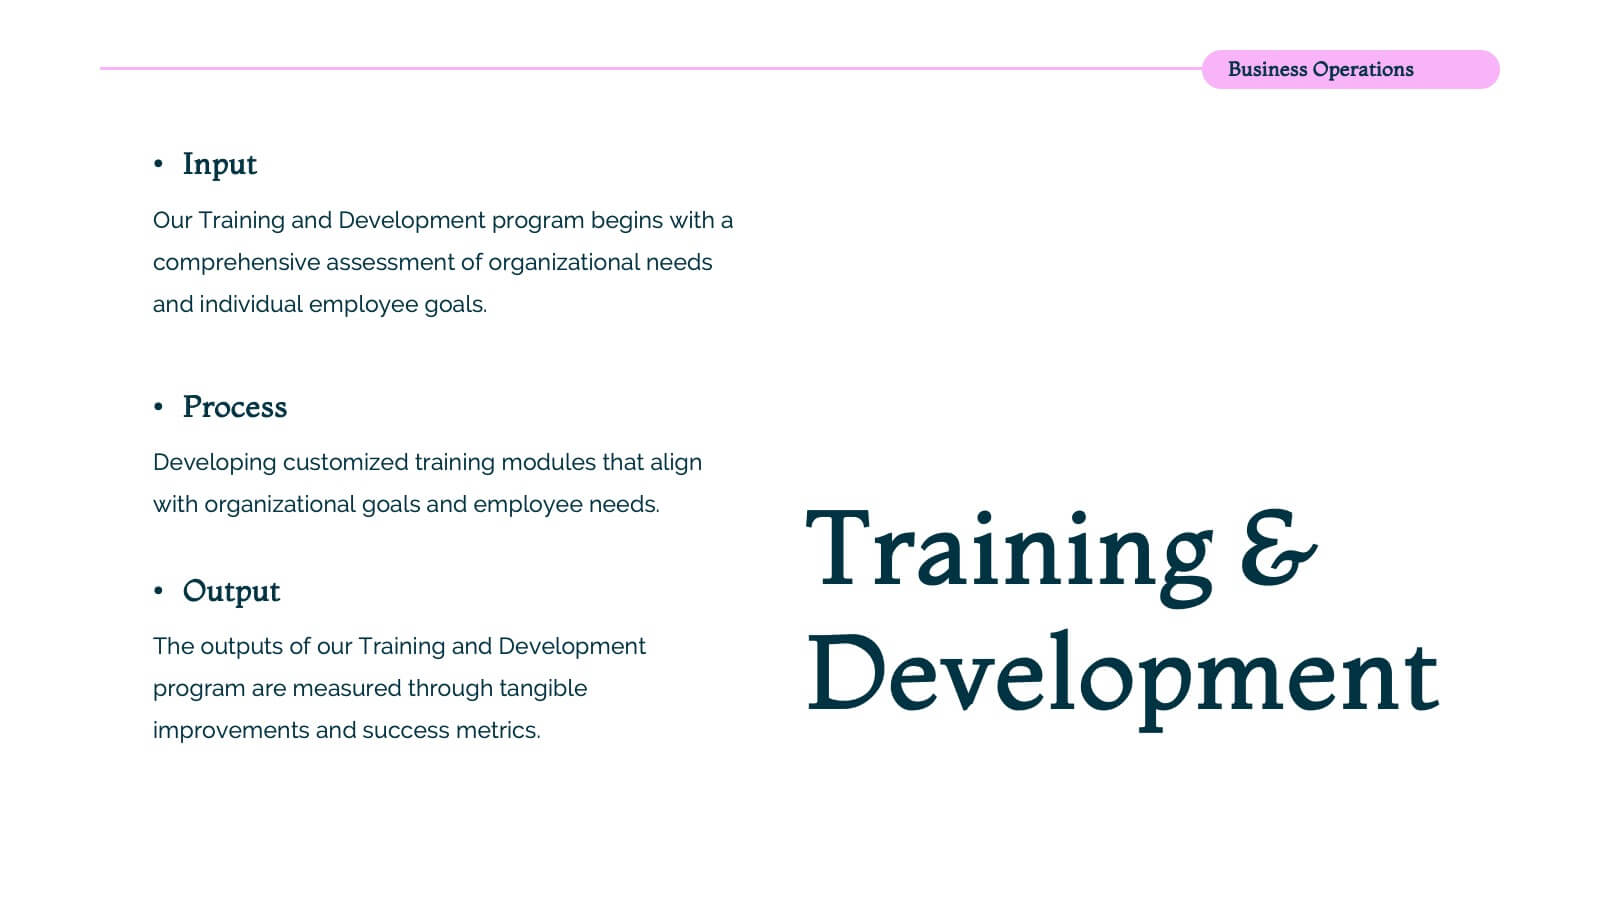
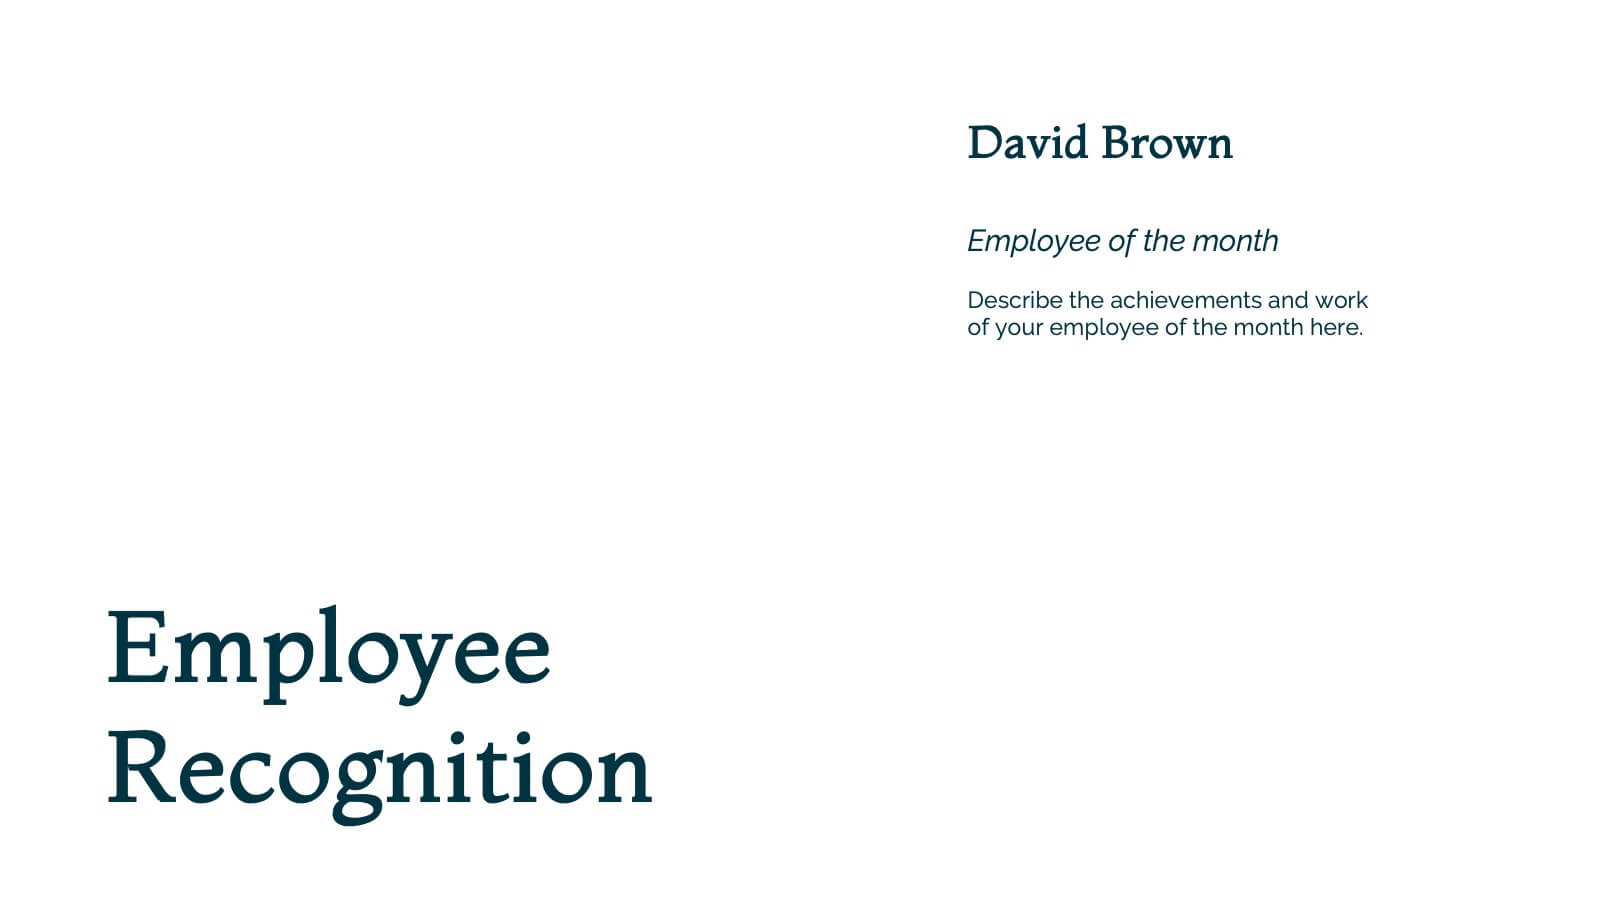
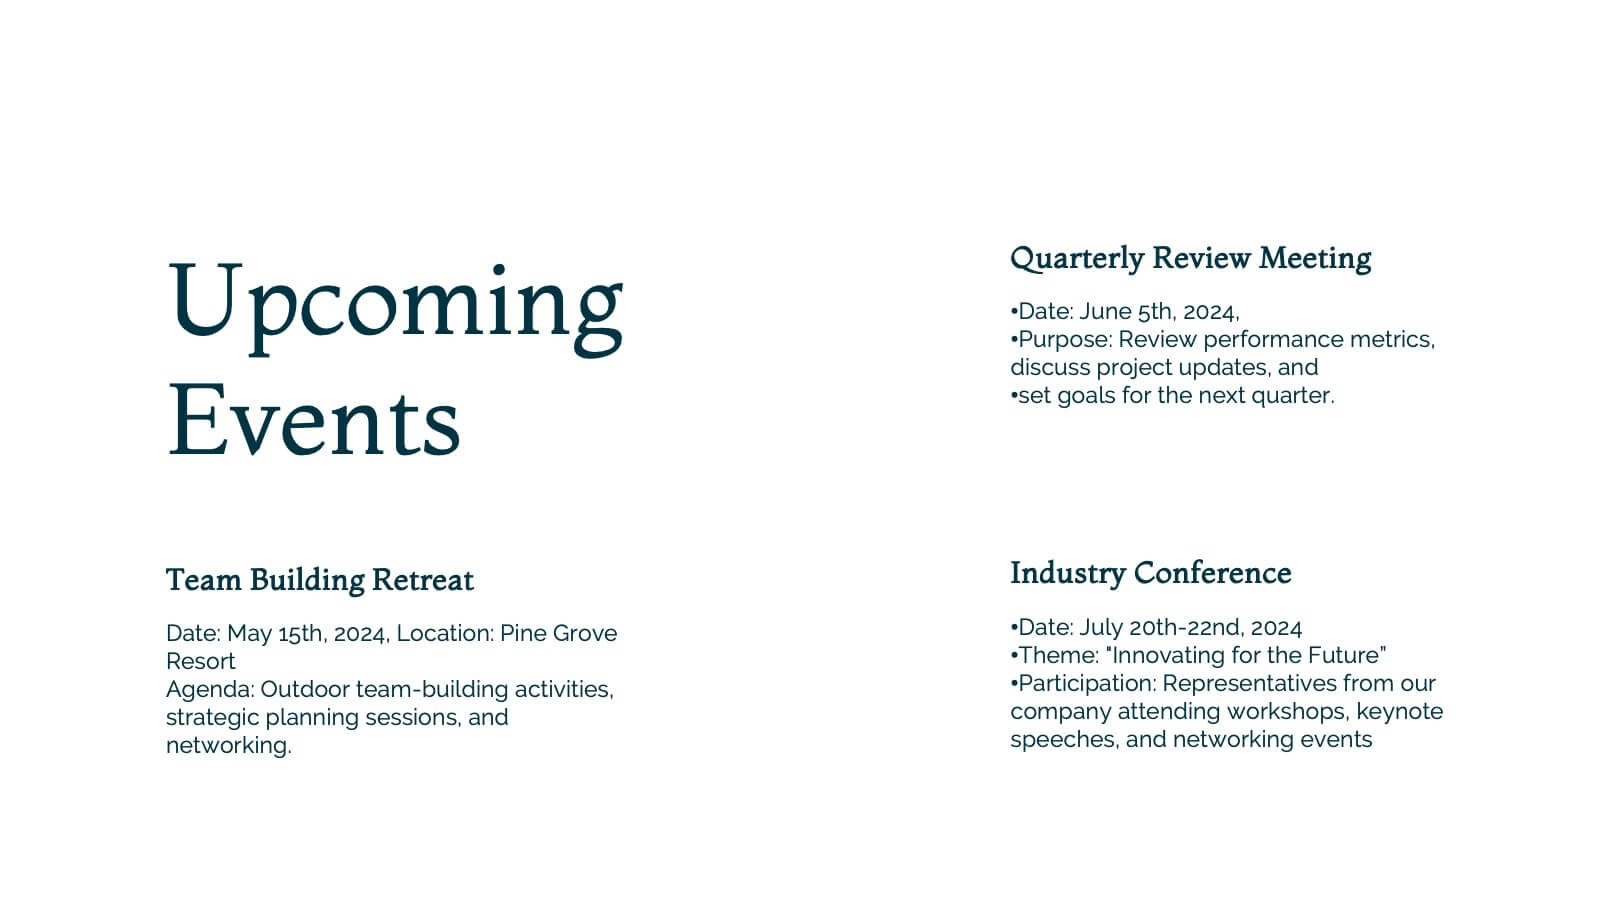
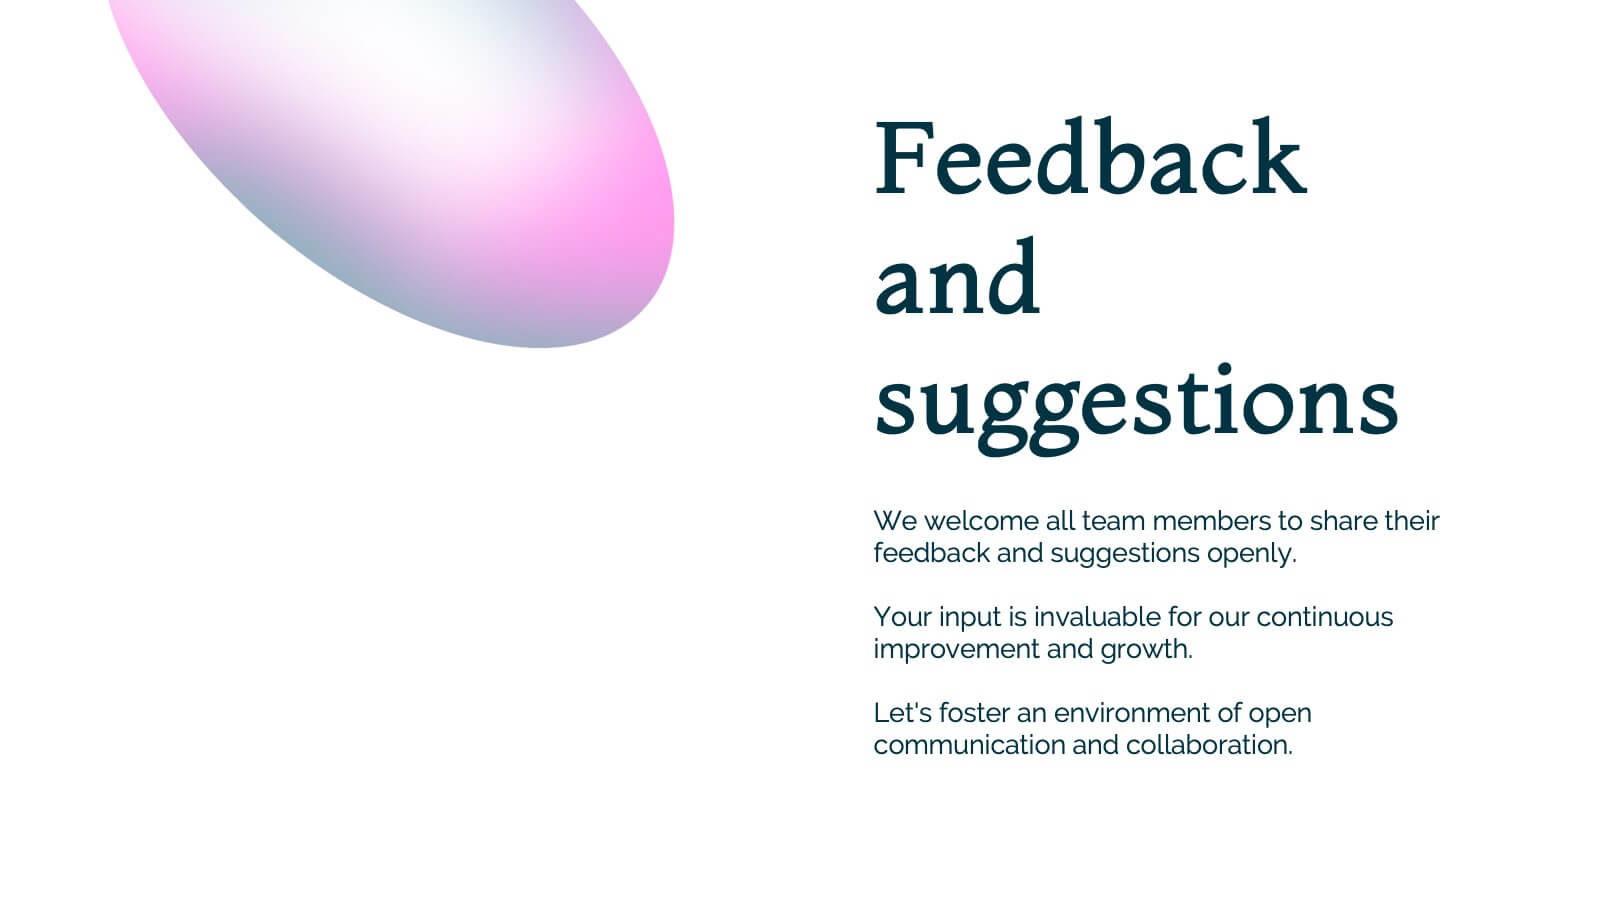
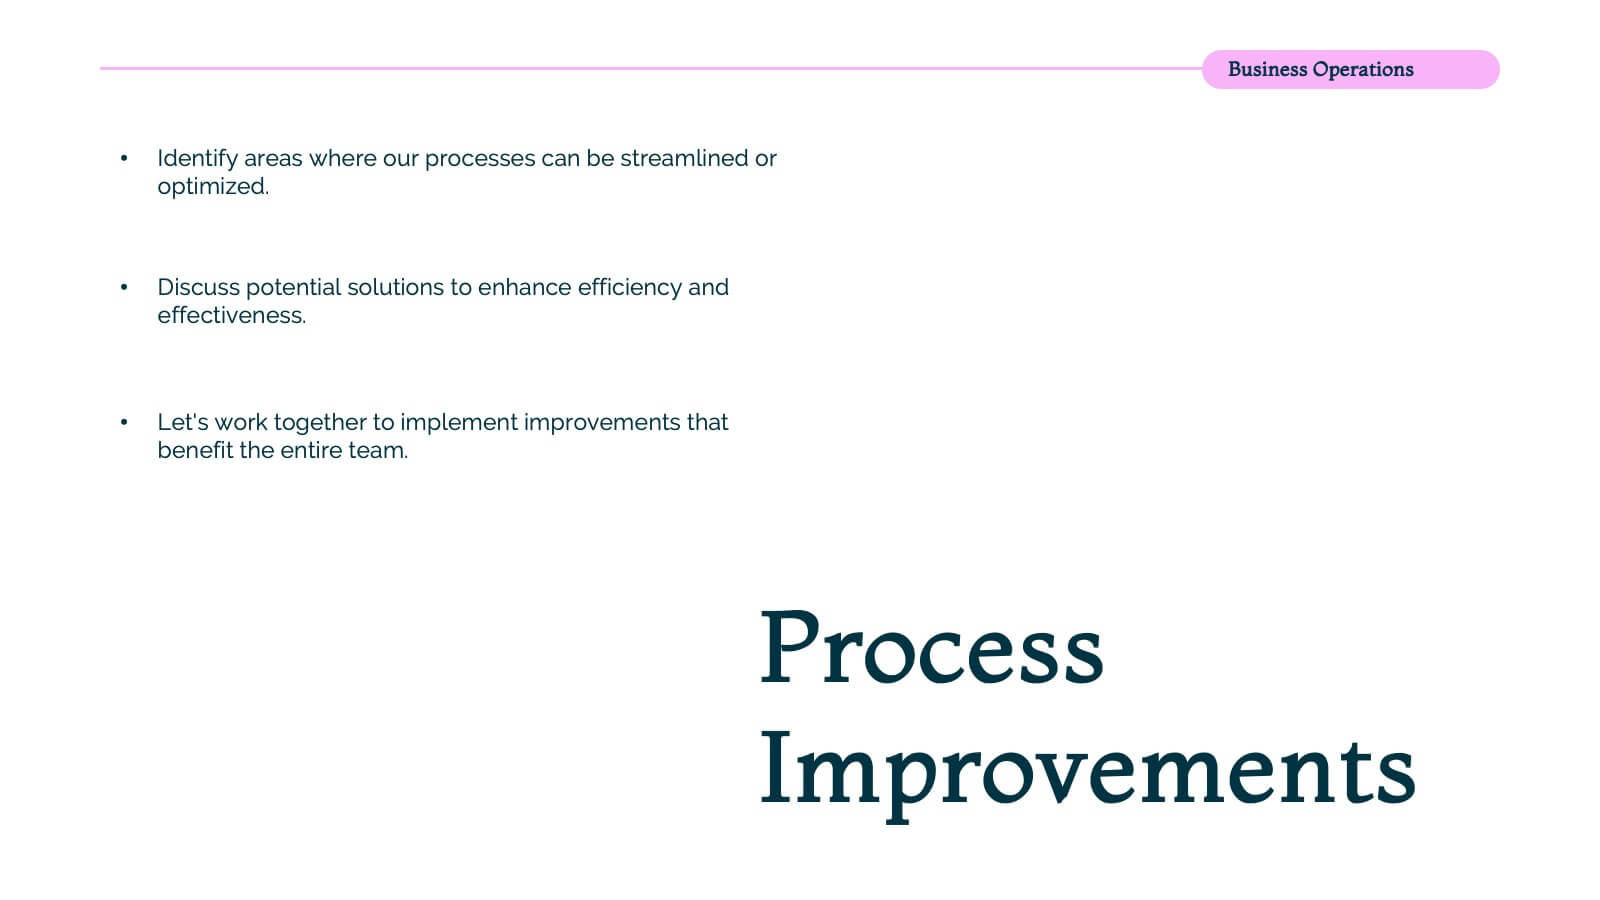
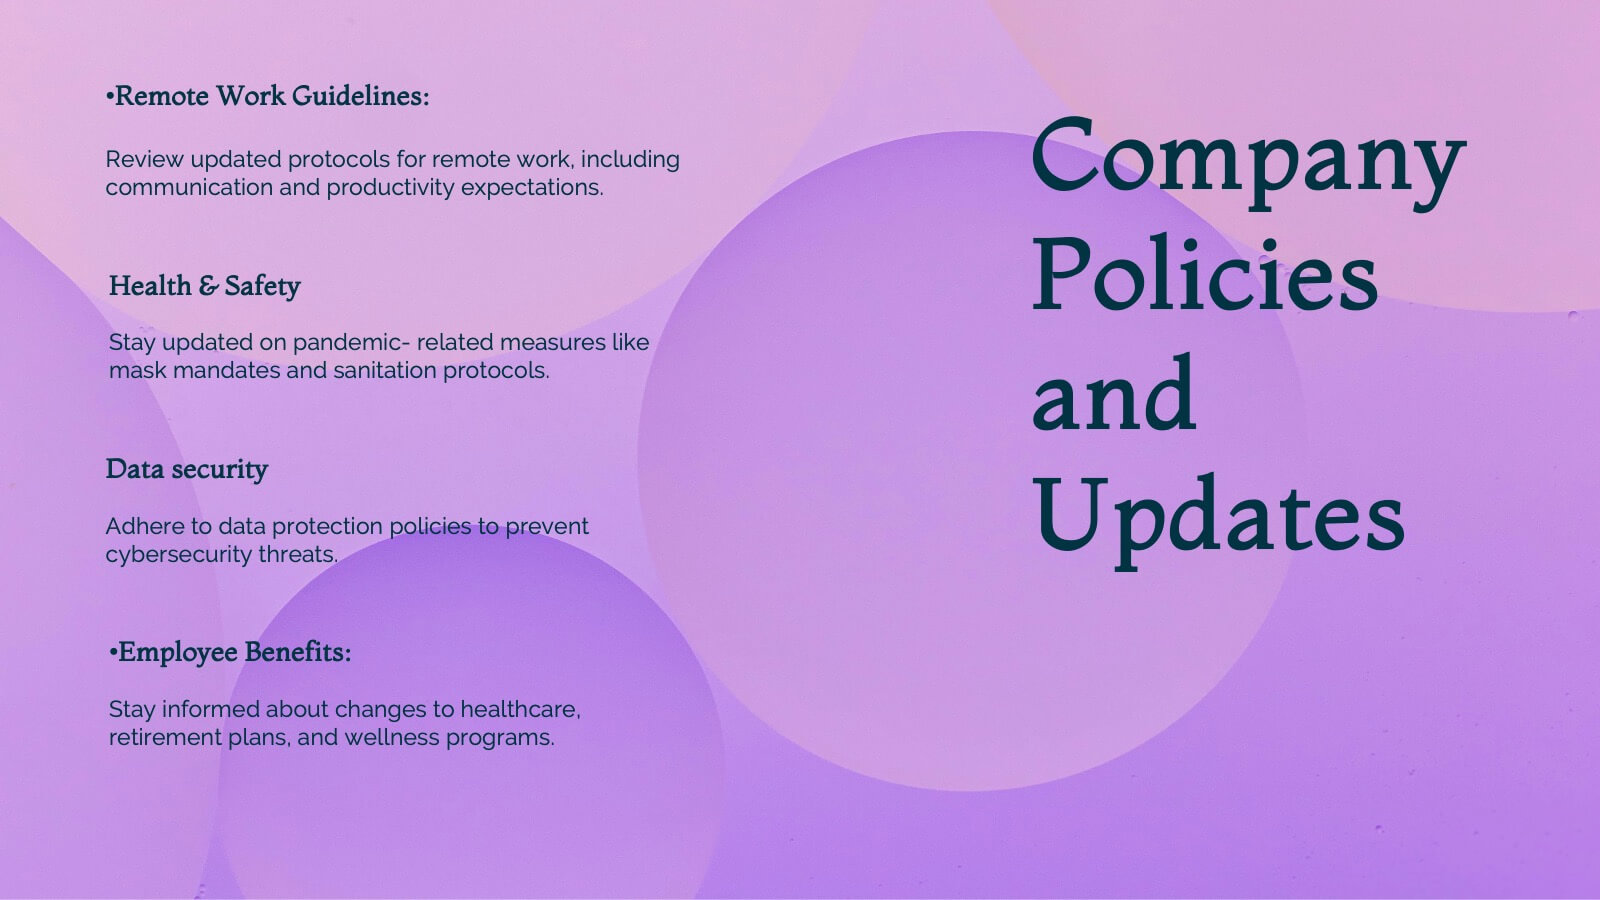
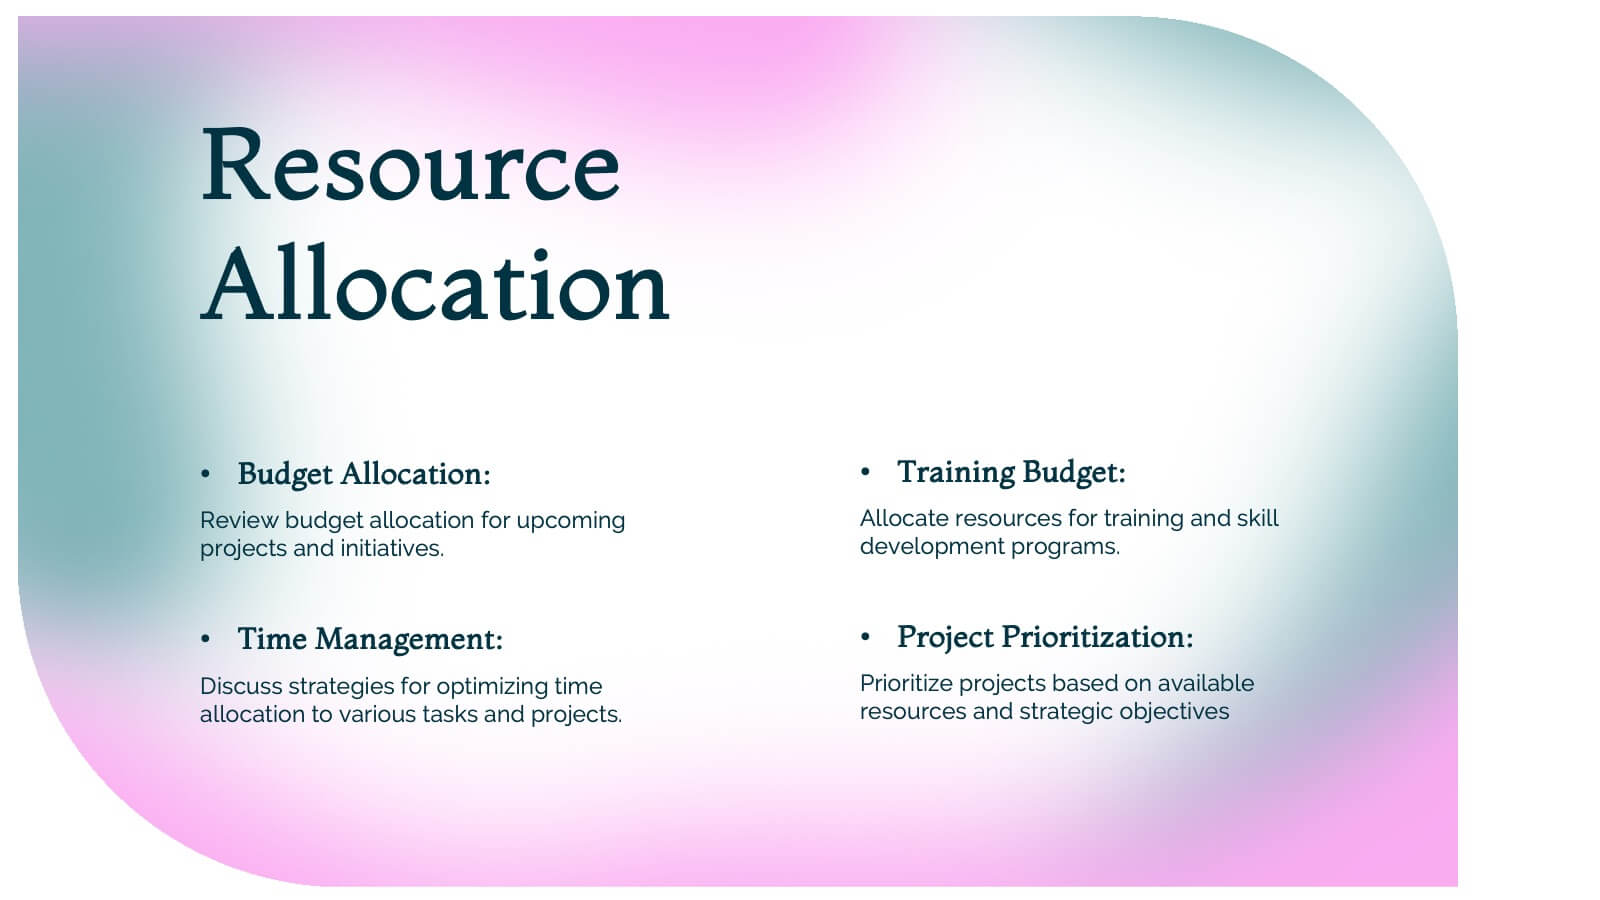
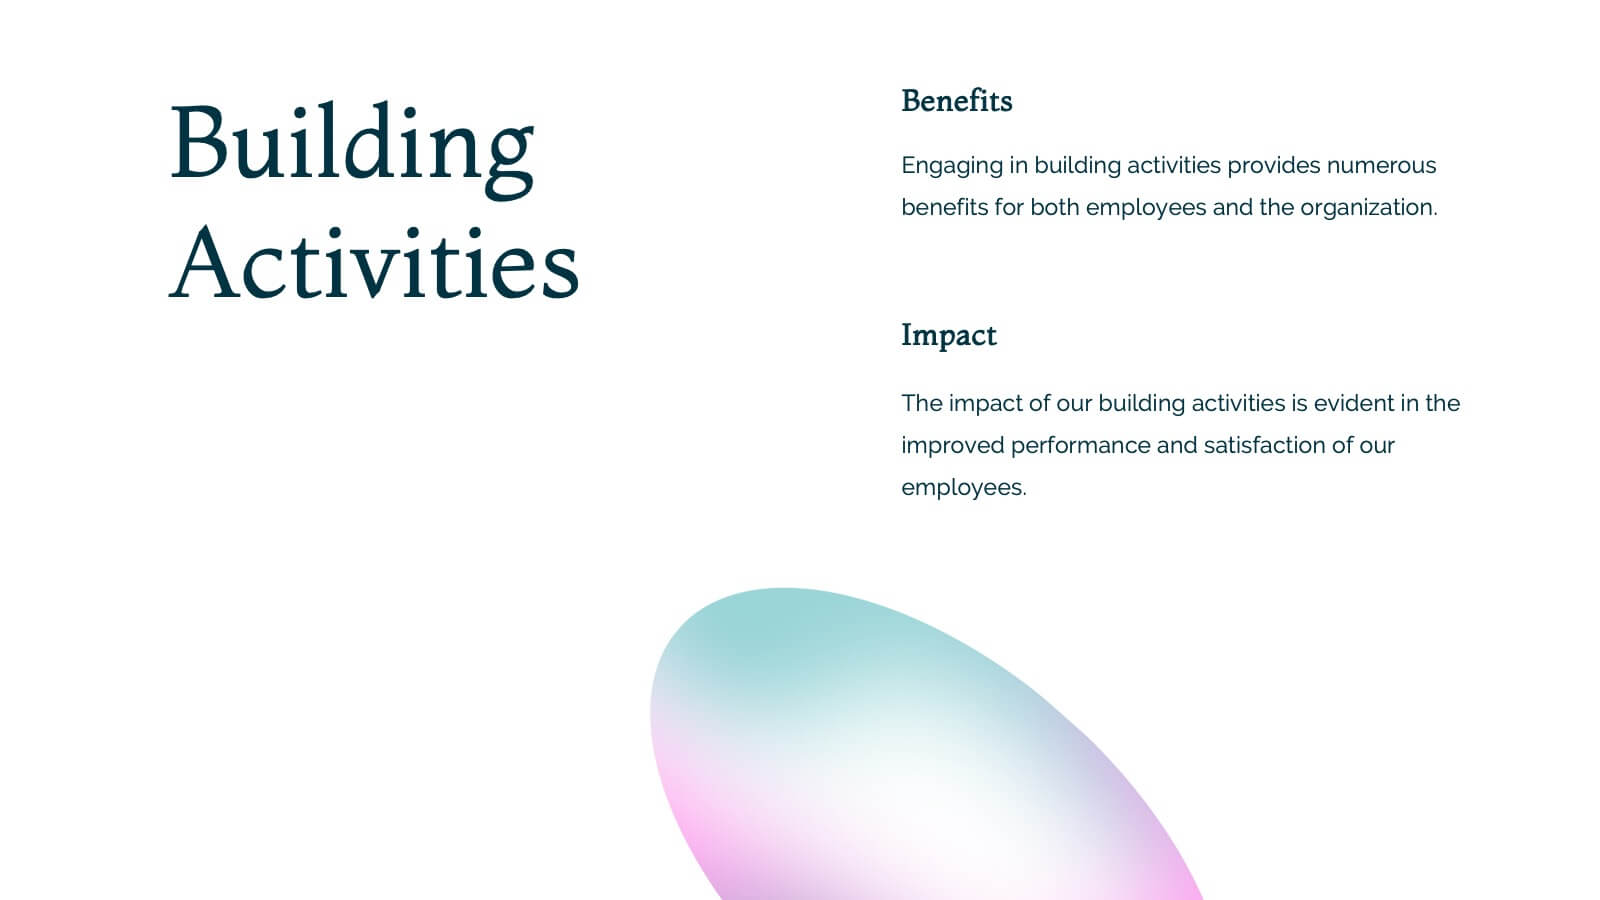
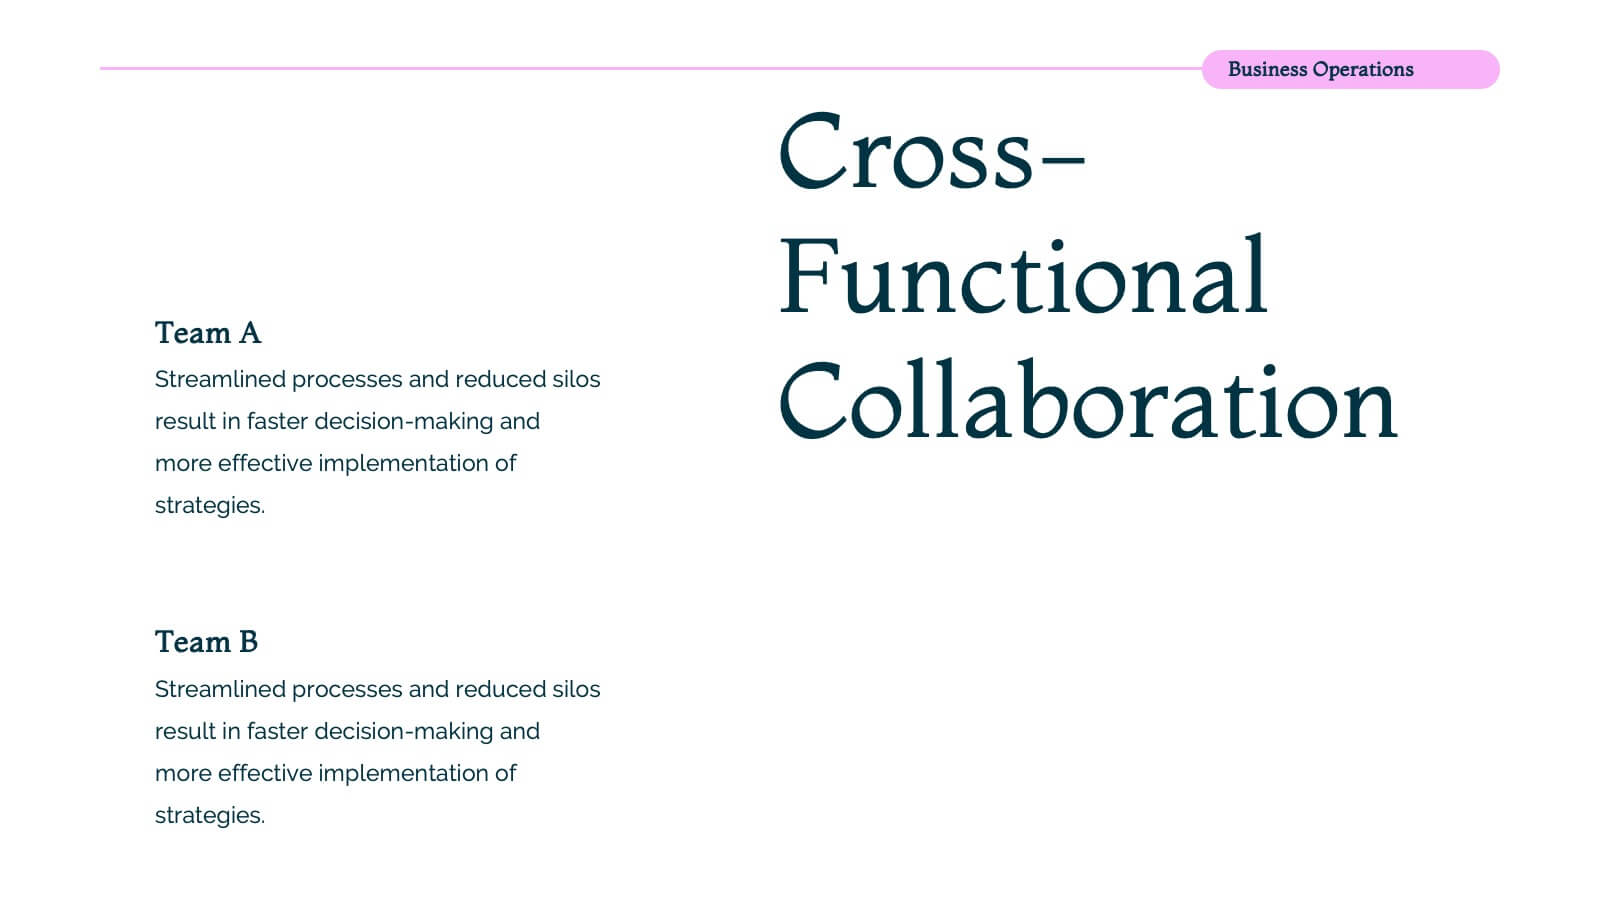
Nova Business Operations Plan Presentation
Create a polished business operations plan with this modern and organized template! It covers everything from team updates and project overviews to resource allocation and collaboration opportunities. Perfect for structuring departmental goals, process improvements, and employee recognition. Compatible with PowerPoint, Keynote, and Google Slides for a seamless, professional presentation.


6 slides
Customers Market Segmentation Strategy Presentation
Unlock the power of understanding your audience with a visually structured layout that turns complex data into clear, actionable insights. This presentation helps businesses define, target, and engage customer groups effectively. Fully editable and compatible with PowerPoint, Keynote, and Google Slides for seamless customization and professional presentation delivery.


6 slides
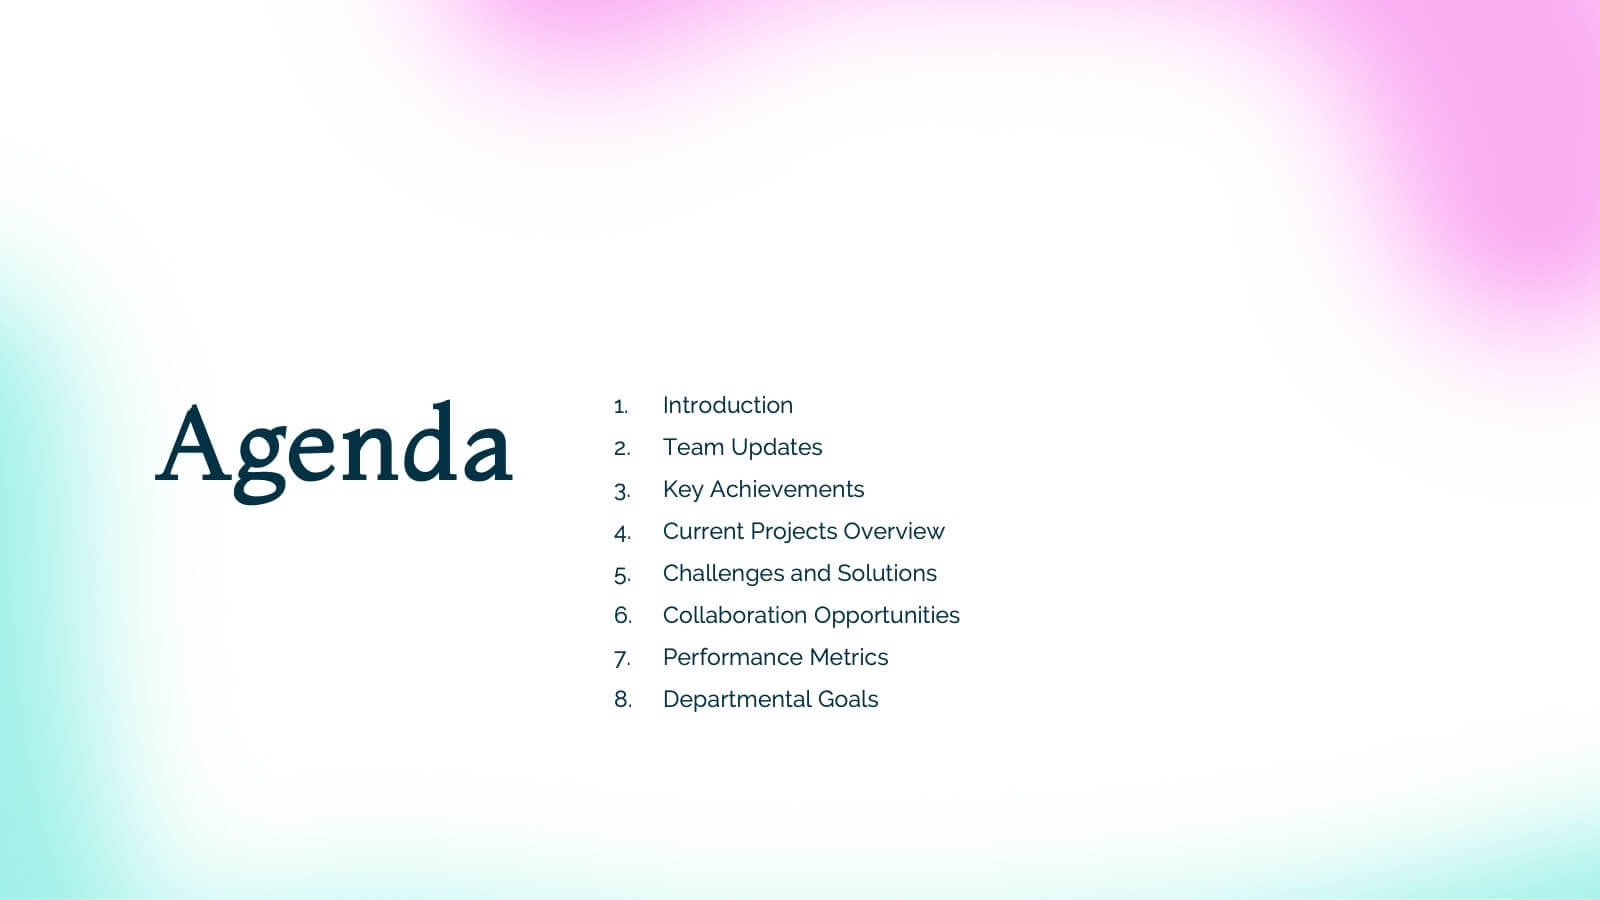
Agenda Network Infographic
Elevate your networking events with our sophisticated collection of agenda slide templates. These slides are crafted to structure and present the flow of activities at networking events, making them essential for coordinators who aim to foster professional connections among attendees. Each template is designed with clarity and style, featuring clean lines and modern graphics to outline key segments of your event, such as welcome remarks, networking sessions, panel discussions, and closing statements. The thoughtful layout includes designated spaces for time slots, session titles, and speaker details, ensuring that participants can easily follow the event's progression and plan their participation accordingly. These slides are fully customizable, allowing you to match the visual design with your event’s theme or corporate branding. The adaptable format makes it simple to insert or remove sections based on the specific needs of your event. Ideal for business conferences, industry meet-ups, or any professional gathering, these agenda slides help you manage and execute a seamless networking experience.


5 slides
Real Estate Listings and Growth Map Presentation
Showcase listings, deals, and area growth with this Real Estate Listings and Growth Map Presentation. Each house graphic represents a stage or category—ideal for highlighting regions, property types, or development phases. Use icons and color changes to lead attention across the timeline. Fully editable and works in PowerPoint, Keynote, Canva, and Google Slides.


6 slides
Execution Phase and Follow-up Steps Presentation
Make your process crystal clear with the Execution Phase and Follow-up Steps Presentation. Featuring a dynamic six-step linked chain design, this template is ideal for showcasing sequential workflows, project lifecycles, or task dependencies. Each step is color-coded with icons to enhance clarity and engagement. Fully customizable in PowerPoint, Keynote, and Google Slides.


6 slides
Oceania Language Map Infographic
Oceania encompasses the entirety of the Pacific Ocean and its islands. Embark on an enlightening journey through the linguistic tapestry of Oceania with our captivating Oceania Language Map Infographic. This template is your guide to understanding the rich array of languages spoken across this diverse and cultural region. Compatible with Powerpoint, Keynote, and Google Slides. This allows you to incorporate a vibrant and culturally symbolic color palette reflecting the diversity of Oceania. Utilize icons representing different languages for a visually appealing representation.


20 slides
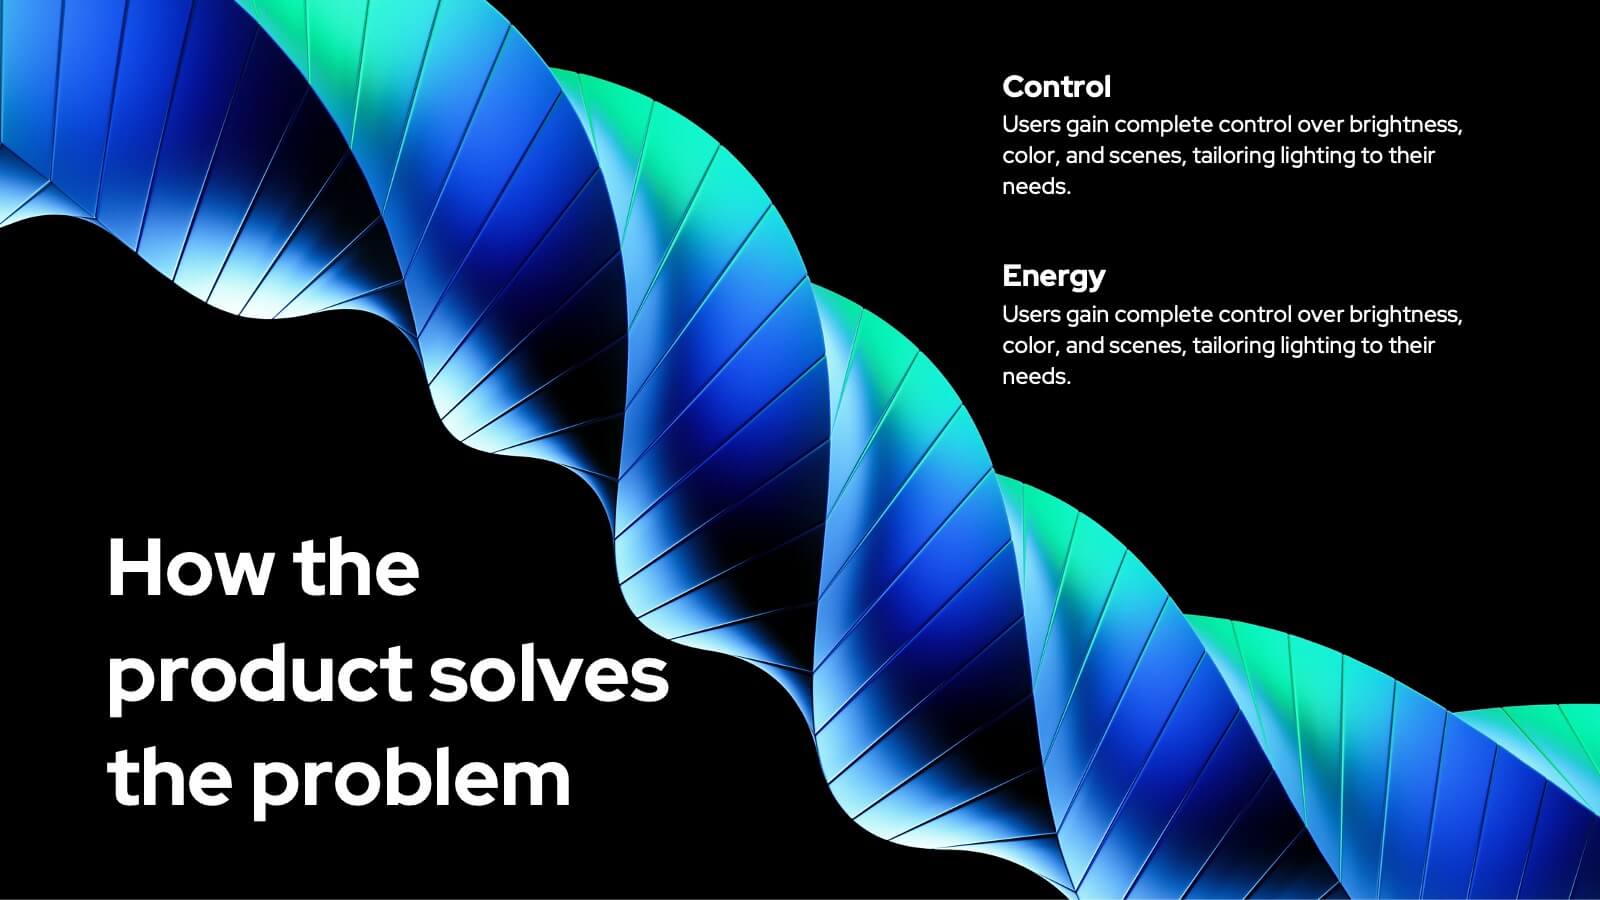
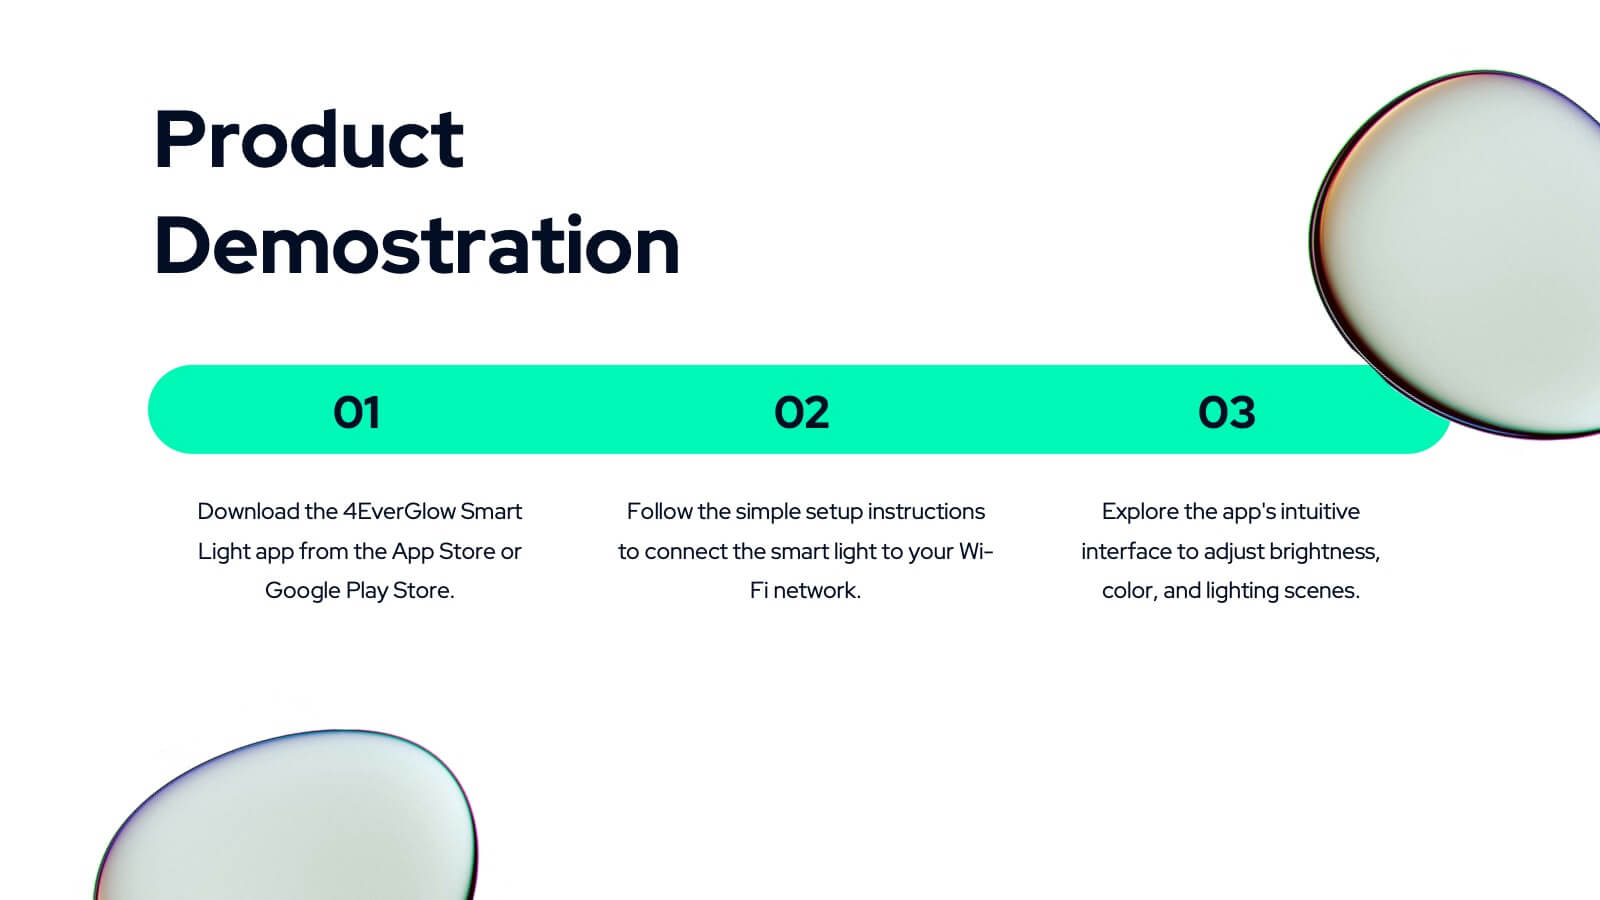
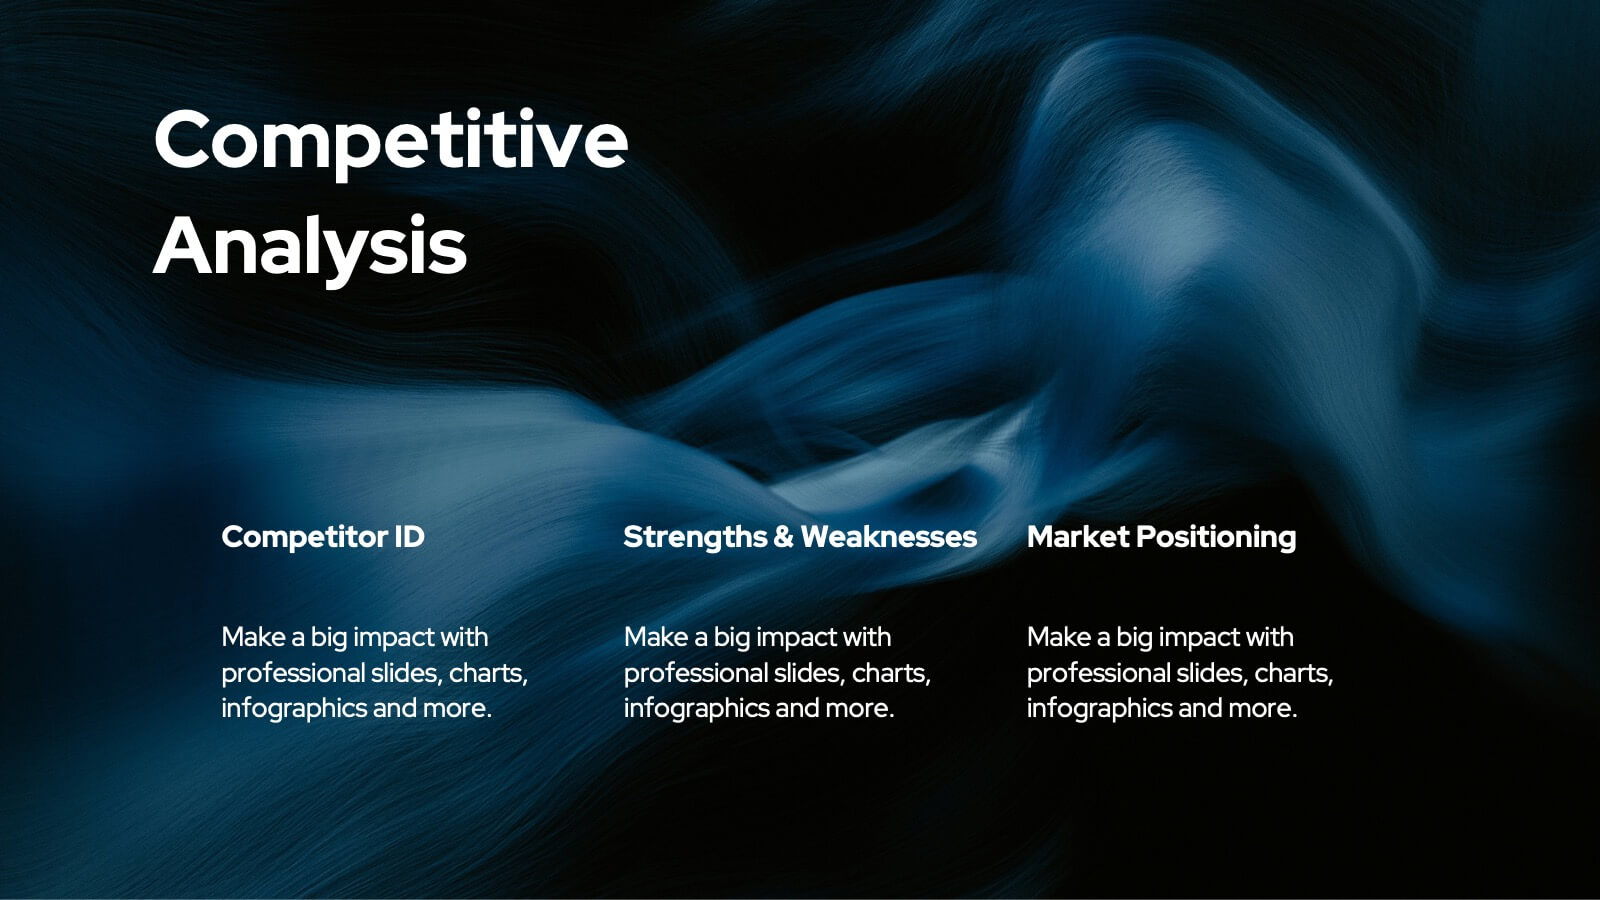
Oracle Startup Strategy Presentation
Launch your startup strategy with this sleek template! Perfect for detailing your mission, vision, business model, and market analysis. Ideal for entrepreneurs aiming to impress investors and stakeholders. Compatible with PowerPoint, Keynote, and Google Slides, this template ensures your startup strategy is professional, clear, and compelling. Secure your path to success!


8 slides
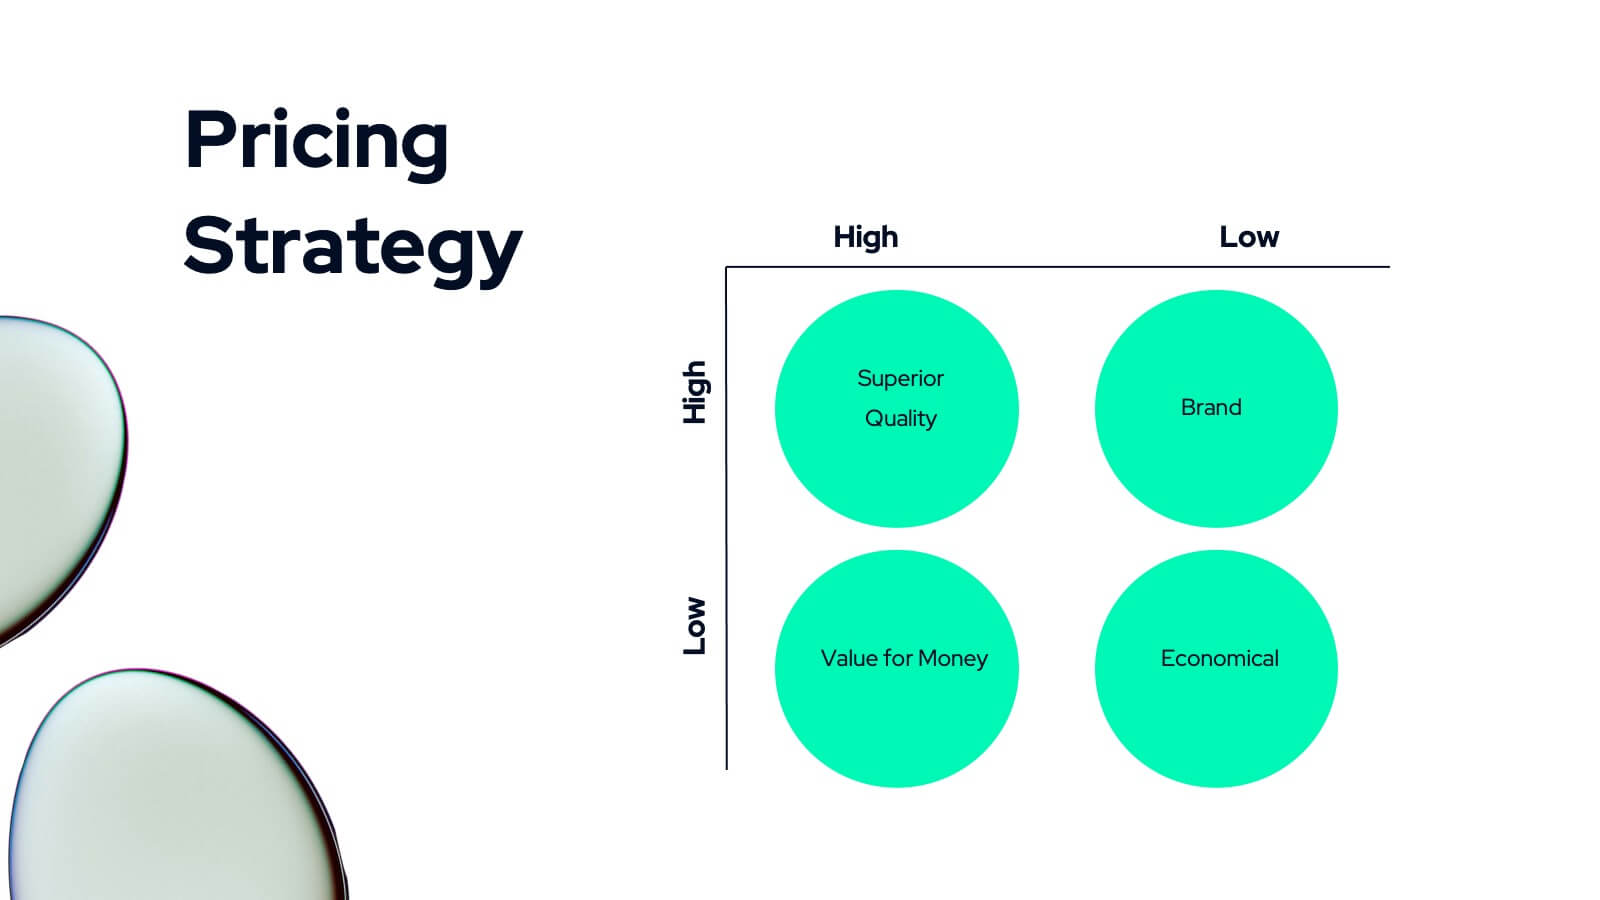
Modern Pricing Table Design Presentation
Turn heads and highlight value with this sleek, modern layout that makes pricing clear and compelling. Perfect for showcasing service tiers or subscription plans, this clean design uses bold icons and structured comparisons to guide decisions. Fully compatible with PowerPoint, Keynote, and Google Slides for easy customization and professional pricing presentations.